Pathways to Serious Offending 2008-01

Table of contents
- Executive Summary
- Introduction
- Developmental trajectories
- Limitations within developmental criminology
- The predictability of criminal behaviour and the prospect of efficiency
- Purpose of the present research
- Method
- Participants
- Procedure
- Measures
- Outcome criterion
- Adjustments for time-at-risk
- Timing of assessment
- Juvenile predictors
- Data management and related issues
- Analytic strategy
- Results
- Temporal patterns of growth and offending trajectory groups
- Risk factors associated with offending trajectories
- Description of the optimal conditional two-group growth mixture solution
- Prediction to provincial and federal custodial admissions
- Discussion
- Temporal patterns of offending behaviour
- Offending trajectory groups
- Risk factors associated with offending trajectories
- Prediction to provincial and federal custodial admissions
- Policy and practical implications
- Limitations and directions for future research
- References
- Appendix A
- Appendix B
Annie K. Yessine and James Bonta
Acknowledgements
We would like to extend our appreciation to Dr. Kenneth A. Bollen and Dr. Linda K. Muthén for having provided us with their much needed analytical recommendations and statistical advice throughout the completion of this study. A special thank also goes to Karl Hanson for his valuable comments on an earlier version of this report. Finally, we wish to acknowledge the contributions of Jennifer Cooney, Louise Grace, Terri-Lynne Scott, and Simon Young for their assistance with the coding of the recidivism data.
Executive Summary
Charting developmental trajectories and studying their causes are amongst the most fundamental and empirically important research topics in criminology (Nagin & Tremblay, 2005). The purpose of this study was to contribute to the growing body of criminological research on the developmental course of crime and expand its scope in various ways. Using latent growth curve (mixture) modeling, we sought to identify the distinctive criminal pathways, and specify the early characteristics that predict future offending trajectories, of a Canadian sample comprised of 514 male and female adjudicated juveniles followed into middle adulthood.
The results revealed the existence of two main types of offenders who differed in composition, offending activity, and desistance throughout their life-course. These two offending trajectories corresponded closely to Loeber and Stouthamer-Loeber's (1996), Moffitt's (1993) and Patterson et al.'s (1992) proposed categories of early onset persisters and late onset desisters. One group, comprised of approximately 12% of the offenders showed a chronic high level of offending behaviour throughout their life-course. The offending frequency/severity of this group increased steadily from adolescence onwards. The remainder of the sample was characterized by relatively rare/less serious involvement in criminal behaviour over the years. Their offending pattern remained fairly stable, although it tended to show a slight decline in frequency/severity from age 26 onwards.
The offenders classified in the chronic high trajectory group disproportionally engaged in a wider variety of offences as well as more of the violent crimes, compared to the stable low offenders. Moreover, our results indicated that the risk for being admitted into either a provincial or a federal prison was markedly greater for offenders assigned to the chronic high group, compared to those best represented as stable low offenders. These findings suggest that the two offending trajectory groups generated in our study have some practical value in the prediction of long-term criminal outcomes.
Of the criminogenic risk/needs domains studied, only associates reliably predicted group membership after controlling for other competing risk factors. Not surprisingly, the chronic high trajectory group comprised more offenders who had negative and unconstructive ties with their peers than the stable low group. Substance use also distinguished offenders in the chronic high and stable low offending trajectory groups in that a greater proportion of young probationers who had substance use problems were identified as chronic high offenders, compared to those who did not evidence difficulty in this area. The statistically significant associations between this risk factor and group membership, however, disappeared when considered in conjunction with the youths' patterns of association.
Taken as a whole, these findings have important policy and practical implications. Perhaps most noteworthy is the notion that desistance is not equally inevitable for all offenders as a small proportion of offenders do not appear to desist from criminal activity (at least when followed into middle adulthood). For these offenders deliberate and effective intervention from the criminal justice system is required to alter their criminal trajectory. Based on the results from this study, prevention and intervention programs should be designed to focus on targeting and changing both negative peer influence and substance use, as these two criminogenic risk/need factors place adolescents at risk of embarking on a criminal career.
The current findings further suggest the need for policy-makers and practitioners to focus their intervention strategies on offenders who, over the course of a number of months following a first encounter with the criminal justice system, exhibit behavioural patterns indicative of frequent and/or increasingly serious forms of deviant and criminal activity. By doing so, it then becomes possible to identify juvenile offenders before they become chronic offenders, to manage their behaviour in an efficient and timely fashion so as to reduce their likelihood of eventually becoming involved with provincial and federal custodial corrections, and as such to allocate the limited available resources profitably.
Introduction
Numerous studies that examine trends in rates of criminality have indicated that offending escalates during early adolescence and peaks sharply in late adolescence before declining precipitously in young adulthood (e.g., Blumstein & Cohen, 1987; Elliott, 1994; Farrington, 1986; Farrington, Lambert & West, 1998; Loeber, Wei, Stouthamer-Loeber, Huizinga & Thornberry, 1999). This overall pattern between age and crime appears relatively universal as it has been observed among both males and females, for various types of offences, in a number of different nations, and across historical periods (Hirschi & Gottfredson, 1983). The life phases between late adolescence and young adulthood consequently are revealed as the most dynamic periods for criminal activity.
Although the shape of the curve describing criminal behaviour as a function of age is indisputable, theorists and researchers still voice disagreement over how best to explain the curve. Whereas some scholars contend that the adolescent peak in offending most likely represents a change in incidence, others argue that it is predominantly due to a change in prevalence. Does the age-crime curve mirror a transitory increment in the actual number of criminal acts committed by a small and constant sub-group of adolescents, or is the number of individuals willing to offend during adolescence simply greater? At the source of the debate is the recognition that there may be meaningful heterogeneity in offending trajectories with different causal mechanisms accounting for different stages of a delinquent career.
Empirical evidence on the age-crime curve seems to indicate that the observed rise in offending during adolescence hides distinctive developmental pathways within the offending population. Findings from various studies have suggested that, for most, adolescence reflects a period of temporary increase in the actual number of individuals involved in criminal activity (Farrington, 1983; Wolfgang, Thornberry & Figlio, 1987). However, there is a smaller proportion of individuals who commit a large number of criminal acts and continue to do so beyond adolescence, embarking on a criminal career (Blumstein, Cohen & Farrington, 1988; Blumstein, Cohen, Roth & Visher, 1986).
Theorists and researchers interested in accounting for the different patterns of offending (i.e., desisting or persisting in crime) work from the perspective of developmental criminology. Developmental criminology is specifically concerned with the issues of within-individual stability and change in criminal activity over time (Loeber & LeBlanc, 1990). In essence, this sub-discipline of criminology suggests the importance of distinguishing the individual's developmental course of offending within the offender population. There is a focus on explaining the factors that contribute to the beginnings of criminal behaviour and are associated with a particular course of criminal involvement over different periods of an individual's life. The interest in such a conceptual and empirical framework more precisely resides in studying the nature and pattern of criminality, from onset to desistance, on a variety of dimensions (e.g., rate, type, variety, timing, severity). According to developmental criminologists, there are distinctive groups within the offender population that share distinctive etiologies and follow distinctive trajectories of offending.
Developmental trajectories
Recent years have witnessed the advancement of a number of developmental taxonomic systems to account for within-individual continuity and change in criminal behaviour over time. Amongst the most influential taxonomies are those of Loeber and Stouthamer-Loeber (1996), Moffitt (1993) and Patterson, Reid and Dishion (1992). Despite some slight variation in emphasis, all outline the existence of two primary hypothetical categories of offenders who differ in composition, offending activity, and desistance throughout the life-course. They are: (a) the early onset persisters; and (b) the late onset desisters. Whereas early onset persisters are few, relatively permanent, and pathological, late onset desisters are common, relatively transient, and near normative (Moffitt, Caspi, Harrington & Milne, 2002).
Loeber and Stouthamer-Loeber's (1996), Moffitt's (1993) and Patterson et al.'s (1992) theories maintain that the antisocial behaviour of the early onset persisters originates in abnormal neurodevelopmental processes as indicated by minor birth defects, brain damage, central nervous system dysfunction and cognitive deficits. For this group of offenders, criminal conduct begins in childhood with less serious forms of offending, but continues to gradually worsen throughout the life-course as the individuals are in constant interactions with various high-risk environmental factors, such as inadequate parenting, disrupted family bonds and poverty. Furthermore, offenders within that group are generally not expected to desist from offending across their adult life-course. Although they represent a small proportion of an age cohort, early onset persisters are thought to be responsible for the vast majority of all offences, and the most serious forms of offending. This proposition has been confirmed by various studies (e.g., Jeglum-Bartusch, Lynam, Moffitt & Sylva, 1997; Moffitt, Caspi, Dickson, Silva & Stanton, 1996).
In contrast, the second group of offenders, the late onset desisters, are hypothesized to begin offending later in life (i.e., during adolescence), and to desist in early adulthood. The antisocial behaviour of this latter group is not believed to originate from neuropsychological impairments, but rather from the influence of various social processes (e.g., maturity gap, social mimicry, reinforcement contingencies for rule-breaking behaviour). These offenders represent the majority of an age cohort whose acts may be characterized as “rebellious” and less serious forms of offences.
Developmental criminologists further postulate that the developmental pathways of early onset persisters and late onset desisters have distinct etiologies. Predictors of antisocial behaviour for the former group include health problems, difficult temperament, cognitive deficits, antisocial personality traits (e.g., callousness, alienation), mental disorders, disrupted family bonds, inadequate parenting or child-rearing practices, parent and sibling deviance, lack of social and academic skills, and low socio-economic status (e.g., Moffitt, 1993; Moffitt et al., 2002; Patterson, 1982). In contrast, the strongest predictors of offending for the late onset desister group do not relate to indicators of individual differences that emerge early in life and that are further exacerbated by a disadvantaged social environment. Instead, they relate to experiences that occur alongside puberty, during the relatively “roleless” years between biological maturation and access to mature privileges and responsibilities (Moffitt et al., 2002). These include peer delinquency, self-conscious attitudes and values towards adolescence and adulthood (e.g., desire for autonomy), cultural and historical context influencing adolescence (e.g., reinforcement contingencies of antisocial behaviour), as well as age (e.g., Moffitt, 1993).
Empirical evidence on these distinctive offending pathways, and on the processes responsible for their emergence and continuity aboundsNote 1 (e.g., Jeglum-Bartusch et al., 1997; Moffitt, Lynam & Silva, 1994). Most notably, the prediction that early onset persisters emerge from early neurodevelopmental factors (e.g., Piquero, 2001) and are further aggravated by family-adversity factors has been repeatedly supported (e.g., af Klinteberg, 2002; Patterson, DeGarmo & Knutson, 2000; Rutter, Giller & Hagell, 1998). Findings from a recent meta-analytic study tracked the impact of a variety of early childhood and adolescent experiences on later adult criminal justice involvement. The study indicated that a variety of behavioural (e.g., aggression, attentional problems, attention-seeking), and emotional (e.g., withdrawal, anxiety, social alienation) concerns, apparent in the child's life, together with inadequate parenting strategies (e.g., coerciveness, lack of supervision) and other family variables (e.g., family/interparental conflict and stressors) predicted who, as adults, became involved in criminal justice systems (Leschied, Nowicki, Rodger & Chiodo, 2006). Finally, although it has been the subject of less attention, the hypothesis that late onset desisters' antisocial behaviour has its origins in social processes and is influenced by factors that relate to the maturity gap and by social mimicry of antisocial models has also received considerable empirical confirmation (e.g., Moffitt & Caspi, 2001; Piquero & Brezina, 2001).
A great deal of past theoretical and empirical efforts have focused on understanding and predicting the naturally occurring offending trajectories and criminal careers of youth, initially identified as non-offenders. A different, yet closely related, body of literature has dealt with the identification and prediction of developmental pathways of adjudicated youths (i.e., known juvenile offenders). Despite some relatively minor methodological dissimilarities (e.g., differences in power and offending rate), it should be noted that the two lines of investigation have generated consistent contentions and yielded comparable findings.
For instance, a 20-year follow-up investigation of a large sample of juvenile offenders in California has demonstrated that cognitive ability, early behaviour problems, and early age at first arrest, amongst other risk factors, were significant predictors of chronic criminal offending in adulthood (Ge, Donnellan & Wenk, 2001). Similarly Blokland, Nagin and Nieuwbeerta (2005) have found offending trajectory groups within a Dutch conviction sample to be consistent with those proposed by Loeber and Stouthamer-Loeber's (1996), Moffitt's (1993) and Patterson et al.'s (1992) theories. Using this same sample of Dutch offenders, Blokland and Nieuwbeerta (2005) further demonstrated that within-individual changes in crime-inhibiting life circumstances had a differential effect on criminal behaviour across offending trajectory groups. As predicted by developmental taxonomists, getting married and/or becoming a parent did not significantly decrease the conviction rate of persistent offenders, unlike what was found in the desister groups.
Limitations within developmental criminology
Notwithstanding the potential theoretical, empirical and practical contributions that the developmental perspective has to offer to the field of criminology and criminal psychology, knowledge is still weak on certain important issues. We have noted that there exists a vast amount of empirical studies confirming Loeber and Stouthamer-Loeber's (1996), Moffitt's (1993) and Patterson et al.'s (1992) theories. Still, mixed evidence for the taxonomies can be found in the literature.
Perhaps most noteworthy is that the actual number and type of distinct offending trajectories is still somewhat unsettled. Although the original theoretical taxonomies focus on the presence of two fundamental prototypes, research testing for the existence of an early onset persister group and a late onset desister group has since indicated that a number of offenders did not fit the classification systems. This suggests that the dual taxonomic system overlooks the presence of other, logically possible offender trajectory types.
The majority of the studies have revealed a number of distinct trajectory groups typically ranging from three to five. Notably, a third type of offender, characterized by a pattern of persistent, but low level offending throughout a certain period of their life-course (e.g., childhood to adolescence, adolescence to adulthood), seems to replicate across longitudinal studies (e.g., D'Unger, Land, McCall & Nagin, 1998; Fergusson et al., 2000; Laub, Nagin & Sampson, 1998; Moffitt et al., 2002; Nagin, Farrington & Moffitt, 1995; Sampson & Laub, 2003). Similarly, the finding that more than one group whose offending behaviour pattern resembles that of the proposed late onset desister and/or early onset persister pathways has repeatedly emerged (e.g., Day, Beve, Duschene, Rosenthal, Sun & Theodor, 2007; D'Unger, Land & McCall, 2002; Land & Nagin, 1996; Loeber, Farrington, Stouthamer-Loeber, Moffitt & Caspi, 1998; Nagin & Land, 1993; White, Bates & Buyske, 2001; Wiesner & Silbereisen, 2003).
In addition, we want to highlight that the existing literature is largely comprised of studies restricted to males. The original statement of Moffitt's (1993) developmental taxonomy asserted that the theory described the behaviour of females as well as that of males, although fewer females would be thought to become delinquent overall, and within delinquents the percentage who are early onset persisters would be higher among males than among females. The lack of research examining the offending pathways of females largely originates from pragmatic circumstances. Ideally, to adequately study the patterns of female offending within a developmental taxonomic framework, the research requires a large representative sample that includes both early onset persister and late onset desister females who would be followed longitudinally from childhood through adolescence and up to adulthood with repeated measures of antisocial behaviour. Longitudinal samples with a sizeable number of female offenders are, however, scarce.
Another methodological shortcoming associated with the literature concerns the lack of consideration for incarceration time. Not controlling for incarceration time can have serious consequences when estimating offending trajectories (Eggleston, Laub & Sampson, 2004; Piquero, Blumstein, Brame, Haapanen, Mulvey & Nagin, 2001). This includes for instance, the underestimation of offending frequency or severity of chronic offenders.
Similarly, in the majority of previous longitudinal studies, the length of the follow-up period is problematic. That is, few longitudinal studies on offending trajectories have extended their findings into middle to late adulthood (e.g., Day et al., 2007; Farrington, Coid, Harnett, Jolliffe, Soteriou, Turner & West, 2006; Laub & Sampson, 2003). As noted by Loeber & Stouthamer-Loeber (1998), it is easy to oversimplify the conceptualization of stability and change of individual variation in criminal behaviour over time. Evidently, the duration of criminal careers or the trajectories of offending depends on duration of the follow-up. It cannot be assumed, for instance, that juvenile offenders who do not engage in criminal activity for a number of years have actually desisted from criminality in later periods of their adult lives (e.g., they may be experiencing intermittency in offending or they may be incarcerated).
Moreover, it is worth noting that many of the findings obtained in the original study conducted by Moffitt and her colleagues (i.e., Dunedin Multidisciplinary Health and Development Study) to test their proposed theoretical taxonomic system, have since been replicated with other samples in several different countries including the United States, Finland, Great Britain, New Zealand, the Netherlands and Sweden. Despite the body of research that has accumulated over the years, to date there have been only two longitudinal studies that examined the offending trajectories of Canadian offenders (Day et al., 2007; LeBlanc, 1996).
Potential contributions to the existing literature aside, there are some practical issues of particular interest when studying the offending trajectories of Canadian offenders. In Canada, responsibility for corrections is divided between the federal and provincial/territorial governments. Offenders serving sentences of two years or longer (including life sentences) are dealt with under federal jurisdiction. The provinces/territories are responsible for offenders sentenced to terms of less than two years. This is an important distinction as relatively few crimes result in sentences to provincial custody, and even fewer result in admissions to federal penitentiaries. Out of an estimated number of about 300,000 adult court convictions in 2004-05, slightly more than a quarter (26.7% or 80,000) resulted in sentences to provincial/territorial custody. Less than 2% of those offenders (approximately 4,500) were admitted to federal jurisdiction (Public Safety and Emergency Preparedness Canada, 2006). In 2005-06, the median age of the federal population upon admission was 32 years. Evidently, our ability to identify those offenders who are at high risk to enter federal penitentiaries at an early stage in their criminal careers is valuable to criminal justice professionals and policy-makers alike.
The predictability of criminal behaviour and the prospect of efficiency
We have seen that developmental theorists and researchers argue that the processes responsible for offending behaviour may be different for different types of delinquents. We have also seen that the processes may operate at different developmental stages in the natural history of antisocial behaviour. Regardless of the particular paradigm, all agree on the importance of identifying juvenile delinquents most at risk of continued offending, understanding the factors contributing to persistent offending, and concentrating intervention resources on the chronic and serious offenders. When identifying high-risk, chronic offenders (and the characteristics that differentiate them from lower risk, relatively transient offenders) for the purpose of focusing resources on them, it is assumed that targeting and/or intervening with all offenders is neither feasible nor desirable. The efficiency of a criminal justice system in reducing rates of criminality, and reducing the ensuing social and human costs typically associated with crime and other antisocial acts, can thus be gauged by its ability to successfully identify the small number of offenders who commit a high proportion of serious offences. Only then can intervention efforts and other resources be invested wisely and distributed profitably.
In this regard, there are two principal hazards that criminal justice systems face. There is the possibility of selectively focusing on offenders who may not be demonstrably more dangerous or at risk to reoffend than other offenders from the larger population from which they are drawn. Yet again, there are the human costs associated with incorrectly classifying serious, chronic offenders as low risk for reoffending. The appropriate disposition of cases by criminal justice officials is therefore crucial for the proper functioning of any correctional or criminal justice system, especially when dealing with a relatively small group of high-risk offenders who commit a disproportionate share of crime. Underlying this responsibility is the assessment of risk, which raises one fundamental question: Can we predict well enough to make a difference on recidivism? In other words, is the degree of predictive accuracy currently achieved when assessing risk to reoffend a sufficient basis for treating offenders differently?
The view presently shared by most theorists and researchers is that both general and violent reoffending can be effectively predicted among typical criminal populations, and more particularly among groups of violent and sexual offenders (e.g., Andrews & Bonta, 2006; Campbell, French & Gendreau, 2007; Gendreau, Little & Goggin, 1996; Glover, Nicholson, Hemmati, Bernfeld & Quinsey, 2002; Hanson & Morton-Bourgon, 2007; Rice & Harris 1997; Smith & Aloisi, 1999). The degree of success in prediction, however, remains contingent upon the methods used by criminal justice professionals to assess offender risk level (i.e., clinical vs. actuarial)Note 2. Most would argue that actuarial assessments of offender risk are superior to clinical, unstructured prediction procedures (Bonta, 2002; Grove & Meehl, 1996; Grove, Zald, Lebow, Snitz & Nelson, 2000; Hanson & Morton-Bourgon, 2007)Note 3. This paper is based on the contention that a theoretical perspective and scientific methods that try to understand and predict individual variation in criminal conduct in terms of offending trajectories or criminal careers can contribute to the development of improved, and the refinement of existing, actuarial risk assessment instruments.
Purpose of the present research
This study used a sample of male and female Canadian juvenile probationers followed into middle adulthood to explore the existence of distinctive criminal pathways and identify the early characteristics that predict the offending trajectories. This was accomplished within a structural equation (growth mixture) modeling framework. Findings from this research can contribute to the ultimate goal of correctional or criminal justice systems to reduce the human and social costs associated with crime and its processing. Understanding the personal and social variables linked to serious and chronic offending will aid with the early identification of problematic individuals, and assist in the development and implementation of effective rehabilitation strategies.
Method
Participants
The sample consists of 514 juveniles from Manitoba, Canada under a probation sentence during the years 1986 to 1991. At this time, young offenders were defined by the Young Offender Act (YOA; 1984) as between the ages of 12 and 17 years. At the time of the conviction for the index offence, the participants (N = 514) ranged in age from 12 to 19 years, with a mean age of 16 years (SD = 1.6)Note 1. Approximately 44% of the sample lived with both of their parents, less than 10% with one parent, one third with an adult who was not a parent, and 14% had been placed in either a foster or group home. As would be anticipated when dealing with an offender population, the sample was not gender-balanced. Eighty-five percent (85.4%; n = 438) of the juvenile probationers were male and only 15% (14.6%; n = 75) were female. Furthermore, slightly more than half of the participants were Aboriginal (55.4%; n = 285). The overrepresentation of Aboriginal offenders was somewhat expected given that the sample originated from the province of Manitoba.
Based on their Primary Risk Assessment – Version 1 (PRA – V1; Bonta, Parkinson, Pang, Barkwell & Wallace-Capretta, 1994) scores upon admission to supervision, 19.8% (n = 102) of the juvenile offenders were assigned to the low risk-needs category, 54.3% (n = 279) to medium risk-needs, and 25.9% (n = 133) to high risk-needs (the mean PRA – V1 risk score for the sample was 7.5 [SD = 3.4] with scores ranging from 0 to 18). The majority of the juvenile probationers were first-time offenders. Only 13.6% (n = 70) had one or more prior convictions with non-violent incidents accounting for 84.3% (n = 59) of the cases. Furthermore, only 3.9% (n = 23) of the juvenile probationers had previously served time in an institutional setting (e.g., prison, open custody, closed custody) prior to the index offence conviction.
Out of the 506 offenders for whom details on the most serious type of offence at index were available, the data indicated that the sample was mostly comprised of non-violent offenders. Specifically, approximately three quarters (76.5%; n = 393) of the juvenile offenders were convicted of a non-violent index offence, whereas violent person offences represented 21.3% and violent sexual offences a mere 2.2% of the probation sample. With regards to the dispositions resulting from those index offence convictions, 11.3% (n = 58) of the overall sample (N = 514) received some form of custodial sentence along with their term of probation (five additional offenders were sentenced to time served). To be more precise, 15 offenders were incarcerated in an adult facility, 14 others served time in a closed custody setting, and 29 young offenders received an open custodial sentence. Sentence lengths for those 58 offenders ranged from 2 to 729 days, with a mean time of 180.6 (SD = 148.5) days.
Procedure
The original sample consisted of 600 youth probation offenders randomly drawn from each year of all cases closed between 1986 and 1991Note 2. To be eligible for inclusion in the present study, offenders had to be less than 20 years of age at the time of the conviction for the index offence. The former rule was adopted to reduce the possibility of data entry errors, and ensure that the study was restricted to juvenile offenders. Four offenders were excluded from the initial sample due to their age (20 years old or older), reducing the sample size to 587 offenders.
It is standard practice for probation officers in Canada to interview offenders upon admission to supervision. The goal of the assessment is to garner information on the offender's personal-social demographic characteristics, including various indicators of criminal history, emotional functioning and personal circumstances. Many of these factors are considered relevant to their criminal activity, and as such can help probation officers to evaluate the risk to reoffend and to identify areas for intervention.
- At the time when the sample was initially selected, the information collected by the probation officers was used to create a comprehensive database encompassing a number of background variables that a review of the literature had previously identified as relevant to understanding and predicting the criminal careers of juvenile offenders. A systematic search on the Offender Management System (OMS) of the Correctional Service of Canada (CSC) was also undertaken to complement missing information from the original database (e.g., date of birth, Finger Print Service identification number). In addition, criminal history records requested from the RCMP's Criminal Records Branch (i.e., Canadian Police Identification Center [CPIC] records) in 1993, were obtained to supplement (and corroborate) information that was not readily available. The criminal history records from the RCMP include the conviction and disposition of sentence for offenders.
At the end of the follow-up period in 2005, updated criminal history records were requested from the RCMP. For approximately one quarter of the sample (25.2% or 149 offenders), the RCMP had no record of criminal activity in its system, even though in many cases, a previous CPIC record was available. The RCMP in many cases advises the contributing agency (e.g., provincial/territorial police) that the information on a particular individual has been purged. However, there is no way of ensuring that the contributing agency has purged the information from its own files and systems. For this reason a request was made to the province of Manitoba to try and locate the criminal history record from its own system, the Offender Profile Manitoba Corrections, on all offenders for whom the RCMP found no evidence of criminal activity. By doing so, we obtained criminal history information on 38 offenders. Six Manitoba criminal history records were, however, discarded for having no entries (e.g., just names), allowing coding the criminal careers of an additional 32 juvenile probationers.
Although offenders for whom we did not have any criminal activity information (i.e., no previous nor updated CPIC record and no provincial record) were excluded, those for whom neither a new CPIC record nor a provincial record could be retrieved, but for whom a previous CPIC record was available were not excluded from the study. These cases (n = 44) were treated as non-recidivist offenders, beyond any convictions revealed by the 1993 CPIC recordNote 4. Using these exclusion criteria, only 73 offenders of the 149 juvenile offenders for whom the RCMP could not retrieve criminal history information were dropped from the study, producing a final sample totalling 514 offendersNote 5.
Measures
Outcome criterion
Developmental patterns of offending were identified from a retrospective examination of the offenders' criminal history records. Two different measures of offending were coded and subsequently served as the dependent variables in the statistical analyses.
Criminal Seriousness Index. The Criminal Seriousness Index (CSI) was developed specifically for the purpose of the present study to assess the seriousness and the frequency of offending patterns. A measure that combines both offence severity and frequency was constructed as both dimensions of criminal behaviour tend to correlate highly (although not perfectly) and to have the capacity to differentiate non-offenders from highly chronic offenders (Tolan & Gorman-Smith, 1998). Generally, frequent offenders are also serious offenders. However, just as an offender could obtain a high frequency score without having committed any of the more serious offences, another offender could receive a high severity score without having been involved in repeated criminal acts.
Theoretically, Moffitt's developmental typology of antisocial behaviour (1993) further postulates that late onset desisters (adolescent-limited offenders) and early onset persisters (life-course-persistent offenders) do not differ with respect to the frequencyof antisocial acts during adolescence. What actually differentiates the two groups during that period is a combination of variety and seriousness of offending behaviours. By combining the two methods of assessment, we were thus able to compensate for each measure's shortcomings. For instance, the inclusion of a seriousness component into a simple frequency assessment of criminal activity provides researchers with the added benefit of being able to distinguish among offenders who have engaged in a moderate number of offences of varying gravity (Potenza, Osgood & Plake, 1992 cited by Chung, Hill, Hawkins, Gilchrist & Nagin, 2002).
Scores on the Criminal Seriousness Index were defined using seven levels. Table 1 summarizes the operational definitions of each level. As we can see, Level 1 denotes no offence committed, Level 2 consists of one non-violent incident, and Level 3 represents more than one non-violent incident. In contrast to the first three levels, Levels 4, 5, 6 and 7 include at least one violent incident, with or without one or more non-violent convictions.
Non-violent offences included all crimes against property (e.g., break and enter, theft), crimes against public morals and decency (e.g., indecent phone call, keeping a bawdy house), narcotics offences (e.g., possession of restricted drug, trafficking), liquor and traffic offences (e.g., driving while disqualified, failure to remain at a scene of an accident), and other offences such as causing a disturbance, failure to appear and probation/parole violation. In contrast, violent offences included all crimes against the person (e.g., armed robbery, assault), violent property offences (e.g., arson, malicious damage), and most sexual offences (e.g., rape, sexual assault). Sexual crimes related to prostitution and pornography (i.e., crimes against public morals and decency) were coded as non-violent.
| Score | Operational Definition |
|---|---|
| 1 | No offence |
| 2 | 1 Non-violent incident |
| 3 | > 1 Non-violent incidents |
| 4 | 1 Violent incident |
| 5 | 1 Violent incident + ≥ 1 non-violent incident(s) |
| 6 | > 1 Violent incidents |
| 7 | > 1 Violent incidents + ≥ 1 non-violent incident(s) |
Canadian Recidivism Index (Gendreau & Leipciger, 1978).The Canadian Recidivism Index is a measure that was developed to address some of the problems and limitations in the measurement of crime and recidivism rates, as well as how the instruments apply to Canadian jurisdictions. Problems in measurement might include the lack of sensitivity to the degree of severity of offending, variations in the conceptual meaning and operational definitions of criminal acts, as well as the practicality of the scoring scheme. The measure represents a Canadian translation of Moberg and Erikson's recidivism outcome index (1972). That index quantifies recidivism on a continuum based upon the United States' legal dispositions of the offender. The rationale behind the development of such a recidivism measure is that the penalties imposed for known offences are related to society's interpretation of severity (Moberg & Erikson, 1972). This scale consists of eight categories, which range from 1 (reincarceration for two years or more) to 8 (no illegal activities). Preliminary analyses that examined rates of recidivism across the prognostic categories among a sample of first-time young adult incarcerates indicated that that the measure was a valid indicator of seriousness in offending (Gendreau & Leipciger, 1978).
To ease interpretation and make the scale more relevant to the present study, a slightly modified version of the original instrument was used. Specifically, the index categories were inverted so that higher scores were reflective of an increased severity in offending behaviour. Furthermore, the category referring to “Absconder/Wanted” was dropped, as insufficient information was available on the offenders' criminal history records to code the items and/or because we did not expect the items to be used frequently. A full description of the Canadian Recidivism Index as used in this study can be found in Table 2.
| Score | Operational Definition |
|---|---|
| 1 | No illegal activities of any kind on any available criminal history record |
| 2 | Convicted of an offence for which a fine < $100.00 and/or a conditional or absolute discharge has been imposed |
| 3 | Convicted of an offence and sentenced to probation and/or for which a conditional or suspended sentence and/or a community service order or restitution and/or a fine ≥ $100.00 has been imposed |
| 4 | Recommitted and/or Probation/parole violation |
| 5 | Convicted of an offence for which a sentence of ≤ 90 days and/or time served has been imposed * |
| 6 | Convicted of an offence for which a sentence of > 90 days but < 2 years has been imposed |
| 7 | Convicted of an offence for which a sentence of ≥ 2 years has been imposed |
* Time Served was scored as a 5 unless specific information is available on the criminal history record indicating that the length of the sentence is > 90 days.
Adjustments for time-at-risk
It should be noted that the computation of both the Criminal Seriousness Index and the Canadian Recidivism Index was complicated by the fact that some offenders spent some time in confinement during the course of the study. This issue would have been less of a concern had we employed self-report measures of offending, as the individuals, while in detention, may still commit and report violent and non-violent acts (Chung et al., 2002). In the present study, however, we relied exclusively on official records. As a consequence, adjustments for "time-at-risk" had to be made to the follow-up measures of offending. To do so, we divided the offenders' scores on both indices by the natural log of the number of months he/she was “street free” to commit an offence (i.e., number of months not incarcerated) during the particular period of assessmentNote 7. Adjusting for time-at-risk was used to address the limitation of previous research that failed to take into consideration incarceration time. Values on the CSI and CRI for offenders who did not reoffend during a particular age period due to having spent the entire period incarcerated and therefore having had no opportunity to reoffend were treated as missing valuesNote 8. Similarly, age categories that did not have a criminality score were also assigned missing values to avoid making assumptions about the severity of offending in the absence of information.
Timing of assessment
Offenders were given a score on both the Criminal Seriousness Index and the Canadian Recidivism Index at each of five periods starting with the age after they were convicted for their index offence. We modeled offending trajectories as a function of age rather than years, as there is considerable age heterogeneity at each year cohort. As a result, chronological age was judged to be a more appropriate and less biased measure of time. The age periods were theoretically defined, to reflect meaningful stages of human development. Those are: (1) Early Adolescence (12-15 years of age); (2) Late Adolescence (16‑20 years of age); (3) Early Adulthood (21-25 years of age); (4) Adulthood (26-30 years of age); and (5) Middle Adulthood (31 years of age and over). Both outcome measures thus yielded a composite score reflecting the seriousness and frequency levels of criminal acts committed during that age period.
Juvenile predictors
With one exception, the predictors of offence trajectory were measured by the probation officers when the juvenile offenders were admitted to supervision, that is prior to gathering information on the recidivism behaviour. One exception related to the criminal history variables where follow-up criminal history records were used as a source of information. The juvenile predictors selected for inclusion sought to operationalize constructs that a review of the literature suggested were theoretically and empirically relevant to understanding developmental trajectories of offending. Those constructs reflect the peer, familial, education, accommodation, attitudinal, substance use, financial, and criminal history aspects of the offenders' lives. All eight general domains were coded on a three-point scale, with item total scores ranging from 0 to 2 and higher scores indicating a higher risk for criminality. A general description of the predictor variables is presented below. The descriptive statistics of the risk factors are reported in Table 3.
Associates.Associates is a nominal predictor variable that reflects the degree of opportunities, involvement and bonding with antisocial peers. Evidence of good peer support and influence (i.e., no adverse relationships) was scored as 0. Offenders who periodically associated with negative peers received a score of 1 while those with regular and frequent unfavourable and unconstructive ties received a score of 2.
Family.The familial domain of the juvenile offenders was evaluated using two individual risk factors: family relations and alcohol abuse in the family. Offenders received one point if the familial environment was disorganized and/or stressful, and another point if there was alcohol abuse evident in their family.
Education.For Education, the juvenile probationers were given a score of 0 if they were at the expected grade level according to their age when they were admitted to supervision for the index offence. A score of 1 was given if they were one grade below the standard educational level, and a score of 2 if their last grade completed was two or more years below the norm.
Accommodation.The Accommodation construct measured the stability of living arrangements and was coded using the actual number of address changes in the 12 months preceding the date of the index offence (the year prior to incarceration if the offender received a custodial sentence preceding his/her term of probation). A score of 0 was given if no address change occurred in the year prior to the period of probation (or incarceration), a score of 1 if the juvenile probationers changed address once, and a score of 2 if two or more address changes took place in the previous year.
Attitudes.The attitudinal construct reflected the offenders' general attitudes to probation. Offenders received a score of 0 if they were receptive to assistance and motivated to change their behaviour. A score of 1 was given if they were relatively neutral towards their crime and the prospect to change their behaviour, and a score of 2 if they were generally negative, not motivated to change and/or rationalized their behaviour.
Substance Use.Substance Use measured the degree to which the probationers' alcohol and/or drug use was problematic. Offenders received a score of 0 if their alcohol/drug usage did not interfere with functioning, a score of 1 if there were signs of occasional abuse with some disruption of functioning, and a score of 2 if abuse was frequent and seriously disrupted functioning therefore showing a need for treatment.
Financial Management.The financial domain combined two dichotomous variables: reliance on social assistance and financial management. Offenders were given one point if they received social assistance during the year prior to the index offence (the year prior to incarceration if the offender received some form of custodial sentence preceding his/her term of probation), and another point if there was any evidence of difficulties in the financial management area (e.g., bad cheques, bankruptcy, garnishment)Note 9.
Criminal History.Information on a number of static, unchangeable risk factors such as the offenders' age at first conviction and the presence of a prior conviction, a prior sentence of incarceration, and a term of incarceration before the probation period was collected. Offenders were assigned to the low, medium, and high risk category on the general Criminal History construct if they, respectively, had zero, one, and two or more points based on the following: (a) they were below the median age of the sample when they were first convicted; (b) they had one or more prior convictions; (c) they had received a period of incarceration on a previous conviction (prior to the index offence); and (d) they had received a period of incarceration prior to his/her probation term (as part of the conviction for the index offence).
Some of the variables used to create those criminogenic risk/needs domains corresponded to individual items on a revised version of the Wisconsin Risk and Needs classification system (Bonta et al., 1994). Accordingly, we also report the offenders' scores on the youth version of the revised actuarial risk and need scale.
| Predictor Variable (Score) | % (n) |
Predictor Variable (Score) | % (n) |
|---|---|---|---|
| Associates | Attitudes | ||
| No problem (0) | 24.9 (128) | No problem (0) | 52.1 (268) |
| Some problems (1) | 60.9 (313) | Some problems (1) | 34.4 (177) |
| Major problems (2) | 14.2 (73) | Major problems (2) | 13.4 (69) |
| Family | Substance Use | ||
| No problem (0) | 31.5 (162) | No problem (0) | 57.4 (295) |
| Some problems (1) | 43.6 (224) | Some problems (1) | 35.8 (184) |
| Major problems (2) | 24.9 (128) | Major problems (2) | 6.8 (35) |
| Education | Financial Management | ||
| At the exp. Level (0) | 22.8 (117) | No problem (0) | 45.1 (232) |
| 1 yr below norm (1) | 41.6 (214) | Some problems (1) | 37.0 (190) |
| ≥ 2 yrs below norm (2) | 35.6 (183) | Major problems (2) | 17.9 (92) |
| Accommodation | Criminal History | ||
| No problem (0) | 50.2 (258) | Low risk (0) | 86.2 (443) |
| Some problems (1) | 24.1 (124) | Medium risk (1) | 8.2 (42) |
| Major problems (2) | 25.7 (132) | High risk (2) | 5.7 (29) |
Some of the variables used to create those criminogenic risk/needs domains corresponded to individual items on a revised version of the Wisconsin Risk and Needs classification system (Bonta et al., 1994). Accordingly, we also report the offenders' scores on the youth version of the revised actuarial risk and need scale.
The original Wisconsin instrument (Baird, Heinz & Bemus, 1979) consisted of 11 risk items and 12 need items summated to yield two separate total scores that placed the offenders into either a low, medium or high risk and need category, respectively. A study that investigated the predictive validity of the risk and need measures yielded mixed findings, pointing out to weaknesses for their use with young offenders (Sabourin, 1986). Following Sabourin's (1986) evaluation, some revisions were made to both the adult and youth versions of the scales. Despite these modifications, a second study (Barkwell, 1991) on the revised risk and need instruments still revealed limitations with the youth version.
In light of this research evidence, Bonta and his colleagues (Bonta et al., 1994) undertook a set of studies to examine the psychometric properties and predictive validity of the scales. The findings from their evaluation suggested a number of modifications, which included the exclusion of items that showed no predictive validity, the simplification of many of the scoring rules, and the combining of the risk and needs items into one scale rather than two individual assessments. These latter recommendations resulted in a youth version of the classification instrument (PRA – V1), and this instrument was used in the present study as it demonstrated improved predictive validity among young probationers (Bonta, Parkinson, Barkwell & Wallace-Capretta, 1994). We call this instrument the Primary Risk Assessment – Version 1 (PRA – V1, 1997; the instrument was further revised for youth in the late 1990s with considerably more items added).
Data management and related issues
In the present study, all data were entered in SPSS (Statistical Software for the Social Sciences). Analyses were conducted with the software package Mplus 4.2 (Muthén & Muthén, 1998, 2006). Mplus facilitates the analysis of structural equation modeling relations by enabling researchers to examine causal models and the strength of variable relationships, and by building models of complex relationships. In addition, one of the valuable features of Mplus is that it allows missing data in all parts of the model, except observed background variables (i.e., predictors and/or covariates).
In this study, data on the majority of the individual predictors were available for all participants. Two variables, however, had one or more missing values. Those were Education (13) and Accommodation (8). Given that participants' data on both variables were missing for no more than 10% of the sample, and to make use of all available cases for whom recidivism information was available, those missing values were imputed using the sample median for the rest of the dataset.
Analytic strategy
A variety of statistical methods have been used in previous research for the analysis of taxonomic systems. Despite the fact that there is no consensus in the literature regarding what constitutes the most appropriate approach, one statistical model might be preferred over others based on substantive and theoretical considerations. In this study, we chose to investigate heterogeneity in offending patterns, and the factors responsible for this variability, using structural equation modeling (SEM).
SEM is a general framework for describing and estimating parametric statistical models. In addition to being flexible with regards to the research design (e.g., different data collection schedule and/or number of waves across individuals), the perspective allows researchers to identify the functional form or temporal patterns of the data (e.g., increase, decrease or stability in outcome over time; linear, quadratic or asymptotic relation). This perspective also allows for the inclusion of time varying predictors (e.g., participation in an intervention) and interactions with time (e.g., effects that are especially pronounced during a particular period). SEM further advances beyond the constraints and limitations of alternative strategies to analyze change over time. It does this by using latent variables to reduce measurement error, by allowing inclusion of contextual variables, and by using all participants' data, even if incomplete.
Within the general SEM framework, we specifically chose to use latent growth curve (LGC) modeling. In a nutshell, latent growth curve models allow separate trajectories over time for repeated measures. Accordingly, each case in the sample can have a distinct time trend as marked by a different intercept and/or slope when followed over time. In the current study, we further used growth curve modeling techniques within a mixture framework. Accordingly, underlying heterogeneity in the development of an outcome over time was represented by categorical latent variables. This implies that the growth model allows different groups of individuals to vary around different mean growth curves (instead of considering individual variation around a single mean growth curve). Two central missions of latent growth curve mixture modeling are therefore the specification of trajectories of development amongst individuals who share one or more notable characteristics, and the testing for the presence of distinctive predictors of the groups. The statistical methods thus distinguish between groups that differ in offending patterns over time (e.g., start at a similar level of offending but diverge in offending over time). This can potentially yield more interesting and useful findings than the research that examines differences between offending behaviour at a single time point.
Results
Data analysis proceeded in four stages. In the first stage, we explored the functional form of the overall criminal pathway for the offenders included in the sample using latent trajectory modeling to determine the optimal structural equation models to fit the present data. In the second stage, we used growth mixture modeling on the best-fitting unconditional models estimated in the first stage to identify subgroups of young probationers with distinct offending trajectories from early adolescence to middle adulthood. In the third stage of the analyses, we expanded the unconditional models and introduced antecedent risk factors that were assessed at index as predictors of offending trajectory group membership. Finally, we judged the external validity and practical utility of the offending classification to Canadian corrections. This was done by regressing a distal outcome representing adult custodial admissions on offending trajectory group membership.
Given that the study sample consisted of a group of adjudicated offenders, all juvenile probationers, including the non-recidivists who had no criminal conviction following the index offence (n = 48 or 9.3% of the sample) were included in the analyses. The non-recidivists also exhibited the behaviour of interest at some point in time and therefore contributed to an analysis of change. Table 4 presents some basic statistics describing the criminal behaviour of the offenders over the assessment periods. As can be seen, the general aggregated pattern of criminal activity generated for the Manitoba sample mirrored the classic age-crime curve in that the rate of offending peaked in late adolescence and declined gradually into adulthood.
| Time period (Age) |
N | % Any recidivism | Adjusted CSI M (SD) |
Adjusted CRI M (SD) |
|---|---|---|---|---|
| 12 – 15 | 221 | 32.1 | 6.97 (4.59) | 8.26 (7.27) |
| 16 – 20 | 514 | 71.6 | 8.15 (5.33) | 8.47 (4.61) |
| 21 – 25 | 510 | 63.5 | 8.04 (5.74) | 7.98 (5.59) |
| 26 – 30 | 505 | 51.3 | 6.58 (5.32) | 6.71 (4.96) |
| 31 onwards | 425 | 29.2 | 5.33 (4.21) | 5.80 (5.07) |
Notes. CSI = Criminal Seriousness Index; CRI = Canadian Recidivism Index. Scores on the CSI and CRI were adjusted to control for time-at-risk in the community. A considerably lower number of offenders were assessed during the first time period (ages 12-15). This should not come as a surprise given that the mean age of the sample at the time of the conviction for the index offence was 16.
Temporal patterns of growth and offending trajectory groups
The first series of analyses were aimed at uncovering the shape of the developmental trajectory of juvenile progression in criminal behaviour over the age periods. A number of unconditional (without covariates) latent trajectory models were estimated to explore the functional form of growth that best fitted the Criminal Seriousness Index and Canadian Recidivism Index data. Separate analyses were performed on each dependent variable. The model-fitting strategy followed recommendations and examples from the literatureNote 1 (e.g., K. A. Bollen, personal communication, March 28, 2007; Bollen & Curran, 2004; Chassin, Flora & King, 2004). We started by assuming a single group and fitted an intercept + linear, and then an intercept + linear + quadratic, growth functions to the data. Following this, we added autoregressive relations.
To study the individual and comparative fit of the growth curve models, we considered a number of overall fit measures (e.g., the likelihood ratio statistic TML [or chi-square test], the Tucker-Lewis index [TLI; Tucker & Lewis, 1973]). Because it is possible to have a model that has good overall fit on several or all of the overall fit measures, but that has poor fit in terms of its components (or vice versa) (Bollen & Curran, 2006), we also took into consideration diverse component fit measures to assess how well each model corresponded to the data as a whole. To be more precise, we screened the parameter estimates for “improper solutions” (e.g., negative error variances, correlations of absolute magnitude greater than one), and looked at the proportion of the variability in the observed variables accounted for by the underlying latent trajectory factors (i.e., R2yt).
The findings indicated that, for both outcome measures, a latent growth curve model specified with a quadratic function best represented the shape of the developmental trajectory of juvenile progression in criminal behaviour from early adolescence to middle adulthood. Moreover, there was significant heterogeneity (i.e., variability around the mean) in the criminal behaviour status and growth factors on both the Criminal Seriousness Index and Canadian Recidivism Index quadratic latent growth curve models. This implies that the juvenile offenders in this study differed in their average criminal behaviour ratings during late adolescence, the second age period, as well as in their rates of change in criminal behaviour over time.
Our subsequent analyses thus attempted to explain this variability. This was accomplished using growth mixture modeling. Growth mixture modeling allows researchers to identify clusters of individuals with similar trajectories of development. As such, the approach assumes that the population is composed of a mixture of distinct subgroups, each defined by a prototypical growth curve. Group membership is not known, but is inferred from the data.
In growth mixture modeling, model selection requires determination of the number of groups that best describes the data. However, it is not appropriate to use the standard log likelihood ratio (i.e., Chi-Square difference) test for model comparison because a k group model is not nested within a k + 1 group model. Several statistics are available to help determine the optimal number of groups to extract. In the present study, we evaluated model fit using one of the more popular selection factors, namely the Bayes Information Criterion (BIC; Raftery, 1993; Schwartz, 1978). Furthermore, to ensure that the findings are substantively significant or meaningful, we also evaluated model fit by visually inspecting the shapes of the resulting trajectories.
To determine the optimal number of trajectory groups to extract, we first specified a single group, and then tested two-group through four-group growth mixture solutions. For both the CSI and the CRI, the results indicated that the two-group solution produced substantial improvement in fit statistics over the one-group solution. However, the mixture models failed to converge to a trustworthy solution when more than two groups were specified, suggesting that the two-group model was the best fitting model for our data. As will be discussed in greater details later, we labelled these groups stable low and chronic high. The chronic high represented approximately 12% of the offenders depending on the outcome measure.
Inspection of the maximum likelihood variance estimates indicated that modeling the Criminal Seriousness Index and Canadian Recidivism Index data with a two-group mixture solution (compared to the one-group LGC model) generally decreased the variability in intercept and slope components. For both outcome variables, however, there was still significant heterogeneity in the criminal behaviour status and growth factors of the two-group quadratic latent trajectory models. To explain this remaining variability, we introduced various risk factors that were assessed when the juvenile probationers were admitted to supervision. Although one of our goals was to improve model fit, of substantive interest was the identification of significant and meaningful predictors of trajectory group membership.
Risk factors associated with offending trajectories
The relationships between the risk factors and group membership were examined in a series of binary logistic regression analyses. The initial regression analyses tested multiple “univariate” predictor models to assess the unique effect of each risk factor separatelyNote 2. Findings indicated that Associates was a significant predictor of group membership for both the Criminal Seriousness Index and the Canadian Recidivism Index. Substance Use was also associated with group differences, although the results reached statistical significance only when the CSI was used as an outcome measure.
Given that both Associates and Substance Use met at least a marginal level of significance (p < .05) in the univariate analyses involving the CSI, both predictors were simultaneously entered into a “multivariate” logistic regression model to investigate the effect of each risk factor conditioned on the other predictor in the model. In this latter analysis, only Associates remained a statistically significant predictor of group membership. The conditional latent growth curve model that includes Associates as a sole risk factor was thus chosen as the optimal model to determine group membership.
Description of the optimal conditional two-group growth mixture solution
Following model selection based on the optimal fit statistic, each offender was assigned to the group that best conformed to his/her criminal behaviour according to the maximum posterior probability of group membership. For each individual in the sample, the posterior probabilities of group membership estimate the probability of the individual belonging to each trajectory group. This procedure is based on the assumption that the error in classification made when placing an offender into only one trajectory group is small, and therefore does not bias the parameter estimates of the standard errors to an important degree. The average probabilities of group membership for offenders falling into each group were .929 and .975 for the CSI and .886 and .971 for the CRI. Furthermore, less than 7% of the sample (25 offenders for the CSI and 35 for the CRI) could be considered “difficult to classify” in the sense that they had an above .25/ below .75 probability of being assigned to the other group.
A graphical depiction of the resulting solutions is presented in Figures 1A and 1B for the CSI and CRI, respectively. Solid lines on the graphs represent model-implied (i.e., estimated or predicted) trajectories, whereas dashed lines represent average observed trajectories. Inspection of the fitted growth curves further bolsters the notion that the conditional two-group quadratic latent growth curve models perform well at reproducing the observed means (i.e., fit the CSI and CRI data well).
Figure 1A: Estimated and observed growth curves for the Criminal Seriousness Index (CSI) with two offending trajectory groups
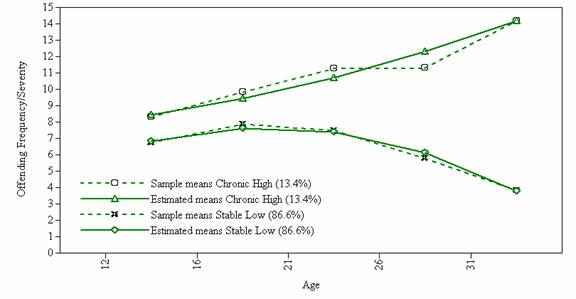
Figure 1B: Estimated and observed growth curves for the Canadian Recidivism Index (CRI) with two offending trajectory groups
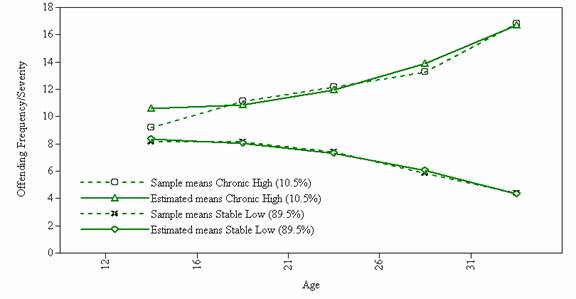
In addition, we can see that the great majority of the offenders engaged in relatively rare and/or non-serious criminal behaviour over their life-course, while a minority of offenders were involved in more frequent, serious and persistent offending. The general pattern of results was strikingly similar with both outcome measures. To be more precise, one group, comprised of approximately 12% of the offenders showed a chronic high level of offending behaviour over the years. The offending frequency/severity of this group increased steadily from adolescence onwards. The largest group, low-rate offending, consisted of roughly 88% of the offenders in the sample. This group was characterized by rare and/or less serious involvement in criminal behaviour over the years. Their offending pattern remained relatively stable, although it tended to show a slight decline in frequency/severity, which was primarily evident during the last two periods of assessment (i.e., age 26 onwards).
As expected, most (≈ 96%) female offending behaviour was of the stable low type. From a different angle, the stable low offending trajectory group was comprised of a male to female ratio of roughly 5 to 1, whereas there were about 24 times more males than females in the chronic high offending group. It is not anymore surprising to report that all of the non-recidivist offenders were assigned to the stable low offending trajectory group. The actual recidivism rates of the two groups at each of the five waves of assessment are presented in Table 5.
| Group membership based on the Criminal Seriousness Index | |||||
|---|---|---|---|---|---|
| Time 1 Ages 12-15 % (n) | Time 2 Ages 16-20 % (n) | Time 3 Ages 21-25 % (n) | Time 4 Ages 26-30 % (n) | Time 5 Ages 31+ % (n) | |
| Chronic High | 40.0 (25) | 85.5 (69) | 82.6 (69) | 81.2 (69) | 91.9 (62) |
| Stable Low | 31.1 (196) | 69.4 (445) | 60.5 (441) | 46.1 (436) | 17.9 (363) |
| Group membership based on the Canadian Recidivism Index | |||||
| Time 1 Ages 12-15 % (n) | Time 2 Ages 16-20 % (n) | Time 3 Ages 21-25 % (n) | Time 4 Ages 26-30 % (n) | Time 5 Ages 31+ % (n) | |
| Chronic High | 38.5 (26) | 88.9 (54) | 88.9 (54) | 90.6 (53) | 89.4 (47) |
| Stable Low | 31.3 (195) | 69.6 (460) | 60.5 (456) | 46.2 (452) | 21.2 (378) |
A few points are worthy of note upon examination of Table 5. First, at each assessment period, the chronic high offenders recidivated at a much higher rate than the stable low offenders. Second, the differences in recidivism rates between the two offending groups became progressively more pronounced over time, with the largest dissimilarity evidenced during (middle) adulthood (ages 26 onwards). After the age of 15, 80% to 90% of the chronic high offenders received at least one conviction in each of the last four assessment periods. In contrast, the recidivism rate for the stable low offenders declined from 70% during late adolescence (16‑20 age period) to approximately 20% in the latest time period (when the offenders were 31 years or older). These findings are consistent with the fitted growth curves depicted in Figures 1A and 1B. There we can actually see that the offending pathways of the two groups are reasonably similar up to early adulthood, and then begin diverging in such a way that the chronic high offending trajectory group maintained an increasingly more frequent and/or serious level of offending throughout adulthood.
Also of interest, almost all of the chronic high offenders (95.7%), while only 56.0% of the stable low offenders, were convicted of at least one violent offence (χ2 (1, N = 510) = 39.55, p < .001) during adulthood (ages 21 and up). Similarly, a significantly greater proportion of chronic high offenders received a conviction for a violent offence between the ages of 16 and 20. However, the difference between the two groups during this earlier assessment period was a bit less marked. Specifically, 73.9% of the offenders in the chronic high trajectory group and 51.2% of the offenders in the stable low trajectory group were convicted for a violent offence during late adolescence (χ2 (1, N = 514) = 12.38, p < .001).
In addition, there were statistically significant differences between the two groups in both the overall number of convictions, and violent convictions received following the index offence. The chronic high offenders in fact were reconvicted more than twice as many times as the stable low offenders in general and for violent offences specifically. The actual number of reconvictions was slightly more than ten for the chronic high offending group (≈ 4 violent reconvictions), compared to about five for the stable low group (≈ 1.5 violent reconvictions). Independent samples t‑tatistics were t (df = 512) = 8.19 for overall and t (df = 512) = 7.12 for violent-only (both ps < .001). The two groups also differed in terms of criminal versatility, with the chronic high offenders averaging nearly five different offence types throughout their life-course and the stable low offenders only about three (t (df = 512) = 8.72, p < .001)Note 1.
It is clear from these findings that the chronic high group was comprised of offenders who were at greater risk and needs than the offenders assigned to the stable low group. For the interested reader, the actual percentages of offenders from each offending group falling into each subpopulation of criminogenic risk/needs level based on the final latent growth curve model (i.e., the model that included Associates as a predictor variable) are reported in Appendix A. Appendix A also provides the distribution of low, medium and high Primary Risk Assessment – Version 1 scores for the chronic high and stable low offending trajectory groups. Furthermore, the univariate associations between the criminogenic risk/need factors and the offending trajectory group membership are shown in Table 6. These are reported as odds ratios calculated from the data displayed in Appendix ANote 2.
As anticipated, Associates differentiated offenders in the chronic high trajectory group from those in the stable low trajectory group on both the Criminal Seriousness Index and the Canadian Recidivism Index. Specifically, the odds of being classified in the chronic high rather than in the stable low offending trajectory group was three times greater for offenders who experienced some or major problems in terms of their association patterns, compared to those who had no problem (ORs ranged from 2.89 to 4.29; all ps < .05). Moreover, substance use problems predicted increased odds of membership in the chronic high offending trajectory group relative to the stable low group, although the effects when the CRI was used as the outcome measure reached statistical significance only for the juvenile probationers with major substance use problems, compared to no problems (OR = 3.05; p < .05). For the CSI, odds ratios were 2.08 for some problems and 2.90 for major problems (both ps < .05). That is, there was a greater proportion of the juvenile probationers who had substance use problems in the chronic high offending group (47.8% for some and 11.6% for major) than was found in the stable low group (33.9% for some and 6.1% for major).
| Model | CSI | CRI | ||
|---|---|---|---|---|
| Risk Factor | OR | 95% C.I. | OR | 95% C.I. |
| Associates | ||||
| Some problems | 2.89** | 1.30 – 6.42 | 3.33* | 1.33 – 8.31 |
| Major problems | 4.29** | 1.70 – 10.83 | 3.31* | 1.11 – 9.86 |
| Family | ||||
| Some problems | 1.67 | 0.90 – 3.11 | 1.22 | 0.62 – 2.37 |
| Major problems | 1.57 | 0.79 – 3.12 | 1.21 | 0.57 – 2.57 |
| Education | ||||
| 1 yr below norm | 1.64 | 0.83 – 3.24 | 1.19 | 0.61 – 2.32 |
| ≥ 2 yrs below norm | 1.88 | 0.98 – 3.59 | 0.75 | 0.38 – 1.49 |
| Accommodation | ||||
| Some problems | 0.75 | 0.38 – 1.49 | 0.84 | 0.40 – 1.78 |
| Major problems | 1.52 | 0.86 – 2.69 | 1.57 | 0.84 – 2.96 |
| Attitudes | ||||
| Some problems | 1.50 | 0.87 – 2.58 | 0.98 | 0.53 – 1.82 |
| Major problems | 1.18 | 0.54 – 2.58 | 1.17 | 0.52 – 2.64 |
| Substance Use | ||||
| Some problems | 2.08** | 1.21 – 3.55 | 1.77 | 0.97 – 3.22 |
| Major problems | 2.90* | 1.23 – 6.86 | 3.05* | 1.23 – 7.57 |
| Financial Management | ||||
| Some problems | 1.03 | 0.59 – 1.80 | 1.25 | 0.67 – 2.32 |
| Major problems | 0.99 | 0.49 – 2.01 | 1.19 | 0.55 – 2.59 |
| Criminal History | ||||
| Medium risk | 1.00 | 0.57 – 1.72 | 1.51 | 0.79 – 2.86 |
| High risk | 1.24 | 0.59 – 2.62 | 2.19 | 0.98 – 4.92 |
Note. For each OR, the reference condition was “low risk” or no problem on the juvenile predictor.
** p < .01; * p < .05.
Finally, we wish to point out that scores on the actuarial PRA – V1 risk measure also distinguished the two offending trajectory groups. The odds of having been classified in the chronic high group (compared to the stable low group) were between two and four times greater for offenders who were categorized in the high PRA – V1 risk/needs category than for those who were assessed as either medium or low risk and needs (ORs were 3.89 for the CSI, p < .01 and 1.99 for the CRI, p < .05). In other words, the chronic high offending trajectory group was made up of a greater proportion of high risk/needs juvenile probationers (≈ 45%) than the stable low group (≈ 23%).
Prediction to provincial and federal custodial admissions
The ability of the offending trajectories to typify later involvement in the provincial and federal custodial systems is one important criterion by which to evaluate the external validity and practical utility of the classification system to Canadian corrections. To more specifically investigate the data from a Canadian correctional perspective, we examined the prevalence of the occurrence of the distal outcome representing custodial admissions (i.e., admissions into a provincial prison or federal penitentiary) within each offending trajectory group (see Table 7). The criminal pathways of the non-custodial, provincial custodial and federal custodial offenders are illustrated in Figures 2A and 2B. The overall rates of provincial and federal custodial admissions in the sample were 51.4% and 12.6%, respectively (36% of the offenders did not enter a provincial nor a federal prison during their life-course). For the readers interested, the proportion of offenders from the non-custodial, provincial custody, and federal custody groups falling in each subpopulation of criminogenic risk/needs level (and PRA – V1 scores) is provided in Appendix B.
| Custodial Outcome % (n) | |||
|---|---|---|---|
| No custody | Provincial custody | Federal custody | |
| Offending trajectory group based on the CSI | |||
| Chronic High | 10.1 (7) | 56.5 (39) | 33.3 (23) |
| Stable Low | 40.0 (178) | 50.6 (225) | 9.4 (42) |
| Offending trajectory group based on the CRI | |||
| Chronic High | 5.6 (3) | 42.6 (23) | 51.9 (28) |
| Stable Low | 39.6 (182) | 52.4 (241) | 8.0 (37) |
Figure 2A: Observed offending trajectories of the non-custodial, provincial custodial, and federal custodial offenders using the Criminal Seriousness Index
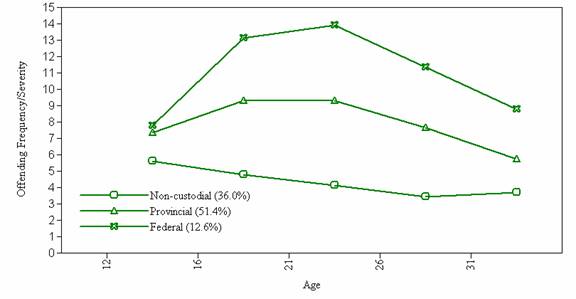
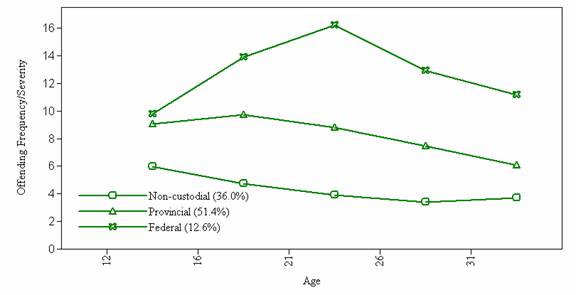
Figure 2B:
Observed offending trajectories of the non-custodial, provincial custodial, and federal custodial offenders using the Canadian Recidivism Index
As can be seen, membership in the chronic high offending trajectory group was associated with significantly increased risk for both provincial and federal custodial admissions. Specifically, the odds of having received a provincial custodial sentence (compared to having kept away from prison later in their life-course) were four to five times greater for the offenders assigned to the chronic high trajectory group than for those comprising the stable low group (ORs were 4.17 and 5.07 for the CSI and CRI, respectively; both ps < .01). Similarly, the odds of ultimately entering a federal penitentiary (compared to having been incarcerated in a provincial facility only) were at least three times greater for the chronic high offenders than for the stable low offenders (OR = 3.16 for the CSI and OR = 7.81 for the CRI; both ps < .01). As expected, the findings comparing the chronic high and stable low offenders who made it to the “Big House” to a group comprised of both the non-custodial and provincial custodial offenders were even more discriminating, such that as much as 50% of the chronic high offenders were admitted to a federal institution, whereas this was true for at most 10% of the stable low offenders. The odds ratios were OR = 4.80 for the CSI and OR = 12.15 for the CRI (both ps < .01).
Upon inspection of Table 7, it is also interesting to note the differences in the custodial outcome distribution between the offending classifications based on the Criminal Seriousness Index and Canadian Recidivism Index. While the actual numbers of non-custodial, provincial custodial, and federal custodial offenders falling in the stable low offending trajectory group were very similar regardless of the outcome measure, the chronic high group as defined by the CRI comprised a greater proportion of offenders who were eventually admitted into federal penitentiaries, relative to the proportions of offenders who never received a custodial sentence and/or who remained involved with the provincial custodial system only, than the chronic high group defined by the CSI. In the previous analyses, we demonstrated that the Canadian Recidivism Index was, in fact, a better assessment tool than the Criminal Seriousness Index to predict admissions into adult provincial and federal prisons. This was expected given that the CRI assessed the frequency/severity of offending behaviour directly from sentencing (scores of 6 and 7 essentially represented terms of incarceration into provincial and federal facilities, respectively).
Discussion
The current study sought to describe and predict the offending developmental pathways of a group of Canadian juvenile probationers. A primary objective was to provide empirical support for the theoretical conceptualizations proposed by Loeber and Stouthamer-Loeber (1996), Moffitt (1993) and Patterson et al. (1992). While doing so, we attempted to address some of the limitations in previous research. To accomplish our goals, we selected a sample of 514 male and female juveniles under a probation sentence in the province of Manitoba, Canada. We followed these offenders over time, and assessed the frequency and severity of their offending behaviour at five meaningful developmental stages during their life-course. To be more explicit, we sought to identify distinct subgroups of adjudicated youths with different offending trajectories from early adolescence to middle adulthood. We also tried to determine which of the major criminogenic risk/need factors that were assessed when the juvenile offenders were admitted to supervision would help to distinguish the offending trajectories from one another. Finally, we examined the practical relevance of the offending trajectory classification to Canadian corrections.
Temporal patterns of offending behaviour
Preliminary analyses demonstrated that the age-crime curve generated from averaging the conviction histories of all offenders in the present research was comparable to the curve reported in many studies (e.g., Blockland et al., 2005; Day et al., 2007; Farrington et al., 2006; Loeber et al., 1999). Like the curve typically reported, the aggregated age-crime relationship for our sample was unimodal and positively skewed, showing a steep rise during adolescence followed by a more gradual decline during adulthood.
What is interesting to note is that the age-crime relationship we obtained was based on longitudinal data that assessed both the frequencyand severityof offending. Despite the fact that previous studies have generally focused on a single dimension (e.g., Blockland et al., 2005; Chung et al., 2002), we contend that both dimensions are equally important to consider when measuring offending behaviour. Amongst other things, simple frequency counts do not have the potential to differentiate offenders who have committed a moderate number of offences of varying gravity, whereas seriousness scales, when used by themselves, cannot distinguish offenders who have all engaged in some type of criminal activity but at various rates of recurrence. By combining the two methods, we were thus able to address each method's shortcomings.
Offending trajectory groups
Acknowledging these initial findings, we were then interested in addressing the question on whether the shape of our aggregated age-crime curve originated from simply superimposing individual offending trajectories of similar shape, or whether it concealed underlying diversity in developmental pathways of offending. Taking advantage of the strengths and capabilities of the newest generation of growth modeling techniques, we demonstrated the existence of sub-groups of juvenile probationers who followed distinct offending trajectories from early adolescence to middle adulthood. We identified two groups, which differed statistically in terms of the parameters of the growth mixture models (i.e., initial level of offending and rate of progression in offending over time). In other words, beyond detecting individual differences at any one time point (in this case frequency/severity of offending during late adolescence), which could have been detected with a cross-sectional examination, the analyses also identified groups that varied by the amount of change that occurs over the waves of assessment.
These findings contrasted with the outcomes of recent empirical studies that suggested the presence of more than two distinct offending trajectory groups (e.g., Day et al., 2007; Blockland et al., 2005; Moffitt, 2003; Wiesner & Silbereisen, 2003). However, the two offending trajectories singled out in the present study corresponded closely to Loeber and Stouthamer-Loeber's (1996), Moffitt's (1993) and Patterson et al.'s (1992) proposed categories of early onset persisters and late onset desisters. A minor portion of youths (≈ 12%) engaged in frequent and/or serious levels of offending behaviour throughout their life-course. The frequency/severity of offending behaviour for offenders within that group escalated gradually from early adolescence (ages 12-15) onwards, and showed very little evidence of decline. We also found a much more common trajectory (≈ 88%) that uncovered relatively less frequent and/or serious offending behaviour over time.
The size of our chronic group was slightly larger than the 3%-8% of the population that has been hypothesized to reveal sustained (or chronic) criminal careers (e.g., Cohen & Vila, 1996; Farrington et al., 2006; Moffitt, 1993), and/or that comprised high-rate chronic offender groups in other empirical studies (e.g., Chung et al., 2002; D'Unger et al., 2002; Farrington et al., 2006). This was anticipated if not for the simple reason that we explored the developmental offending pathways of adjudicated youths (i.e., known juvenile offenders), rather than those of a sample that comprised both offenders and non-offenders.
It did not, either, come as a surprise that practically all of the female offenders (≈ 96%) were classified in the stable low offending trajectory group. As a matter of fact, the chronic high group was comprised of over 20 times more males than females, while the male to female ratio in the stable low group was only about 5 to 1. These results are in line with Moffitt's original theoretical propositions (1993) as well as the outcomes of empirical studies that specifically examined the criminal pathways of female offenders (e.g., D'Unger et al., 2002; Fergusson et al., 2000; Kratzer & Hodgins, 1999).
In light of these findings, we conducted supplementary analyses to examine the criminal pathways of the female offenders separately from those of the stable low, and chronic high, male offendersNote 1. In doing so, we noticed that the shape of the female offending trajectory paralleled that of the stable low male offenders, but involved slightly less frequent and/or serious criminal acts. On this note, we wish to remind the reader that the growth mixture analyses were not in favour of a three-group solution, justifying the inference that, empirically, the female offending pattern was not sufficiently different from that of the stable low male offenders to define a distinct trajectory group.
Caution is, however, called for when interpreting this last series of findings. On the one hand, the statistical gender invariance may be due to the relatively small number of female offenders comprised in the present sample. On the other hand, we could potentially explain the discernible gender difference by the fact that we operationalized offending behaviour using a combination of offence frequency and severity. That is, relative to their female counterparts, the ratio of violent (e.g., assault) to non-violent (e.g., property offences) crimes is much higher amongst male offenders (see Blanchette and Brown (2006) for a review of this topic). Consequently, it remains a possibility that the female offenders in this study would have exhibited a heightened criminal pattern (i.e., closer to the one revealed by the stable low males) had we employed a measure of offending that relied solely on rates of incidence, and ignored the gravity of the acts.
Based on Loeber and Stouthamer-Loeber's (1996), Moffitt's (1993) and Patterson et al.'s (1992) dual taxonomy as well as recent research findings (e.g., Eklund & af Klinteberg, 2006), we further expected the chronic high offenders to disproportionally engage in a wider variety of offence types and more of the violent crimes, compared to the stable low offendersNote 2. Our results are in line with these theoretical and empirical implications. In our study, the offenders classified in the chronic high trajectory group engaged in approximately twice as many different types of offences as those assigned to the stable low group. There also was a clear distinction between the chronic high and stable low offending trajectory groups in terms of violence. While more than 95% of the chronic high offenders were convicted of at least one violent offence from late adolescence onwards (ages 16 and up), less than three quarters of the stable low offenders received a conviction for a violent offence during these periods of their life-course. If we restrict the age periods to include adulthood only (ages 26 and up), the percentage of violent convictions among the chronic high offenders remained relatively unchanged (94.2%), whereas that figure dropped to about 30% among the stable low offenders.
The actual percentages of violent crimes for both offending trajectory groups were higher than expected, and appreciably higher than those reported in other longitudinal studies that used a comparable methodology and/or follow-up period. For instance, using their sample of identified male lawbreakers, Eklund and af Klinteberg (2006) recorded that 45% of the offenders on the persistent criminal pathway, and only 2.8% of those on the desisting pathway were convicted of one or more violent crimes between the ages of 25 and 34.
What might explain the relatively high incidence of violent behaviour of our sample, compared to that of other groups of offenders? Our answer to this is somewhat speculative, as we do not have good data pertaining to the details of the criminal acts. Similarly, we do not have thorough knowledge of what specifically represented a violent crime in other studies. This could explain some of the discrepancy in findings. As noted by Tremblay (2006), the term violence is used to encompass a broad spectrum of behaviours, which during the adolescent years, can range from bullying at school to murder.
Nevertheless, we feel reasonably confident that both of our offending groups were, respectively, higher risk to begin with than those comprising other studies. Many of the adolescents were likely clients of a number of different social agencies before coming to the attention of the criminal justice system. An examination of the data revealed that 14% of the adolescents had been placed in a foster or group home, about half had one or more address change(s) in the year prior to their probation term, and almost one third were relying on social assistance at the time they were admitted to supervision. In addition to involvement with various social service agencies, as much as 30% of the juvenile probationers had a criminal history record before they reached the age of 15.
Risk factors associated with offending trajectories
Additional evidence that we had a high risk sample of offenders with several needs was provided from an examination of the Primary Risk Assessment – Version 1. In our study, not only was the PRA – V1 found to be a significant predictor of offending trajectory group membership, but more than three quarters of the offenders were categorized as either medium or high risk and needs. Given that this actuarial assessment instrument draws its total score from a variety of constructs traditionally linked to criminal behaviour, these results suggest that the majority of the offenders in the sample had multiple criminogenic needs, placing them at risk for reoffending.
If we take these findings as a whole, there is reason to believe that the offending trajectory groups generated in our study were reliably distinctive such that the patterns of offending could be usefully examined for characteristics that may reflect different etiological pathways. Accordingly, it is interesting to consider what set apart the juvenile probationers assigned to the chronic high offending trajectory group from their more transient counterparts.
Of the criminogenic risk/needs domains studied, only Associates reliably predicted group membership across our two outcome measures and after controlling for other competing risk factors. Not surprisingly, the chronic high offending trajectory group comprised more offenders who had negative and unconstructive ties with their peers than the stable low group. Compared to the youth who had a generally prosocial pattern of association, the odds of membership in the chronic high group were significantly increased (roughly three to four times higher) for the juvenile probationers who experienced problems in terms of their association patterns.
Although it was not measured directly, it is logical to deduce that the offenders who followed a chronic high offending trajectory received social support from their peers to engage in criminal behaviour and other related deviant acts. As expected from a social learning perspective and from the principles of differential association theory, interacting with peers who tolerate or even commit antisocial behaviour and who function as reinforcers or role models, increases the risk for criminal behaviour (Coie, Terry, Zakriski & Lochman, 1995; Dishion, Eddy, Haas, Li & Spracklen, 1997; Tremblay, Masse, Vitaro & Dobkin, 1995). The importance of antisocial peer support is not only theoretically relevant, but has also been repeatedly validated empirically. In fact, numerous studies have demonstrated that the role of associates was one of the most important risk factors in the study of delinquency and persistent criminality, especially when dealing with the behaviour of youth (e.g., Brendgen, Vitaro & Bukowski, 1998; Chung et al., 2002; Farrington et al., 2006; Lacourse, Nagin, Tremblay, Vitaro & Claes, 2003; Wiesner & Silbereisen, 2003).
Despite demonstrating a less convincing association with group membership, we should also point out that Substance Use also distinguished offenders in the chronic high and stable low offending trajectory groups. Specifically, a greater proportion of young probationers who had substance use problems were identified as chronic high offenders, compared to those who did not evidence difficulty in this area. The statistically significant effect of this criminogenic risk/needs factor, however, disappeared when considered in conjunction with Associates. Surprisingly, none of the other relatively well-established juvenile risk and need factors significantly and dependably predicted membership in the chronic high and stable low offending trajectory groups.
As noted earlier, our chronic high group comprised a medium to high risk group as measured by the PRA – V1. Although they had problems related to many different aspects of their personal and social lives, the present results highlighted the peer group as a predominant influence that made the juvenile probationers vulnerable to recurrent and enduring contacts with the criminal justice system. We interpret this finding to suggest that patterns of association are so closely entrenched in other areas of a youth's daily life (e.g., family, school) and other potential risk factors (e.g., substance abuse, attitudes) that it indirectly accounts for a good share of the influence attributable to these other criminogenic risk/need factors.
Prediction to provincial and federal custodial admissions
Another interesting set of findings concerns the risk of the offenders assigned to each trajectory group of becoming involved with the adult provincial and federal custodial correctional systems. Additional analyses indicated that the risk of being admitted into either a provincial or a federal prison was markedly greater for offenders assigned to the chronic high group, compared to those best represented as stable low offenders. In the chronic high offending trajectory group, the probabilities for membership in the non‑custodial, provincial custodial and federal custodial groups were roughly 10%, 40% and 50%, respectively. A very different pattern of results was found for the stable low group, which was comprised of approximately 40% non-custodial offenders, 50% provincial custodial offenders, and 10% federal custodial offenders. Evidently, considerably more juvenile probationers in the chronic high offending trajectory group were at risk for becoming involved with the Canadian provincial and federal prison systems during their life-course. This implies that the two offending trajectory groups generated in our study have some practical value in the prediction of long-term criminal outcomes.
Policy and practical implications
We wish to highlight the fact that terms of incarceration were taken into consideration in the computation of time-at-risk in the community. As a consequence, the “window of opportunities” for criminal behaviour was considerably reduced for many of the offenders assigned to the chronic high offending trajectory group, especially during the later phases in their developmental life-course. Making such adjustments, however, did not seem to have any impact on their offending behaviour in the community, as they nevertheless continued to engage in relatively frequent and/or serious criminal activity over the years. These results are in line with the literature on offender rehabilitation, which suggests that sanctions and punishment do not have any suppressive impact on recidivism (see Andrews & Bonta, 2006). In order to produce positive change in offenders, services are needed. This is especially true when dealing with high-risk, persistent offenders.
Until recently, theorists and researchers interested in understanding desistance have focused their research questions on the social processes by which offenders cease to engage in criminal activity by themselves, that is without any deliberate assistance from the criminal justice system (McNeill, Batchelor, Burnett & Knox, 2005; Sampson & Laub, 2003). We agree that this may work well for most offenders. In our study, it is reasonable to believe that a good number of the offenders assigned to the stable low offending trajectory group naturally disengaged from criminal behaviour as they grew up. The question on whether the age-related decline in crime observed for the majority of our sample merely reflects a change in an individual's attachment to various social institutions, a change in opportunities, or a more deep-seated psychological change (i.e., growth and maturity) that relates to Moffitt's (1993) notion of social mimicry is beyond the scope of the present research. Yet, one probable contention insinuates that those offenders are simply responding to changing levels of social controls (e.g., marriage, employment, childrearing) with the transition into adulthood (Sampson & Laub, 1993, 2003; Sampson, Laub & Wimer, 2006).
What is perhaps more central to the present investigation is the finding that desistance was not, as Laub and Sampson (2003) claimed, equally inevitable for all offenders. This is consistent with several other studies (e.g., Blockland et al., 2005; Schaffer, Petras, Ialongo, Poduska & Kellam, 2003). In point of fact, there appears to be a small proportion of offenders who engage in a disproportionate share of the criminal acts, and the most serious types of offences, and who require deliberate interventions in order to eventually desist from crime. These are the offenders towards whom resources and efforts should be directed.
Sufficient research exists that has reported on the characteristics of programs and services that can lessen the probability of youth continuing a life of crime (Leschied et al., 2006). In a nutshell, the major sources of variability in the outcome of deliberate interventions for offenders relate to the risk principle (i.e., reserve intensive services to high-risk offenders), the need principle (i.e., target criminogenic needs), and the responsivity principle (i.e., use cognitive-behavioural intervention strategies that take into consideration the learning style and abilities of the offender) (Andrews & Bonta, 2006; Bonta & Andrews, 2007). Without going into too much detail, there are additional characteristics of effective correctional programs. These include a sound theoretical basis, the use of advocacy and brokerage, a respect for both the relationship (i.e., quality of interpersonal influence facilitating or not learning) and contingency (i.e., direction of interpersonal influence favouring or not crime) principles, the provision of the services in the community or non-residential settings, and treatment integrity. Treatment integrity is concerned with the management structures (e.g., sufficient resources) and practices (e.g., adequate training) that are necessary for the effective delivery of the programs (Bonta & Andrews, 2007).
Given the current state of knowledge, it is important for organizations to use the available information to design programs that respect the principles of effective offender rehabilitation, and to implement them at developmentally appropriate periods in an individual's life-course. The findings obtained in this study stress the importance for adolescents to develop and sustain positive social relationships with prosocial peers. To a lesser degree, the results also indicate the need for parents and other influential adults involved in an adolescent's life to monitor and restrain their drug and alcohol consumption. Prevention and intervention programs should therefore consider targeting and changing both negative peer influence and substance use, as they place adolescents at risk of embarking on a criminal career. In all probability, programs and services that succeed in reducing those two criminogenic risk/need factors will likely affect other dynamic factors typically linked with criminal behaviour, and as noted by Farrington (in press) will have wide-ranging benefits in reducing the occurrence of other types of social problems as well.
For effective resource allocation and the reduction of negative consequences associated with serious and persistent offending, it is thus important to offer the programs and services to offenders who, during adolescence, affiliate with deviant peers and show signs of a problematic consumption of alcohol and/or drugs. The current findings further suggest the need for policy-makers and practitioners to focus their intervention strategies on offenders who, over the course of a number of months following a first encounter with the criminal justice system, exhibit behavioural patterns indicative of frequent and/or increasingly serious forms of deviant and criminal activity. By doing so, it then becomes possible to identify juvenile offenders before they become chronic offenders, and to manage their behaviour in an efficient and timely fashion so as to reduce their likelihood of eventually becoming involved with provincial and federal custodial corrections.
Limitations and directions for future research
The current findings clearly suggest that intervention strategies should be put into operation in the early developmental phases of an offender's criminal career. On this point, it is important to mention that this study examined the offending trajectories and associated risk factors of adjudicated youths during the early and middle adolescent years. The results may have invoked the need to intervene at an even earlier time had we collected data on a normative sample during developmental periods that cover childhood.
Using data from the Seattle Social Development Project, Chung et al. (2002) demonstrated that a number of social developmental constructs such as antisocial peers, school bonding, and drug availability measured in late childhood (ages 10 to 12) influenced offending pathways from adolescence to young adulthood. In a recent study, Côté, Vaillancourt, LeBlanc, Nagin and Tremblay (2006) further found that family risk factors traditionally associated with antisocial behaviour during adolescence (e.g., hostile/ineffective parenting strategies, low income) also predicted the use of frequent and regular physical aggression during early and middle childhood. These latter results are worthy of consideration given that physical aggression between the ages of 6 and 12 was, in turn, shown to predict physical violence at age 17 (Kokko, Tremblay, Lacourse, Nagin & Vitaro, 2006).
In a similar vein, there is a need for additional longitudinal studies that track a large number of offenders over follow-up periods that extend into late adulthood. Not only would this produce greater confidence that we have genuinely identified desisters, but it would also allow researchers to examine different phases in the desistance process. As suggested by Loeber and Stouthamer-Loeber (1998), it cannot be assumed that the causes of desisting from crime are the same across different developmental periods. For a more efficient allocation of prevention and rehabilitative resources, longitudinal studies that gather data over protracted periods of time are thus warranted.
The current literature would also benefit by broadening the scope of this research in other ways. One of the most important shortcomings concerns the choice or availability of the risk factors, which was restricted to the use of time-invariant variables. However, the contemporary growth curve modeling techniques offer the possibility to investigate the relationships between distinct offending trajectories and time-varying predictors (i.e., dynamic variables whose actual scores for some individuals fluctuate across the assessment periods). These growth curve models are complex, and to our knowledge, there has not been any published study that has examined offending trajectories using time-varying predictor variables. The closest piece of work to this cutting edge methodological and analytical strategy was executed by Wiesner and Silbereisen (2003) who explored associations between trajectories of juvenile delinquency and time-averaged risk factorsNote 1.
In this regard, we should point out that recent evidence indicates that psychological problems among justice-involved juveniles remain relatively stable throughout time (Wareham & Dembo, 2007), and that researchers can predict offending and estimate career length from variables available at the first court conviction (Francis, Soothill & Piquero, 2007). We would nonetheless argue that the inclusion of time-varying predictors could help researchers establish that changes in some variables are associated with offending (or desistance) during various developmental stages of the life-course. Moreover, it could allow a more precise and thorough investigation of both cause and effect relations and person-by-situation interactions.
Also related to the choice of predictor variables, we wish to note that we exclusively assessed factors that reflected the person and his/her social environment, and failed to consider important social-cognitive indicators such as the individual's goals and motives. Examining the relations between underlying psychological processes and offending behaviour would provide a more representative and comprehensive picture of the phenomenon under study. For instance, it might help explain why early onset persisters (chronic offenders) are more violent, or why late onset desisters (low-rate offenders) become crime-free.
To attend to the abovementioned shortcomings implies that we would be able to address a number of central themes on Moffitt's (2003) research agenda. For instance, we would be in a better position to fill the critical gap in the early childhood periods regarding the neurodevelopmental correlates of persistent offending. We would also stand on fairly strong footing to investigate more thoroughly the effect of serious and chronic criminal behaviour on other generally negative patterns of behaviour or life outcomes. Some areas worthy of examination have already been proposed. These include employment and educational success, overall physical and mental health, substance misuse, as well as family, marital and social relationships (e.g., Aalsma & Lapsley, 2001; Moffitt et al., 2002; Piquero & White, 2003).
Another methodological limitation of the present study concerns attrition. Subject loss was an issue due to the reasons described earlier (e.g., purging of criminal records), and to the extent that we did not specifically gather information on current status (e.g., death, emigration). Although the analyses of selection effects failed to indicate that the findings were biased in a very important way due to subject loss, they nonetheless suggested that the group of offenders who were excluded from the study probably comprised a larger number of offenders who followed a desisting criminal pathway rather than a serious, persistent offending pathway.
As a final commentary, we wish to remind the reader that our study sample was sizeable and was not restricted to males. However, additional research that has complete, accurate information on a larger number of high-risk, chronic offenders and/or female offenders is needed. This would facilitate a more systematic examination of two essential areas of enquiry that have been neglected in past research, which are the study of interaction effects (i.e., combined influences of various risk factors) and/or gender differences on distinct trajectories of offending. Similarly, a replication of the current study with another sample of Canadian offenders who, ideally, originate from a variety of provinces and/or territories is needed.
Acknowledging the aforementioned limitations, we feel confident that our study contributed to the existing developmental criminological literature in several important ways. Perhaps most notably, we made full use of the longitudinal data by employing a state-of-the-art analytical strategy. This strategy allowed us to capture the complex patterns of stability and change in criminal behaviour across developmental periods. We now hope that the present findings provide some valued guidance to policy-makers and criminal justice authorities, and that they eventually translate into more effective practice.
References
Aalsma, M. C., & Lapsley, D. K. (2001). A typology of adolescent delinquency: Sex differences and implications for treatment. Criminal Behaviour and Mental Health, 11, 173-191.
af Klinteberg, B. (2002). Underlying vulnerability influencing outcome factors/behaviors in psychosocial disturbances. In R. R. Corrado, R Roesch, S. D. Hart, & J. K. Gierowski (Eds.), Multiproblem Violent Youth: A Foundation for Comparative Research on Needs, Interventions, and Outcomes (pp. 138-149). Amsterdam: IOS Press.
Andrews, D. A., & Bonta, J. (2006). The Psychology of Criminal Conduct, 4rd ed. Cincinnati: Anderson Publisher Ltd.
Baird, C. S., Heinz, R. C., & Bemus, B. J. (1979). The Wisconsin Case Classification/staff Deployment Project: A Two-year Follow-up Report. Project #14. Wisconsin: Department of Health and Social Services.
Barkwell, L. (1991). Offender Classification and Risk Assessment. Winnipeg: Community and Youth Corrections.
Blanchette, K., & Brown, S. L. (2006). The Assessment and Treatment of Women Offenders: An Integrative Perspective. Chichester: John Wiley & Sons Ltd.
Blokland, A. A., Nagin, D. S., & Nieuwbeerta, P. (2005). Life span offending trajectories of a Dutch conviction cohort. Criminology, 43, 919-954.
Blokland, A. A. J., & Nieuwbeerta, P. (2005). The effects of life circumstances on longitudinal trajectories of offending. Criminology, 43, 1203-1240.
Blumstein, A., & Cohen, J. (1987). Characterizing criminal careers. Science, 237, 985-991.
Blumstein, A., Cohen, J., & Farrington, D. P. (1988). Criminal career research: It's value for criminology. Criminology, 26, 1-35.
Blumstein, A., Cohen, J., Roth, J., & Visher, C. A. (1986). Criminal Careers and “Career Criminals” (Vol. 1). Washington, DC: National Academy Press.
Bollen, K. A., & Curran, P. J. (2004). Autoregressive latent trajectory (ALT) models: A synthesis of two traditions. Sociological Methods and Research, 32, 336-383.
Bollen, K. A., & Curran, P. J. (2006). Latent Curve Models: A Structural Equation Perspective. John Wiley & Sons, Inc. Hoboken, New Jersey.
Bonta, J. (2002). Offender risk assessment: Guidelines for selection and use. Criminal Justice and Behavior, 29, 355-379.
Bonta, J., & Andrews, D. A. (2007). Risk-need-responsivity Model for Offender Assessment and Rehabilitation. Research Report No. 2007-06. Ottawa: Public Safety Canada.
Bonta, J., Parkinson, B., Barkwell, L., & Wallace-Capretta, S. (1994). The Classification of Young Offenders in Manitoba : Post-probation Recidivism. Research Report. Ottawa, Solicitor General Canada.
Bonta, J., Parkinson, R., Pang, B., Barkwell, L., & Wallace-Capretta, S. (1994). The Revised Manitoba Classification System for Probationers. Research Report. Ottawa, Solicitor General Canada.
Brezina, T. (2000). Delinquent problem solving: An interpretive framework for criminological theory and research. Journal of Research in Crime and Delinquency, 37, 3-30.
Campbell, M. A., French, S., & Gendreau, P. (2007). Assessing the Utility of Risk Assessment Tools and Personality Measures in the Prediction of Violent Recidivism for Adult Offenders. Research Report No. 2007-04. Ottawa: Public Safety Canada.
Chassin, L., Flora, D. B., & King, K. M. (2004). Trajectories of alcohol and drug use and dependence from adolescence to adulthood: The effects of familial alcoholism and personality. Journal of Abnormal Psychology, 113, 483-498.
Chung, I-J., Hill, K. G., Hawkins, J. D., Gilchrist, L. D., & Nagin, D. S. (2002). Childhood predictors of offense trajectories. Journal of Research in Crime and Delinquency, 39, 60-90.
Cohen, L. E., & Vila, B. J. (1996). Self-control and social control: An exposition of the Gottfredson-Hirschi/Sampson-Laub debate. Studies on Crime & Crime Prevention, 5, 125‑150.
Coie, J. D., Terry, R., Zakriski, A., & Lochman, J. (1995). Early adolescent social influences on delinquent behavior. In J. McCord (Ed.), Coercion and Punishment in Long-term Perspectives (pp. 229-244). Cambridge: Cambridge University Press.
Côté, S. M., Vaillancourt, T., LeBlanc, J. C., Nagin, D. S., & Tremblay, R. E. (2006). The development of physical aggression from toddlerhood to pre-adolescence: A nation wide longitudinal study of Canadian children. Journal of Abnormal Child Psychology, 34, 71‑85.
Day, D. M., Beve, I., Duschene, T., Rosenthal, J. S., Sun, Y., & Theodor, F. (2007). Criminal Trajectories from Adolescence to Adulthood in an Ontario Sample of Offenders. Paper presented at the Canadian Psychological Association/North American Correctional and Criminal Justice Psychology conference. Ottawa, ON.
Dishion, T. J., Eddy, J. M., Haas, E., Li, F., & Spracklen, K. M. (1997). Friendships and violent behavior during adolescence. Social Development, 6, 207-225.
D'Unger, A. V., Land, K. C., & McCall, P. L. (2002). Sex differences in age patterns of delinquent/criminal careers: Results from Poisson latent class analyses of the Philadelphia cohort study. Journal of Quantitative Criminology, 18, 349-375.
D'Unger, A. V., Land, K. C., McCall, P. L., & Nagin, D. S. (1998). How many latent classes of delinquent criminal careers? Results from mixed Poisson regression analyses of the London, Philadelphia and Racine cohorts studies. American Journal of Sociology, 103, 1593-1630.
Eggleston, E. P., Laub, J., & Sampson, R. J. (2004). Methodological sensitivities to latent class analysis of long-term criminal trajectories. Journal of Quantitative Criminology, 20, 1‑26.
Eklund, J. M, & af Klinteberg, B. (2006). Stability and change in criminal behavior: A prospective study of young male lawbreakers and controls. International Journal of Forensic Mental Health Services, 5, 83-95.
Elliott, D. S. (1994). Serious violent offenders: Onset, developmental course, and termination – The American Society of Criminology 1993 Presidential Address. Criminology, 32, 1-21.
Farrington, D. P. (1983). Offending from 10 to 25 years of age. In K. Van Dusen & S. A. Mednick (Eds.), Prospective Studies of Crime and Delinquency (pp. 17-38). Boston: Kluwer-Nijhoff.
Farrington, D. P. (1986). Age and crime. In M. Tonry & N. Morris (Eds.), Crime and Justice: An Annual Review of Research (Vol. 7, pp. 189-250). Chicago: University of Chicago Press.
Farrington, D. P. (In press). Childhood risk factors and risk-focussed prevention. In M Maguire, R. Morgan, & R Reiner (Eds.). The Oxford Handbook of Criminology, 4th Edition. Oxford: Oxford University Press.
Farrington, D. P., Coid, J. W., Harnett, L., Jolliffe, D., Soteriou, N., Turner, R., & West, D. J. (2006). Criminal Careers and Life Success: New Findings from the Cambridge Study in Delinquent Development, 2nd Edition. Research Study No. 299. London: Home Office Research.
Farrington, D. P., Lambert, S., & West, D. J. (1998). Criminal careers of two generations of family members in the Cambridge study in delinquent development. Studies on Crime and Crime Prevention, 7, 85-106.
Fergusson, D. M., Horwood, L. J., & Nagin, D. S. (2000). Offending trajectories in a New Zealand birth cohort. Criminology, 38, 525-551.
Francis, B., Soothill, K., & Piquero, A. R. (2007). Estimation issues and generational changes in modeling criminal length. Crime and Delinquency, 53, 84-105.
Ge, X., Donnellan, M. B., & Wenk, E. (2001). The development of persistent criminal offending in males. Criminal Justice and Behavior, 28, 731-755.
Gendreau, P., & Leipciger, M. (1978). The development of a recidivism measure and its application in Ontario. Canadian Journal of Criminology, 20, 3-17.
Gendreau, P., Little, T., & Goggin, C. (1996). A meta-analysis of the predictors of adult recidivism: What works! Criminology, 34, 401-433.
Glover, A. J. J., Nicholson, D. E., Hemmati, T., Bernfeld, G. A., & Quinsey, V. L. (2002). A comparison of predictors of general and violent recidivism among high-risk federal offenders. Criminal Justice and Behavior, 29, 235-249.
Grove, W. M., & Meehl, P. E. (1996). Comparative efficiency of informal (subjective, impressionistic) and formal (mechanical, algorithmic) prediction procedures: The clinical-statistical controversy. Psychology, Public Policy, and Law, 2, 293-323.
Grove, W. M., Zald, D. H., Lebow, B. S., Snitz, B. E., & Nelson, C. (2000). Clinical versus mechanical prediction: A meta-analysis. Psychological Assessment, 12, 19-30.
Hanson, K. R., & Morton-Bourgon, K. (2007). The Accuracy of Recidivism Risk Assessments for Sexual Offenders: A Meta-Analysis. Research Report No. 2007-01. Ottawa: Public Safety Canada.
Hirschi, T., & Gottfredson, M. (1983). Age and the explanation of crime. American Journal of Sociology, 89, 552-584.
Jeglum-Bartusch, D., Lynam, D., Moffitt, T. E., & Sylva, P. A. (1997). Is age important?: Testing general versus developmental theories of antisocial behaviour. Criminology, 35, 13-47.
Kokko, K., Tremblay, R. E., Lacourse, E., Nagin, D. S., & Vitaro, F. (2006). Trajectories of prosocial behavior and physical aggression in middle childhood: Links to adolescent school dropout and physical violence. Journal of Research on Adolescence, 16, 430-428.
Kratzer, L., & Hodgins, S. (1999). A typology of offenders: A test of Moffitt's theory among males and females from childhood to age 30. Criminal Behaviour and Mental Health, 9, 57-73.
Lacourse, E., Nagin, D., Tremblay, R. E., Vitaro, F., & Claes, M. (2003). Developmental trajectories of boys' delinquent group membership and facilitation of violent behaviors during adolescence. Development and Psychopathology, 15, 183-197.
Land, K. C., & Nagin, D. S. (1996). Micro-models of criminal careers: A synthesis of the criminal careers and life-course approaches via semiparametric mixed poisson regression models, with empirical applications. Journal of Quantitative Criminology, 12, 163-191.
Laub, J. H., Nagin, D. S., & Sampson, R. J. (1998). Trajectories of change in criminal offending: Good marriages and the desistance process. American Sociological Review, 63, 225-238.
Laub, J. H., & Sampson, R. J. (2003). Shared Beginnings, Divergent Lives: Delinquent Boys to Age 70. Cambridge, MA: Harvard University Press.
LeBlanc, M. (1996). Changing patterns in the perpetration of offenses over time: Trajectories from early adolescence to the early 30's. Studies on Crime and Crime Prevention, 5, 151‑165.
Leschied, A. W., Nowicki, E., Rodger, A., & Chiodo, D. (2006). Better to Build a Child than Fix an Adult. A report to the Canadian National Crime Prevention Council, Ottawa.
Litwack, T. R. (2001). Actuarial versus clinical assessments of dangerousness. Psychology, Public Policy, and Law, 7, 409-443.
Loeber, R., Farrington, D. P., Stouthamer-Loeber, M., Moffitt, T. E., & Caspi, A. (1998). The development of male offending: Key findings from the first decade of the Pittsburgh Youth Study. Studies on Crime and Crime Prevention, 7, 141-171.
Loeber, R., & LeBlanc, M. (1990). Toward a developmental criminology. In M. Tonry & N. Morris (Eds.), Crime and Justice: A Review of Research (pp. 375-471). Chicago, IL: University of Chicago Press.
Loeber, R., & Stouthamer-Loeber, M. (1996). The development of offending. Criminal Justice and Behavior, 23, 12-24.
Loeber, R., & Stouthamer-Loeber, M. (1998). Development of juvenile aggression and violence: Some common misconceptions and controversies. American Psychologist, 53, 242-259.
Loeber, R., Wei, E., Stouthamer-Loeber, M., Huizinga, D., & Thornberry, T. P. (1999). Behavioral antecedents to serious and violent offending: Joint analyses from the Denver youth survey, Pittsburgh youth study and the Rochester youth development study. Studies on Crime and Crime Prevention, 8, 245-263.
McNeill, F., Batchelor, S., Burnett, R., & Knox, J. (2005). 21st Century Social Work: Reducing Re-offending: Key Practice Skills. Research Report B40448 3/05. Edinburgh: Scottish Executive.
Moberg, D. D., & Erikson, R. C. (1972). A new recidivism outcome index. Federal Probation, 36, 50-57.
Moffitt, T. E. (1993). Adolescence-limited and life-course-persistent antisocial behaviour: A developmental taxonomy. Psychological Review, 100, 674-701.
Moffitt, T. E. (2003). Causes of conduct disorder and juvenile delinquency. In B. Lahey, T. E. Moffitt & A. Caspi (Eds.), Life-Course-Persistent and Adolescent-Limited Antisocial Behavior: A 10-Year Research Review and a Research Agenda (pp. 49-75). New York, NY: Guilford Press.
Moffitt, T. E., & Caspi, A. (2001). Childhood predictors differentiate life-course persistent and adolescence-limited pathways, among males and females. Development and Psychopathology, 13, 355-375.
Moffitt, T. E., Caspi, A., Dickson, N., Silva, P., & Stanton, W. (1996). Childhood-onset versus adolescent-onset antisocial conduct problems in males: Natural history from ages 13 to 18 years. Development and Psychopathology, 8, 399-424.
Moffitt, T. E., Caspi, A., Harrington, H., & Milne, B. J. (2002). Males on the life-course persistent and adolescence-limited antisocial pathways: Follow-up at age 26 years. Development and Psychopathology, 14, 179-207.
Moffitt, T. E., Lynam, D., & Sylva, P. A. (1994). Neuropsychological tests predicting persistent male delinquency. Criminology, 32, 277-300.
Muthén, L. K., & Muthén, B. O. (1998, 2006). Mplus User's Guide, 4th Ed. Los Angeles, CA: Muthén & Muthén.
Nagin, D. S., Farrington, D. P., & Moffitt, T. E. (1995). Life-course trajectories of different types of offenders. Criminology, 33, 111-139.
Nagin, D. S., & Land, K. C. (1993). Age, criminal careers, and population heterogeneity: Specification and estimation of a nonparametric, mixed poisson model. Criminology, 31, 327‑362.
Nagin, D. S., & Tremblay, R. (2005). Developmental trajectory groups: Fact or a useful statistical fiction? Criminology, 43, 873-904.
Patterson, G. R. (1982). Coercive Family Process. Eugene, OR: Castalia.
Patterson, G. R., DeGarmo, D. S., & Knutson, N. (2000). Hyperactive and antisocial behaviors: Comorbid or two points in the same process? Development and Psychopathology, 12, 91‑106.
Patterson, G. R., Reid, J. B., & Dishion, T. J. (1992). A Social Interactional Approach, Vol. 4, Antisocial Boys. Eugene, OR: Castalia.
Piquero, A. R. (2001). Testing Moffitt's neuropsychological variation hypothesis for the prediction of life-course persistent offending. Psychology, Crime & Law, 7, 193-215.
Piquero, A. R., Blumstein, A., Brame, R., Haapanen, R., Mulvey, E. P., & Nagin, D. S. (2001). Assessing the impact of exposure time and incapacitation on longitudinal trajectories of criminal offending. Journal of Adolescent Research, 16, 54-74.
Piquero, A. R., & Brezina, T. (2001). Testing Moffitt's account of adolescence-limited delinquency. Criminology, 39, 353-370.
Piquero, A. R., & White, N. A. (2003). On the relationship between cognitive abilities and life-course-persistent offending among a sample of African Americans: A longitudinal test of Moffitt's hypothesis. Journal of Criminal Justice, 31, 399-409.
Potenza, M. T., Osgood, D. W., & Plake, B. S. (1992). Application of Latent Trait Item Response Models to Adolescent Research. Paper presented at the biennial meeting of the Society for Research on Adolescence. Washington, DC.
Public Safety and Emergency Preparedness Canada (2006). Corrections and Conditional Release Statistical Overview – Annual Report.Ottawa, Ontario.
Raftery, A. E. (1993). Bayesian model selection in structural equation models. In K. A. Bollen & J. S. Long (Eds.). Testing Structural Equation Models (p. 163-180). Newbury Park, CA: Sage.
Rice, M. E., & Harris, G. T. (1997). Cross-validation and extension of the Violence Risk Appraisal Guide for child molesters and rapists. Law and Human Behavior, 21, 231-241.
Rutter, M., Giller, H., & Hagell, A. (1998). Antisocial Behavior by Young People. New York, NY: Cambridge University Press.
Sabourin, D. (1986). Validation of Manitoba Probation Risk-assessment Scale. Winnipeg: Community and Youth Corrections.
Sampson, R. J., & Laub, J. H. (2003). Life-course desisters? Trajectories of crime among delinquent boys followed to age 70. Criminology, 41, 555-592.
Sampson, R. J., Laub, J. H., & Wimer, C. (2006). Does marriage reduce crime? A counterfactual approach to within-individual causal effects. Criminology, 44, 465-505.
Schaffer, C. M., Petras, H., Ialongo, N., Poduska, J., & Kellam, S. (2003). Modeling growth in boys' aggressive behavior across elementary school: Links to later criminal involvement, conduct disorder, and antisocial personality disorder. Developmental Psychology, 39, 1020‑1035.
Schwartz, G. (1978). Estimating the dimension of a model. The Annals of Statistics, 6, 461-464.
Smith, W. R., & Aloisi, M. F. (1999). Prediction of recidivism among “second timers” in the juvenile justice system: Efficiency in screening chronic offenders. American Journal of Criminal Justice, 23, 201-222.
Tolan, P. H., & Gorman-Smith, D. (1998). Development of serious and violent offending careers. In R. Loeber & D. P. Farrington (Eds.), Serious and Violent Juvenile Offenders: Risk Factors and Successful Interventions (pp. 68-85). Thousand Oaks, CA: Sage.
Tremblay, R. E. (2006). Prevention of youth violence: Why not start at the beginning? Journal of Abnormal Child Psychology, 34, 481-487.
Tremblay, R. E., Masse, L. C., Vitaro, F., & Dobkin, P. L. (1995). The impact of friends' deviant behavior on early onset of delinquency: Longitudinal data from 6 to 13 years of age. Development and Psychopathology, 7, 649-661.
Tucker, L. R., & Lewis, C. (1973). A reliability coefficient for maximum likelihood factor analysis. Psychometrika, 38, 1-10.
Wareham, J., & Dembo, R. (2007). A longitudinal study of psychological functioning among juvenile offenders: A latent growth model analysis. Criminal Justice and Behavior, 34, 259‑273.
White, H. R., Bates, M. E., & Buyske, S. (2001). Adolescence-limited versus persistent delinquency: Extending Moffitt's hypothesis into adulthood. Journal of Abnormal Psychology, 110, 600-609.
Wiesner, M., & Silbereisen, R. K. (2003). Trajectories of delinquent behaviour in adolescence and their covariates: Relations with initial and time-averaged factors. Journal of Adolescence, 26, 753-771.
Wolfgang, M. E., Thornberry, T. P., & Figlio, R. M. (1987). From Boy to Man, from Delinquency to Crime. Chicago: University of Chicago Press.
Appendix A
| Offending group | ||||
|---|---|---|---|---|
| Outcome variable | Criminal Seriousness Index | Canadian Recidivism Index | ||
| Juvenile predictor | n (%) Chronic High (N = 69) |
n (%) Stable Low (N = 445) |
n (%) Chronic High (N = 54) |
n (%) Stable Low (N = 460) |
| Associates | ||||
| No problem | 7 (10.1) | 121 (27.2) | 5 (9.3) | 123 (26.7) |
| Some problems | 47 (68.1) | 266 (59.8) | 40 (74.1) | 273 (59.3) |
| Major problems | 15 (21.7) | 58 (13.0) | 9 (16.6) | 64 (13.9) |
| Family | ||||
| No problem | 17 (24.6) | 145 (32.6) | 15 (27.8) | 147 (32.0) |
| Some problems | 32 (46.4) | 192 (43.1) | 25 (46.3) | 199 (43.3) |
| Major problems | 20 (29.0) | 108 (24.3) | 14 (25.9) | 114 (24.8) |
| Education | ||||
| At the exp. level | 15 (21.7) | 148 (33.3) | 16 (29.6) | 147 (32.0) |
| 1 yr below norm | 23 (33.3) | 137 (30.8) | 16 (29.6) | 144 (31.3) |
| ≥ 2 yrs below norm | 31 (44.9) | 160 (36.0) | 22 (40.7) | 169 (36.7) |
| Accommodation | ||||
| No problem | 33 (47.8) | 225 (50.6) | 25 (46.3) | 233 (50.7) |
| Some problems | 12 (17.4) | 112 (25.2) | 10 (18.5) | 114 (24.8) |
| Major problems | 24 (34.8) | 108 (24.3) | 19 (35.2) | 113 (24.6) |
| Attitudes | ||||
| No problem | 31 (44.9) | 237 (53.3) | 28 (51.9) | 240 (52.2) |
| Some problems | 29 (42.0) | 148 (33.3) | 18 (33.3) | 159 (34.6) |
| Major problems | 9 (13.0) | 60 (13.5) | 8 (14.8) | 61 (13.3) |
| Substance Use | ||||
| No problem | 28 (40.6) | 267 (60.0) | 23 (42.6) | 272 (59.1) |
| Some problems | 33 (47.8) | 151 (33.9) | 24 (44.4) | 160 (34.8) |
| Major problems | 8 (11.6) | 27 (6.1) | 7 (13.0) | 28 (6.1) |
| Financial Management | ||||
| No problem | 31 (44.9) | 201 (45.2) | 22 (40.7) | 210 (45.7) |
| Some problems | 26 (37.7) | 164 (36.9) | 22 (40.7) | 168 (36.5) |
| Major problems | 12 (17.4) | 80 (18.0) | 10 (18.5) | 82 (17.8) |
| Criminal History | ||||
| Low risk | 27 (39.1) | 179 (40.2) | 16 (29.6) | 190 (41.3) |
| Medium risk | 31 (44.9) | 206 (46.3) | 27 (50.0) | 210 (45.7) |
| High risk | 11 (15.9) | 60 (13.5) | 11 (20.4) | 60 (13.1) |
| PRA- V1 | ||||
| Low risk | 7 (10.1) | 95 (21.3) | 8 (14.8) | 94 (20.4) |
| Medium risk | 26 (37.7) | 253 (56.9) | 25 (46.3) | 254 (55.2) |
| High risk | 36 (52.2) | 97 (21.8) | 21 (38.9) | 112 (24.3) |
Appendix B
| Offending group | |||
|---|---|---|---|
| Juvenile predictor | n (%) Non-custodial (N = 185) |
n (%) Provincial custody (N = 264) |
n (%) Federal custody (N = 65) |
| Associates | |||
| No problem | 65 (35.1) | 52 (19.7) | 11 (16.9) |
| Some problems | 104 (56.2) | 171 (64.8) | 38 (58.5) |
| Major problems | 16 (8.6) | 41 (15.5) | 16 (24.6) |
| Family | |||
| No problem | 75 (40.5) | 72 (27.3) | 15 (23.1) |
| Some problems | 73 (39.5) | 119 (45.1) | 32 (49.2) |
| Major problems | 37 (20.0) | 73 (27.7) | 18 (27.7) |
| Education | |||
| At the exp. level | 68 (36.8) | 73 (27.7) | 22 (33.8) |
| 1 yr below norm | 56 (30.3) | 83 (31.4) | 21 (32.3) |
| ≥ 2 yrs below norm | 61 (33.0) | 108 (40.9) | 22 (33.8) |
| Accommodation | |||
| No problem | 112 (60.5) | 122 (46.2) | 24 (36.9) |
| Some problems | 34 (18.4) | 74 (28.0) | 16 (24.6) |
| Major problems | 39 (21.1) | 68 (25.8) | 25 (38.5) |
| Attitudes | |||
| No problem | 113 (61.1) | 127 (48.1) | 28 (43.1) |
| Some problems | 54 (29.2) | 101 (38.3) | 22 (33.8) |
| Major problems | 18 (9.7) | 36 (13.6) | 15 (23.1) |
| Substance Use | |||
| No problem | 126 (68.1) | 138 (52.3) | 31 (47.7) |
| Some problems | 51 (27.6) | 105 (39.8) | 28 (43.1) |
| Major problems | 8 (4.3) | 21 (8.0) | 6 (9.2) |
| Financial Management | |||
| No problem | 100 (54.1) | 105 (39.8) | 27 (41.5) |
| Some problems | 60 (32.4) | 108 (40.9) | 22 (33.8) |
| Major problems | 25 (13.5) | 51 (19.3) | 16 (24.6) |
| Criminal History | |||
| Low risk | 92 (49.7) | 96 (36.4) | 18 (27.7) |
| Medium risk | 83 (44.9) | 124 (47.0) | 30 (46.2) |
| High risk | 10 (5.4) | 44 (16.7) | 17 (26.4) |
| PRA – V1 | |||
| Low risk | 57 (30.8) | 36 (13.6) | 9 (13.8) |
| Medium risk | 107 (57.8) | 149 (56.4) | 23 (35.4) |
| High risk | 21 (11.4) | 79 (29.9) | 33 (50.8) |
- Date modified: