Proportion of Criminal Incidents Associated with Organized Crime

Table of contents
- Introduction
- Empirical and Conceptual Background
- Data and Methods
- Results
- The Number of Organized Crime-Related Incidents
- Estimating the Proportion of Organized Crime-Related Incidents
- Organized Crime Offences by Crime Type
- Where Do Organized Crime Offenders Fit in the Larger Criminal Scene in Quebec?
- Police Resources to Combat Organized Crime
- A Case Study: Using Interviews to Assess the Resources Associated with Policing Organized Crime in British Columbia
- Discussion
- Conclusion
- List of Acronyms
- References
- Appendix A: Interview Guide
- Appendix B: SPVM Reports
- Appendix C: SPVM Major OC Investigations and Initiatives
- Footnotes
By Martin Bouchard, Carlo Morselli, Sadaf Hashimi, Marie Ouellet
Abstract
The current report provides: 1) a measure of the proportion of criminal incidents that are associated with organized criminal activities (overall and for each offence type) in Montreal; 2) situates potential organized crime offenders within the wider population of co-offenders, that is, beyond the region under study and; 3) gauges the various types of resources allocated by law enforcement agencies in responding to and combating activities associated with organized crime. The estimates of criminal incidents associated with organized criminal activities are based on three different, yet complementary, models: 1) the wide net model (2 co-offenders); 2) the standard definition model (3+ co-offenders); and 3) the post hoc flag model (modified 3+ co-offenders). Each of these models is subjected to three different thresholds based on the seriousness of offences: A) none (all offences); B) broad (offences classified as serious plus “unclassified offences); and C) strict (offences classified as serious). Depending on the model and threshold applied to data, the proportion of incidents that fit the definition of organized crime range between 1.6 and 6.9 percent for the first model; 3.9 and 22.8 percent for the second; and 0.26 and 2.93 percent for the third. . It was found that roughly half of these organized crime (OC) offenders are connected to the wider provincial OC network in one way or another. Also, combining estimates across units with mandates to only combat OC and those that deal primarily with OC incidents, suggests that there are approximately 250 law enforcement officials at Service de Police de la Ville de Montréal (SPVM) who are directly involved in combating OC.
Author's Note
The views expressed are those of the authors and do not necessarily reflect those of Public Safety Canada. Correspondence concerning this report should be addressed to: Research Division, Public Safety Canada, 340 Laurier Avenue West, Ottawa, Ontario, K1A 0P8; email: PS.CPBResearch-RechercheSPC.SP@ps-sp.gc.ca.
Acknowledgements
The authors would like to express their sincere gratitude to the respondents who accepted to be interviewed for the purpose of this study, and to the key informants who facilitated our access to multiple law enforcement units working organized crime cases. Sincere thanks to Peter Carrington for sharing his expertise and insights on classification of offences and organized crime. Finally, the authors would like to thank Anton Maslov and Austin Lawrence for their guidance and suggestions. Please note that the views expressed in this report are only those of the authors, and not Public Safety Canada.
Introduction
The prevalence of criminal organizations, their involvement in illegal activities and the violence stemming from an unregulated market generates a serious concern for law enforcement agencies. Organized crime has routinely been the subject of legislative initiatives and policy. With the introduction of Bill C-22 and Bill C-95 leading to subsequent amendments to the Criminal Code, legislation in Canada has intensified providing police "enhanced" powers to combat organized criminals. Currently, section 467.1 of the Criminal Code of Canada defines a criminal organization as a group however organized that:
"(a) is composed of three or more persons in or outside Canada; and
(b) has as one of its main purposes or main activities the facilitation or commission of one or more serious offences, that, if committed, would likely result in the direct or indirect receipt of a material benefit, including a financial benefit, by the group or by any one of the persons who constitute the group."
The definition goes on to exclude a group of persons that forms randomly for the immediate commission of a single offence.
Despite a set of criteria provided by the Criminal Code, the terrain of organized crime is broad, covering a wide range of illicit activities and criminal incidents. Around the world, the main challenge facing legislators who seek to reduce organized crime concerns the definition of organized crime and the fact that it has never been defined in a uniform manner. This is true within both official and scholarly contexts. The main reason for this lies in the fact that organized crime is not a crime in itself. It is a way of doing crime, much like professional or violent ways of doing crime. Thus, legislative attempts to define organized crime have been centered primarily on the composition of groups, gangs, or organizations that are perceived to be the typical common denominator within this more complex process.
Definitional problems in the area of organized crime lead to measurement problems that have trickled down the criminal justice system. There are various definitions offered by scholars and variations in legal definitions provided by different statues. As a result, police services differ in their methodology for investigating criminal incidents associated with criminal organizations. These discrepancies, in return, lead to uncertainties about the frequency of incidents related to organized crime and greater uncertainties about the allocation of police resources in dealing with such incidents. Organized crime is an important issue for policing and policing practices. Currently, no prior studies have provided a set of findings addressing: 1) the estimated proportion of criminal incidents that are associated with organized crime activity in one policing jurisdiction; 2) the proportion of resources allocated by the police in dealing with issues related to organized crime; and 3) the overall spending of police services in responding to, and combating activities related to criminal organizations. In other words, there exists little research on estimating the financial and non-financial costs of preventing, investigating and responding to organized crime activity.
The current report aims to partially fill this gap by: 1) proposing to estimate the proportion of criminal incidents that are associated with organized criminal activities (overall and for each offence type) in Montreal; 2) situating all offenders who were potentially involved in organized crime-related activities within the larger criminal scene in Quebec and; 3) gauging the resources, whether it be human (police strength) or financial (investigation costs) allocated by law enforcement agencies in responding to and combating activities associated with organized crime.
The estimates of criminal incidents associated with organized criminal activities are based on three different, yet complementary, models: 1) the wide net model; 2) the standard definition model; and 3) the post hoc flag model. Each of these models is subjected to three different thresholds based on the seriousness of offences: A) none; B) broad; and C) strict. The project will thus provide a range of estimates, based on different assumptions about the types of crimes in which criminal organizations are involved.
Prior work on the prevalence of organized crime is reviewed below, with a focus on the aspects that fulfill the objectives of this report. In particular, the literature on co-offending groups is reviewed, as it provides the foundation for estimating the proportion of organized crime-related incidents using official data. The review section also considers the types of crimes in which criminal organizations are involved and the costs of policing organized crime.
Empirical and Conceptual Background
Prevalence of Organized Crime in Canada
Despite an international consensus amongst government officials, law enforcement agents, policy makers and the public on the imminent threat of organized crime in Canada, there remains a scientific void in the understanding of organized crime. First, there exists a variety of definitions of organized crime provided by agencies around the world, which leads to discrepancies in the reporting of organized crime (Sauvé, 1999; Ogrodnick, 2002; Saunders and Lawrence, 2013). Second, as a social process, organized crime is a dynamic phenomenon that is consistently evolving as groups and its members often extend beyond a single jurisdiction to exploit new opportunities and adapt to market factors (Reuter 1983; Morselli, 2009; Varese, 2011). As a result, organized crime has been a difficult concept to define and measure (Shepticky, 2003; Paoli, 2002; Ogrodnik, 2002; Varese, 2011). While there is some consensus regarding the continuous and durable features of organized crime, the definitional challenge is essentially due to two dimensions that have yet to be resolved across academic or policy settings.
The first challenge concerns the type of crimes that fall within the organized crime repertoire. Traditional definitions of organized crime have restricted this scope to what are generally referred to as market crimes (Naylor 1997; 2003). Such crimes cover the supply of illegal goods and services or the illegal supply of legal goods and services (see Vold and Bernard (1986) for such a general appraisal). This is radically different from legislative and general criminal justice definitions of organized crime that go well beyond the scope of market crimes and include a long list of predicate crimes in which offenders may organize themselves in various organizational forms. The inclusion of predicate crimes, such as robbery, fraud, or homicide, blurs the boundaries of organized crime by orienting the phenomenon toward a more general 'organization in crime' framework, thus shifting the emphasis within the phenomenon away from the supply demand market dimensions and more toward the organizational dimensions.
The shift away from the market basis of organized crime generates a second challenge that concerns the type of groups or organizations that fall within this phenomenon. In 2010, the Criminal Intelligence Service Canada (CISC) reported that, within the past five years, the total number of criminal groups operating across Canada has fluctuated between 600 to well over 900. The fluctuation in numbers is reflective of factors such as shifts in legislation, changes in the intelligence collection processes, and in law enforcement reporting processes. For instance, the enactment of Bill C-95 and Bill C-22, variations in the operationalization of criminal groups, and disruption strategies used by law enforcement officials in Canada have led to shifts in the definition of organized crime groups.
Particularly, as of 2005, the concept of organized crime within law enforcement agencies expanded to include loosely associated, heterogeneous networks of individuals, such as street gangs and more opportunistic forms of criminal enterprise. Street gangs are unique in that they may include higher-level organized crime members, smaller components of larger gangs or criminal organizations, or simply criminal groups changing their names overtime (CISC, 2010). This expansion is in addition to the conventional definition of organized crime groups, as a standard hierarchy comprised of tightly knit homogenous groups such as the Hells Angels, Bandidos, and the Cosa Nostra (UNODC, 2002; CISC, 2010).
Despite complexities associated with identifying and measuring organized crime, many of the groups operating in Canada are centered in and around major urban centers (CISC, 2006). Law enforcement agencies in Canada often classify criminal organizations along ethnic lines: outlaw motorcycle gangs (clearly not an ethnic group, but this generally makes up the set of categories), Asian-based organized crime groups, Italian-based organized crimes, Aboriginal-based organized crime groups, and Eastern European-based organized crime groups (Sauvé, 1999; CISC, 2000; CISC, 2004; Malm, Bichler & Nash, 2010). Nationally, these groups are centered in areas such as the Lower Mainland of British Columbia, Greater Toronto area, and Greater Montreal. These areas are considered the primary hubs of criminal groups with both an active concentration of criminal organizations and the presence of criminal markets (CISC, 2010; Mackenzie, 2012). For instance, in 2013, of the 85 gang-related homicides linked to organized crime groups or street gangs in Canada, 56 percent occurred in Montreal (n=16), Vancouver (n=18) and Toronto (n=14). Footnote01 While operating within these hubs, criminal groups often venture into other areas of Canada. Consistent with a resource-sharing perspective of organized crime and illegal enterprise (Haller, 1990), the composition of criminal groups is consistently fluid and members of criminal organizations are continuously aligning with one another to enhance their mutual criminal profits (Malm et al., 2010).
Co-Offending Groups, Crime Types, and Networks
To facilitate their criminal activity, organized offenders partake in criminal activities with a network of accomplices or co-offenders. Research on co-offending using official data, however, suggests that co-offending beyond two individuals is relatively rare. For instance, Carrington, Brennan, Matarazzo, and Radulescu (2013) used the 2011 UCR2 survey to estimate the prevalence of co-offending incidents reported by the police in Canada. Co-offences were categorized into pair crimes (2 or more offenders) and group crimes (3 or more offenders). In 2011, Canadian police reported 993,994 incidents, in which co-offending accounted for 11 percent (8% pair offences, 3% group crime) of cleared incidents. Of the 993,994 incidents, only 1,086 incidents in the UCR2 was recorded as involving a street gang. Specifically, of the 1,086 street gang incidents, ten percent comprised group crimes. Similarly, in a study investigating the prevalence of group crime in Canada, Carrington (2002) found that group crimes were relatively low amongst crimes that came to police attention in Canada. Using the UCR2 survey from 1992 to 1999, 20 percent of incidents in Canada involved two offenders, whereas only seven percent of all incidents involved a group of three or more accomplices (Carrington, 2002).
Amongst incidents of co-offending, extant research has shown that co-offending usually takes place in small co-offending groups, comprising two to three individuals (Reiss & Farrington, 1991; Weerman, 2003; Bouchard & Nguyen, 2010; Bouchard & Morselli, 2014). In fact, only a small minority of co-offending groups comprise four or more persons (Reiss & Farrington, 1991; Weerman, 2003; Bouchard & Nguyen, 2010; Bouchard & Morselli, 2014). For instance in a cross-national comparison study across Canada, England and the United States, Carrington and van Mastrigt (2013) found that, in all three countries, co-offending groups tend to be small, with approximately 75 percent of co-offences involving two offenders, and 1 percent involving six or more offenders. Furthermore, co-offending groups are not stable. Given that few offenders commit one to two offences within a short interval of time, the propensity to select the same co-offender across multiple offences is rare (Reiss & Farrington, 1991; Weerman, 2003; Morselli, Grund & Boivin, 2015). In other words, and consistent with Reuter's (1983) classic work on criminal markets, the action networks of co-offenders are short-term, resulting in a high turnover, where the selection of co-offenders changes between criminal events (Warr, 1996; Weerman, 2003; Mcgloin, Sullivan, Piquero & Bacon, 2008).
Although the prevalence of co-offending is generally low in Canada, specific types of illicit activities are more likely to involve co-offenders (Tremblay, 1993; Bouchard, 2007; Bouchard & Nguyen, 2010). According to the 2010 CISC report, organized crime groups in Canada primarily take part in criminal markets such as counterfeit goods, illicit drugs (cocaine, heroin, marijuana, methamphetamine, ecstasy), contraband tobacco, the illicit distribution of pharmaceuticals, illicit firearms, financial fraud (mortgage fraud, payment card fraud, securities fraud), credit card fraud, vehicle theft, and heavy equipment theft. The most common form of illicit activities organized groups partake in involves the supply of illegal goods and services that generate large amounts of money such as trafficking illicit drugs (Sauvé, 1999; Levi & Maguire, 2004; CISC, 2010).
In Carrington et al.'s (2013) analysis of co-offending patterns using official data, group crimes were most common amongst market offences (drug-related) and property offences, were more likely to involve a firearm or other weapons in comparison to solo offences, and had the highest seriousness weights according to Statistics Canada's crime severity weights. In fact, in 2011, eight percent of incidents committed by groups of three or more were classified as serious offences, meeting the definition of criminal organization as prescribed by section 467.1 of the Criminal Code. This is consistent with a recent study of co-offending patterns in Quebec, in which violent crimes were more likely to be committed in solo offending scenarios, while property crimes and market crimes were more likely to be conducted with co-offenders (Morselli, Grund, & Boivin 2015). Such results are also consistent with past research on general co-offending. Reiss and Farrington (1991) found that property crimes such as burglary and robbery were especially likely to involve co-offenders. Additionally, Piquero, Farrington and Blumstein (2007) supplemented these findings, concluding that co-offending was most common in the commission of property offences such as burglary, robbery, and theft of motor vehicles, whereas co-offending was least common amongst sexual offences, such as sexual assaults, and traffic offences, such as impaired driving (Carrington et al., 2013). Co-offending and the structural features of criminal groups naturally lend themselves to an analysis of networks. Bouchard and Morselli (2014) stated that "organized crime (or a criminal market) is largely a resource pooling process that is built around individuals who are connected (or socially embedded) with each other in various ways" (p. 7). There is a clear emphasis on social relations in organized crime, as these relations generate capital and provide access to the suppliers, potential accomplices and a more general criminal opportunity structure (Tremblay, 1993; Morselli, 2009). Research by Sarnecki in Borlänge (Sarnecki, 1990) and Stockholm (Sarnecki, 2001) has also followed this general outlook. In the Stockholm study, Sarnecki focused on the central network that emerged from official arrest data. Network analyses led to the identification of an ensemble of 15,426 direct and indirect sets of co-offending relationships (3,979 individuals) that accounted for a considerable proportion of offences in Stockholm. Sarnecki maintained that the identification of this central network did not constitute the youth branch of a criminal underworld. The main reason for this was that relations were too short-lived and rarely surpassing the commission of one co-offence. Yet, while these co-offending groups were ephemeral in nature, the network that pooled everyone together did constitute the basis for an ongoing and durable criminal opportunity structure.
Morselli, Grund, and Boivin (2015) also tapped into this more general structure by identifying the 'core' and 'peripheral' segments of the Quebec co-offending network. The former represents the top five percent of offenders who had the most co-arrests in the province. The latter represents co-offenders who were not part of this top five percent, but were in direct contact with these core offenders through their own past arrests. Core offenders were, on average older offenders (roughly four years older than offenders found in the periphery). Consistent with the entrepreneurial nature of organized crime, core offenders were also more active in committing crime and more likely implicated in market crimes.
Operationalizing and Estimating the Cost of Organized Crime
Although no prior studies have provided findings linking the costs of police services to the prevalence of organized crime, extant studies have set forth methods for estimating the prevalence of criminal organizations and assessing the threats posed by criminal organizations in Canada. Providing theoretical recommendations for measuring the scope of organized crime, von Lampe (2004) examined the reliability of crime statistics and annual police reports as data sources for developing estimates. Concerning aggregate crime statistics, von Lampe (2004) emphasized that without supplementary information; findings based on these sources would likely result in biased estimates with crime rates fluctuating in response to contextual factors rather than the degree of organized crime involvement. This is partly because the costs associated with investigations generally reflect resource allocation and the creation of specialized units rather than fluctuations in organized crime activity. Examining risk assessments of organized crime groups, Tusikov (2012) emphasized that the creation of empirical measures of organized crime remains one of the primary issues for estimating the scope of organized crime. Specifically, she found that across law enforcement agency risk assessments in Australia, the Netherlands, and the United Kingdom there was little distinction made between serious crimes and crimes committed by organized crime groups. Across both studies, von Lampe (2004) and Tusikov (2012) emphasized concerns with quantifying and defining organized crime, along with the lack of sources to do so.
Recent studies supported by Public Safety Canada have attempted to overcome these limitations, operationalizing traits associated with criminal organizations to generate group- and serious incident-based estimates (Glässer, Tayebi, Brantingham, & Brantingham, 2012; Saunders & Lawrence, 2013). Using the Criminal Code of Canada's definition of criminal organizations, these studies aimed to quantify the main features of organized crime groups, including group size of three or more, non-random group formation, and serious offences that result in material gains. To identify criminal organizations both studies used the definition of organized crime as prescribed by the Criminal Code; however, they varied in how features of organized crime were operationalized and relied on different data sources to obtain their estimates.
Glässer et al. (2012) used all offences reported to the RCMP obtained from the Police Information and Retrieval System (PIRS) in British Columbia for 2001 to 2006 to identify the number of criminal organizations operating during this period. To conduct estimates, the study proceeded in two stages. First, all active co-offending groups of three or more were identified. Then, following the extraction of these groups, offence types committed by these groups were classified as being organized crime-related or not. To identify whether groups or three or more formed non-randomly for the commission of the offence, a measure of 'activity' was generated by calculating the frequency by which members of the co-offending group committed offences during the current time period relative to the previous time period (divided into one-year spans). It was determined that if 30 percent of the co-offending group's structure remained the same across time periods they were identified as having met the criteria of non-random group formation for the commission of an offence. These analyses resulted in finding 313 criminal groups of three or more that had formed non-randomly for the commission of offences.
The second stage identified whether these same groups also committed serious crimes for material benefit. To determine which offences were both serious and committed for the purposes of material benefit, the authors' relied on correspondence with Public Safety Canada, and literature on organized crime from Europe and the United States. According to the Canadian law, serious offences are crimes that had or could possibly result in a sentence of five years or more, or are defined by statue, while material benefits are defined as any offence that resulted in either a financial or criminal reputational gain. Where an offence had at least one known case of a gain whether it be financial or reputational, it was included as an organized crime offence, creating a final list of 192 offences. With this list, the authors created two approaches for identifying which active co-offending groups were most likely to be organized crime groups: the 'hard constraint approach' and the 'soft constraint approach.' The first model, the 'hard constraint approach,' aimed to closely follow the Criminal Code's definition of organized groups, identifying active co-offending groups that had committed at least one serious material benefit offence. Using this criterion, the authors found that out of the original 313 active co-offending groups, there were 236 that could be classified as criminal organizations having committed at least one serious offence for material benefit. In contrast, the 'soft constraint approach' used this same list of offences, but also added a second condition for identifying criminal organizations in order to narrow the scope to only serious organized crime groups. To do so, the ratio of serious offences to overall offences committed by a group was examined by applying the RCMP's Crime Severity Index, which assigns a numeric value according to the offences' seriousness, to all 192 offences. Footnote02 Applying this index, a total 'seriousness' value across offences committed by members of a co-offending group was calculated. This value was then divided by the total number of offences to create a seriousness score per group. Co-offending groups that scored above 0.6 (the average seriousness score across all offences) were classified as serious criminal organizations, resulting in the identification of 39 serious criminal organizations.
A complementary study by Saunders and Lawrence (2013) used police-reported crime data from the incident-based Uniform Crime Reporting (UCR2) survey to develop an Organized Crime Severity Index (OCSI). Maintaining consistency with section 467.1 of the Canadian Criminal Code, the authors only considered incidents where three or more offenders were involved in an incident, as well as incidents where two or more of the offenders co-offended with one another on at least two occasions. The authors reasoned that while three individuals are necessary for an initial criminal organization designation, even if only two of these members re-offend, it still suggests that the group did not form randomly. This reasoning is also applied for one of the models used in the current study. Saunders and Lawrence (2013: 6) created a list of 192 offences that were considered serious (indictable or potentially indictable offences with a maximum punishment of five years of imprisonment or more) according to the Criminal Code, and that are likely to result in material benefit, either for financial or reputational gain. Specifically, offences were considered to result in material gain if it led to: 1) direct monetary gain; 2) indirect monetary gain; 3) increases in the prestige of group members of the group relative to other group members or groups; and, 4) contributes to the continuity of the group. Although results were stated to be preliminary, they found that across all reported crime incidents in the UCR2 from 2006 to 2009, roughly 1.8 percent of the volume and severity of crime could be attributed to criminal organizations.
Conducting estimates of the volume of co-offending within Canada, Carrington et al. (2013) distinguished between offences committed by two offenders and those with three or more, along with the seriousness of the offence. What is notable is that rather than applying the five-year threshold to determine serious offences as used in Glässer et al. (2012) and Saunders and Lawrence (2013), the Police-reported Crime Severity Index (CSI) developed by Babyak et al. (2009) was used to examine the relative severity of offences committed by co-offending groups. The CSI views all offences on a continuum of severity, rather than dichotomizing incidents as serious or non-serious. The seriousness of an offence is determined based on sentencing data from Canadian courts. Specifically, the incarceration rate for an offence is multiplied by the average sentence length for the same offence across all individuals who were convicted and incarcerated. Using the most recent five years of court sentencing data, the weight essentially measures "on average, how long a person would be sentenced to prison given that they were found guilty (convicted) of an offence" (Babyak et al., 2009, no page). Applying this to the UCR2 data in 2011, Carrington et al. (2013) assessed the severity of co-offences by taking the seriousness of each co-offence and dividing it by the total number of co-offences, resulting in the creation of an average seriousness weight. This allowed the authors to find that co-offending groups on average were more likely to commit serious offences. Given that the goal was to examine crime severity across co-offending groups rather than organized crime, this study did not provide an overall estimate of organized crime-incidents given that a second filter for offences that resulted in material benefit was not applied.
Across all studies, the authors provided methods to quantify elements of organized crime, with the aim of generating estimates. The studies were consistent in that group size was calculated by including incidents that consisted of three or more offenders involved in a single incident. However, they differed in how they determined non-random group formation and serious offences. While Saunders and Lawrence (2013) found that at least two of the offenders had to re-offend together, Glässer et al. developed their own threshold for determining non-random group formation looking at structurally similarity across time periods. Further, each study presented its own unique data limitations. Glässer et al.'s (2012) law enforcement data excluded major municipalities within B.C. including Vancouver and Victoria, while the UCR2 used by others lacked data on all police-reported crimes. For example, the 2009 data used by Saunders and Lawrence (2013) only included 47 percent of all reported incidents across Canada, comprising only those incidents that had been cleared by police. Further, there were challenges to coding offences as organized crime-related with Glässer et al. (2012) finding that all categories of offences listed in the PIRS did not match to a corresponding offence in the Criminal Code, causing them to exclude 80 offence categories. Finally, Saunders and Lawrence (2013) urged caution in interpreting estimates, stating that not only are findings likely underestimated given that the UCR2 is not representative of the entire population of criminal occurrences, but also that many organized crime-related offences are unlikely to result in charges across all offenders. Thus, some offences may involve multiple organized crime members. However, when only a select few are detected, the three person criterion for these organized crime offences fails to be met.
Police Resources and Organized Crime
While the above studies focus on the operationalization of organized crime, the link between volume and costs on police resources has yet to be empirically examined. To measure the proportion of money allocated to combating criminal organizations, and related incidents, data stating police finances are necessary. This has been suggested by Saunders and Lawrence (2013) who stated that expenditure data collected by Statistics Canada could be used to estimate criminal justice costs associated with organized crime. One example of this that could be applied is Hutchinson (2014), who used the Police Administration Survey to report the rate of police strength, and police expenditures amongst census metropolitan areas (CMA), provinces/territories, and Canada. The Police Administration Survey reports data on police personnel and expenditures from each municipal, provincial, and federal police service in Canada. Expenditures comprise salaries, wages, benefits, and other operating costs. The report covers police personnel up to May 2013, and reports final expenditures up to 2012. Amongst the provinces, Manitoba had the highest rate of police strength, followed by Saskatchewan and Nova Scotia. Thunder Bay, Winnipeg, and Montreal were the CMAs with the highest rate of police strength. However, the main limitation of this data source is that police strength and expenditures are not broken down internally within departments, rather reflecting overall police budgets and resources. Official expenditure data could be valuable to assist in estimating police costs; however, police-specific data on organized crime investigations is required to assess the costs of organized crime. This report cannot fully fill this gap in the literature, but examines in detail the type of resources that go into criminal investigations of criminal organizations from the perspective of law enforcement personnel working in this area.
Data and Methods
Module d'information policière (MIP)
Data was obtained from the Module d'information policière (MIP), provided by the Sûreté du Québec (SQ), Quebec's provincial police force. The MIP provides data on all crime incidents in which one or more individuals were accused, or arrested, but not necessarily convicted in the Province of Quebec, Canada. Unlike other traditional crime reports, the MIP provides data on all crime incidents comprising suspects or offenders across time, and criminal incidents. These incidents can be categorized into offences (criminal incident), offenders (an individual arrested for a specific offence), and offence participation (criminal involvement of one person in one incident). All incidents have an event number, event date, an anonymized suspect ID, number of offences committed (offence 1, offence 2, offence 3, etc.), municipality, place of incident, the suspect and accused's date of birth and sex. In any event, there may be more than one offender involved in an incident, hence the number of offenders per incident may range, and offenders may overlap across criminal incidents. The current study focuses on the subset of criminal incidents that occurred in Montreal from 2005 to 2009, which were the most recent and complete years available to the researchers.
Operationalizing the Criminal Code Definition
To operationalize a criminal incident as "organized crime-related," the definition provided by section 467.1 of the Criminal Code of Canada is applied. Section 467.1 defines a criminal organization as a group however organized that:
"(a) is composed of three or more persons in or outside Canada; and
(b) has as one of its main purposes or main activities the facilitation or commission of one or more serious offences, that, if committed, would likely result in the direct or indirect receipt of a material benefit, including a financial benefit, by the group or by any one of the persons who constitute the group."
Where a serious offence, under section 467.1 is defined as an indictable offence under this or any other Act of Parliament for which the maximum punishment is imprisonment for five years or more, or another set of offences that is prescribed by regulation. The definition excludes a group of persons that forms randomly for the immediate commission of a single offence.
The definition of organized crime under section 467.1 falls into three, broadly defined, components (number of offenders, seriousness of the crime with direct/indirect receipt of a material benefit, and continuity). It is necessary that all three components converge, in some form, before an offender or criminal incident can be categorized as organized crime-related.
Three families of models comprising an intersection of methodologies for operationalizing criminal organizations and organized crime-related incidents are used in this report. The three models presented in Table 1 are subjected to a variety of threshold conditions, with each following a different approach to estimating the proportion of organized crime-related incidents:
- The "wide net model" considers criminal incidents where two co-offenders are involved to estimate the proportion of organized crime-related incidents;
- The "standard definition model" considers criminal incidents in which three or more co-offenders are involved to estimate the proportion of organized crime-related incidents, thereby using the same threshold used under section 467.1; and
- The "post hoc flag model" shifts the scope of the unit of analysis from "groups" to "individuals" associated with these groups. Offenders who commit an offence in groups of three or more at one point in the five years of study are flagged. The database comprising all offences within the city of Montreal from 2005 to 2009 is searched for any incident involving these flagged offenders. Whether or not the flagged incidents included co-offenders, they are added and counted as "organized crime-related" under the post hoc flag model.
The definition thresholds, the list of offences considered "serious," include 1) "none"; 2) "broad"; and 3) "strict." Details on each component of the model such as group size (2 or 3+ co-offenders), definition thresholds for the classification of offences, as well as continuity, applied to each of the nine estimates are provided in Table 1. Overall, three different estimates per model and nine estimates in total are produced based on the classification of offences.
| Size of Group | ||||
|---|---|---|---|---|
| Threshold for seriousness of offence |
2 | 3+ | 3+ (modified) | |
| None | Model 1.1 | Model 2.1 | Model 3.1 | |
| Broad | Model 1.2 | Model 2.2 | Model 3.2 | |
| Strict | Model 1.3 | Model 2.3 | Model 3.3 | |
Component 1: Group Size
To meet the first standard prescribed by the Criminal Code, that is, differentiating between solo offences and co-offending incidents, two models for the minimum number of offenders required for the commission or facilitation of an offence are considered: the wide net model (2 co-offenders) and the standard definition model (3+ co-offenders).
- Wide net model: Co-offending offences with two persons involved in the commission or facilitation of the offence.
The co-offending threshold is lower than the minimum required by the Criminal Code, but it recognizes the fact that many more co-offenders are usually involved in specific crimes than the ones officially detected by the police (Tremblay, 1993; Bouchard, 2007; Bouchard & Nguyen, 2010). The small group size (2) helps avoid false negatives. At the same time, it is likely to produce higher than desired estimates for the purposes of estimating organized crime-related incidents. For this reason, it is considered the "wide net" model.
- Standard definition model: Co-offending offences with three or more persons involved in the commission or facilitation of the offence.
This definition adheres to the criteria noted in section 467.1 in the Criminal Code of Canada. For this reason, it is labeled as the "standard definition" model for estimating the proportion of organized crime-related incidents.
Component 2: Seriousness of the Offence
To meet the second standard prescribed by the Criminal Code, the current study considers three different thresholds, using two separate lists provided by Carrington et al. (2013) and Saunders and Lawrence (2013). Each threshold classifies offences based on the seriousness of the offence as prescribed by the Criminal Code. The three thresholds provided are 1) none; 2) broad; and 3) strict. As seen in Figure 1, these are to be considered on a continuum where the severity of offences ranges from "none" to "strict." In an instance where there are multiple offences committed across a single incident, the most serious offence takes precedence, and the incident is classified based on that particular offence.
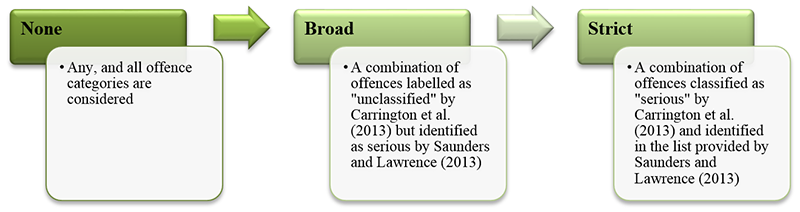
Image Description
Figure 1 is a text box chart describing the thresholds for determining the seriousness of an offence. From the left-hand side, the first box is titled “None” and includes the text: any and all offence categories are considered. An arrow is directed from the first box to the second. The second box is titled “Broad” and includes a combination of offences labelled as "unclassified" by Carrington et al. (2013) but identified as serious by Saunders and Lawrence (2013). An arrow is directed from the second box to the third. The third box is titled “Strict” and includes a combination of offences classified as "serious" by Carrington et al. (2013) and identified in the list provided by Saunders and Lawrence (2013).
- Strict
The "strict" threshold combines a list of 75 serious offences as identified by Carrington, Brennan, Matarazzo, and Radulescu (2013) with a list of 192 offences put forth by Saunders and Lawrence (2013) that identifies all offences that are serious in nature, and could reasonably be expected to generate a material benefit.
Carrington et al. (2013) used the 2011 UCR2 data to estimate the prevalence, and seriousness of co-offending incidents in Canada. Footnote03 In doing so, they categorized all offences reported in the 2011 UCR2 data as "serious," "unclassified" and "not serious." To categorize incidents as serious or not serious, Carrington et al. (2013) used the UCR coding manual of violation codes and Criminal Code sections, supplemented by Martin's Annual Criminal Code (2012). For each UCR violation code, they identified how many Criminal Code offences it referred to. They categorized all offences into indictable offences and summary offences, seeking the maximum prison sentence for all offences pertaining to the specific violation code. In sum, they coded 207 offences listed in the Criminal Code and coded in the 2011 UCR survey. Of the 207 offences, 75 were "serious" offences, 33 were "not serious" offences, and 99 were "unclassified" offences.
Serious offences (36%) comprised all indictable offences sharing an UCR code with a minimum penalty of five or more years in prison. Offences deemed "not serious" (16%) comprised summary offences or offences where the maximum penalty was less than five years in prison. The remaining offences were categorized as "unclassified" (48%). In this scenario, only 36 percent of offences the authors categorized as "serious" are considered, providing a more strict view of what could be argued to fit under section 467.1.
Additionally, Saunders and Lawrence (2013) proposed a methodology for estimating an Organized Crime Severity Index (OCSI) using police-reported crime data from the incident-based Uniform Crime Reporting (UCR2) Survey. To start, Saunders and Lawrence (2013) examined a list of offences in the Criminal Code of Canada and coded in the UCR2 Survey (n=200). An offence was categorized as serious if the maximum punishment set out was imprisonment for five years or more (indictable or potentially indictable). To incorporate the condition of material benefit, an extensive review of the literature on what constitutes material gain within the realm of criminal organizations was conducted, leading to a final list of 192 offences. Footnote04 This list supplements Carrington et al. (2013) as almost every indictable offence is included (96%). The 75 offences considered serious by Carrington et al. (2013) overlap with Saunders and Lawrence's definition of serious offences with the potential to generate material gain.
- Broad
In addition to the list of offences included under the strict definition, a list of 99 unclassified offences as identified by Carrington et al. (2013) is added to constitute the "broad" estimate. Unclassified offences are arguably candidates for being considered "serious" as most offences under this category have a minimum penalty of five years in prison (or more). The broad category overlaps almost perfectly with the list of offences that Saunders and Lawrence (2013) defined as "serious."
- None
The last method for estimation considers the broadest approach, that is, not to apply any threshold and examine the nature of all crimes for which co-offending groups are involved. The no threshold scenario provides a useful benchmark from which to compare estimates that do attempt to apply a seriousness threshold. The no threshold scenario is not simply a useful benchmark, but there are also empirical reasons to examine every offence carried out by stable co-offending groups. Most group offences of this kind require at least some level of planning, coordination, and execution (Tremblay, 1993; Weerman 2003; Bouchard & Nguyen, 2010; van Mastrigt & Carrington 2013). The estimates provided under this scenario would not necessarily match the definition of a criminal organization, but it is useful to examine how sensitive estimates are to variations in the nature of thresholds, including instances where no thresholds are applied.
Component 3: Continuity
Every estimate proposed needs to satisfy the continuity component, that is, the need for at least two co-offenders in a criminal incident to be detected together across two separate incidents. This meets the last condition prescribed under section 467.1 of the Criminal Code of Canada, that is, the requirement that the group not be randomly formed for the commission of a single offence.
In other words, to exclude groups of persons that form randomly for the immediate commission of a single offence, only criminal groups, where at least two of the offenders commit more than one offence across time periods (two separate incidents) are considered. If two or more offenders re-offend, with each other, or with a differing third offender, it would suggest that the group was not randomly formed - illustrating a pattern of co-offending over time (Saunders & Lawrence, 2013). Prescribing to the minimum threshold of two offenders across at least two incidents is the most effective measure given the nature of official police data (e.g. it under-estimates the number of offenders involved per crime), and co-offending data. It should be noted that continuity amongst co-offenders, that is, the likelihood that the same two offenders are formally detected across two separate criminal incidents is relatively rare, and remarkable in and of itself.
The Post Hoc Flag Model
The last model is treated separately, as it follows a different logic. The idea is to reproduce, albeit imperfectly, the practice of some law enforcement agencies to "flag" offenders based on their gang/organized crime affiliations. These offenders may or may not always be involved in crime incidents with fellow gang/organized crime group members. Yet, one could argue that even in instances where these individuals interact with police outside of a "group activity" per se, these interactions can still be considered "organized crime-related."
For an offender to be flagged under this category, two steps are taken. First, offenders who have been involved in the facilitation or commission of at least one group crime (3 or more offenders, including the offender) within the period under study are noted. These offenders are flagged as "potentially associated with a criminal organization." In the second step, the MIP data, noting all criminal incidents in Montreal from 2005 to 2009, is revisited and every criminal incident a flagged offender has been involved in is considered in the post hoc model.
By flagging repeat offenders, the aim is to specifically address the limitations of official police data, and the "dark figure" of crime pertaining to instances of unrecorded offending and co-offending incidents. Furthermore, the objective is to seek the prevalence of offenders and seek which types of offences these offenders continue to be involved in. For instance, Carrington et al. (2013) found that in 2011 co-offending incidents were highest for drug trafficking, production and importation/exportation offences, followed by robbery, counterfeiting, and arson. These offences, especially drug-related offences, usually require a network of participants to operate. The post hoc flag model is subjected to the same threshold requirements considered with the previous two families of models (see Table 1). In practice, it means that all flagged offenders have at least on one occasion been involved in a criminal incident with at least two other co-offenders. The frequency and the nature of these criminal incidents, as well as the seriousness of these charges are considered in the post hoc model.
Extraction of Criminal Incidents and Model Formation
For clarity and replication purposes, Figure 2 presents the multiple stages of data extraction and the process of operationalization of the various models. To start, all criminal incidents within the city of Montreal from 2005 to 2009 were extracted for analyses from a dataset that includes the province as a whole. The date that the criminal incident occurred was used to select incidents. Montreal based incidents were sought from all of Quebec using the municipal code. For instance, in the province of Quebec, areas within the city of Montreal begin with a municipal code of "66.Footnote5" Hence, only criminal incidents that occurred within the city of Montreal, and had a municipal code beginning with "66" were considered.
Second, all repeated incidents, consisting of incidents that occurred on the same day with the same co-offenders were identified and removed as they were duplicate incidents. These incidents were identified using an equation that multiplied the date of infringement with the UniqueID (anonymized suspect ID) of each offender involved in the criminal incident. The product of this equation provided a unique number, identifying repeated cases of criminal incidents. In addition to this equation, incidents were manually processed to make sure that they were indeed repeat incidents with the same offender(s). In sum, while the Montreal database initially comprised 300,446 criminal incidents, with the removal of repeated offences, the total number of criminal incidents within the city of Montreal from 2005 to 2009 comprised 256,722 incidents. In other words, 14.6 percent of cases were removed from the Montreal dataset because they occurred on the same day or simultaneously.
The third step of data mining required extracting co-offences within the city of Montreal. Because the minimum number of offenders required for all models were two, every criminal incident involving two or more offenders were considered. Overall, 4.4 percent of incidents within the city of Montreal were instances of co-offending, involving two or more offenders (n=11,417). On average, there were approximately two offenders per criminal incident (SD=1.5), with a range of two to 40 offenders. Contingent on the seriousness of the offence(s), all co-offending incidents were classified and matched with one of the three seriousness of offence threshold categories. Where an incident comprised multiple offences, the classification was based on the most serious offence. The fifth step took into account a constant condition for all nine models in three families. To meet the third component of organized crime, continuity, the process comprised finding all repeated pairs of offenders amongst the 11,417 cases of co-offences. In other words, incidents where at least two offenders had offended together across two different periods were extracted. A social network analysis software, Organizational Risk Analyzer (ORA), was used to sift through and identify repeated pairs of offenders (Carley et al., 2013). ORA provided a list of all repeated pairs of offenders (involved in two or more offences) based on their UniqueID. In sum, there were 1,193 repeat pairs (a pair of offenders being arrested together at least twice during the five-year period). These pairs appeared 4,287 times across 11,417 incidents.
Finally, for the post hoc model, instead of considering the proportion of organized crime-related incidents using incidents as the main unit of analysis, the model considers the individual. That is, any offence committed by an individual identified with "organized crime" is "organized crime-related," whether or not that offence actually involved co-offenders. In operationalizing the post hoc model, the data was re-structured from the incident-level to the offender-level. Offenders involved in incidents meeting the organized crime definition in Model 2.1 (all criminal incidents in which individuals at some point were found in the same group of three or more offenders at least twice between 2005 and 2009) were flagged and checked for their presence in the larger, initial Montreal data that included solo offences. This implied taking the analyses back to the incident level.
Classifying Crime Types
In examining the types of crimes offenders were involved in, all criminal incidents within the city of Montreal from 2005 to 2009 were classified into seven crime types: violent crimes, crimes against property, fraud, market-drug possession, market-drug supply, market-other, and all others. To classify a criminal incident into a crime type, the most serious, and often first offence listed within each criminal incident dictated which crime type that criminal incident was categorized into. Overall, there were 385 unique offences listed in the Module d'information policière (MIP) data. Table 2 shows the number of different offences classified in each category. Of the 385 offences, 17 percent of offences were classified as violent crimes, 11 percent of offences were classified as crimes against property, 19 percent of offences were fraud related offences, 22 percent of offences were market offences (2% drug possession; 9% drug supply; 11% other) followed by all other offences (44%). Whereas six of the seven crime types were based on relatively traditional classifications, the "all others" category comprises more general offences such as disturbing the peace, indecent action, etc. Additionally, the category comprises offences that were in violation of liquor laws, and municipal and provincial offences. Offences that make up the "all others" category were generally non-serious offences.
| Number of different offences (n=385) | Percent | |
|---|---|---|
| Violent crimes | 66 | 17.1 |
| Crimes against property | 44 | 11.4 |
| Fraud | 19 | 4.9 |
| Market - drug possession | 8 | 2.1 |
| Market - drug supply | 36 | 9.4 |
| Market - other | 41 | 10.6 |
| All others | 171 | 44.4 |
Law Enforcement Interviews and Estimates of Police Costs
A total of 17 interviews with law enforcement officials, comprising police officers, crime analysts, and operating management staff in Quebec (n=9, all from the Service de Police de la Ville de Montréal - SPVM) and British Columbia (n=8) were conducted. Participants consisted of law enforcement officials operating within specialized units, including gangs, organized crime, fraud, homicides, morality, and narcotics. To examine the management of organized crime cases across police agencies, interviews comprised a series of open-ended questions broadly covering four key themes: 1) the identification of cases involving criminal organizations; 2) estimates of the frequency of organized crime-related offences; 3) the relative complexity of these cases in comparison to others; and 4) the resources required to respond to organized crime-related cases (see Appendix A for the full interview guide). The primary objective was to compare and contrast the management of cases labelled by law enforcement as "organized crime" to other cases. The analysis focused on the relative complexity, length, and resources allocated to such crimes. The secondary objective was to obtain insight into the finances and allocation of resources to organized crime-affiliated incidents within police agencies. For instance, one question inquired upon the amount of human and financial resources that were dedicated to dealing with issues pertaining to organized crime within the agency. Combining police interviews with existing data supplements the incident-based data obtained from the MIP, providing a practical perspective on how incidents related to organized crime are classified and treated.
Each interview was conducted within the police agency and lasted between 45 minutes and two hours. To ensure confidentiality, all law enforcement officials and identities of their respective departments, with the exception of SPVM, were anonymized. The 17 respondents consisted of personnel varying in experience, time at the force, and roles. Representing a broad range of participants, the nine law enforcement officials interviewed from the SPVM consisted of individuals specializing not only in organized crime and gang units, but also in homicide, fraud, morality and narcotics. The breadth of units provided a means to assess the degree to which both organized crime specific units and non-organized crime units treated cases affiliated with criminal organizations. All respondents in Montreal were law enforcement officers, occupying positions ranging from Investigators to Lieutenants. On average, respondents had 21 years of experience as police officers and approximately five years within their current specialized units (see Table 3 for a description of the sample). Given that the distribution of the budget within police departments across units is not publicly disclosed, interviews in Quebec provided a means to assess how OC incidents were prioritized within the department and the degree to which resources were dedicated to these organized crime-affiliated incidents. Thus, while published reports provided information on the total resources within a department, interviews provided insight into parameters associated with the allocation of these resources towards organized crime.
To provide greater geographical representation across Canada, an additional eight interviews with law enforcement officials in British Columbia were conducted. Of the eight interviews conducted in B.C., all participants specialized in gangs and organized crime and consisted of six law enforcement officers and two analysts. On average, law enforcement officials in B.C. had 22 years of experience in the force, and approximately seven years in a specialized role explicitly investigating gangs and organized crime.

Image Description
Figure 2 is a text box chart describing the process of data mining and the extraction of criminal incidents. From the top left-hand side, the first box is titled “All criminal incidents in the Province of Quebec” and includes police records found in the Module d'information policière (MIP) provided by the Sûreté du Québec from 2005 to 2009. An arrow is directed from the first box to the second. The second box is titled “Montreal database: Criminal incidents within the city of Montreal” and includes the text: All criminal incidents committed in the city of Montreal from 2005 to 2009 were extracted. An arrow is directed from the second box to the third. The third box is titled “Extraction of criminal incidents involving co-offenders” and includes criminal incidents, comprising two or more offenders in the city of Montreal from 2005 to 2009. An arrow is directed from the third box to the fourth. The fourth box is titled “Classification of offences within each criminal incident” and includes all co-offences comprising two or more offenders are categorized based on the seriousness of the offence (none; broad; strict). An arrow is directed from the fourth box to the fifth. The fifth box is titled “Criminal incidents involving repeated pairs of offenders” and includes the text: to meet the continuity component, a minimum of two offenders had to be arrested together on at least two separate incidents within the five year period. An arrow is directed from the fifth box to the sixth. The sixth box is titled “Flagging offenders” and includes the text: any offender who has been involved in a criminal incident, involving at least two others, where the requirement for continuity is met, are flagged as "potentially associated with a criminal organization." An arrow is directed from the sixth box to the seventh. The seventh box is titled “Seeking every criminal incident involving a ‘flagged' offender” and includes the text: all criminal incidents within Montreal from 2005-2009 are revisited to quantify all in which a flagged offender was involved; and all offences are categorized based on seriousness.
Across agencies, a total of 18 open ended questions relating to the identification and management of organized crime cases were asked. Officers in B.C. were asked an additional question relating to a specific figure of organized crime groups provided by the agency itself (Question 8, Appendix A), while officers in Quebec were asked an additional five questions relating to the standardization of organized crime definitions across agencies (Question 4), the allocation of resources (Question 17-19), and how non-organized crime units deal with organized crime incidents (Question 20). All questions were general in that they were relevant for a majority of respondents, but were flexible enough to be adapted to the situation of each respondent, thus taking into account their various positions, roles, and knowledge of certain topics. Although the same types of questions were posed in Quebec, and British Columbia, it is important to note that while agencies may share similarities, comparisons between the two agencies cannot directly be made, as law enforcement mandates, priorities, and agency resources differed across regions. Rather, the general aim in interviewing law enforcement officials was to obtain a thorough understanding of the variety of policing practices, in different regions, for combating organized crime. Within the context of this report, policing practices and policy for combating organized crime in Quebec is the primary focus, whereas, policing policy and practices in British Columbia is used as supplementary data.
| Agent | Province | Unit | Experience (years) |
|---|---|---|---|
| 1 | British Columbia | Organized crime/Gangs | 25 |
| 2 | British Columbia | Organized crime/Gangs | 14 |
| 3 | British Columbia | Organized crime/Gangs | 27 |
| 4 | British Columbia | Organized crime/Gangs | 13 |
| 5 | British Columbia | Organized crime/Gangs | 10 |
| 6 | British Columbia | Organized crime/Gangs | 25 |
| 7 | British Columbia | Organized crime/Gangs | 31 |
| 8 | British Columbia | Organized crime/Gangs | 34 |
| 9 | Quebec | Organized crime | 30 |
| 10 | Quebec | Morality | 25 |
| 11 | Quebec | Narcotics | 11 |
| 12 | Quebec | Narcotics | 24 |
| 13 | Quebec | Street Gangs | 24 |
| 14 | Quebec | Street Gangs | 11 |
| 15 | Quebec | Fraud | 23 |
| 16 | Quebec | Homicide | 23 |
| 17 | Quebec | Strategic Intelligence | 17 |
Service de Police de la Ville de Montréal (SPVM) Reports
Providing complementary information on police resources dedicated to responding to OC incidents in Montreal, SPVM reports for the years under study were consulted. In doing so, a more qualitative approach for analysing trends in organized crime in Montreal, as reported by the SPVM is conducted. Information derived from reports provides contextual information on the police department's overall budget and statistics on organized crime-related investigations.
The SPVM website was searched manually and Google searches were conducted with keywords similar to those used for the literature review. Footnote06 This resulted in the identification of four categories of SPVM publications deemed relevant: 1) Budget reports; 2) Annual action plans; 3) Annual reviews; and 4) a series of press releases entitled "Actualités Gangs de rue." Using SPVM's classification of organized crime as comprising three broad categories (criminal biker gangs, street gangs and what the SPVM labels "ethno-cultural" criminal groups - see SPVM Action plan, 2006, p. 5), documents were analyzed to extract relevant information on organized crime statistics, budget, and investigations (see Appendix B for a list of SPVM reports consulted).
Results
The description of results starts with a general overview of co-offending patterns in the data. The analysis of co-offending patterns in Montreal is consistent with prior literature: only 4.4 percent of all criminal incidents involved two or more co-offenders (11,417 of 256,722 incidents). The raw number of co-offending incidents increased in 2008/2009 (Figure 3), although the proportion of co-offending incidents remained relatively stable at around 4.5 percent over that time period.
The increase in the raw number of co-offending incidents was most noticeable for the least serious offences. Figure 3 presents the evolution of co-offending offences broken down by severity threshold: none (or all co-offences), as well as the broad and strict definitions. As expected, Figure 3 shows that only a minority of co-offending incidents are found when applying a more strict definition of offence severity. Montreal has around 400 of such incidents every year (see Figure 3). Much of the increase in co-offending incidents in 2008 occurs for the broad category of offences. For practical purposes, these offences typically have a wider range of minimum and maximum penalties meted out (low minimum, mid-range to high maximum), for example, offences such as identity theft, possession of weapon for dangerous purpose or assault with a weapon causing bodily harm.
It is also useful to consider the number of co-offenders per incident when assessing the potential for incidents to be classified as "organized crime." Of the 11,417 co-offences within Montreal, 76.2 percent involved two offenders (n=8,699), 15.4 percent involved three offenders (n=1,753), and 8.4 percent comprised groups of four or more offenders (n=965). As suggested by Figure 4, some incidents had as many as 30 and 40 offenders, but these were extremely rare. At the same time, over 2,700 incidents involved three or more detected offenders during the five years under study. As shown below, many of these incidents included co-offenders who appeared multiple times as a pair in the police database.
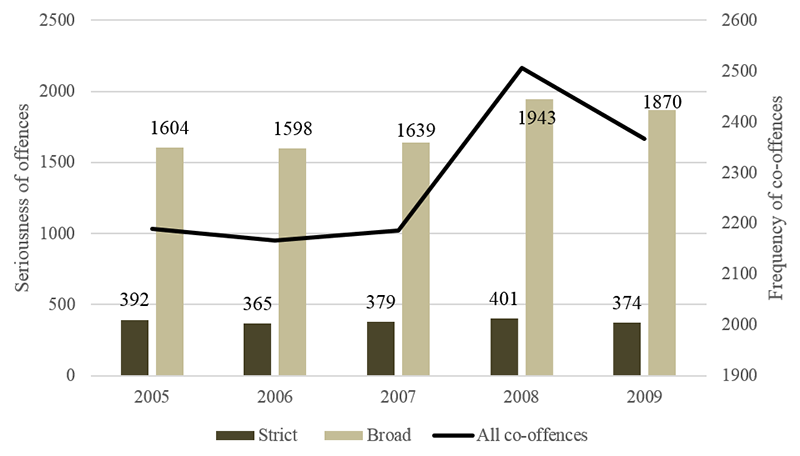
Image Description
Figure 3 is a bar chart describing the frequency of co-offences and seriousness of offences within Montreal, 2005-2009. From the left-hand side, the first two bars indicate that in 2005 in Montreal, there were 392 co-offences according to the strict threshold, and 1,604 co-offences according to the broad threshold. The next two bars indicate that in 2006 in Montreal, there were 365 co-offences according to the strict threshold, and 1,598 co-offences according to the broad threshold. The next two bars indicate that in 2007 in Montreal, there were 379 co-offences according to the strict threshold, and 1,639 co-offences according to the broad threshold. The next two bars indicate that in 2008 in Montreal, there were 401 co-offences according to the strict threshold, and 1,943 co-offences according to the broad threshold. Finally, the last two bars indicate that in 2009 in Montreal, there were 374 co-offences according to the strict threshold, and 1,870 co-offences according to the broad threshold. A trend line is hovering over all of the bars in the chart, representing all co-offences in Montreal between 2005 and 2009.
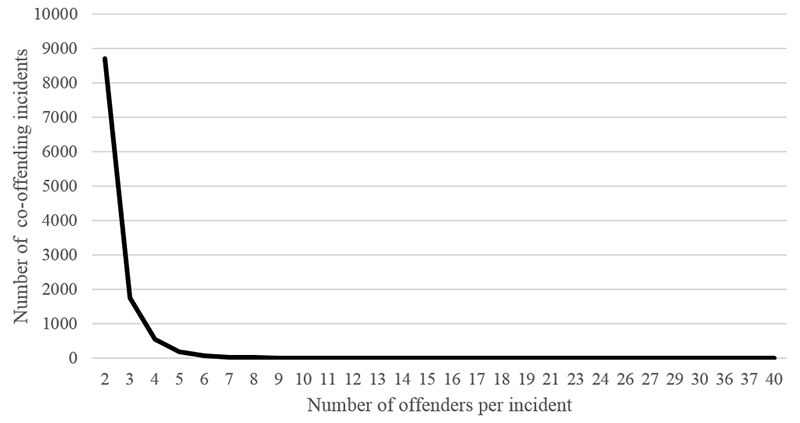
Image Description
Figure 4 is a line chart describing the number of offenders per co-offending incident within Montreal, 2005-2009 (n=11,417). The y-axis is titled “Number of co-offending incidents” and the x-axis is titled “Number of offenders per incident.” From the left-hand side, the graph indicates that between 2005 and 2009, in Montreal, there were 8,699 co-offending incidents involving 2 offenders; 1,753 co-offending incidents involving 3 offenders; 565 co-offending incidents involving 4 offenders; 196 co-offending incidents involving 5 offenders; 70 co-offending incidents involving 6 offenders; 40 co-offending incidents involving 7 offenders; 23 co-offending incidents involving 8 offenders; 9 co-offending incidents involving 9 offenders; 14 co-offending incidents involving 10 offenders; and less than 10 co-offending incidents for each grouping involving 11 offenders or more.
The Number of Organized Crime-Related Incidents
The numbers presented above do not take into account an important component of the official definition of a criminal organization, namely the continuity aspect. From the 11,417 co-offending incidents involving two or more offenders, 2,608 incidents where pairs co-offended more than once together were found. This represents 23 percent of all co-offending incidents in the data. These repeat pairs form the basis of what can potentially be considered "organized crime."
Table 4 breaks down the number of incidents potentially associated with organized crime based on the three families of models used in this study (wide net, standard definition, and post hoc models), and the three threshold levels (none, broad, strict) for considering the severity of each offence. Starting with the wide net model, the effect of going from no threshold to the broad one, and then to a more strict definition can be observed. There is only a small difference in the number of repeated pairs found when going from the no threshold (2,608) to the broad threshold (2,086). Yet, when applying Carrington et al.'s (2013) more strict definition of offence seriousness, the number of repeated pairs who would fall under this threshold drops to 447. The same phenomenon can be observed for the other two models.
| Wide net model (2 co-offenders) |
Standard definition model (3 + co-offenders) |
Post hoc flag model (all criminal incidents by people in the 3+ co-offender group) |
|
|---|---|---|---|
| None | 2,608 | 789 | 7,519 |
| Broad | 2,086 | 568 | 5,060 |
| Strict | 447 | 184 | 656 |
An important decrease in the number of repeated pairs considered is also observed when moving from the wide net to the standard definition model. Groups of three or more offenders who are detected for more than one criminal incident are more rare: the number of these groups ranges from 184 (strict) to 789 (no threshold) during the period under study. There are far more co-offences involving two offenders, than groups of three or more offenders in the data.
The post hoc flag model departs from the two others models, but considers all criminal incidents of individuals who at some point were found in the same group of three or more offenders at least twice between 2005 and 2009. While the number of incidents fitting the standard definition criteria is relatively low, these incidents involve a relatively large number of offenders, many of which appeared frequently as solo offenders in criminal incidents. For example, the no severity threshold model noted 789 incidents where three or more offenders were detected together at least twice for any crime in Montreal between 2005 and 2009. Yet, the 1,857 offenders involved in these 789 incidents accounted for many more during these years, 7,519 incidents in total. It can be imagined that many of these incidents are solo offences. Table 4 also suggests that many of these incidents are not serious: only 656 incidents involved flagged offenders under the strict definition of offence severity. In other words, the crimes that these flagged offenders commit, outside of the incidents for which they are detected with a continuous group, are relatively minor.
Are an increasing number of potentially organized crime-related incidents observed? The trend line in Figure 5 illustrates the number of incidents associated with repeat pairs over time while the bars display the trend based on total number of serious co-offences. On the left, the figure is based on the wide net model (2 offenders) whereas on the right, the figure is based on the standard definition model (3+ offenders, group offences). Much like what was observed for the total number of co-offending incidents in the first section of the results above, there is no noticeable trend for incidents that could involve criminal organizations, under either model. This is the case at any seriousness threshold level.
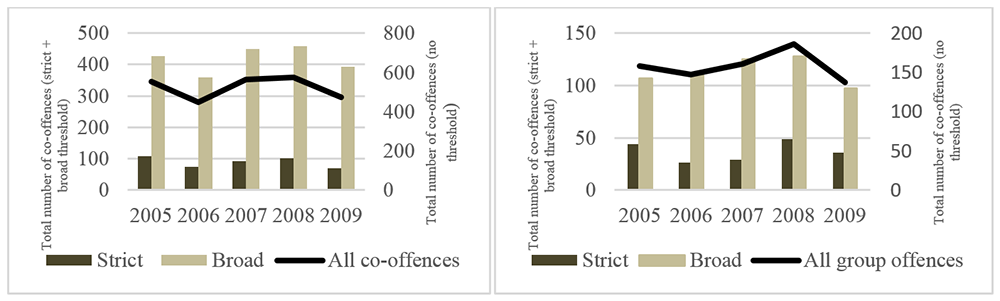
Image Description
Figure 5 is a side-by-side bar chart (one on the left and one on the right) titled “Wide net model (left) and standard definition (right): Frequency of co-offences potentially related to organized crime and seriousness of these offences within Montreal, 2005-2009”. Left-hand chart (Wide net model). From the left-hand side, the first two bars indicate that in 2005 in Montreal, there were 108 co-offences according to the strict threshold, and 426 co-offences according to the broad threshold. The next two bars indicate that in 2006 in Montreal, there were 75 co-offences according to the strict threshold, and 328 co-offences according to the broad threshold. The next two bars indicate that in 2007 in Montreal, there were 93 co-offences according to the strict threshold, and 450 co-offences according to the broad threshold. The next two bars indicate that in 2008 in Montreal, there were 102 co-offences according to the strict threshold, and 459 co-offences according to the broad threshold. Finally, the last two bars indicate that in 2009 in Montreal, there were 69 co-offences according to the strict threshold, and 393 co-offences according to the broad threshold. A trend line hovers over all the bars in the chart, representing all co-offences in Montreal between 2005 and 2009.
Right-hand chart (Standard definition model). From the left-hand side, the first two bars indicate that in 2005 in Montreal, there were 44 co-offences according to the strict threshold, and 107 co-offences according to the broad threshold. The next two bars indicate that in 2006 in Montreal, there were 26 co-offences according to the strict threshold, and 111 co-offences according to the broad threshold. The next two bars indicate that in 2007 in Montreal, there were 29 co-offences according to the strict threshold, and 125 co-offences according to the broad threshold. The next two bars indicate that in 2008 in Montreal, there were 49 co-offences according to the strict threshold, and 128 co-offences according to the broad threshold. Finally, the last two bars indicate that in 2009 in Montreal, there were 36 co-offences according to the strict threshold, and 97 co-offences according to the broad threshold. A trend line hovers over all the bars in the chart, representing all co-offences in Montreal between 2005 and 2009.
Estimating the Proportion of Organized Crime-Related Incidents
Up to this point, the raw number of incidents has been presented. Table 5 presents the proportion of organized crime-related incidents among all co-offending incidents (n=11,417) (not taking into account continuity). Using the standard definition model, the results provide a range of 1.6 percent (strict) Footnote07 to 6.9 percent (no threshold) of co-offending incidents fitting the definition of organized crime. If the wide net model threshold is used, the range is fittingly much wider: from 3.9 percent (strict) to 22.8 percent (no threshold).
| Seriousness or Offence Threshold | Wide net model (2 co-offenders) |
Standard definition model (3+ co-offenders) |
|---|---|---|
| None | 22.8% | 6.9% |
| Broad | 18.3% | 5.0% |
| Strict | 3.9% | 1.6% |
The logic of the post hoc flag model requires that the total number of criminal incidents in Montreal for 2005 to 2009 be used as the denominator, which provides numbers that are more modest. Table 6 displays a range of proportions that go from 0.26 percent to 2.93 percent when no thresholds are used.
| Seriousness or Offence Threshold | Post hoc flag model (all criminal incidents by people in the 3+ co-offender group) |
|---|---|
| None | 2.93% |
| Broad | 1.97% |
| Strict | 0.26% |
Organized Crime Offences by Crime Type
Does the involvement of groups fitting the definition of organized crime for the purpose of this study vary by type of crime? Table 7 shows the proportion of crime across criminal incidents involving solo offenders (n=245,305), co-offences comprising two or more offenders (n=8,809) and incidents potentially related to organized crime (n=2,608) exclusively. A distinction between co-offences and incidents potentially related to organized crime is that, in the latter category, the incident includes the continuity component, involving a pair of offenders who have offended in two or more incidents together. Generally, from 2005 to 2009, incidents involving two or more offenders, notwithstanding continuity, were most likely to be violent crimes, or property crimes in Montreal. This is in comparison to solo offences that primarily fall into the "all others" category, an amalgamation of various non-serious incidents, provincial or municipal offence related offences. For instance, whereas 45 percent of solo offences comprised other types of offences, followed by violent crimes (25%), co-offenders were equally involved in both property (34%) and violent offences (34%), whereas, 57 percent of incidents that could potentially be related to organized crime comprised property crimes, followed by violent crimes (22%). Across all incident categories, there was consistency in the number of offences involving drug possession and other market related offences. Amongst co-offending groups, however, there was also consistency in the frequency of offences involving fraud (4-5%).
| Solo offences (n=245,305) |
Co-offences (n=8,809) |
Incidents potentially related to OC (n=2,608) Footnote08 |
All Offences (n=256,722) |
|
|---|---|---|---|---|
| Violent crimes | 25% | 34% | 22% | 26% |
| Crimes against property | 16% | 34% | 57% | 17% |
| Fraud | 2% | 4% | 5% | 2% |
| Market - drug possession | 2% | 2% | 1% | 2% |
| Market - drug supply | 1% | 11% | 2% | 1% |
| Market - other | 9% | 7% | 9% | 9% |
| All others | 45% | 9% | 5% | 43% |
| Total | 100% | 100% | 100% | 100% |
Proportion of Crime Types across the Models: Wide Net, Standard Definition, and Post Hoc
The following tables show each of the three organized crime models developed in this study, aggregating crime types by the severity threshold.
First, consider the wide net model (Table 8) which narrows in on incidents potentially related to organized crime, in that, it involves two offenders who co-offended together at least twice in the period under study (n=2,608). When no severity threshold is applied, the results show that property crimes dominate the wide net model of organized crime, with 57 percent of criminal incidents falling in this category. This remains true with the broad definition of crime severity, where as many as 71 percent of criminal incidents fall in the property crime category. "Market other" offences, often involving non-traditional offences and substances are ranked second, with a proportion of ten percent, followed by violent crimes at eight percent. Things reverse completely when a strict definition of severity is applied to the wide net model: from eight percent, the proportion of violent crimes jumps to 91 percent. Property crimes fall to three percent, and drug supply offences go from two to three percent. The decision, then, to choose a "broad," or "strict" severity threshold when considering what falls under the umbrella of organized crime-related offences is far from trivial.
| Seriousness of Offence Threshold | |||
|---|---|---|---|
| None (n=2,608) | Broad (n=2,086) | Strict (n=447) | |
| Violent crimes | 22% | 8% | 91% |
| Crimes against property | 57% | 71% | 3% |
| Fraud | 5% | 6% | 0% |
| Market - drug possession | 1% | 1% | 0% |
| Market - drug supply | 2% | 2% | 3% |
| Market - other | 9% | 10% | 2% |
| All others | 5% | 3% | 1% |
| Total | 100% | 100% | 100% |
A very similar pattern is found for the standard definition model (Table 9) and the post hoc model (Table 10) – even if the latter changes the unit of analysis from the "crime group" to the "group crime offender." The standard definition model considers all group offences (3 or more offenders) with the element of continuity. Recall that the standard definition model, under the strict threshold, falls under the conventional 467.1 definition of organized crime. This model reveals that 91 percent of serious criminal incidents fall under the violent crime category. This result is similar to the strict definition under the post hoc model, which considers all, and any type of criminal offence a flagged group offender has been involved in within the city of Montreal. The second most prevalent serious crime category is drug supply, with seven percent of criminal incidents, leaving very few other incidents to other crime categories. When it comes to defining the activities of criminal organizations, if one is inclined to select strict severity thresholds (serious offences) the results suggest focusing in on violent offences and drug supply (to a lesser extent).
| Seriousness of Offence Threshold | |||
|---|---|---|---|
| None (n=789) | Broad (n=568) | Strict (n=184) | |
| Violent crimes | 31% | 13% | 91% |
| Crimes against property | 42% | 58% | 2% |
| Fraud | 4% | 5% | 1% |
| Market - drug possession | 1% | 1% | 0% |
| Market - drug supply | 4% | 5% | 4% |
| Market - other | 12% | 16% | 1% |
| All others | 6% | 2% | 1% |
| Total | 100% | 100% | 100% |
| Seriousness of Offence Threshold | |||
|---|---|---|---|
| None (n=7,519) | Broad (n=5,060) | Strict (n=656) | |
| Violent crimes | 18% | 15% | 91% |
| Crimes against property | 34% | 51% | 1% |
| Fraud | 2% | 3% | 0% |
| Market - drug possession | 3% | 5% | 0% |
| Market - drug supply | 2% | 2% | 7% |
| Market - other | 15% | 5% | 0% |
| All others | 25% | 18% | 1% |
| Total | 100% | 100% | 100% |
Notes
- Considers all incidents within the city of Montreal involving a flagged offender (n=256,722).
Where Do Organized Crime Offenders Fit in the Larger Criminal Scene in Quebec?
This analysis aims to situate all of the offenders who were found in a repeat pair in the larger criminal scene in Quebec. Situating organized crime offenders within the wider provincial population of co-offenders is crucial as it offers an assessment of the opportunity structures available to such offenders within and beyond the Montreal context. It describes how connected Montreal OC was to the rest of the criminals in the province. To assess the network positioning of organized crime (OC) and non-organized-crime (non-OC) offenders, the current Montreal-based subpopulation results were situated within the more general Quebec-based co-offending population that was the focus of analysis in a recent study by Morselli, Grund, and Boivin (2015). In that prior study, co-offenders were divided into three separate groups: 1) the top five percent of co-offenders with the most co-arrests (the 'core'); 2) co-offenders beyond the core that were directly connected by co-arrests to core members (the 'periphery'); and 3) the remaining population of co-offenders who were neither part of, or directly connected to the core (the 'mass').
Table 11 compares the two sub-samples on a number of characteristics available in police data for all of Quebec. It can be observed that OC offenders were slightly younger than non-OC offenders were. Males were also more likely designated as OC offenders. The most important distinctions, however, were found when examining the network features of these two groups. Individuals that were classified as OC offenders were much more likely to be part of the core or periphery segments of the wider Quebec-based co-offending population than the remainder of the Montreal based offenders. Overall, 23 percent of OC offenders were part of the core segment of the provincial co-offending network (compared to only 5% for non-OC offenders). In addition, 26 percent of the organized crime cases were part of the periphery of the provincial network (compared to 13% for non-OC offenders). Thus, roughly half of these OC offenders are either part of the core subpopulation of the most connected offenders (based on co-arrests) in the province or directly connected to that core. Finally, OC offenders had twice as many co-offending contacts (four versus two) than non-OC offenders.
| OC Offenders (n=2,192bb) | Non-OC Offendersc (n=154,908) | Together (n=157,100) | |
|---|---|---|---|
| Demographic features | |||
| Mean Age | 25.3 y | 27.7 y | 27.7 y |
| Sex (% Male) | 85.4% | 78.0% | 78.1% |
| Network features | |||
| Core | 23.3% | 5.1% | 5.3% |
| Periphery | 26.2% | 12.7% | 12.9% |
| Degree centralityd | 4.0 | 2.0 | 2.1 |
Notes
- All comparisons are significant at p<.001
- For this analysis, only offenders found in a repeated pair were used as the baseline for matching offenders in the Morselli et al. (2015) dataset (n=2,192). In doing so, 271 of the 2,463 co-offenders found in the Montreal MIP dataset could not be matched with offenders in the Morselli et al. (2015) dataset. This led to a final sample size of 2,192 co-offenders, comprising offenders in both datasets.
- The "non-OC" designation is based on the logic of the current report. The subsample includes no OC offenders from Montreal, but includes an unknown (yet small) proportion of OC offenders from the rest of the province.
- Degree centrality refers to the number of connections criminals have to other criminals in a given network.
Table 12 presents the same demographic and network features for the Montreal-based subpopulation. Overall, distinctions between OC and non-OC offenders are similar as for the larger provincial population. The age gap is slightly wider, with Montreal-based OC offenders being about four years younger than Montreal-based non-OC offenders are and about a year younger than OC offenders within the provincial population are. Males continue to be more prominent. As for the network features, Montreal-based OC offenders are slightly less represented in the core and peripheral segments of the Quebec co-offending network, however, their higher presence in these segments of the network remain substantially higher when compared to non-OC offenders. As for the volume of direct contacts within the provincial co-offending network, OC offenders continue to double non-OC offenders in their degree centrality—note that the degree centrality of Montreal-based OC offenders is slightly lower than for OC offenders identified in the entire provincial population.
These analyses offer some face value validity to analyses in the preceding sections: the offenders considered as potentially part of criminal organizations under the Criminal Code definition are indeed more likely to be key players in the Quebec organized crime scene.
Police Resources to Combat Organized Crime
Estimating police resources allocated to combating organized crime requires going beyond assessments of the number of organized-crime incidents and looking at how resources are prioritized and shared within a police service. With a fixed budget, law enforcement officials cannot investigate all organized crime (OC) related incidents; rather they allocate resources based on the nature and frequency of incidents. Interviews with law enforcement officials in Quebec provides a means to examine how law enforcement prioritizes OC-affiliated incidents and the degree to which resources (measured by the number of police officers) are allotted to directly combating OC.
| OC Offenders (n=1,721) | Non-OC Offenders (n=18,828) | Together (n=20,549) | |
|---|---|---|---|
| Demographic features | |||
| Age | 24.8 y | 28.3 y | 28.0 y |
| Sex (% Male) | 84.7% | 79.3% | 79.8% |
| Network features | |||
| Core | 21.3% | 4.3% | 5.7% |
| Periphery | 25.8% | 11.4% | 12.6% |
| Degree centrality | 3.8 | 2.0 | 2.1 |
Notes
- All comparisons are significant at p<.001
Prioritization of Incidents
According to interviews with law enforcement officials, distribution of resources within units depends on three main factors: 1) risk to public safety; 2) certainty of charges; and 3) outcome of charges. Law enforcement officials stressed that incidents that threatened public safety, such as violent offences or offences that occurred near vulnerable populations (e.g. daycare or long-term care facilities) were given priority. Also influencing the degree to which resources were allotted to incidents were the certainty and outcome of charges. To assess the certainty and outcome of charges, law enforcement typically relied on intelligence obtained from informants (Agent 10):
The better the information, the more likely that the case will happen (…) If informant A is closer and gives us more information than Informant B for another case, then Informant A is where the case will go first. This makes sense—you want to save your manpower and resources and you can validate your time.
With a limited number of police hours allocated to each unit, budgets are planned efficiently; dedicating resources to investigations that will not only result in charges, but will also have the greatest impact.
These factors (risk to public safety, as well as certainty and outcome of charges) assist law enforcement in determining whether responses to incidents would range from 'quick shots' (essentially one day investigations, such as a 'buy-and-busts'Footnote10), short-term (one to two months), medium-term (three to six months), and long-term (one to two years) projects. Quick shots typically involved street-level players, while short-term and medium-term projects aimed to target middle players, such as offenders involved in the fabrication of stolen identity or distributors of large quantities of drugs. Given the extensive resources required for long-term investigations (e.g. surveillance and wiretaps), these were typically only conducted by the Organized Crime and Homicide divisions, sometimes in collaboration with provincial (Sûreté du Québec) or the Royal Canadian Mounted Police (which acts as a purely Federal police force in Quebec). Thus, both the nature of the incident and the unit tasked with investigating the incident influences the length and nature of the investigation.
Resources
Across the interviews, law enforcement officials consistently stated that "man-power" or the number of hours required to investigate organized crime incidents represented the greatest cost of responding to OC. Resources such as technology and surveillance equipment are shared across units. As a result, officers did not consider these as fixed costs when calculating responses to organized crime incidents. Rather, the nature of organized crime incidents, involving fewer cooperative witnesses and more sophisticated tactics, requiring human surveillance to acquire and corroborate evidence. This was echoed across units, with the narcotics and street gang divisions emphasizing that the number and scope of organized crime investigations per year determines the number of overtime hours allocated to their units.
Assessing the number of law enforcement officials allotted to combating OC requires distinguishing between law enforcement officials who deal exclusively with OC incidents and those who come across both OC and non-OC affiliated incidents in their work. Only one unit within the SPVM, the Organized Crime Division (DCO), deals exclusively with cases that involve criminal organizations as defined under section 467.1 of the Criminal Code, that is, involving non-random groups consisting of three or more persons involved in committing serious crimes for material benefit. This unit is supported by intelligence and specialized patrol teams that assist in guiding and supporting investigations, such as the Strategic Intelligence unit and Éclipse (Équipe Corporative de Lutte d'Intervention et de Prévention face aux situations Émergentes). In contrast, other units within the SPVM, including street gangs, narcotics, proceeds of crime, and fraud, come across a high number of incidents that involve OC members but are not solely dedicated to these cases.
The Organized Crime Division (DCO) consists of approximately 30 to 35 officers who are divided into three teams of roughly ten individuals. Each team works on at least one case per year, with investigations typically ranging from six months to a year. Thus, at any time, the DCO is generally working on three separate files related to OC, with all their investigations typically examining high-ranking OC members. However, even as a dedicated organized crime unit, the DCO emphasized that they are limited in their capability to charge all members of the organization, with investigations typically resulting in the arrest of three to five OC members across one incident. Further, costs for investigating organized crime may be higher within the DCO than in regional units. As a daytime division, any surveillance that is conducted during evenings requires overtime hours, a frequent occurrence in organized crime investigations. The length of OC investigations that target high-level OC members also frequently requires the use of wiretaps, which requires additional police strength.
Investigating organized crime the DCO does not work in isolation, relying heavily on Strategic Intelligence and Éclipse to build a case. A team of approximately 23 analysts and intelligence officers are tasked in Strategic Intelligence with following, understanding, and reporting on criminal organizations within Montreal and their links to the rest of Quebec. These units contribute to the flagging of criminal organizations, systematically going through serious incidents to identify patterns across offenders of organized crime groups. These files are shared with the DCO and used to help establish links between offenders and tactical responses to combat OC. The Strategic Intelligence unit is complemented by Éclipse, a specialized patrol unit of approximately 70 law enforcement officials who are tasked with night-time surveillance in bars and other areas frequented by OC members in Montreal. Intelligence acquired by Éclipse is then compiled and disseminated as a resource across units. Combining the DCO, Strategic Intelligence and Éclipse units provides a rough estimate of over 100 police officers within the SPVM that play major roles in organized crime cases.
Going beyond personnel dealing exclusively with OC incidents provides a more accurate assessment of police resources dedicated to combating this phenomenon. Law enforcement officials involved in street gangs, narcotics, proceeds of crime, and fraud units all reported that the majority of cases they deal with are organized crime-affiliated, either directly involving organized crime members or involving affiliated individuals in the lower-ranks of criminal organizations. For instance, the street gang unit, consisting of roughly 32 officers reported regularly dealing with street gang members affiliated to organized crime groups. The street gang unit stressed that many of the individuals they dealt with were implicated in OC groups doing their 'dirty-work.' Comprising a slightly larger unit, the narcotics unit, consisted of approximately 43 police officers across Montreal. According to law enforcement, the majority of drug-trafficking incidents they dealt with were organized crime-related, with sellers often obtaining illicit products from organized crime members. This was echoed by the proceeds of the crime unit, which consisted of approximately 20 law enforcement officials that regularly deals with financial proceed incidents linked to criminal organizations. Lastly, the fraud division consists of roughly 25 law enforcement officials; however, they differ from the above units in that the incidents they deal with involve victim complaints. According to the respondent, most complaints comprise offences that involve groups of three or more offenders who commit a series of offences over time, and thus are candidates for section 467.1 of the Criminal Code.
In contrast, homicide and morality units found that only a fraction of incidents they dealt with were related to organized crime, although this could fluctuate from year to year. Homicide consists of 20 investigators along with a supervisor and analyst. Respondents reported that organized crime-related homicides came in waves and were unpredictable, with some years consisting of many OC-affiliated incidents and others none. Respondents (from both provinces) emphasized that OC homicides typically require more resources, as they are done more professionally, usually lacking witnesses. The morality, alcohol and narcotics unit consists of approximately 15 to 20 officers across Montreal; however, respondents stressed that only a fraction of incidents they dealt with involved organized crime.
Combining estimates across units with mandates to only combat OC and those that deal primarily with OC incidents, suggests that there are approximately 250 law enforcement officials at SPVM who are directly involved in combating OC. Of these, 100 core officers are involved in long-term investigations that target upper-level OC members, whereas the remaining 150 officers are more likely to be involved in cases that target lower- to medium-level members, reflecting their limited resources to conduct long-term investigations. The limitations of these estimates should be emphasized. In particular all estimates of law enforcement officials are approximates 1) only reflecting responses obtained from a sample of SPVM law enforcement; 2) they are unrepresentative of all units that come across organized crime-affiliated incidents, excluding patrollers who are exposed to these incidents; 3) the number of law enforcement officials within each unit may fluctuate according to budget constraints; and 4) police strength as measured by the number of officers is not necessarily indicative of 'true costs' as it does not account for the distribution of overtime hours across units or other financial costs associated with investigating OC.
According to official SPVM police reports from 2005 to 2009 the SPVM had an average of 4,482 police officers and 1,531 civilians. In 2005, the SPVM had a total of 5,690 police officers and civilian employees, increasing by 6 percent in 2009 to 6,202 employees (Figure 6). While very little detail regarding the proportion of the budget or police officers allocated to investigate and combat organized crime were disclosed in the budget, information acquired from interviews suggested that only a fraction (approximately 250) of these personnel are directly involved with organized crime incidents.
Corresponding to the increases in the number of police officers and civilian employees used for operational support were concurrent increases to the budget for each year. Reports on the total expenditures of the SPVM annually demonstrate that salaries to law enforcement officials increased annually. The proportion of salary increases, however, was always relative to the overall budget, representing 88 percent of SPVM's total expenditures. In sum, total expenditures increased every year from approximately $468,429,300 in 2005 to $587,840,800 in 2009, representing a 20 percent increase over a five-year period.
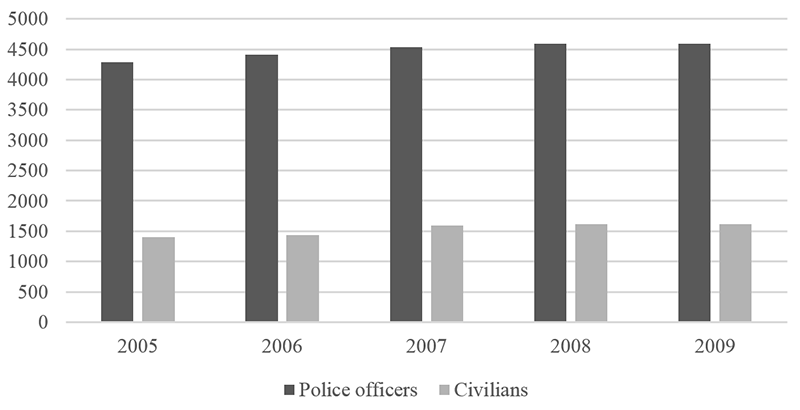
Image Description
Figure 6 is a bar chart describing the number of police officers and civilians at the SPVM, 2005-2009. From the left-hand side, the first two bars indicate that in 2005 in Montreal, there were 4,289 police officers and 1,401 civilians employed by the SPVM. The next two bars indicate that in 2006 in Montreal, there were 4,408 police officers and 1,432 civilians employed by the SPVM. The next two bars indicate that in 2007 in Montreal, there were 4,530 police officers and 1,591 civilians employed by the SPVM. The next two bars indicate that in 2008 in Montreal, there were 4,594 police officers and 1,616 civilians employed by the SPVM. Finally, the last two bars indicate that in 2009 in Montreal, there were 4,588 police officers and 1,613 civilians employed by the SPVM.
SPVM Organized Crime Investigations, 2005-2009
Each year the SPVM publishes reports that highlight selected high-profile investigations that targeted criminal organizations and street gangs (Appendix C). These projects provide an indication of the resources required to conduct long-term organized crime investigations. In total, the SPVM reported 32 operations that aimed to combat organized crime from 2005 to 2009. While trends across time cannot be made (as these represent only the investigations that were selected to be highlighted within the SPVM report, and are not representative of trends), it is notable that 56 percent (n=18) of these occurred in 2009. Across investigations and specialized teams, the number of arrests ranged from a single arrest to 1,529. Further, while the number of police personnel was not provided for most investigations, some operations were stated to involve approximately 700 officers, including Project Colisée in 2006 and Project Axe in 2009, indicative of the amount of "police strength" needed to combat organized crime. Projects provided in annual reports only cover selected high-profile investigations conducted across regional and specialized units within the SPVM.
Project Axe was highlighted in interviews as one of the most successful OC investigations in the interviews for its ability to take down three poly-drug trafficking networks that distributed cocaine and marijuana in Montreal and neighboring cities. Over a two-year period, more than 700 police personnel were involved in gathering intelligence and evidence across three targeted criminal organizations: the "Syndicates" (a group affiliated with the Hells Angels), a street gang, and a criminal group operating in South-west Montreal. The investigation was conducted by "l'Unité mixte Sans frontières," an integrated unit that consists of law enforcement officials from SPVM, RCMP, SQ, Laval, and Longueuil (Desjardins, 2009). Over the two-year time span, law enforcement officials collected over 50,000 pages of wiretapped conversation (La Presse, 2009), hired a full time confidential informant, and conducted numerous hours of human and video surveillance. The investigation led to the arrests of 55 individuals implicated in the drug trafficking networks including the alleged leaders and a lawyer for the network. While the investigation spanned two years, the number of resources dedicated to charging and prosecuting these individuals extended beyond the investigation, with the involvement of law enforcement officials providing evidence in criminal trials that lasted over two years.
A Case Study: Using Interviews to Assess the Resources Associated with Policing Organized Crime in British Columbia
Across initiatives, the resources invested, whether it comprises financial resources, or human resources such as police strength, operational or civilian staff allotted to each investigation varies. According to law enforcement officials interviewed, shorter investigations range from two to six months, mid-level investigations range from six months to a year, and longer investigations last anywhere from one to two years (excluding disclosure phase and any time in courts). Investigations solely focusing on drugs, or drug-related crimes, tend to be shorter, whereas, investigations that involve multiple individuals, intersect several crime types, or spread into several jurisdictions tend to be longer. In carrying out an investigation and preparing an operational plan, law enforcement officials in charge of finances, planning and procedures stated that they consider variables such as: risk to public safety; information available to pursue the investigation (police agent, informant); size of the operation; the nature and size of the groups involved; and the sophistication of the group. These variables are then used as indictors for projecting how long an investigation will last, and how much financial and human resources are needed to pursue the operation.
Law enforcement officials interviewed suggested that investigations that involve bigger organized crime groups cost more financially, and require various types of resources as opposed to investigations involving smaller organized crime groups. One agent stated that with smaller groups, the level of sophistication needed to coordinate a crime is not as developed, or as complex as with a larger sophisticated crime group; hence the length of time that the investigation lasts will be shorter, with a greater probability of arrests. Another agent noted the acceleration in human and financial resources needed to investigate violent offences involving organized crime groups. These investigations are costly as they: 1) put the public at risk, thus more resources have to be invested, and programs are implemented to keep the public safe (bar watch programs implemented by units such as the Integrated Gang Task Force, a dedicated unit committed to policing organized crime, and gang violence in British Columbia, with similarities to Éclipse in Montreal; media releases; public warnings); 2) the violence that follows could potentially lead to another type of crime; and 3) may involve multiple offenders and groups. As a result, there is a push by the public, and an urgency by law enforcement officials to investigate violent offences by allocating as many resources as available.
Respondents were asked about an example of an investigation that could demonstrate "best practices" in handling organized crime files. Project E-Paragon was mentioned by many. In 2006, over 200 officers from the Organized Crime Agency of British Columbia, the Royal Canadian Mounted Police, and ten municipal police forces were involved in dismantling an organized crime ring (Ivens, 2006). The Project dubbed E-Paragon was a 14-month investigation into the "biggest criminal conspiracy in B.C." (Ivens, 2006). Various crime groups, across eight countries, were involved in selling and distributing drugs and money laundering. Over the course of the 14-month investigation, 168 million dollars' worth of drugs were seized, over 40 search warrants were executed, with dozens of individuals charged in Canada, United States and Australia (Ivens, 2006; Bolan, 2008). It was anticipated that 100 individuals would be indicted worldwide, requiring cooperation from the United States Drug Enforcement Agency (DEA) and Australian Federal Police (CFSEU-BC, 2007). To conduct an investigation that is similar to Project E Paragon, law enforcement officials interviewed stressed the need for both a uniform component and a tactical component. An investigation this complex would require a team of full time investigators, a support team of analysts, operations staff, surveillance experts (wiretap analysts, photo surveillance etc.), and cooperation from law enforcement agencies around the world. On the other hand, a shorter investigation, they suggested, such as E-Paravail would differ in the amount and type of human and financial resources allocated to it. E-Paravail was a joint investigation involving several RCMP units, and the CFSEU (Combined Forces Specialized Enforcement Unit) in a smaller city in British Columbia, Canada (CFSEU-BC, 2012). The investigation lasted two months, leading to charges on 30 offences including drug trafficking, possession of stolen property, and weapon offences, the execution of six search warrants in five residences, seizure of large quantities of cash, and six arrests. Due to the nature of the incident (primarily drug related), the location (confined to a smaller city in British Columbia), and the relative number of accused involved (six), E-Paravail would naturally be shorter in length, and require fewer human and financial resources.
Additionally, after an investigation is concluded, the costs associated with disclosing the evidence and recommending charges to the Public Prosecution Service of Canada lays with the realm of the law enforcement agency. Particularly, in the Supreme Court of Canada ruling, R. v. Stinchcombe, it was ruled that the "fruits of the investigation" are property of the public. Footnote11 In order to ensure that justice is done, Crown has a legal duty to disclose all relevant information to the defense in a timely manner, and without unreasonable delay. Disclosure is a vast undertaking for law enforcement agencies, requiring the production of documents, transcripts and translation of texts. These documents are all to be guided by a general principle that respects the rules of privilege by protecting the identity of informants, or sensitive material.
For instance, in 2005, the RCMP launched an initiative dubbed E-Peccant (RCMP, 2013). The initiative, comprising a special task force, was formed to investigate seven murders that took place in the Northern Okanagan region in British Columbia, Canada over the course of 11 months (2004 to 2005). In 2006, five individuals linked to the Greeks gang were charged, and arrested for a number of these murders (Bolan, 2012). The Greeks, at their peak, were described as the largest distributors of cocaine in Vernon, British Columbia, with alleged links to the Hells Angels in Calgary and Kelowna, and the United Nations gang in the Greater Vancouver Area (RCMP, 2013). The trial began in May 2011, six years after the launch of E-Peccant, and lasted for 19 months (Bolan, 2012; RCMP, 2013). During the course of the trial, the jury heard testimony from over 100 Crown witnesses; almost 4,000 exhibits were logged for the Crown, with disclosure consisting of interview transcripts, statements, documents, and vetted evidence (RCMP, 2013). The Greeks trial has been described as the longest jury trial in British Columbia history involving 25 lawyers, law enforcement units from all over the province, and volumes of disclosure (Bolan, 2012).
Discussion
The research design guiding the current report was intended to provide a series of estimates and general outlooks on the scope and structure of organized crime in Canada. Whether in terms of the size of the organized crime population (as measured by detected incidents or individuals), the resources allocated to such estimates, or expenditures invested for such objectives, the state of the evidence regarding organized crime measures and control efforts is both messy and inconsistent. The general aim driving this report was to take a first step toward the creation of a more coherent and accessible crime analysis framework. It should be noted that there are limitations to the current methodology, and more work is needed to approach the level of confidence needed to make, for example, concrete recommendations regarding funding, or resource allocation. While the current study relies exclusively on the Quebec and Montreal settings, the framework is applicable to any region and city for which similar data sources are available. This latter point is crucial in that a key issue inspiring the overall study was the creation of a uniform analytical scheme that may be used to resolve current clashes in measurement and methodology problems across Canadian law-enforcement and criminal intelligence agencies. Based on data and qualitative material derived directly from law-enforcement settings, it is our contention that the current report will directly serve as a guide for law-enforcement analysts and decision makers across the country.
Focusing specifically on the Montreal case for the current report also allows to pursue the study's main research questions and scrutinize the proposed methodology in what may be described as an ideal setting. This is so for the city's crime scene and the social control agencies surrounding it. Montreal has traditionally been identified as a pivotal point for smuggling, trafficking, and other forms of crime generally associated with organized crime. While the city has distanced itself from the crime capital designation that marked it during the 1960s and 1970s, the criminal opportunity structure offered in Montreal makes it a continuous convergence setting for offending groups to form, cultivate, and, if left minimally detected (or undetected), to expand. The use of co-offending data derived from yearly arrest reports on individual incidents and offenders is arguably the most appropriate and available source for reconstructing this criminal opportunity structure. Much of the Montreal organized crime scene is also directly affected by the law enforcement agencies that have upped the ante over recent years in the control of this phenomenon. Served by the SPVM, but with consistent collaboration from the SQ and RCMP, data is extensive and consistent when it comes to crime markets and more general co-offending trends. The threat perception toward organized crime was clearly heightened during and since the biker conflict that took a prominent place in the province, and particularly Montreal, during the late 1990s and early 2000s (Morselli, Tanguay, & Labalette, 2008). This has translated into organized crime containment becoming a principal concern when allotting funds for general crime control. Interviews with law enforcement officials in B.C. illustrated that the province of Quebec and Montreal stand out as exceptions when it comes to organized crime control on the Canadian scene because of Quebec's success in prosecuting organized criminals after the biker conflict (Morselli et al., 2008). An inquiry into the matter noted that the SPVM budget might be larger in comparison to other cities. According to law enforcement officials in B.C., Quebec's early success in dismantling organized crime groups generated the public's support, in return, the public's confidence in law enforcement led to great allocation of human and financial resources for investigating organized crime.
The result of this more intense and consistent monitoring of organized crime in the city is best illustrated by the rigour with which the local and provincial law-enforcement entities keep track of anything that is perceived to be linked to organized crime and also by the strong trend to hire trained civilian analysts since the late 1990s. The mix of consistent data and competent managers of such data has led an evidence-based policing context that is probably second to no other agency. The collaboration setting is also marked by ongoing relationships between researchers and law enforcement executives and analysts working within the Montreal setting. This special bridge between the university and the police unit has arguably been the best in the country over the past two decades. This ongoing collaboration is also at the root of the empirical material supporting this report's main findings.
The collaboration between researchers, law enforcement and analysts has led to the creation of tools and techniques for an evidence-based approach to policing. However, the challenge in developing cost-efficient measures to respond to OC lies in applying this intelligence-led policing framework to investigations in the field. For instance, in Montreal, respondents stated that prioritization and initiation of investigations relied on both the certainty and outcome of arrest, two factors which typically depended on information derived from informants. Informants may be effective as a quick means to making an arrest, or targeting a select few. Nevertheless, relying solely on police sources creates a reactive approach, with enforcement officers responding to informants requests and structuring their budgets and investigations around them. The implications of this strategy lies in the issues that are missed (i.e. those incidents and offenders that are not in the direct purview of a select few informants) and a non-systematic application of investigators' experiences and intelligence from previous or ongoing cases (also see chapter 9 in Morselli, 2009). This issue is recognized internally by Strategic Intelligence in Quebec who have created a pro-active approach to investigating OC incidents. Analysts conduct systematic analysis across all OC affiliated offenders and serious events to identify patterns and ties between offenders in order to prioritize and target the most serious threats; however, the challenge lies with bridging these analyses to initiate investigations, rather than relying on them only after investigations have begun.
Additionally, in applying intelligence based policing, British Columbia has specialized units such as the Integrated Gang Task Force, Integrated Homicide Units, and the Combined Forces Specialized Unit (CFSEU), a support agency that integrates officers and departments from all over the Province. Footnote12 These units use and share intelligence with one another to begin and continue investigations. These agencies, however, are also reactive, as officers noted. In other words, even though law enforcement agencies do practice intelligence based policing by implementing certain community programs, and "gang watch" initiatives, their job, for the most part, is to react to priority cases, whether these priorities are identified politically or from strategic analyses. While law enforcement agencies in Quebec and B.C., have generated success with actively investigating gang-related, and organized crime cases, collaboration with researchers would further enhance this level of success both in their investigations, and post investigation. For instance, an agent in B.C. noted the lack of success in using section 467.1 in B.C. was because 467.1 would "simply fail in court." Thus, to pursue section 467.1, there not only needs to be cooperation from Crown Counsel, but there exists a greater need for expert testimony on the nature of organized crime, and criminal organizations during court proceedings.
The main challenge that had to be overcome in designing the research was deciding on a basic definition of organized crime and selecting the repertoire of criminal activities that would fall under its guise. Past research and conceptual attempts at defining organized crime have been notorious failures. If there is one feature that hinders the scientific study of organized crime it is the myopic manner in which experts have consistently approached the phenomenon in their own unique and short-term manner with little (or no) regard for a collective effort to arrive at a uniform definition of the main subject at hand. Such experts prevail as much from scholarly institutions as they do from governmental and policy settings. The failure to arrive at a consensual definition of organized crime has also led to irregular control efforts and questionable legislative constructs that span across countries. Section 467.1 of the Criminal Code of Canada is no exception in this regard (Desroches, 2013). Having opted for an inclusive formulation of a criminal organization has clearly placed Canada in line with previous and subsequent countries that sought more flexible strategies for containing organized crime. At the same time, expanding the parameters of the phenomenon for the sake of control efforts may also lead to serious collateral damages that extend from such judicial imprecisions (see Naylor 1997).
The approach followed in this report was meant to relativize the broad conception of organized crime in the Canadian legal context. To do so, three standards were constructed to provide a range of estimates that vary in accordance with the number of offenders participating in a criminal incident (or sequence of criminal incidents), the seriousness and types of crimes that are included in the definition, and the relational features that unite co-offenders directly or indirectly during a crime commission process. The three models proposed and tested in the study ranged from a wide to strict perception of the problem at hand. The wide net model was based on the fewest number of co-offenders (two). The standard definition model followed section 467.1 most closely with the inclusion of three or more co-offenders. The post hoc flag model was based on a more complex construct in which offenders that were identified in the standard definition model were flagged and subsequently traced for any other co-offending or non-co-offending offences for which they were arrested—this resulted in a more sophisticated representation of the criminal opportunity structure generated by these OC-labelled individuals. These three models were subsequently gaged in accordance with three offence classification options. Once again, the classification spanned the most inclusive to the most exclusive scenarios, with the first threshold integrating any crime, the second 'broad' threshold comprised of crimes that were a closer fit to the predicate crimes stated in section 467.1, and a third 'strict' threshold that included serious offences as determined by sanctions of five years or more.
This strategy of combining models that vary the co-offending unit size and form with thresholds that vary the types of crimes that are integrated in the definition is consistent with the main discrepancy dividing scholarly and policy assessments of organized crime. While the former have been traditionally restrictive when defining organized crime, the latter have been generally inclusive. This break between these two distinct settings that converge in the study of organized crime can be traced to as early as the onset of the RICO statutes in the US, the main inspiration for Canada's section 467.1 and for criminal organization or criminal enterprise statutes across the world. RICO was designed to be flexible and interpreted liberally (see Blakey, 1994 for a defence of this feature; see Lynch, 1990; Naylor, 1997; and Morselli & Kazemian, 2004 for more critical assessments). What the current approach offers is a complete overview of what one should expect in terms of the population size and proportion of incidents linked to organized crime across all variations. The differences in estimates are indeed telling and such an effort to sort the people, co-offending instances, and crimes that may be associated to organized crime proved to be very effective. When it comes to distinctions between the broad and strict categorization of criminal activities, the former trend shows some variation across a five-year period while the latter remains stable. When it comes to the combinations of the three models and thresholds that were devised for this report, one stands out in particular. The representation of organized crime that emerges from the broad threshold (wide net model, n=2,086, or 18.3%; standard definition, n=568, or 5.0%) is vastly different from that obtained from the strict threshold (wide net model, n=447, or 3.9%; standard definition, n=184, or 1.9%)—as indicated by the counts, these variations occur no matter which model was used. This was less a matter of the numbers involved and evidently due to the nature of offences included in each model, as was illustrated quite clearly in the assessment of crime-type distinctions as well. For instance, amongst the broad definition of crime severity, under the wide net model, as many as 71 percent of criminal incidents fell in the property crime category, but reversed when a strict definition of severity was applied, from eight percent, the proportion of violent crimes jumped to 91 percent. A very similar pattern was found for the standard definition model and the post hoc model. In reference to the standard definition model, 91 percent of violent criminal incidents fell under the strict threshold as opposed to the broad threshold where property crimes peaked at 58 percent. With the post hoc flag model, the proportion of property crimes peaked from 51 percent, under the broad threshold, to a peak in violent offences at 91 percent, under the strict threshold. From a law enforcement perspective, if the inclination is to focus on the most serious offences (strict threshold), under any model, focusing in on violent offences should take precedence, as it seems to be the most prevalent. These findings are parallel to the mandates posed to the law enforcement agencies within British Columbia and Quebec. Within both of these agencies, their mandates, to an extent, were to focus on violent offences involving criminal organizations, or crimes that pose the most risk to public safety. The findings within this report mirror these concerns, demonstrating that the most serious offences, whether it involved two, three or flagged offenders, were likely to be violent crimes, potentially causing the most risk to public safety.
One extension of this key point is the creation of a new classification that would situate the likelihood that a group phenomenon is (or is not) organized crime. One approach to this could be a tripartite classification that varies from co-offending groups that are: 1) purely non OC; 2) mid range/crime groups; and 3) criminal organizations. Mid-range crime groups are represented in the difference between the wide net and standard definition models and they could be comprised of an assortment of continuous, semi-serious crime groups. Such groups may not be criminal organizations, but they matter considerably because their offences require more resources than others to deal with. However, from a law-enforcement costs perspective, such mid-range groups are not in the same league as criminal organizations (see below). Several law enforcement officials interviewed noted contextual differences between mid-range groups and criminal organizations. For instance, in B.C. an officer noted that groups of criminals who co offend together are problematic as they are a risk to society, and engage in more sophisticated and/or violent offences than smaller groups that would not meet the "continuity" or "involvement in serious crime" criteria of section 467.1. Yet these groups are "not known to the public," they simply do not have the reputation, level of sophistication, intelligence, or the finances needed to operate like a bona fide organized crime group. Agent 3 stated that "organized criminals, often, operate like a business, they are calculated, they start stocking things away, and have justifications for the money they make;" whereas, mid-level groups, are different in terms of the "lifestyle they lead, they sell drugs, they cause violence, and they blow their money, but they are not organized criminals." On the other hand, Agent 4 noted the difference in the level of sophistication between the two groups, stating that organized criminals are "hard to get to, they operate like a business now, they are distinguished by the crimes they commit, they are insulated from certain types of crimes" as they have individuals working for them.
The identification of organized crime offenders with the co-offending data also proved to be effective when examining the structural features of the overall Quebec co-offending network. Whether the focus was on the entire province, or the specific Montreal-based segment of co-offenders, the OC identification was a determinant for distinguishing age differences, sex differences, and especially networking positions amongst the most connected (as perceived through past co-arrests) offenders in wider co-offending patterns across the entire province. Indeed, such analyses are relatively simple to devise and further investment could be made to regularly track the network features of OC and non-OC offenders—the latter group is essential to monitor closely since many individuals falling in the non-OC category at one point in time may find themselves in amongst the OC offenders in a later point in time. Such time-ordered analyses were not conducted in the current report, but are indeed feasible. Once again, whether for static or temporal applications, the Montreal scene is at the forefront of such analyses, with teams of analysts working regularly with university research teams to develop social network analytical techniques to better understand and trace offending patterns for a variety of criminal groups (Morselli et al., 2007; Tremblay et al., 2011).
SPVM's focus on organized crime is reflected in the investigation and intelligence units that are dedicated to combating this phenomenon. Across the police department, over 100 law enforcement officials were directly involved in combating organized crime, either as investigators or support units to provide the necessary intelligence for directing investigations and securing charges. The range of incidents in which organized criminals engage in means that other units also regularly deal with organized crime-affiliated incidents. One agent emphasized this by stating that "organized crime members can be found across any crime that helps line their pocketbooks." Thus, other units including proceeds of crime, narcotics, street gangs, and fraud all encountered a high number of organized crime-related incidents, but typically could not pursue them as such given the high number of resources required to secure charges. Taking both units that are indirectly involved in organized crime incidents and those that are directly involved suggests that at minimum there are 250 law enforcement officials who are regularly dealing with organized crime-affiliated incidents. It should be noted, however, that interviews were only conducted with select units across the department and thus may not account for all personnel who are involved in organized crime investigations. Further, it does not account for additional units such as SWAT teams that may be necessary to assist with investigations during the "take-down" phase. Lastly, the number of police officers only gives an indication of the number of individuals in an investigation and not the number of overtime hours required for surveillance and interdictions. Thus, lacking budgetary information within the department, these figures provide an indication of the bare minimum police strength that the SPVM allocates for combating organized crime and not necessarily total costs.
Both B.C. and Montreal units identified overtime hours as pervasive and a major cost component, which naturally leads to the conclusion that these units may be under staffed, or may need more officers who specialize in certain areas, especially when handling sophisticated cases. It could be that expanding the number of investigators dedicated to organized crime cases and/or managing their shifts differently in the first place may lessen the need for the extensive use of overtime hours.
Conclusion
The current report uses official police reported crime data to estimate the frequency and proportion of incidents related to organized crime. One of the main lessons of this work is that the best approach to detect organized crime in routine police records is to provide a range of estimates based on a variety of thresholds that approximate different interpretations of what constitute "serious" crimes with the potential for material benefits. The assumptions of each model are explicit, and can be further refined in future work. The report is relatively prudent in assessing both the size of the issue, and the costs associated with it, because it could not solve many of the uncertainties inherent in attempting this kind of estimation exercise with the time and resources available to do so. Below are the limitations of this work.
First, the estimates provided only consider criminal incidents within the city of Montreal from 2005 to 2009, affecting the level of generalizability to other provinces. Whereas, focusing on a period of five years provides the most reliable estimates, a five-year window is relatively small when looking at the continuity of offenders involved in organized crime. The second limitation lays with the nature of police reported data. Police reported data comprises incidents that have been detected by law enforcement officials, hence leading to an underestimation of the total volume of criminal incidents committed. Under section 467.1 of the Criminal Code, a component of organized crime is that it comprises three or more offenders. Co-offending incidents, in general, rarely account for all individuals involved in a criminal group or organization. This in turn affects the number of criminal incidents that can be attributed to organized crime as prescribed by section 467.1. The notion of a criminal organization is best understood if supplemented with additional data describing the structure of the group, which is only available through access to intelligence and investigative data. This is why a range of definitions and a range of thresholds are provided. Third, a component of incidents related to organized crime is that it generates some type of material benefit. The threshold is based on the seriousness of the criminal incidents (five or more years in prison), as well as its ability to result in material benefit. Currently, in the Criminal Code of Canada, there is no prescribed definition of material gain; rather, material gain may have various outcomes (reputational, financial, etc.) as is discussed by case law (Saunders & Lawrence, 2013). The current methodology for determining offence severity intersects Carrington et al.'s (2013) list of serious offences with Saunders and Lawrence's (2013) list of serious offences that may generate material benefit; however, there exists a need to operationalize the concept of material gain, as it will likely vary across different types of criminal incidents and criminal groups.
Additionally, there exist limitations with estimating police officer costs and resources. Although interviews with law enforcement officials in British Columbia and Quebec provided supplementary data on the allocation of costs and resources, the agencies did not provide access to their official financial records, or accounting books. Across all law enforcement agencies, as experienced as agents were, estimating the financial resources that go into investigating individuals related to criminal organizations, or individuals involved in organized crime was suggested to be a very complex exercise, thus, any sort of estimate would be dependent on a series of assumptions. For instance, assessing the differences between the "extra" costs of an investigation, which are often dependent on the status and relative sophistication of the criminal organization, the complexity of the investigation, and the more "general" costs that underlie all investigations. Furthermore, there are discrepancies in what to consider in assessing case specific costs. For instance, some budgets only consider the operational costs of the investigation, whereas others consider costs associated with police strength, overhead, and post-investigation costs where law enforcement officials have the duty of prepping materials obtained in the investigation, producing disclosure, and preparing a Report to Crown Counsel.
Despite these limitations, the report contributes to the literature on policing and organized crime by providing a framework and set of methods to estimate the proportion of organized crime incidents in any jurisdiction. The methods take into account the strengths and weaknesses of police data when applied to the current Criminal Code definition of a criminal organization. Future work requires the incorporation of intelligence and investigative data to describe in finer terms the structure and the criminal activities of the small groups and large organizations populating the Canadian criminal scene.
List of Acronyms
- DEA – Drug Enforcement Agency
- CFSEU – Combined Forces Specialized Enforcement Unit
- CMA – Census Metropolitan Areas
- CISC – Criminal Intelligence Service Canada
- DCO – Organized Crime Division
- MIP – Module d'information policière
- OC – Organized Crime
- OCSI – Organized Crime Severity Index
- ORA – Organizational Risk Analyzer
- PIRS – Police Information and Retrieval System
- CSI –Crime Severity Index
- RCMP – Royal Canadian Mounted Police
- SPVM – Service de Police de la Ville de Montréal
- SQ – Sûreté du Québec
- UCR – Uniform Crime Reporting Survey
References
Babyak, C., Alavi, A., Collins, K., Halladay, A., & Tapper, D. (2009). The methodology of the Police-reported Crime Severity Index. Ottawa: Statistics Canada, Household Surveys Methods Division. HSMD-2009-006E/F.
Bolan, K. (2008). A conspiracy and the proceeds of crime: It must have been an odd sight early one morning in May 2007 in Vancouver's tony Southlands neighbourhood. The Vancouver Sun. Retrieved from http://www.canada.com/vancouversun/story.html?id=89b43b4f-56a8-4a36-96b7-8ee8347ea8ec (Accessed March 30, 2015).
Bolan, K. (2012, November 25). Five men convicted in three slayings in Greeks murder trial: Sentencing Thursday. The Real Scoop. Retrieved from http://blogs.vancouversun.com/2012/11/25/five-men-convicted-in-three-slayings-in-greeks-murder-trial/ (Accessed March 30, 2015).
Bill C-95: An Act to amend the Criminal Code (criminal organizations) and to amend other Acts in consequence. (1997). 35th Parliament, 2nd Session. Retrieved from the Parliament of Canada website: http://www.parl.gc.ca/content/hoc/Bills/352/Government/C-95/C-95_4/C-95_4.pdf (Accessed March 12, 2015).
Bill C-22: An Act to facilitate combating the laundering of proceeds of crime, to establish the Financial Transactions and Reports Analysis Centre of Canada and to amend and repeal certain Acts in consequence. (2000). 36th Parliament, 2nd Session. Retrieved from the Parliament of Canada website: http://www.parl.gc.ca/content/hoc/Bills/362/Government/C-22/C-22_4/C-22_4.pdf (Accessed March 12, 2015).
Blakey, G.R. (1994). RICO: The federal experience (criminal and civil) and an Analysis of attacks against the statute. In R.J. Kelly, K-L. Chin, and R. Schatzberg (Eds.), Handbook of Organized Crime in the United States. Westport: Greenwood Press.
Bouchard, M. (2007). A capture-recapture model to estimate the size of criminal populations and the risks of detection in a marijuana cultivation industry. Journal of Quantitative Criminology, 23(3), 221-241.
Bouchard, M., & Morselli, C. (2014). Opportunity structures of organized crime. In L. Paoli (Ed.), Handbook of organized crime. Oxford: Oxford University Press.
Bouchard, M., & Nguyen, H. (2010). Is it who you know, or how many that counts? Criminal networks and cost avoidance in a sample of young offenders. Justice Quarterly, 27(1), 130-158.
Carley, K.M., Reminga, J., Storrick, J., Pfeffer., J & Columbus, D. (2013). ORA user's guide 2013. Carnegie Mellon University, School of Computer Science, Institute for Software Research, Technical Report, CMU-ISR-13-108.
Carrington, P.J. (2002). Group crime in Canada. Canadian Journal of Criminology, 44(3), 277-315.
Carrington, P.J., Brennan, S., Matarazzo, A., & Radulescu, M. (2013). Co-offending in Canada, 2011. Ottawa, Ontario: Canadian Centre for Justice Statistics, Juristat.
Carrington, P.J., & Van Mastright, S.B. (2013). Co-offending in Canada, England and the United States: A cross-national comparison. Global Crime, 14(2-3), 123-140.
Combined Forces Special Enforcement Unit British Columbia (CFSEU-BC). (2007). E-Paragon [Press release]. Retrieved from http://www.cfseu.bc.ca/en/media-room-blog/84-e-paragon(Accessed March 30, 2015).
Combined Forces Special Enforcement Unit British Columbia (CFSEU-BC). (2012). E-Paravail [Press release]. Retrieved from http://www.cfseu.bc.ca/en/media-room-blog/127-e-paravail (Accessed March 30, 2015).
Criminal Code, R.S.C. (1985), c. C-46, s.467.1.
Criminal Intelligence Service Canada (CISC). (2000). 2000 Annual report: Organized crime in Canada. Ottawa, Ontario: Criminal Intelligence Service Canada.
Criminal Intelligence Service Canada (CISC). (2004). 2004 Annual report: Organized crime in Canada. Ottawa, Ontario: Criminal Intelligence Service Canada.
Criminal Intelligence Service Canada (CISC). (2010). 2010 Annual report: Organized crime in Canada. Ottawa, Ontario: Criminal Intelligence Service Canada.
Desjardins, C. (2009). Opération Axe: les accusés comparaissent. La Presse. Retrieved from http://www.lapresse.ca/actualites/justice-et-affaires-criminelles/200902/14/01-827403-operation-axe-les-accuses-comparaissent.php (Accessed March 30, 2015).
Desroches, F. (2013). The use of organized crime and conspiracy laws in the investigation and prosecution of criminal organizations. Policing, 7(4), 401-410.
Glässer, U., Tayebi, M.A., Brantinham, P.L., & Brantingham, P.J. (2012). Estimating possible criminal organizations from co-offending data. Ottawa, Ontario: Public Safety Canada.
Haller, M.H. (1990). Illegal enterprise: A theoretical and historical interpretation. Criminology, 28(2), 207-236.
Hutchinson, H. (2014). Police resources in Canada, 2013. Ottawa, Ontario: Canadian Centre for Justice Statistics, Juristat.
Ivens, A. (2007). Cops crack global drug-trade ring: Fifteen years ago, Yong Long "Sam" Ye was a small-time thug operating on the fringes of Vancouver's criminal underworld. Today he stands accused of heading the biggest criminal conspiracy in B.C. history. The Vancouver Province. Retrieved from http://www.canada.com/story.html?id=8cf50e83-f3de-4195-9ca9-f563a88b3e56 (Accessed March 30, 2015).
La Presse. (2009). On espère beaucoup de l'opération Axe. Retrieved fromhttp://www.lapresse.ca/actualites/justice-et-affaires-criminelles/200902/20/01-829310-on-espere-beaucoup-de-loperation-axe.php (Accessed March 30, 2015).
Levi, M., & Maguire, M. (2004). Reducing and preventing organised crime: An evidence-based critique. Crime, Law & Social Change, 41, 397-469.
Lynch, G.E. (1990). A conceptual, practical, and political guide to RICO reform. Vanderbilt Law Review, 43, 769–803.
Mackenzie, D. (2012). The state of organized crime: Report of the Standing Committee on Justice and Human Rights. Retrieved from http://publications.gc.ca/collections/collection_2012/parl/XC66-1-411-01-eng.pdf (Accessed March 12, 2015).
Malm, A., Bichler, G., & Nash, R. (2010). Co-offending between criminal enterprise groups. Global Crime, 12(2), 112-128.
McGloin, J.M., Sullivan, C.J., Piquero, A.R., & Bacon, S. (2008). Investigating the stability of co-offending among a sample of youthful offenders. Criminology, 46(1), 155-188.
Morselli, C. (2009). Inside criminal networks. New York: Springer.
Morselli, C., Charest, M., & D'Elia, M. (2007). "Panorama des gangs de rue à Montréal: Tendances et perspectives (Rapport de faisabilité)," Division de recherche et planification, Service de police de la ville de Montréal, 25 pages.
Morselli, C., Grund, T.U., & Boivin, R. (2015). Network stability issues in a co-offending population. In A. Malm & G. Bichler (Eds.), Crime prevention studies: Preventing crime and network analysis (pp. 47-65). Monsey: Criminal Justice Press.
Morselli, C., & Kazemian, L. (2004). Scrutinizing Rico. Critical Criminology, 12(3), 351-369.
Morselli, C., Tanguay, D., & Labalette, A. M. (2008). Criminal conflicts and collective violence: Biker-related account settlements in Quebec, 1994–2001. In Siegel. D & Nelen. H (Eds.), Organized crime: Culture, markets and policies (pp. 145-163). Springer New York.
Naylor, R.T. (1997). Mafias, myths, and markets: On the theory and practice of enterprise crime. Transnational Organized Crime, 3(3), 1-45.
Naylor, R.T. (2003). Towards a general theory of profit-driven crimes. British Journal of Criminology, 43(1), 81-101.
Ogrodnick, L. (2002). Organized crime in Canada: An investigation into the feasibility of collecting police-level data. Ottawa: Minister of Industry.
Paoli, L. (2002). The paradoxes of organized crime. Crime, Law & Social Change, 37, 51-97.
Piquero, A.R., Farrington, D.P., & Blumstein, A. (2007). Key issues in criminal career research: New analyses of the Cambridge Study in Delinquent Development. Cambridge: Cambridge University Press.
Reiss, A.J. (1988). Co-offending and criminal careers. Crime and Justice, 10, 117-170.
Reiss, A.J., & Farrington, D.P. (1991). Advancing knowledge about co-offending: Results from a prospective longitudinal survey of London males. The Journal of Criminal Law and Criminology (1973-), 82(2), 360-395.
Reuter, P. (1983). Disorganized crime: The economics of the visible hand. Cambrdige, Massachusetts: The MIT Press.
Royal Canadian Mounted Police (RCMP). (2013). Project E-Peccant recognizes six dedicated employees for their work [Press release]. Retrieved from http://bc.cb.rcmp-grc.gc.ca/ViewPage.action?siteNodeId=50&languageId=1&contentId=30691 (Accessed March 30, 2015)
Sarnecki, J. (1990). Delinquent networks in Sweden. Journal of Quantitative Criminology, 6(1), 31-50.
Sarnecki, J. (2001). Delinquent networks: Youth co-offending in Stockholm. Cambridge: Cambridge University Press.
Saunders, M., & Lawrence, A. (2013). An organized crime severity index: Discussion of a proposed methodology. Ottawa, Ontario: Public Safety Canada.
Sauvé, J. (1999). Organized crime activity in Canada, 1998: Results of a "pilot" survey of 16 police services. Ottawa, Ontario: Minister of Industry.
Shepticky, J. (2003). The governance of organised crime in Canada. Canadian Journal of Sociology, 28(4), 489-516.
Statistics Canada. (2014). Police administration survey. Retrieved from http://www23.statcan.gc.ca/imdb-bmdi/pub/3301-eng.htm (Accessed November 12, 2014).
Tremblay, P. (1993). Searching for suitable co-offenders. In R.V.G. Clarke & M. Felson (Eds.), Routine activity and rational choice: Advances in criminological theory (Vol. 5). New Brunnwick, NJ: Transaction Publishers.
Tremblay, P., Charest, M., Charrette, Y., Bouchard, M., Tremblay-Faulkner, M., & Beaudoin, I. (2011). Les trajectoires de victimisation dans le milieu des gangs de rue haïtiennes. Ministère de la Justice: Québec.
Tusikov, N. (202). Measuring organised crime-related harms: Exploring five policing methods. Crime, Law & Social Change, 57, 99-115.
United Nations Office on Drugs and Crime (UNODC). (2002). Results of a pilot survey of forty selected organized criminal groups in sixteen countries. Retrieved from http://www.unodc.org/pdf/crime/publications/Pilot_survey.pdf (Accessed March 12, 2015).
Varese, F. (2011). Mafias on the move: How organized crime conquers new territories. Princeton, NJ: Princeton University Press.
Vold, G.B., & Bernard, T.J. (1986). Theoretical criminology, 3rd edition. New York: Oxford University Press.
Von Lampe, K. (2004). Making the second step before the first: Assessing organized crime. Crime, Law & Social Change, 42, 227-259.
Warr, M. (1996). Organization and instigation in delinquent groups. Criminology, 34(1), 11-36.
Weerman, F. M. (2003). Co-offending as social exchange: Explaining characteristics of co-offending. British Journal of Criminology, 43(2), 398-416.
Appendix A: Interview Guide
- Can you describe your experiences and involvement in organized crime investigations?
- How are cases allocated to the organized crime division within the law enforcement agency? What kinds of cases does the organized crime division manage, and what are some of the criteria involved in the organized crime division being involved?
- When identifying incidents as organized crime, does law enforcement use the Criminal Code's organized crime definition? If yes, how is it used?
- Based on your experience, is the classification of incidents linked to organized crime standardized across police agencies in Canada, or unique to your law enforcement agency? [Quebec only]
- Does law enforcement distinguish between "street gangs" and cases involving other types of criminal organizations?
- If a distinction does exist, from a law enforcement perspective, when does a group evolve from being labelled a "street gang" to a "criminal organization"?
- Can you estimate the number of formal street gangs operating in [province in which interviews are occurring], how about criminal organizations?
- On the [law enforcement agency] website it is noted that there are [#] criminal groups vying for a part of the provincial market, has this number held constant over the years? [British Columbia only]
- What are some of the challenges with identifying incidents as organized crime in an enforcement context?
- Can you provide an estimate of the proportion of organized crime-related incidents compared to all criminal incidents within your jurisdiction? Or a proportion of the resources allocated to these cases compared to others?
- Based on your experience, which types of offences are most indicative of organized crime participation?
- Based on your experience, which types of offences are least indicative of organized crime participation?
- Do certain types of cases take precedence over others when it comes to investigations, and the allocation of officers to files (re: drugs, weapons, gang members)?
- Across organized crime-affiliated incidents, are there offence types that generate more concern (i.e. resources; greater law enforcement response)?
- To what extent are various law enforcement responses to organized crime incidents dependent on the organized crime group (or specific individuals) involved? Can you provide examples across organized crime groups (can be anonymized if need be), and reasons why certain types of groups require differential responses?
- In your experience, what types of resources go into investigating incidents related to organized crime? How does the allocation or types of resources differ from other serious offences that are not related to criminal organizations?
- Are you able to estimate, on average the number of police officers in the department that are assigned to organized crime files? [Quebec only]
- Considering police officers that are not normally assigned organized crime files, how much time do they work on these files? [Quebec only]
- From your perspective, what types of resources are necessary for investigations linked to organized crime? In terms of surveillance, number of investigators, etc. Do you have any recent examples? [Quebec only]
- What occurs when other units that specialize in these files encounter cases linked to organized crime? [Quebec only]
- How are responses to organized crime incidents influenced by available funding and resources?
- Over the years, are you able to name the most significant investigations/initiatives that [the law enforcement agency] has formed or been a part of?
- Why were these initiatives significant (violence, high profile, money, complicated)?
- Are there any questions or issues that we may have missed and should be asked or addressed?
Appendix B: SPVM Reports
Action Plans
- Service de police de la ville de Montréal (SPVM). (2005). Plan d'action 2005 du SPVM.
- Service de police de la ville de Montréal (SPVM). (2006). Plan d'action 2006 du SPVM.
- Service de police de la ville de Montréal (SPVM). (2007). Plan d'action 2007 du SPVM.
- Service de police de la ville de Montréal (SPVM). (2008). Plan d'action 2008 du SPVM.
- Service de police de la ville de Montréal (SPVM). (2009). Plan d'action 2009 du SPVM.
Actualités gangs de rue
- Service de police de la ville de Montréal (SPVM). (December 15 2005). Actualités gangs de rue.
- Service de police de la ville de Montréal (SPVM). (June 20 2006). Actualités gangs de rue.
- Service de police de la ville de Montréal (SPVM). (February 15 2007). Actualités gangs de rue.
- Service de police de la ville de Montréal (SPVM). (January 31 2008). Actualités gangs de rue.
- Service de police de la ville de Montréal (SPVM). (July 2010). Actualités gangs de rue.
Annual Reviews
- Service de police de la ville de Montréal (SPVM). (2005). 2005 Annual review.
- Service de police de la ville de Montréal (SPVM). (2006). 2006 Annual review.
- Service de police de la ville de Montréal (SPVM). (2007). 2007 Annual review.
- Service de police de la ville de Montréal (SPVM). (2008). 2008 Annual review.
- Service de police de la ville de Montréal (SPVM). (2009). 2009 Annual review.Footnote13
Annual Reviews – Statistics
- Service de police de la ville de Montréal (SPVM). (2005). Annual review: Additional information and statistical data 2005.
- Service de police de la ville de Montréal (SPVM). (2006). Annual review: Additional information and statistical data 2005.
- Service de police de la ville de Montréal (SPVM). (2007). Annual review: Additional information and statistical data 2005.
- Service de police de la ville de Montréal (SPVM). (2008). Annual review: Additional information and statistical data 2005.
Budget
- Service de police de la ville de Montréal (SPVM). (2005). Budget.
- Service de police de la ville de Montréal (SPVM). (2006). Document budgétaire complémentaire de 2006.
- Service de police de la ville de Montréal (SPVM). (December 7 2006). Plan d'action et prévisions budgétaires 2007.
- Service de police de la ville de Montréal (SPVM). (2008). Document budgétaire complémentaire de 2008.
- Service de police de la ville de Montréal (SPVM). (2009). Document budgétaire 2009.
Appendix C: SPVM Major OC Investigations and Initiatives
| Investigations/Initiatives | Year(s) | Target | Summary | Arrestsa |
|---|---|---|---|---|
| ABAT | 2005 | Street gangs | Increased the police presence and enforcement of laws, with a focus on drug trafficking in the Eastern region of Montréal | – |
| AVANCE | 2005 | Street gangs | Aimed to combat street gangs by increasing police presence in bars/restaurants. | – |
| OMÉGA | 2005 | Street gangs | Aimed to control the activities of a single street gang. | – |
| SPICY | 2005 | Street gangs | Targeted street gangs involved in drug trafficking in South-Montréal. | – |
| ZIPLOCK | 2005 | Biker Gangs | – | – |
| AVANCE III | 2006 | Street gangs | Targeted the criminal activities of street gangs. | 1,529 |
| COLISÉE | 2006 | Organized Crime Groups | In collaboration with other enforcement agencies and the Unité mixte d'enquète, this comprised an international investigation that targeted organized crime groups. | – |
| FOUINARD | 2006 | Organized Fraud Ring | Targeted an organized fraud ring in Montreal that led to 14 searches. | 9 |
| MAG | 2006 | Drug trafficking | Collaborating with Longueuil law enforcement, targeted a drug trafficking network that smuggled and trafficked tobacco and alcohol. | – |
| MOUSTACHE | 2006 | Drug trafficking | Targeted a drug trafficking network that smuggled tobacco and narcotics. | 19 |
| PARAVENT | 2006 | Drug trafficking | Targeted a drug trafficking network operated by Italian and Asian groups that had annual sales of 18 million. | – |
| SURFACE | 2007/2008 | Drug trafficking | Aimed to dismantle a crack-selling network operating in downtown Montréal. | 17 |
| NERO | 2008 | Prostitution network | Targeted a network of drug sellers and prostitution operating in Parc-Extension. | 18 |
| STRIX | 2008 | Drug trafficking | Targeted a drug trafficking network that was conducting 'dial-a-dope' operations, taking cell phone drug orders and delivering narcotics by car. | 15 |
| ECLIPSE | 2008/2009 | Street gangs | Targeted the criminal activities of street gangs. | 2008: 264 2009: 702 |
| File MD09-1160 | 2008/2009 | Drug trafficking | Targeted a heroin importation network associated with Montréal organized crime. | 2 |
| PEPIN | 2008/2009 | Biker gang | Investigation that began when a Molotov cocktail targeted an unintended residence, leading to a search of the residence and of a trafficker linked to the Hells Angels. | 23 |
| STAMP | 2008/2009 | Robbery network | Targeted a robbery network that was stealing valuables from gym lockers. | 10 |
| AXE | 2009 | Biker gangs / Drug trafficking | Over a two year period, targeted junior members of the Hells Angels (Syndicates) and another drug-trafficking network in the South-west of Montreal. | 55 |
| File MD09-1045 | 2009 | Street gang | Targeted a street gang member that delivered crack for trafficking in NDG. | 1 |
| File MD09-1057 | 2009 | Street gang | Targeted a crack dealing network affiliated with a street gang in Côte-des-Neiges. | – |
| File MD09-1169 | 2009 | Drug trafficking | – | 4 |
| MACHINE | 2009 | Drug trafficking | Targeted a network of tobacco and narcotic dealers operating in Montreal's downtown that were affiliated to the Hells Angels | 60 |
| MARTEAU | 2009 | Organized Crime | Aimed to combat embezzlement and corruption in collaboration with the Longueuil and Laval Police force. | – |
| NAPHTA | 2009 | Street gangs | Aimed to seize firearms belonging to street gang members that were aiming to take control of several bars through intimidation tactics. | 9 |
| NOE | 2009 | Drug trafficking | Targeted a network of narcotics dealers. | 96 |
| NORTE | 2009 | Drug trafficking | Targeted a network of narcotics dealers. | 11 |
| ONDEE | 2009 | Street gangs | Targeted two groups that were in a conflict over narcotic sales. | 39 |
| SELLETTE | 2009 | Drug trafficking / Firearms | Targeted a drug and firearm trafficking network that were involved in the trafficking of crack, cocaine and marijuana. | 17 |
| SHARQc | 2009 | Biker gang | Targeted leaders, prospects, and hangouts of the Hells Angels. | 130 |
| SHIPPING | 2009 | Auto-theft network | Aimed to dismantle an organization that stole luxury vehicles with the aim of exporting them overseas for profit. | 4 |
| SOUTERRAIN | 2009 | Drug trafficking | Targeted narcotics dealers connected to street gangs in the downtown area of Montreal. | 39 |
Notes
- Not all arrests are organized crime-related, but rather reflect total arrests made during the investigation.
Footnotes
- 1
Available at http://www.statcan.gc.ca/pub/85-002-x/2014001/article/14108/tbl/tbl07-eng.htm (Accessed March 12, 2015).
- 2
The authors did not provide information on how the RCMP developed this severity scale. However, the authors did state they chose not to use the Crime Severity Index developed by Babyak et al. (2009) to analyze seriousness of organized crime groups given that the skewed left-distribution meant that there were very few active co-offending groups of three or more that could be identified as serious offender groups.
- 3
The proportions were established using the published manuscript, as well as unpublished material obtained via personal communications with the lead authors.
- 4
Model 2.2 in this study most closely resembles the one used by Saunders and Lawrence (2013).
- 5
Municipal codes in the Province of Quebec were obtained from: http://www.mamrot.gouv.qc.ca/repertoire-des municipalites/fiche/municipalite/ (Accessed March 12, 2015).
- 6
Keywords: SPVM; organized crime; street gangs; biker; law enforcement; budget; expenditures; revenue. All keyword searches were performed in both English and French.
- 7
Saunders and Lawrence's (2013) study, which most resembles Model 2.2 used in this study (3+ offenders, broad threshold) produced a slightly different result using UCR2 data, which includes all of police-reported crime in Canada between 2006 and 2009. They found that the proportion of co-offences that are associated with OC to be between a low of 1.72% in 2009 and a high of 1.97% in 2006.
- 8
Based on Model 1.1.
- 9
For table 11 and 12, no models or thresholds were used per se. Rather, these two tables describe the demographics of individuals involved in a criminal event (comprising of 2+ offenders), where it was required that each offender had to have co-offended with one of their counterparts across two or more events together (meeting the continuity threshold).
- 10
'Buy-and-busts' consist of operations where undercover agents purchase narcotics from an identified drug trafficker and then law enforcement subsequently arrests the seller.
- 11
R. v. Stinchcombe, [1991] 3 S.C.R. 326
- 12
This first analysis is initially decentralized to each jurisdiction in B.C., before it is moved to a specialized unit if need be.
- 13
SPVM crime statistics for 2009 were integrated in their Annual Review and did not comprise a separate report for this year.
- Date modified: