The Price of Cannabis in Canada
 The Price of Cannabis in Canada PDF Version (1.2 MB)
By Marie Ouellet, Mitch Macdonald, Martin Bouchard, Carlo Morselli and Richard Frank
Table of Contents
- Abstract
- List of Tables and Figures
- Introduction
- Literature Review
- Cannabis Prices in Canada
- Price Elasticity of Cannabis Demand
- Discussion
- Conclusion
- List of Acronyms
- References
- Appendix A: Systematic Literature Review
- Appendix B: Description of the Web-Crawler
- Appendix C: Price Data obtained from Licensed Medical Cannabis Producers
- Appendix D: Participation Elasticity Estimates
- Footnotes
Abstract
The current report provides estimates of: 1) cannabis prices from 2011 to 2015; and 2) the price elasticity of cannabis demand in Canada. Estimates rely on approximately 9,000 self-reported cannabis transactions from 2011 to 2015, as reported to the Price of Weed website, an online platform for cannabis users to anonymously submit the price, size, perceived quality, and location of their most recent transaction. Across this period, the average national price of high quality cannabis was $7.69 per gram, medium quality cannabis $7.14 per gram, and low quality cannabis $7.26 per gram. Prices varied by geographical location, with regions associated with higher cannabis production reporting lower prices. Price also varied according to the size of the transaction, with larger transactions fetching a lower price per gram. Estimates of the price elasticity of cannabis demand ranged from -0.42 to -0.60, suggesting that a 10 percent drop in prices could lead to a 4 to 6 percent increase in the total amount of cannabis consumed. However, these estimates should be interpreted with caution, given the limitations of the data. To conclude, findings from the analyses are used to discuss ways forward for measuring cannabis prices, potential implications of transitions from prohibition to legalization for the cannabis market, and research and policy recommendations.
Author's Note
The views expressed are those of the authors and do not necessarily reflect those of Public Safety Canada. Correspondence concerning this report should be addressed to:
Research Division, Public Safety Canada
340 Laurier Avenue West
Ottawa, Ontario
K1A 0P8
Email: PS.CPBResearch-RechercheSPC.SP@ps-sp.gc.ca
Acknowledgements
The authors would like to thank Beau Kilmer who provided extensive comments, guidance, and recommendations throughout the report. Also acknowledged are Austin Lawrence and Anton Maslov for their helpful suggestions and policy insight. Lastly, the authors would like to thank Luca Giommoni and David Décary-Hétu for sharing their price data. Please note that the views expressed in this report are only those of the authors, and not Public Safety Canada.
List of Tables and Figures
Tables
Table 1: Self-reported Cannabis Prices across Canada
Table 2: Percentage of Self-reported Cannabis Transactions by Quality
Table 3: Size of Cannabis Transactions across Canada
Table 4: Comparing Cannabis Prices from Price of Weed to Licensed Medical Producers
Table 5: Quality of Price of Weed Cannabis
Table 6: Potency of Cannabis as Reported by Licensed Medical Cannabis Producers
Table 7: Cannabis Transactions across Provinces in Canada
Table 8: Weighted OLS and IV Estimates of Cannabis Demand
Figures
Figure 1: Cannabis Prices by Quantity Purchased
Figure 2: Cannabis Price Trends across Provinces and Territories
Figure 3 Nationally Aggregated Price Series Depicting Trends in Mean Cannabis Price
Figure 4: Nationally Aggregated Price Series Depicting Trends in Median Cannabis Price
Figure 5: Licensed Medical Producers' Cannabis Prices by THC and CBD Content
Figure 6: CBD and THC Content of Medical Cannabis from Licensed Producers
Introduction
Despite representing one of the country's most commonly used illegal drugs, relatively little is known about the cannabis market in Canada. Recent surveys of Canadians have reported that 12 percent of Canadians aged 12 years or older have used cannabis in the past year (CTADS, 2016), a rate that has been found to be higher among at-risk populations, including homeless youth (72%) and homeless adults (54%) (Krausz, 2011). Since the implementation of regularly administered national surveys on drug use, cannabis use prevalence rates have shown little variation. From 2004 to 2015, past-year cannabis use prevalence ranged from a high of 14 percent (2014) to a low of 9 percent (2011), averaging 9.29 percent over this period.Footnote 1 However, while surveys have begun to regularly track Canadians' past-year cannabis use, there is little empirical data on measures of the Canadian cannabis market, including prices, potency, and quantity consumed.
The lack of empirical data is concerning given shifts in cannabis policies over the past few decades. In 1997, the Canadian government passed the Controlled Drugs and Substance Acts, which increased sanctions for drug offences, and, in 2012, the Safe Streets and Communities Act, whichled to mandatory minimum sentences for cannabis trafficking. More recently, policy reform efforts have shifted towards approaches favouring the legalization of cannabis. In 2015, the majority government of Canada stated that it would “legalize, regulate, and restrict access to marijuana”.Footnote 2 Yet, despite the shift from a punitive to more permissive stance on cannabis, little empirical evidence to inform either perspective is available.Footnote 3
Knowing the price of cannabis is essential for assessing the consequences of current cannabis laws and making projections about policy changes. Under prohibition, the retail price is critical for measuring total cannabis expenditures, which can then be used to help estimate the amount of money being diverted to organized crime and other market participants. Data about the retail price in the illegal market can also be informative for governments or licensed producers for price setting for legal medical cannabis products. For jurisdictions like Canada that are considering cannabis legalization, knowing the price before the policy change is essential for making reasonable predictions and encouraging informed debates. Many of the major outcomes discussed in cannabis legalization debates—the size of illegal markets, tax revenues, and consumption (which will have implications for public health)—will be shaped by what happens to the retail price after the policy change.
This report aims to fill this gap by presenting an overview of cannabis prices in Canada. First, a review of the literature on the determinants of cannabis prices, estimates of cannabis prices, and the price elasticity of cannabis demand is conducted. Second, trends in illegal cannabis prices from 2011 to 2015 are presented, breaking down prices by the quality and quantity of the transaction. Third, cannabis prices reported to Price of Weed are compared to cannabis prices set by licensed medical marijuana producers. Fourth, estimates of the price elasticity of cannabis demand in Canada are calculated, estimating the degree to which changes in prices influence cannabis use. To conclude, findings from the analyses are used to discuss ways forward for measuring cannabis prices, potential implications of transitions from prohibition to legalization for the cannabis market, and additional research and policy recommendations.
Literature Review
This section reviews prior work on cannabis price estimates, with a focus on the aspects that fulfill the objectives of this report.Footnote 4 The first two sub-sections examine the determinants of cannabis prices and previous efforts to estimate cannabis prices. The third sub-section turns to the relationship between cannabis prices and cannabis use, with a specific focus on how changes to cannabis prices influence demand.
Determinants of Cannabis Prices
Drug prices are a useful indicator of drug market conditions. Similar to licit markets, drug prices are moderated according to relative supply and demand. Previous studies have shown that drops in cannabis prices have been associated with increases in supply. This trend was observed following the adoption of new and more efficient cultivation techniques (Clements, 2004; Vanhove, Surmont, Van Damme, & De Ruyver, 2012), as well as increases in the competitiveness of the market (Bouchard & Dion, 2009). But prices are also moderated by unique characteristics of the market, including the risks associated with illegal activity, such as law enforcement apprehension (Reuter & Kleiman, 1986)Footnote 5, as well as distribution costs (Caulkins, 1995; Caulkins & Baker, 2010; Caulkins & Bond, 2012), quantity discounts (Caulkins & Padman, 1993; Rhodes, Hyatt & Scheiman, 1994; Storti & DeGrauwe, 2009; UNODC, 2010), cannabis quality (Ben Lakhdar, 2009; Ben Lakhdar, Vaillant, & Wolff, 2016; Cole et al., 2008; Goudie et al., 2007; Sifaneck, Ream, Johnson, & Dunlap, 2007), characteristics of the transaction (Pacula, Kilmer, Grossman, & Chaloupka 2010), and changes to cannabis policies (Andersen, Hansen, & Rees, 2013). Below, each of the factors that moderate cannabis prices is discussed.
The Scale of Local Cultivation and Production
Decreases in cannabis prices have been attributed to the adoption of new cultivation techniques that have increased both the size and speed of crop yields. Specifically, hydroponic cultivation, an intensified form of agriculture that brings nutrients and minerals directly to the plant through a water solution (Roberto, 2005), has allowed for a year-round growing season, more fruitful crop yields, and faster turnover rates than would otherwise be harvested from seasonal grows through outdoor cultivation sites (Vanhove et al., 2012). In the United States (US) and Australia, national drug price data have shown that the widespread adoption of hydroponic cultivation techniques has coincided with drops in cannabis prices (e.g. Caulkins & Padman, 1993; Clements, 2004; Clements & Zhao, 2009; Rhodes et al., 1994).Footnote 6 This was shown by Clements and Zhao (2009), who found a substantial drop in cannabis prices, as compared to other illegal products in Australia between 1990 and 1999, attributing the decrease to the adoption of hydroponic cultivation techniques and a reduction in penalties associated with cultivation.
In Canada, increases in the domestic production of cannabis have been associated with the adoption of hydroponic cultivation techniques. This was demonstrated by Bouchard and Dion (2009), who found a relationship between the number of hydroponic shops and the number of cannabis cultivation offences from 1977 to 2006 in Quebec. As the number of hydroponic shops increased, so did the number of individuals arrested for cannabis cultivation. Interviews with local growers and analysis of police-reported statistics led the authors to argue that increases in hydroponic cultivation resulted in a drop in cannabis prices by reducing the barriers to market entry, increasing competition, and impacting the availability of cannabis.
Law Enforcement
Studies have shown that increases in law enforcement activity have only modestly, if at all, influenced cannabis prices. Reuter and Kleiman (1986), examining the impact of a federal government crackdown on cannabis distribution over a five-year period, showed that increases in cannabis seizures and arrests had only a modest effect on cannabis prices. Comparing the number of cannabis seizures and arrests made by the Federal Bureau of Investigation from 1980 to 1984 to price and use data, the authors illustrated that, despite fluctuation in interdictions, cannabis prices remained relatively stable and had no impact on overall use.Footnote 7 Similar results were found by Kleiman and Davenport (2012), who concluded that despite increases in the number of arrests for cannabis traffickers from 1980 to 2012, cannabis prices have declined substantially over the same period.
The lack of a relationship between law enforcement interdiction efforts and cannabis prices may be attributed to the unique characteristics of the cannabis market. Increases in law enforcement interdictions are expected to raise prices by causing suppliers to operate inefficiently, referred to as the ‘structural consequences of product illegality' (Reuter, 1983). From this perspective, law enforcement activity may have less of an impact on the cannabis market, where production is largely domestic and competition is abundant (Bouchard, 2007). This perspective is supported by Kleiman and Davenport (2012), who argue that the scale and scope of the cannabis market makes it challenging to effectively target, requiring that law enforcement concentrate their resources on export-import and high-level domestic transactions, which only account for a small component of the final retail price. Although increases in enforcement may not increase prices due to the scale and size of the market, the authors suggest that a substantial reduction or cessation in enforcement may lead to decreased prices.
Distribution Costs
Distribution costs stemming from drug importation and/or exportation also influence drug prices. Prices tend to increase with the distance from drug sources, such as points of importation or domestic and/or international cultivation, a pattern typically referred to as price dispersion (Caulkins, 1995; Caulkins & Baker, 2010). Research from the US has found that retail prices for cannabis increase with distance from northern California, the US region most associated with domestic production (Caulkins & Padman, 1993; Caulkins, 1995; Rhodes et al., 1994). Retail prices for cannabis also increase with distance travelled north from the Mexican border, a source country associated with supplying US cannabis at a price gradient of roughly US$325 to US$475 per pound per 1,000 miles travelled (Caulkins & Bond, 2012). Similar dynamics appear to impact prices in Canadian markets. Research suggests that consumers in British Columbia, Ontario, and Quebec (provinces with significant cannabis production) enjoy lower retail prices than do consumers in ‘import' provinces, and especially those that are further from cannabis sources (Boucher, Lawrence & Maslov, 2013).
Quantity Discounts
Even within local drug markets, prices vary across market levels. Bulk purchases tend to fetch lower per unit prices, as compared to smaller, retail transactions. Higher retail prices are a by-product of price markups that accrue as drugs move along the distribution chain (Caulkins & Padman, 1993; Caulkins & Reuter, 1998; Clements, 2006; DeSimone, 2006). The largest markups occur between wholesalers and retailers, although there is evidence of declining price margins for drugs (Storti & De Grauwe, 2009). Using wholesale and retail price points supplied by member states, the United Nations Office on Drugs and Crime (UNODC) (2010) reported retail price markups of 110 and 129 percent for cannabis resin and herb, respectively. The size of price markups was also found to be subject to geographic variation, with countries in Africa reporting higher markups than those in Europe.
Despite disparities in prices, most purchases tend to be smaller in scale, and conducted at the retail level. For instance, Moeller and Pedersen (2014) found that, among a sample of cannabis transactions video-taped by Copenhagen police between 2003 to 2004, the average purchase size was three grams of cannabis, with 88 percent of cannabis consumers (n = 847) purchasing three grams or less. Caulkins and Pacula (2006), based on the 2001 US National Household Survey on Drug Abuse, found that the median purchase size of loose cannabis resin was slightly more than a quarter ounce. More recent estimates put the average amount of cannabis acquired at nearly one half ounce (Kilmer et al., 2014). This discrepancy in purchase size may be attributed to sampling characteristics, with Moeller and Pederson (2014) sampling transactions that occurred outdoors and during the daytime, situational features that may decrease the likelihood and costs of detection by purchasing smaller quantities, whereas Caulkins and Pacula (2006), and Kilmer et al. (2014) relied on more representative surveys of users and likely captured transactions that also occurred in less risky contexts.
Drug Potency
The price of cannabis also varies according to its potency, whether true (e.g. Δ9-tetrahydrocannabinol (THC) content) or perceived. Within the literature, quality is often used synonymously with potency, measured by THC content. Greater domestic production and adoption of hydroponic cultivation has resulted in more potent cannabis and larger variation in the potency of cannabis available due to selective cross-breeding of different strains (Burgdorf, Kilmer, & Pacula, 2011; Potter, Clark, & Brown, 2008). But apart from a unique dataset that matched price data with measures of THC concentration for a series of cannabis purchases (see Ben Lahkdar, 2009; Ben Lahkdar et al., 2016), it is much more common for price data to be matched with self-reported assessments of cannabis potency, or quality. The caveat with this approach is that neither law enforcement officials nor cannabis users are capable of accurately assessing the true quality of cannabis that is seized or purchased. Therefore, what is typically controlled for in the calculation of price estimates is a subjective measure of perceived quality. Despite not representing the ‘true' quality of cannabis, self-reports of perceived quality have been more strongly associated with cannabis prices than actual THC content (Ben Lahkdar, 2009; Ben Lahkdar et al., 2016; Cole et al., 2008; Goudie et al., 2007; Sifaneck et al., 2007) and, thus, have been suggested to be a better predictor for estimating cannabis prices.Footnote 8
Characteristics of the Transaction
Transaction-level characteristics have been associated with retail prices. Some studies have found transactions that occur in private locations to be associated with higher self-reported prices (Caulkins & Pacula, 2006), whereas others have found that they are associated with lower self-reported prices (Pacula et al., 2010). Using data from a 2001 general population survey, Caulkins and Pacula (2006) examined how transaction characteristics, such as purchase location (e.g. private dwelling, inside public building, outside, in other location, or close to home) and from whom they purchased (e.g. friend, family, or stranger), influenced the self-reported price for cannabis. The findings showed that there was no relationship between cannabis prices and from whom the purchase was made, and, surprisingly, that prices were higher for transactions made in private dwellings, where transactions costs were expected to be lower because of decreased risks of detection.
Conducting a similar analysis and controlling for the location of purchase (e.g. buyer's neighborhood or other locale), the nature of the exchange (e.g. direct contact with a dealer or third-party handoff) and the nature of the relationship between the buyer and dealer (e.g. regular, occasional, new source), Pacula et al. (2010) modelled how transaction characteristics influenced prices for cash transactions of cannabis purchases among an arrestee population. Contrary to Caulkins and Pacula (2006), the authors found that transactions in private dwellings were associated with lower prices, although no relationship was found between the self-reported price and whether the transaction occurred in the buyer's neighborhood. As noted by Pacula et al. (2010), the divergent results may be attributed to the two different samples (a household versus an arrestee population) and that Caulkins and Pacula (2006) were unable to control for regional market differences. However, both studies stress caution in interpreting the results, as they were unable to control for the potency of cannabis, thus potentially introducing omitted variable bias.
Cannabis Policies
Studies have found that the adoption of medical marijuana laws has been associated with price changes. Using 1990 to 2011 price data collected from High Times, an online venue for users to self-report prices paid for cannabis, Anderson et al. (2013) evaluated how changes to state-level cannabis laws impacted the price of illegal cannabis in the US. Findings showed that the legalization of medical cannabis led to increases in supply of high potency cannabis and a corresponding reduction in cannabis prices. However, price decreases were only observed in the fourth full year following regulation, with no effect on the price of low potency cannabis, thus suggesting a lag effect. This relationship was attributed to the tendency of medical dispensaries toward producing higher potency strains and that cannabis intended for the medical market was being diverted to the illicit market (Anderson et al., 2013). This research is consistent with work by Pacula et al. (2010), who found that self-reported prices for cannabis among the arrestee population were higher in states with medical cannabis laws. Anderson et al. (2013) argues that this increase in price is due to the introduction of a more potent product to the market, although Pacula et al. (2010) were unable to control for the effect of potency on price in their models. Past research on the determinants of cannabis prices is diverse, but broadly consistent in finding that changes to prices are influenced by both endogenous and exogenous factors. Endogenous factors include changes to internal supply and demand, either due to new innovative cultivation techniques or more ample product, both of which have a residual effect on cannabis prices. Exogenous factors, such as changes in the enforcement of medical cannabis laws, has the corresponding effect of increasing or decreasing the risks associated with producing and trafficking cannabis, along with the availability of cannabis on the market. Assessments of cannabis markets should take into account the full set of factors that could influence prices, above and beyond shifts in enforcement.
Estimates of Cannabis Prices
This sub-section reviews sources of illegal drug prices that have been used to develop price estimates. Studies using price data typically rely on: 1) official records and/or 2) self-report data. Taken together, these data sources provide complementary insight into the illegal drug market: official sources typically capture law enforcement contact with both users and suppliers, whereas self-reports capture the prevalence rates of drug use and prices paid by users. More recently, researchers have also turned to online drug markets for price data, providing a third source for drug prices. Here, each data source and its respective strengths and weaknesses for understanding the cannabis market are described.
Official Sources
Official sources capture recorded drug transactions made by undercover law enforcement agents. In the US, the main official sources for drug price data, administered by the Drug Enforcement Administration (DEA), include: the System to Retrieve Information for Drug Evidence (STRIDE); the Illicit Drug Wholesale/Retail Price Report; and the Illegal Drug Price/Purity Reports (IDPPR). STRIDE is a database of drug seizure data, with submissions from federal, state, and local law enforcement agencies, established to ensure such data are readily available to researchers and policymakers to address issues pertaining to drug price and availability.Footnote 9 The Illicit Drug Wholesale/Retail Price Report and the IDPPR obtain data on cannabis prices and THC content from records of undercover buys and subsequent laboratory analysis.Footnote 10 Caulkins and Bond (2012) found strong correlation in cannabis prices captured by official data, particularly between the IDPPR and STRIDE datasets. The level of granularity embedded within these datasets has been invaluable for analyzing price variation across drug markets, although when compared to the US, such data are not as readily available in other countries. In Canada, the RCMP has made efforts to collect national drug price data through initiatives such as the Illicit Drug Price List. However, publicly available data has been much broader in scope, resulting in the publication of macro-level summary statistics rather than the micro-level data needed to measure regional price variations.
The foremost problem with official data concerns the general absence of potency information. Official data, such as STRIDE, do not contain information on cannabis potency, whereas other sources, such as IDPPR, contain information on cannabis potency, but only publish information on the annual average THC percentage, and does not distinguish between potency at the retail and wholesale levels of the market. Official data are also comprised of records obtained from cannabis seizures that tend to be highly concentrated in particular regions and across few cities (also Pacula et al., 2001, 2010). In addition, the absence of a systematic data collection instrument further confounds official sources. Because data is not collected with the underlying goal of ensuring a representative sample of drug purchases, official data contains bias stemming from law enforcement knowledge and prioritization of producers, suppliers, and/or dealers from whom purchases are made. Law enforcement must also arrange ‘the buy', which typically consists of large wholesale purchases (Caulkins, 2007a), although most cannabis purchases, by comparison, consist of small quantities between known acquaintances (Caulkins & Pacula, 2006). Such limits have important implications for understanding cannabis prices, as transactions between acquaintances or in personal settings are much more likely to escape the attention of the police.
Self-report Data
Complementing official data are self-report data collected through national surveys, local research initiatives, and/or crowdsourcing websites. Comprehensive national initiatives to collect self-report drug use data have been undertaken primarily in the US, Australia, and New Zealand. Analysis by Davenport and Caulkins (2016) found that prices obtained from seizure data tend to be lower than those obtained from self-reports and, according to midpoint estimates of the price ranges in both official and self-report data, that inconsistencies between the two sources could theoretically be as large as 10 to 20 percent.
In the US, the National Survey on Drug Use and Health (NSDUH) and the Arrestee Drug Abuse Monitoring (ADAM) program both collect data on cannabis transactions and prices. The NSDUH is a nationally representative survey of the household population aged 12 years and older that has been conducted annually since 2002, replacing the National Household Survey on Drug Abuse (NHSDA).Footnote 11 A cannabis purchasing module was added in 2001 to collect data on participants' most recent cannabis purchases. Questions concerned details on the location in which the transaction occurred, relationship with the seller, and the quantity and price of the purchase. ADAM, administered by the US Department of Justice, surveys the arrestee population regarding their drug purchases, characteristics of the transaction, including location, and dollar amount paid for cannabis. Unfortunately, this program is no longer funded and the latest report from this program was released in 2013 (ADAM II).Footnote 12
Other national initiatives to survey drug prices include Australia's Illicit Drug Reporting System (IDRS) and New Zealand's National Drug Survey. The IDRS, administered by the Australia's National Drug and Alcohol Research Center, aims to monitor patterns in the price, purity, and availability of drugs, including cannabis, so as to identify trends in Australia's illegal drug markets. The initiative triangulates data collected from: 1) annual surveys of intravenous drug users, which include questions concerning the price of users' most recent cannabis purchase within the previous six months; 2) interviews with professionals who have regular contact with individuals in the cannabis market; and 3) official and self-report data, including drug seizure data and national household surveys of drug use. In contrast, New Zealand's National Drug Survey obtains a representative sample of the population aged 13 to 45 years to be interviewed on their drug purchases. Using computer-assisted telephone interviews, respondents that answer positively to having tried cannabis in the past year are asked about the method of procurement (e.g. obtained for free, purchased, or grew themselves), the frequency of purchases, the quantity purchased, and, for each quantity, the amount they would expect to pay (Wilkins et al., 2005). In Canada, by comparison, self-report surveys, including the Canadian Tobacco, Alcohol, and Drugs Survey (CTADS)Footnote 13 and the Canadian Community Health Survey-Mental Health (CCHS-MH), capture prevalence of cannabis users and frequency of cannabis consumption, but do not provide information on price, quantities purchased, or quantities consumed.
More focused efforts to obtain cannabis transaction data include convenience samples through online surveys, such as the Global Drug Survey (GDS), and more local efforts, such as those by Pacula, Jacobson, and Maksabedian (2016). The GDS is an independent research company based out of London that produces reports for different organizations. The GDS consists of an anonymous online survey which is promoted through media sources and is administered annually in the middle of November for approximately six weeks. For 2014 and 2015, the GDS reported receiving over 100,000 responses.Footnote 14 Pacula et al. (2016), conducting a more local effort, relied on survey data collected by the research firm GfK, which grouped 2,009 English-speaking adults over the age of 18 across Colorado, Washington, Oregon, and New Mexico. Each respondent was asked about their purchasing behaviour, including prices paid for cannabis.
A second source of self-report price data concerns crowdsourcing websites. This shift to online sources has come at the result of the emergence of websites, such as the Price of Weed and High Times, which allow individuals to anonymously submit price data about their cannabis purchases, including the self-perceived quality, quantity, and location of purchase. This method of data collection affords a number of advantages over traditional surveys, perhaps the most obvious of which is the ability to access otherwise hard to reach populations on a truly massive scale. However, a significant drawback is its reliance on a convenience sample and the inability to distinguish the number of transactions reported per person.
The Price of Weed is a dedicated website for users to submit price data on their most recent cannabis transaction. The website provides a systematic venue for users to report their purchase prices, providing a drop-down list of possible locations, quantities (e.g. ranging from one gram to one ounce), and quality (e.g. low, medium, high). In contrast, High Times invites users to self-report the price, strain, and location of their cannabis purchases by email or via Twitter. The data is then published in monthly Trans High Market Quotation (THMQ) reports that contain a year-to-date US price index, average per ounce prices for the top five reported strains, price observations for many US states, and prices of international submissions.
Price of Weed data has been used either as a sole data source or to augment traditional data sources to estimate cannabis prices (Boucher, Lawrence, & Maslov, 2013; Davis, Geisler, & Nichols, 2016; Malivert & Hall, 2013; Parliamentary Budget Officer, 2016; Werb et al., 2012; Zook, Graham, & Stephens, 2011) and has been found to share some degree of correlation with official and other self-reported datasets (Caulkins & Bond, 2012). One of the most comprehensive studies to estimate illicit cannabis prices in Canada relies on data from Price of Weed. Boucher et al. (2013) produced monthly estimates by city and province using more than 5,700 self-reported observations submitted by users for the period spanning September 2010 to November 2012, finding that the non-weighted median national price was $7.39 per gram, irrespective of quality. Apart from seasonal and regional variation, prices were relatively stable over the measurement period. Users in Newfoundland and Labrador reported some of the highest prices for cannabis ($10.00 per gram), whereas users in Quebec reported the lowest cannabis prices ($5.63 per gram). The relatively higher prices in Newfoundland and Labrador were attributed to the strong local demand, the small scale of local production, and the costs incurred due to transportation to remote local communities.
Self-reported data provide a means to capture users not found in official sources, although the prices captured include much more random variation (Caulkins & Bond, 2012). Besides the usual concerns of reliability, in addition to the previously discussed measurement issues related to quantity and quality of purchase, self-reported drug price data has repeatedly been criticized for capturing the prices paid by users for their most recent purchase, which may not necessarily reflect their typical purchase. However, past research finds no difference in the dollar amount of users' most recent purchase, when compared to the average value of their other recent and past purchases (see Bond et al., 2014).
Online Drug Markets
More recently, research has started to consider online drug markets as a source for drug prices. Online drug markets, henceforth referred to as cryptomarkets (Martin, 2014), have surfaced due in part to the emergence of the ‘dark web'.Footnote 15 The dark web refers to content hosted on ‘darknets' or peer-to-peer anonymity networks leveraging the infrastructure of the Internet and which are accessible only through encrypted Internet browsers, such as The Onion Router (Tor) (Owen & Savage, 2015). Cryptomarkets follow a design resembling that of legitimate marketplaces, such as Amazon™ or eBay™, such that vendors advertise entire inventories of products to prospective buyers, with product listings denoting prices by quantity, shipping information, and customer reviews. Cannabis represents a sizeable proportion of all product listings on cryptomarkets. Cannabis originating from Canada was found to represent at least 6 percent of all known product listings advertised on the Silk Road, one of the original online cryptomarkets (Broséus et al., 2016; Christin, 2013; Martin, 2014).
Cryptomarkets facilitate direct links between producers and consumers, bypassing the wholesale level of the drug market (Martin, 2014) and attracting consumers through lower advertised prices, wider selection variety, and better quality (Barratt, Ferris, & Winstock 2014). An estimated 7 to 18 percent of cannabis users have consumed drugs ordered from cryptomarkets such as Silk Road (Barratt et al., 2014). Despite high levels of participation, studies have found that the collective revenues of cryptomarket vendors represent a meager share of the global drug market (Kruithof et al., 2016; Soska & Christin, 2015). Revenue estimates are useful for gauging the size and scope of the online market for drugs, but are not all that useful for policy assessment compared to drug price estimates. However, there are no current price estimates for cannabis or other drugs purchased from cryptomarkets.
The available research suggests that the factors influencing drug prices advertised on cryptomarkets are likely to be similar to those that influence prices in traditional drug markets. Variations in the advertised price for drugs appear to be largely attributed to the costs incurred through domestic and/or international shipping, although risk premiums associated with package seizure may also be factored into the retail price (Christin, 2013). Price variation also stems from the quantity of drug(s) sold, as wholesale purchases garner lower per gram prices (Aldridge & Décary-Hétu, 2016). Although most cannabis price listings found online are for quantities under $100, an estimated 10 percent of listings exceed the thousand-dollar threshold often associated with wholesale transactions (Kruithof et al., 2016). Prices are also affected by what are referred to as ‘holding prices' or temporary increases in prices when product inventory is low or completely out of stock, which may skew price estimates upward (Soska & Christin, 2015).
Compared to more conventional data sources, price listings sourced from cryptomarkets provide current price data for standardized quantities of drugs that are reported directly by drug suppliers. These data also capture international drug purchases, an aspect of drug markets not traditionally accounted for within official data or self-report surveys (for an exception, see Barratt et al., 2014). But, as with official data sources, the drawback of drug price data sourced from cryptomarkets is the biased view toward the supply-side view of drug markets, with very little information regarding drug users themselves (Aldridge & Décary-Hétu, 2016). Furthermore, the manner in which cryptomarkets coordinate purchases between drug users and suppliers is in no way reflective of a typical drug purchase involving known acquaintances in personal settings.
Summary
Each of the data sources described provides complementary insight into the drug market. Official data sources reflect contact between law enforcement, users, and suppliers, whereas self-report surveys reflect prevalence rates of drug use and prices paid by users. Data from online cryptomarkets capture product listings and prices set by suppliers. While it is most common for price estimates to be calculated using a single data source, triangulation of price data allows for a cross-comparison of drug prices derived from different methods of reporting, which ultimately yields more reliable estimates. Comparing drug prices across sources also enables an assessment of the endogenous and exogenous factors that influence prices across different facets of drug markets (e.g. factors that influence price in traditional drug markets as compared to cryptomarkets). Analysis of this sort would also provide knowledge of the factors that have a ubiquitous influence on the economics of drug markets and which are simply characteristic of particular facets of drug markets.
Price Elasticity of Cannabis Demand
Substantial scholarly and policy attention has been directed toward the link between drug prices and drug consumption. Generally referred to as the ‘price elasticity of demand' in the economics literature, studies in this area aim to provide estimates of the degree to which changes in prices affect the consumption of drugs. Specifically, price elasticity of demand measures the change in quantity demanded following a 1 percent change in price. Demand is considered elastic if an increase of 1 percent in price leads to a greater than 1 percent change in quantity demanded. Demand is considered inelastic if a 1 percent increase in price leads to a less than 1 percent change in quantity demanded. Estimates of price elasticity provide insight into how changes in price, either due to policy factors or internal market conditions, influence rates of cannabis usage.
Understanding how price changes influence the total amount of cannabis consumed (referred to as the full price elasticityFootnote 16) depend on how the price changes affect the probability that someone uses cannabis (participation elasticity) and the amount of cannabis consumed by those who choose to use it (conditional elasticity). Since most surveys do not ask about the amount of cannabis consumed, good information about conditional elasticity is limited. Thus, this section will focus on past research on participation and full price elasticities of cannabis demand.
Participation Elasticity
Most studies of cannabis price elasticity calculate participation estimates. This trend may be attributed to a lack of data on the amount of cannabis consumed by those who use it. Studies of participation elasticity have primarily been conducted in the US and Australia, often relying on national surveys that ask users about whether they have used cannabis within a set time frame (e.g. past-month or past-year). Studies in the US have examined participation elasticity across different sub-populations, including youth, college students, and arrestees, whereas studies in Australia have primarily relied on general population studies, subdividing estimates across adult and youth respondents. Here, participation elasticity estimates on US samples are reviewed, before turning to estimates on Australian samples.
Pacula et al. (2001) represents one of the first studies to estimate participation elasticity of cannabis demand among youth. Relying on a nationally representative school-based survey, Monitoring the Future (MTF) from 1982 to 1998, the authors calculated cannabis usage prevalence rates among high school seniors who had used cannabis in the past-month and past-year. Cannabis prices were obtained from the DEA's Illicit Drug Wholesale/Retail Price Report, which provided the retail price of cannabis across states. Elasticity was estimated through a repeated cross-sectional analysis, which controlled for students' perception of harm stemming from regular cannabis use and the potency of cannabis, measured by THC level. Among high school students, participation elasticity ranged from -0.002 to -0.69 for monthly participation and -0.06 to -0.47 for annual participation. Given concerns over the possible endogeneity of the covariatesFootnote 17, specifically concern over whether students' perceptions of the harm of cannabis use were correlated with cannabis prices, Pacula et al.'s (2001) preferred participation elasticity estimate for past-month and past-year use was -0.30. Based on these results, the authors concluded that a 10 percent drop in prices would increase the number of youth reporting monthly and annual use by 3 percent.
Jacobson (2005) conducted a similar study using MTF data to estimate cannabis usage prevalence among youth aged 15 to 19 years and data from the NHSDA to estimate cannabis usage prevalence among the general population. In contrast to Pacula et al. (2001), price data was also obtained from user self-reports on High Times and law enforcement data from STRIDE.Footnote 18 Despite relying on an alternative data source, results were consistent with Pacula et al. (2001), showing a negative relationship between prices and prevalence of cannabis use, with price increases leading to drops in the overall number of users. The findings also highlighted a feedback loop, in which denser markets—areas with larger youth cohorts—were associated with lower prices, which in turn led to increased use (also see Caulkins, 2007b).
Studies by Williams, Pacula, Chaloupka, and Wechsler (2004, 2006) have also found prevalence of cannabis use among college students to be sensitive to changes in prices. Data on cannabis use among college students was obtained from pooled cross-sectional surveys from three waves (1993; 1997; 1999) of the College Alcohol Study (CAS), a nationally representative study of college students aged 18 to 24 years, administered by the Harvard School of Public Health. Cannabis price data was obtained from the IDPPR. Controlling for students' alcohol use, the maximum fine for possession of small amounts of cannabis, and state fixed effects, Williams et al. (2004) estimated college students' past-month participation elasticity to be -0.24, with a similar result for past-year participation elasticity (-0.20), suggesting a 10 percent increase in price would lead to a drop in past-month users of nearly 2.5 percent and a 2 percent drop among past-year users. In a follow-up study controlling for cocaine use, Williams et al. (2006) found participation elasticity to be slightly more conservative, estimating an annual cannabis participation of -0.19 among college students. However, running additional analyses, and dividing their sample into younger (aged 18 to 20) and older college students (aged 21 to 24), the authors found that older college students were more responsive to changes in prices (-0.26) as compared to younger students (-0.16).
Estimates of participation elasticity among the general US population have generated similar results (DeSimone & Farrelly, 2003; Rhodes, Johnson, Han, McMullen, & Hozik, 2001). DeSimone and Farrelly (2003) estimated annual participation elasticity and frequency of use across pooled cross-sectional data from the NHSDA between 1990 and 1997. Similar to Pacula et al. (2001), data on cannabis prices was obtained from the DEA's IDPPR. Although the authors found that cannabis participation was negatively associated with prices, the relationship was very weak, with results sensitive to the inclusion of additional covariates. Other researchers have claimed that this weak relationship is not surprising given the lack of variation in their price data (capturing a shorter period than earlier work) (Pacula, 2010). However, Rhodes et al. (2001), who also relied on NHSDA data (1988 to 1997), found prices to be significantly associated with cannabis use among youth, but not adults. The divergent results may be partially explained by the different sources of price data, with Rhodes et al. (2001) representing one of the few studies to use STRIDE data to estimate cannabis prices. Rhodes et al. (2001) also represents one of the only studies to examine participation elasticity among heavy users. Examining cannabis use among adult arrestees, the authors used the ADAMFootnote 19 survey for the years 1989 to 1998. Results showed that hard-core users, measured as arrestees who used cannabis more than ten times a month, were more sensitive to price changes (-2.79), when compared to moderate users (-2.65). These results suggested that a 1 percent increase in the price of cannabis would reduce the proportion of hard-core cannabis use among adult arrestees by nearly 3 percent.Footnote 20
Whereas multiple sources have been used to generate estimates of use to calculate participation elasticity of cannabis demand in the US (e.g. ADAM, CAS, MTF, NHSDA), estimates of participation elasticity of cannabis demand in Australia rely primarily on the National Drug Strategy Household Survey (NDSHS). The NDSHS is a general population survey that has been administered every two to three years since 1985, aiming to capture a representative sample of Australians aged 14 years and older (aged 12 years and older for 2004 surveys and onwards). The survey is designed to provide data on attitudes and behaviour associated with licit and illegal drug use among the noninstitutionalized civilian population in Australia. Important for price elasticity estimates, questions on cannabis use over the past year have allowed researchers to examine the prevalence of cannabis use among Australians.
One of the first studies to calculate participation elasticity of cannabis demand in Australia aggregated NDSHS survey responses to create a longitudinal time series in the annual prevalence of cannabis use (Clements & Daryal, 2003). Their estimation of cannabis prices relied on the assumption that such prices were constant over time (from 1988 to 1995) and focused on changes in the relative price between cannabis and alcohol. The authors found a participation elasticity of -0.50. This study is unique among Australian studies in that the authors aggregated the data to create longitudinal estimates and did not use observed cannabis prices. In contrast, most other studies in Australia estimate participation elasticity using price series data derived from undercover purchases made by state-level law enforcement and the IDRS.
Cameron and Williams (2001) used pooled cross-sectional NDSHS data from 1988 to 1995 to examine price elasticity, comparing individual-level changes in cannabis use relative to cannabis prices derived from official sources. Despite a different approach, results were similar to Clements and Daryal (2003), with a slightly higher price elasticity of -0.89. However, using the same data source, Williams et al. (2004) controlled for state-level effects and found more conservative estimates of -0.18. By including such controls in their models, the authors were able to reduce the likelihood that differences in drug use across states would be wrongly attributed to price, rather than state-specific factors, such as differences in attitudes toward cannabis or variation in law enforcement.
Other studies of price elasticity in Australia have examined how polysubstance users— individuals who use cannabis in conjunction with other drugs—respond to changes in cannabis prices. Williams and Mahmoudi (2004) found that individuals who used both cannabis and alcohol together were more sensitive to changes in price. Using pooled cross-sectional NDSHS data for 1988 to 1998 and official price data, the authors found that annual prevalence rates of cannabis use were negatively related to price, but that polysubstance users who reported both cannabis and alcohol were most affected by price changes. Similar results were found by Ramful and Zhao (2009), who concluded that cannabis users who also used cocaine and heroin were more likely to be influenced by price changes than just cannabis users alone. Results across both studies suggest that individuals who consume more than one drug are more likely to be influenced by price changes, stemming from a substitution effect of one drug for another.Footnote 21
Consistent with US studies examining the participation elasticity of cannabis demand, Australian studies have demonstrated that individuals in their early twenties are more sensitive to changes in cannabis prices. Using pooled NDSHS data from 1988 to 1998, Williams (2004) demonstrated that younger cannabis users (aged 20 to 24 years) were more sensitive to price changes as compared to older age cohorts (aged 25 years and above). This is consistent with studies that have examined the decision to ‘start using cannabis', which have found that lower prices are associated with an earlier age of first use. Using responses to the question “about what age were you when you first used marijuana/cannabis?” drawn from the NDSHS, van Ours and Williams (2007) found that, among a sample of respondents aged 14 to 22 years, being a Native born Australian, having lower education, as well as price predicted initiation into cannabis use, with a price elasticity of -0.50 to -0.70.
Full Price Elasticity
Full price elasticity estimates aim to examine the degree to which changes in cannabis prices influence the total amount of cannabis consumed. Few general population surveys ask cannabis users about consumption, so researchers have had to leverage other data sources. Here, four studies that attempt to estimate the full price elasticity of cannabis demand are outlined.Footnote 22 The first two apply behavioural simulation approaches, examining how current users would respond to hypothetical price changes. The latter two rely on transaction data across samples of current users. All studies find that users are sensitive to changes in price, with increases in prices decreasing the total quantity of cannabis consumed.
Nisbet and Vakil's (1972) research represents one of the first studies to examine the full price elasticity of cannabis demand, calculating both participation and full price elasticity estimates among a sample of college students. The authors calculated estimates from self-report questionnaires that were mailed to UCLA students, who were asked to report their prevalence and frequency of cannabis use over the past month, as well as how a price change would influence their cannabis use. Based on 926 returned questionnaires, estimates of participation elasticity fell within the range of -0.7 to -1.0, while full price elasticity was estimated at a slightly higher range of -1.01 to -1.51, suggesting that demand for cannabis was quite sensitive to price changes.
Collins, Vincent, Yu, Liu, and Epstein (2014) found similar results among a sample of 59 regular cannabis users. In contrast to the sample obtained by Nisbet and Vakil (1972), the authors recruited regular cannabis users, defined as those using cannabis at least three times per week, between the ages of 18 to 25 years in the metropolitan area of Buffalo, New York. Participants were asked to complete a computerized purchasing task where they were to report their hypothetical high grade cannabis use across 16 increasing price points that ranged from US$0 to US$160 per joint.Footnote 23 Participants were shown photos of ‘average sized' cannabis joints, which were defined as weighing approximately half a gram. The authors found that demand for high-grade cannabis was inelastic across prices that ranged from US$0 to US$13 a joint, whereas demand was elastic for higher priced cannabis, ranging from US$15 to US$160 per joint, suggesting individuals who used cannabis more frequently are more sensitive to fluctuations in price. This is consistent with previous studies that have suggested heavier users are more likely to have less disposable income to spend on cannabis (Pacula & Lundberg, 2014). Overall elasticity of demand was estimated to be -1.75. Although the estimate is slightly higher than that obtained by Nisbet and Vakil (1972), this may be due to the authors' sample of regular users as compared to a general sample of college students.
More recently, studies have turned to transaction data to calculate the full price elasticity of cannabis demand, obtained by interviewing users about their most recent purchase (Ben Lakhdar et al., 2016) and through online crowdsourcing platforms (Davis et al., 2016). In order to calculate full price elasticity, Ben Lakhdar et al. (2016) interviewed a sample of 268 heavy cannabis users contacted through urban centers and techno-festivals in France. Participants were asked about their most recent cannabis purchase, including the price and the perceived quality of the drug (e.g. measured on a scale of 1 to 10). In addition, interviewers asked respondents if they could purchase a small sample of the drug for toxicological analysis to assess the true potency, as measured by THC content. The authors found that a 10 percent decrease in prices would increase near-daily users' consumption by upwards of 2 percent. The study was one of the first to demonstrate that potency has a positive effect on a user's consumption, with higher potency associated with larger transactions; however, including potency in the models did not impact price elasticity estimates. The authors noted that their reliance on cross-sectional price observations limited them to providing short-term estimates, as they were unable to control for historical price observations.
Davis et al. (2016) found slightly more conservative estimates of full price elasticity using cannabis transactions reported to the Price of Weed crowdsourcing website. The authors relied on 23,611 cannabis transactions reported from September 2010 to August 2011, which provided information on the quantity, quality, and price of the purchase. While this design represents an advantage over most studies examining cannabis price elasticity, providing a national sample of self-reported cannabis prices, the main limit of this approach is that the sample is not random and each transaction cannot be assumed to be independent (e.g. one person may submit multiple transactions to the website). To mitigate this limitation, the authors control for clustering by estimating a weighted Ordered Least Squares regression (OLS) with cluster robust standard errors. Findings showed that the price elasticity for cannabis across the US ranges from -0.67 to -0.79.
Importantly, Davis et al. (2016) also represents one of the few studies to include supply-side instruments in their models.Footnote 24 In their models, Davis et al. (2016) integrate electricity rates, distance to Mexico City, and medical cannabis laws, all of which are endogenous factors found to influence cannabis prices: electricity rates account for a large proportion of total cost of domestically produced cannabis; distance to Mexico City accounts for a sizeable cost of internationally produced cannabis, particularly given that prior estimates put cannabis produced in Mexico at 40 to 67 percent of all cannabis consumed in the US (Kilmer et al. (2010)Footnote 25; and medical cannabis laws were included due to their relevance for producers, often allowing for home cultivation and, thus, lowering costs associated with supply. The key assumption is that electricity rates, distance to Mexico City, and medical cannabis laws are not correlated with the error term in the demand equation, but do help explain cannabis prices. When including supply-side instruments, the authors found estimates of price elasticity obtained through OLS regression with IVs to be similar or slightly larger than estimates obtained through standard OLS regression in absolute value, ranging from -0.60 to -0.79 as compared to the more consistent -0.69 estimate across models.Footnote 26
Summary
A review of the literature suggests that participation and full price elasticity estimates vary with respect to the heterogeneity observed across different populations from which samples are drawn. In the US, participation elasticity estimates range from -0.20 to -0.30 for youth and student populations, with findings generally suggesting that demand for cannabis among youth is more sensitive to changes in price compared to adults. Estimates controlling for cannabis consumption further suggest that participation elasticity is stronger among heavy users (-2.79) compared to more moderate users (-2.65) in a sample of US arrestees. Findings from Australian studies also indicate that participation elasticity is more sensitive among youth compared to adults, with estimates ranging from -0.50 to -0.89. Results from samples drawn from the general population by comparison, indicate that participation elasticity ranges from -0.50 to -0.70. However, by controlling for heterogeneity across regional drug markets using state-level fixed effects, participation elasticity estimates (-0.18) become more consistent with the more conservative US estimates. Full price elasticity, in contrast, ranges from -1.01 to -1.51 among US college samples and may be as high as -1.75 for the general population. Research from France also supports findings from the US, with estimates in the range of -1.7 to -2.1, although findings rely on a sample of heavy cannabis users. In comparison, an analysis using a sample drawn from nationally crowdsourced data found much more conservative price elasticity estimates, ranging from -0.67 to -0.79 across the continental US, results which may be attributed to the larger variation in self-reported prices compared to prices derived from official data sources. These ranges are consistent with findings from studies that suggest price elasticity estimates tend to range by one half, results that hold true across various contexts (e.g. Clements, 2008; Kilmer et al. 2010).Footnote 27
Cannabis Prices in Canada
The price of cannabis in Canada has received scant attention. With the exception of a few reports examining cannabis prices (e.g. Bouchard & Dion, 2009; Boucher et al., 2013; Parliamentary Budget Officer, 2016), studies have rarely examined prices in the Canadian cannabis market. This section examines cannabis prices from 2011 onward, drawing from user self-reported purchases. The cornerstone of the analysis relies on user self-reported purchases obtained from Price of Weed, which allows for longitudinal analysis of prices from 2011 to 2015. Complementing this is an analysis of contemporary prices (2016) using data from the Price of Weed, as well as licit prices as listed by licensed medical marijuana producers on their websites and on Lift.co. For each analysis, variation in prices across provinces, the quality of the cannabis, and size of the transaction are examined.
Price of Weed Data
To estimate cannabis prices in Canada, data from the Price of Weed was obtained for the years 2011 to 2015. The Price of Weed is an online crowdsourcing platform for users to anonymously submit data on their most recent cannabis transaction. Cannabis users are invited to enter the price, quantity, and self-assessed quality of their purchased product, as well as the location of the transaction. The website was initially launched in 2010 with the aim of answering “What is marijuana really worth?” Initially, the administrators advertised the site on three online communities, including Hacker News and two Reddit forums focused on cannabis (Hin, 2015), and has since been used to estimate cannabis prices across countries, including Canada (Boucher et al., 2013; Parliamentary Budget Officer, 2016) and the US (Caulkins & Bond, 2012; Davis et al., 2016).
Because the website does not make price data for previous time periods publicly available, a dataset was pieced together from data that were previously collected, from three different sources. Data spanning 2011 to 2012 was obtained from Boucher et al. (2013), who collected and analyzed the data in perhaps the only study to estimate cannabis prices within and across regional markets in Canada (n = 3,987 transactions).Footnote 28 Data covering 2013 to 2014 was harvested from the Internet ArchiveFootnote 29, a non-profit digital library providing public access to collections of digital files, including archival website content (n = 2,245 transactions).Footnote 30 Data for 2015 was obtained from Luca Giommoni at Cardiff University, who, in collaboration with David Décary-Hétu at the Université de Montréal, used an automated webcrawler to extract the data daily over this period (n = 2,926 transactions).Footnote 31
Data from all three sources were first consolidated, before being cleaned to remove data entry errors and outliers using the same procedures outlined in Boucher et al. (2013). First, all price entries of $0 were removed, a procedure also consistent with Davis et al., 2016 (n= 30). Second, price entries consisting of three identical consecutive digits (e.g. $999, $333) were dropped from the analysis, based on the assumption that these represented false entries (n= 5).Footnote 32 Third, high price outliers were removed based on the assumption that the maximum value of a high quality ounce of cannabis is $1,000 ($35.21 per gram).Footnote 33 Price entries that exceeded this amount (n=107), as well as price entries of $35.21 per gram that were not high quality (n=13) were removed. Fourth, low price outliers were excluded, including ounce-sized purchases that had a self-reported price lower than the mean standardized price per gram for all quantities other than those reported by ounce (n=75) (e.g. any ounce entries that had a total reported price less than $8.74).Footnote 34 Through these procedures a total of 227 cases (2%) were removed.Footnote 35
The consolidated dataset comprises 8,931 cannabis transactions across all Canadian provinces and territories for a five-year period (2011-2015).Footnote 36 For each transaction, data is available for the: 1) price; 2) quantity (1 gram, 5 grams, 10 grams, an eighth, a quarter, a half ounce, an ounce); 3) quality (low, medium, high); 4) date of purchase; and 5) location of purchase (city and province). All prices and quantities in the following analyses are reported in grams.Footnote 37
Cannabis Prices
In this section cannabis prices in Canada are estimated. Price estimates are broken down by province, self-reported qualityFootnote 38, and location of the transaction.
The number of self-reported cannabis transactions across Canada varies per province/territory. Although this distribution generally reflects the geographic distribution of the Canadian population, it only represents a subset of all cannabis users. For instance, the 7,011 reported transactions across Quebec, Ontario, Alberta, and British Columbia represent 79 percent of the sample, and while these same provinces account for an estimated 86 percent of the Canadian population, they only represent approximately 40 percent of the cannabis using population.Footnote 39
Table 1 shows the average cannabis price according to self-reported quality across Canada.Footnote 40 For the years under study, the average national price of high quality cannabis is $7.69 per gram (Standard Deviation (SD)Footnote 41: $3.63), followed by low quality (average: $7.26; SD: $5.59) and medium quality cannabis (average: $7.14; SD: $3.81). Cannabis prices tend to be lower in provinces associated with higher cannabis production. For instance, the highest cannabis prices are found in Newfoundland and Labrador across all price categories, with only the Northwest Territories and Nunavut reporting higher prices for the same quality cannabis.Footnote 42 Cannabis prices are lowest in Quebec and British Columbia for most self-reported quality of cannabis. Surprisingly, cannabis prices in New Brunswick and Prince Edward Island—not traditionally known as growing areas—are reported to be lower than the rest of Canada, which may be in part due to their proximity to both Quebec and the US. These results are consistent with those of Boucher et al. (2013) and the Parliamentary Budget Officer (2016), as both reports found that Prince Edward Island, New Brunswick, Quebec, and British Columbia had lower than average prices compared to other provinces.
In general, higher quality cannabis garners higher per gram prices across provinces, although there are some exceptions. In the territories, as well as Saskatchewan, prices for low quality cannabis are slightly higher. Disparities in prices reported by quality are likely attributed to two reasons. One of the reasons concerns users' general inability to assess what is considered fair or poor quality cannabis in comparison to cannabis of higher quality (Ben Lakhdar, 2009), and vice versa. The other is the effect of quantity discounts in the calculation of standardized prices, given that there is much more variability in the quality of smaller purchases (Caulkins, 1995).
Regression analyses demonstrate that price is significantly related to quality across New Brunswick, Quebec, Ontario, Manitoba, Alberta, and British Columbia with all six provinces reporting average higher prices for higher quality cannabis. The non-significant results for the remaining provinces and territories is likely a function of weak statistical power stemming from small sample sizes, especially once the data was partitioned by quality. Nonetheless, the findings of the analysis suggest that high quality cannabis tends to be purchased at cheaper prices in Quebec and British Columbia, provinces well-known for large scale illegal production. But the lower prices may also be tied to local licit production given the evidence that users residing in jurisdictions permitting medical cannabis production pay lower per gram prices for higher quality cannabis, in contrast to the higher priced cannabis purchased from the illegal market that is often of lower quality (Davis et al., 2016).
| Province/ Territory |
High Quality | Medium Quality | Low Quality | Sig. | |||
|---|---|---|---|---|---|---|---|
| Mean (SD) | Median | Mean (SD) | Median | Mean (SD) | Median | ||
| NL | 9.24 (4.12) |
9.60 | 9.24 (4.86) |
8.90 | 9.48 (4.57) |
7.04 | .769 |
| PE | 7.59 (5.08) |
6.51 | 7.59 (4.52) |
7.04 | 6.14 (3.46) |
5.63 | .437 |
| NS | 8.22 (3.93) |
7.75 | 7.58 (3.06) |
7.44 | 7.65 (5.30) |
7.04 | .121 |
| NB | 7.01 (2.76) |
7.04 | 6.28 (3.31) |
5.63 | 7.02 (4.60) |
5.63 | .035 |
| QC | 6.83 (3.79) |
6.08 | 5.85 (3.23) |
5.33 | 6.33 (5.55) |
4.93 | .000 |
| ON | 8.03 (3.6) |
7.75 | 7.18 (3.61) |
7.04 | 7.71 (6.33) |
7.00 | .000 |
| MB | 8.03 (3.76) |
7.75 | 8.04 (3.85) |
8.00 | 5.76 (4.18) |
5.88 | .045 |
| SK | 8.16 (3.60) |
8.45 | 8.31 (4.13) |
8.45 | 8.56 (6.17) |
9.23 | .560 |
| AB | 8.02 (3.18) |
7.75 | 7.55 (4.02) |
8.45 | 7.18 (5.18) |
6.17 | .000 |
| BC | 6.96 (3.31) |
7.04 | 6.40 (3.54) |
6.34 | 6.41 (4.57) |
5.99 | .000 |
| YT | 9.79 (3.40) |
8.80 | 9.27 (5.85) |
8.63 | 11.272 | 11.27 | .428 |
| NT | 9.74 (6.81) |
8.80 | 12.18 (4.79) |
10.56 | - | - | .067 |
| NU | 13.04 (7.89) |
8.80 | 14.28 (11.15) |
16.09 | 10.56 (8.13) |
10.56 | .459 |
| CA | 7.69 (3.63) |
7.21 | 7.14 (3.81) |
7.04 | 7.26 (5.59) |
6.00 | .000 |
| Note 1: Only one transaction of low quality cannabis was reported to Price of Weed for the Yukon from 2011 to 2015. Note 2: All bivariate tests were conducted using non-parametric analyses. |
|||||||
Table 2 shows that, in Canada, most users self-reporting cannabis transactions to Price of Weed perceive their cannabis purchases to be of medium (41%) or high (56%) quality, with very few users reporting purchasing low quality grade cannabis (4%) (Table 1). Combining high and medium quality transactions, all provinces, and most territories (except Nunavut) reported that over 90 percent of all their purchases were of high or medium quality, with this tendency highest in the Northwest Territories (100%) and British Columbia (98%). This trend is consistent with users' self-reported purchases in the US (Davis et al., 2016), and may be due in part to the challenges of diluting cannabis, or be related to sampling biases. While self-assessed quality does not match true quality as measured by THC content (see Ben Lakhdar et al., 2016), the validity of self-reports may be augmented in this report, given that they were likely to have been made post-consumption of the product.
| Province/ Territory |
(N) | High Quality | Medium Quality | Low Quality |
|---|---|---|---|---|
| NL | 169 | 33% | 59% | 8% |
| PE | 96 | 33% | 59% | 7% |
| NS | 367 | 35% | 61% | 4% |
| NB | 280 | 33% | 63% | 5% |
| QC | 1,088 | 39% | 56% | 5% |
| ON | 3,194 | 40% | 56% | 3% |
| MB | 506 | 44% | 53% | 3% |
| SK | 386 | 39% | 58% | 3% |
| AB | 1,177 | 40% | 56% | 4% |
| BC | 1,552 | 49% | 49% | 2% |
| YT | 49 | 24% | 73% | 2% |
| NT | 46 | 22% | 78% | 0% |
| NU | 21 | 52% | 29% | 19% |
| CA | 8,931 | 41% | 56% | 4% |
Respondents visiting Price of Weed likely represent a subset of the population who have more regular access to the Internet, thus capturing those who have higher incomes and may be more likely to purchase a more potent product. This represents one of the main limitations of Price of Weed data, in that it does not represent a random or representative sample, and does not provide information on user demographics. Further, entries are not independent, with one user able to enter as many price transactions as they wish. Therefore, findings should be interpreted with these limits in mind.
Size of Cannabis Transactions
As shown in Table 3, 14.2 grams (one half ounce) of cannabis represents the typical purchase across Canada, with the largest cannabis transactions occurring in Quebec, Yukon, and Nunavut (median: 28.4 grams per transaction). However, these estimates likely reflect a lower bound, given that the Price of Weed website restricts reporting to a maximum of one ounce. Purchase sizes are similar to those reported to Price of Weed from the US, with the average transaction size reported to be 13.9 grams (Davis et al., 2016) and transactions reported for over the past decade to the NSDUH, which has stayed constant at approximately one half ounce (Kilmer et al., 2014).
| Province/ Territory |
Quantity (g) | |
|---|---|---|
| Mean (SD) |
Median | |
| NL | 16.25 (11.49) |
14.2 |
| PE | 17.22 (10.79) |
14.2 |
| NS | 16.86 (11.32) |
14.2 |
| NB | 17.23 (11.39) |
14.6 |
| QC | 18.36 (11.09) |
28.4 |
| ON | 16.73 (10.97) |
14.2 |
| MB | 16.15 (10.95) |
14.2 |
| SK | 16.79 (11.01) |
14.2 |
| AB | 16.97 (10.81) |
14.2 |
| BC | 17.29 (11.11) |
14.2 |
| YT | 18.20 (11.29) |
28.4 |
| NT | 15.90 (10.87) |
14.2 |
| NU | 27.05 (4.27) |
28.4 |
| CA | 17.07 (11.03) |
14.2 |
Figure 1 shows the relationship between the size of the cannabis transaction and associated price. Across all provinces there is evidence of bulk discounts. All provinces and territories show a downward trend, with larger cannabis transactions tending to be cheaper. The downward trends are consistent with other assessments of illegal markets. UNODC (2010) reported a 110 and 129 percent markup for cannabis resin and herb, respectively, from wholesale to retail level across member states in a given year, with the markup varying across countries (p. 191).

Note: Y-axis is logged prices per gram, whereas X-axis is logged quantity purchased in grams.
Image description
Figure 1:
The chart represents the trend for the price of cannabis by quantity of cannabis purchased. There are twelve windows to the chart, representing the ten provinces and two territories (Yukon and Nunavut). Starting from the upper left corner, the first window represents Newfoundland and Labrador, followed by Prince Edward Island, Nova Scotia, and New Brunswick. The next four windows represent Quebec, Ontario, Manitoba, and Saskatchewan. The last four windows represent Alberta, British Columbia, Yukon, and Nunavut. The Y-axis for each of the twelve windows represents the logged price of cannabis, whereas the X-axis represents the logged quantity of purchased cannabis. The dots in each of the windows represent the logged cannabis prices, and the line represents the fitted values, and as such a trend for the prices. In all twelve windows, there is a noticeable downward trend, meaning there seems to be evidence of bulk purchase discounts.
Trends in Cannabis Prices
Cannabis prices across provinces and territories have stayed relatively stable over the five-year period for which data are available. Figure 2 shows the median cannabis price, as well as the lower and upper bound of cannabis prices across each province and territory from 2011 to 2015. The year is broken down into seasons (Winter, Spring, Summer, Fall) representing 21 time points. The line parallel to the x-axis represents the median cannabis price across Canada across this period ($7.04). Cannabis prices in Canada vary according to season (p<.001), with prices highest in Summer (median: $7.46), as compared to the prices reported for Spring, Fall, and Winter (all report a median price of $7.04). Prices are subject to much greater fluctuation in the territories, save once again for the Yukon Territory. This volatility is especially evident for the prices reported in Nunavut, in part due to the lower number of observations. Caution should be taken when interpreting these results, given that prices were aggregated across qualities and, thus, findings may reflect changes in the distribution of purchases of high quality cannabis.

Image description
Figure 2:
The chart represents the trend for the price of cannabis across provinces and territories for the years under study. There are twelve windows to the chart, representing the ten provinces and two territories (Yukon and Nunavut). Starting from the upper left corner, the first window represents Newfoundland and Labrador, followed by Prince Edward Island, Nova Scotia, and New Brunswick. The next four windows represent Quebec, Ontario, Manitoba, and Saskatchewan. The last four windows represent Alberta, British Columbia, Yukon, and Nunavut. The Y-axis for each of the twelve windows represents the price of cannabis, whereas the X-axis represents a time period ranging from winter of 2011, ending with the fall of 2015. There are twenty one time points in each of the windows. The dots in each window represent cannabis prices for a particular time period, and the vertical lines represent the upper and the lower bounds of the prices for that particular time period. The line across the y-axis represents the median cannabis price ($7.04) across Canada from 2011-2015. In all twelve windows, there is a noticeable downward trend, meaning there seems to be evidence of bulk purchase discounts. Cannabis prices seemed to be relatively stable for the years under study in all of the provinces, but fluctuated more across the territories.
Note: The line across the y-axis represents the median cannabis price ($7.04) across Canada from 2011-2015.
For nationally aggregated prices, the drop in cannabis prices are more clearly depicted in Figures 3 and 4. Over the 60-month time series, the mean national price for cannabis fluctuated between $7.69 in January 2011 to $7.09 in December 2015. The trend depicts the rate of change, or slope, in price over the course of the price series, with an average $0.0057 drop in the mean price per month. The median national price by comparison fell from $7.39 to $6.06 over the same time span, for an average drop in price of $0.0126 per month. The underlying trends in price become more noticeable by examining the moving median price for each series. To calculate the moving median price for cannabis, each of the respective 59 data points comprising the mean and median price series were ‘smoothed' or replaced with the median value of three consecutive data points—each data point taken in chronological order, along with the data points that precede and follow it.Footnote 43 By using three consecutive time intervals, price points were estimated from rolling quarterly observations.Footnote 44 The resulting, smoothed data provides clearer depictions of the trends of the prices series, particularly that of the mean price series, highlighting the price drops over time.
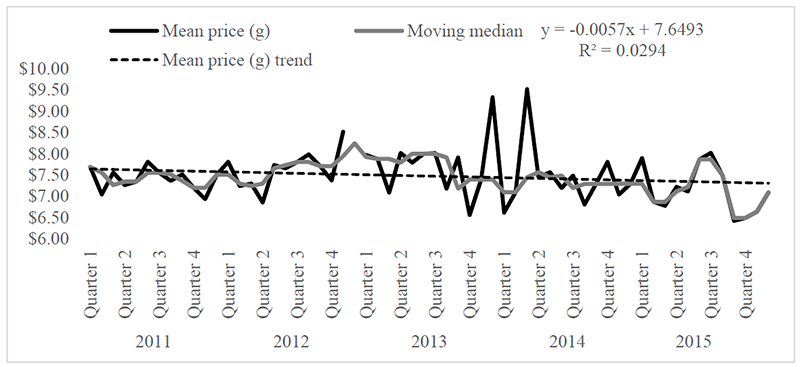
Image description
Figure 3:
This chart portrays the trends for the nationally aggregated mean price series for cannabis. The y-axis represents the price of cannabis, whereas the x-axis represents the time periods for the years under study. The time periods are quarters of a year. There are three lines portrayed in the chart. The thick black line represents mean price per gram. The thinner gray line represents the moving median, and the dotted black line represents the trend for the mean price per gram. Starting from the left-hand side, the lines start at $7.69 per gram of cannabis in the first quarter of 2011 and end at $7.09 per gram of cannabis in the fourth quarter of 2015. The equation representing the trend is y = -0.0057x + 7.6493, with R² = 0.0294.

Image description
Figure 4:
This chart portrays the trends for the nationally aggregated median price series for cannabis. The y-axis represents the price of cannabis, whereas the x-axis represents the time periods for the years under study. The time periods are by yearly quarters. There are three lines portrayed in the chart. The thick black line represents median price per gram. The thinner gray line represents the moving median, and the dotted black line represents the trend for the median price per gram. Starting from the left-hand side, the lines start at $7.39 per gram of cannabis in the first quarter of 2011 and end at $6.06 per gram of cannabis in the fourth quarter of 2015. The equation representing the trend is y = -0.0126x + 7.6763, with R² = 0.1408.
Summary
Overall, the descriptive statistics and trends indicate that cannabis prices vary by region, quality, and quantity, findings that are consistent with cannabis prices specifically and drug markets more generally. Findings show that the typical purchase size for cannabis in Canada is 14.2 grams (one half ounce) and that the majority of price entries (over 90%) reported purchases of medium or high quality, a finding also consistent with crowdsourced price data from the US (Davis et al., 2016). Bivariate analysis indicate that the prices paid in Ontario, Quebec, and British Columbia have a significant and positive relationship with quality, such that higher quality cannabis commands higher prices in these regional markets. When aggregated to the national level, price was statistically and positively related to quality. In addition, prices are typically lower in provinces associated with higher cannabis production, compared to provinces in which the majority of cannabis consumed is not locally produced, but imported. With the exception of some small degree of fluctuation and seasonal variation, prices have remained relatively stable across the five years for which data are available. Nonetheless, findings show that prices are generally lower than those reported by Boucher et al. (2013), which is consistent with a main observation from the drug market literature—cannabis prices are decreasing.
Comparing Self-Reported Cannabis Prices to Prices set by Licensed Medical Cannabis Producers
In this section of the report, cannabis prices obtained from two sources: 1) Price of Weed (via data collected by Luca Giommoni and David Décary-Hétu); and 2) licensed medical producers are compared. The data sampled from the Price of Weed only includes price entries submitted to the website between January 1 and June 6, 2016 (n=1,024 price entries). Price data for licensed cannabis producers was obtained from the producers' websites and Lift.co (a public depository of medical cannabis prices). Lift.co was used as a resource to supplement prices from producers' websites. Although producers' websites provided information on available cannabis products and prices, Lift.co listed additional products that were not currently advertised on websites. It is assumed that these products indexed on Lift.co, and not available on producers' websites, were offered in the past. Given that the date of initial licensing for all licensed medical producers was from 2013 onwards, all price data from Lift.co for products not currently listed on producers' websites was included in the final data. This created a final dataset of 379 prices across 21 producers, with 66% of all price data obtained from Lift.co. For detailed information on data collection procedures, see Appendix C.
Anderson et al. (2013) represents one of the few studies to compare cannabis prices across self-reported data, obtained from High Times, official prices listed by 84 online medical dispensaries, as listed on WeedMaps.com.Footnote 45 The authors found that prices listed by dispensaries in California, Michigan, Nevada, and Washington were not statistically different from self-reported prices, although dispensary prices across Arizona, Colorado, and Oregon were significantly lower, with the most substantial differences in Colorado, as dispensaries charged, on average, 24 percent less per ounce, followed by Oregon at 14.9 percent less per ounce and Arizona at 10.3 percent less per ounce. However, it should be noted that users who purchase cannabis from a medical dispensary may send price information to High Times, and thus it is not possible to fully discriminate between the two sources.
Table 4 compares self-reported cannabis prices as listed on the Price of Weed with medical cannabis prices as reported by licensed medical producers. Unfortunately, it is impossible to determine the legality of all cannabis prices. It is possible that individuals who have valid prescriptions endorsed by the medical establishment and purchase cannabis from licensed producers report these prices to the website. Conversely, cannabis purchased from licensed medical producers may also be diverted to the illegal market. We assume that prices reported to the Price of Weed primarily represent illegal purchases, but cannot assume complete independence between the two markets.
The average national price per gram for cannabis transactions reported to the Price of Weed is $6.60 (SD: $3.38) compared to $8.37 per gram price (SD: $2.34) as listed by licensed medical cannabis producers, for a difference in means of $1.77. Prices reported to Price of Weed and prices listed on licensed medical cannabis producers' websites are negatively, albeit weakly, correlated with one another (p = 0.001), indicating that there is an inverse relationship between prices reported to the Price of Weed and listed on licensed medical cannabis producers' websites.
| Province/ Territory |
Price Price of Weed |
Price Licensed Producers |
Sig. | ||
|---|---|---|---|---|---|
| Mean (SD) |
Median | Mean (SD) |
Median | ||
| CA | 6.60 (3.38) |
5.95 | 8.37 (2.34) |
8.00 | .001 |
| Sources: Price of Weed and Lift | |||||
Examining Self-Reported Cannabis Quality as reported to the Price of Weed and Cannabis Potency as Reported by Licensed Medical Cannabis Producers
Tables 5 and 6 list descriptive statistics regarding the quality and potency of cannabis purchased and advertised on the Price of Weed and licensed medical producers, respectively. Unfortunately, it is difficult to undertake any meaningful comparison of quality and potency across the two sources given that they are measured on two different scales.Footnote 46 Thus, rather than compare the two, this sub-section outlines the degree to which the quality and potency of cannabis varies across provinces.
Referring to the mean quality values for cannabis transactions reported to the Price of Weed, users are particularly inclined to report their purchases as being of medium quality. Taking the median value of self-reported quality (1=low quality; 2=medium quality; and 3=high quality), indicates a value of 2. In regard to cannabis potency as reported by licensed medical producers, the average THC content is 15.24 percent. The THC concentration in cannabis products from licensed medical cannabis producers is higher than what is reported by Burgdorf et al. (2011). However, it is important to note that the data used in the current study is biased. The current study relies on data obtained from licensed medical cannabis producers, whereas Burgdorf et al. (2011) rely on cannabis seizures in California, which also likely consists of low grade cannabis imported from Mexico. Nonetheless, the corresponding value of the standard deviation for the mean (SD: 6.22) suggests that there is a great deal of heterogeneity within THC content across cannabis strains.
| Province/ Territory |
Quality1 | |
|---|---|---|
| Mean (SD) |
Median | |
| CA | 2.35 (0.54) |
2 |
| Note 1: The ratings represent the mean/median values of self-reported quality (1=low quality; 2=medium quality; and 3=high quality). Source: Price of Weed |
||
| Province/ Territory |
Potency1 | |
|---|---|---|
| Mean (SD) |
Median | |
| CA | 15.24 (6.22) |
16.00 |
| Note 1: The ratings represent the mean/median values of THC concentration (%). Source: Lift.co. |
||
Figure 5 shows medical cannabis prices as functions of THC and cannabidiol (CBD) concentration, as reported by licensed medical producers. The plotted data graphing the relationship between price and THC shows that there is a large degree of dispersion in price points, or random variation, with regards to the fitted values. Regardless, there appears to be some relationship between price of medical cannabis and THC content. By comparison, there is no such relationship between price and CBD concentration, as indicated by the plotted price points which cluster around 0 on the x-axis. Put simply, with the exception of a few outliers, there is little variation in CBD concentration in medically-grown cannabis, and, thus, there is no association between the price of medical cannabis and CBD levels.

Image description
Figure 5:
This chart displays the licensed medical producers' cannabis prices by THC and CBD content. It has two windows. The window on the left-hand side represents the prices in relation to the THC content, and the window on the right-hand side represents the prices in relation to the CBD content. The y-axis on both of the windows represents price per gram, whereas the x-axis represents the percentage of THC or CBD content. The dots in both windows represent prices per gram, whereas the line represents the fitted values. On the left-hand side, where the prices for the THC content are portrayed, the line for fitted values is slanted upwards, meaning that the prices tend to increase slightly for higher THC content. No such trend is noticeable in the graph on the right-hand side, meaning that the price for medical cannabis does not seem to depend on the CBD content.
Note: For licensed producers that listed a range when reporting the THC or CBD content, the median value was taken to calculate estimates.
The graphed data in Figure 6 shows an interesting observation: not only is there much more heterogeneity in THC concentration across medical cannabis strains than there is CBD concentration, but, generally, THC levels far exceed those of CBD. Taking the median THC and CBD levels (0.15) across provinces, shows a THC:CBD ratio of 106.67.Footnote 47 This ratio is more conservative compared to the median THC:CBD ratio of 187.99 found by Burgdorf et al. (2011),Footnote 48 but much larger than what was recently reported by Martin (2016), who found that cannabis distributed from medical dispensaries has an average THC:CBD ratio of 1.77. These discrepancies are likely to be at least partially due to differences in calculation stemming from using median values compared to Martin's (2016) calculation using average values.Footnote 49 Nonetheless, the findings are consistent with what is generally reported elsewhere in that levels of THC greatly exceed levels of CBD. Furthermore, though it has been acknowledged elsewhere that much more research is needed to uncover the outcomes of high THC:CBD ratios in cannabis, there are some possible implications of high THC:CBD ratios for adverse health outcomes (see Potter et al., 2008).
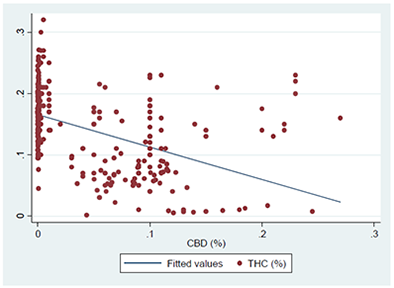
Image description
Figure 6:
This chart illustrates the CBD and THC content of medical cannabis from licensed producers. The y-axis represents the percentage content for THC, whereas the x-axis represents the percentage content for CBD. The dots in both windows represent the percentage of THC content, whereas the line represents the fitted values. The line for fitted values is slanted downwards, meaning that the levels of THC in medical cannabis tend to exceed those of CBD.
When interpreting the results, it should be emphasized that 1) comparisons of average transaction size across licensed medical producers and Price of Weed data cannot be conducted, as licensed producers do not disclose information on the size of user transactions and 2) comparisons of quality across sources of cannabis are precluded, as the Price of Weed reports the perceived quality of cannabis, and licensed producers the true quality (as measured by THC content).
Price Elasticity of Cannabis Demand
This section examines the full price elasticity of cannabis demand in Canada. The aim is to understand how price changes influence the total amount of cannabis consumed. The estimates rely on self-reported transaction data, examining variation in the amount of cannabis consumed and prices paid across users.Footnote 50
Data and Method
Estimates of the full price elasticity of cannabis demand are conducted using self-reported transaction data from Price of Weed. The sample includes transactions reported to have taken place in Canada from 2011 to 2015 (n = 8,815). Territories were excluded from the analyses due to the low number of observations (n = 116).
Price elasticity of cannabis demand in Canada is modelled using weighted OLS regression with cluster robust standard errors. OLS regression is a method for estimating the parameters in a linear regression equation by the ordinary least squares method. It aims to model a continuous outcome variable in terms of its relationship to a set of independent (explanatory) variables, and does this by minimizing the sum of the squares of the differences between the observed values in the dataset and the values predicted by the linear function of a set of independent variables. Observations are weighted by the number of transactions in each province for the year in which the transaction took place, taking the inverse of the probability that each province is represented in the sample. Weighted OLS regression with cluster robust standard errors is consistent with Davis et al. (2016), who examined price elasticity in the US using Price of Weed data and allows us to account for two limitations in these data. First, there is non-random variation in the number of transactions reported across each province, which means that some provinces may exert a greater effect on the estimates. Second, transactions cannot be assumed to be independent, with a single user potentially submitting more than one transaction to the website. Robust errors are specified to account for possible dependency between observations.
Quantity
The quantity of cannabis purchased for each transaction was used as the outcome variable in the analysis. The average transaction size for the sample was 17.04 grams (SD: 11.03) (Table 7). Once again, this is consistent with US self-reported transaction sizes by Kilmer et al. (2014), finding transactions to be roughly one half ounce over a decade period, from 2000 to 2010, but slightly higher than the average transaction size reported to Price of Weed in the US (13.92 grams) (Davis et al., 2016).
The main relationship of interest is the degree to which cannabis prices influences the quantity purchased for each transaction. Price captures the quantity adjusted price per gram paid by the consumer. The average price of cannabis was $7.32 per gram (SD: $3.76), and was highest for high quality at $7.69 per gram (SD: $3.63), followed by low quality cannabis (average: $7.26; SD: 5.57), and medium quality cannabis (average: 7.14; SD: 3.81). Given that price is not the only factor that plays a role in the quantity of cannabis consumed by users, product and transaction characteristics, as well as demographics are included as controls in the models. Product characteristics include the self-reported quality of the drug, transaction characteristics, the season of purchase, and demographics including education and cannabis offences rates.
The majority of transactions reported to the Price of Weed were classified as medium quality (55%), followed by high quality (41%), with only a fraction of users classifying their purchase as low quality (4%). Given that quality captures users' perception of cannabis potency, the measure may capture other components than just the perceived THC content. While studies have yet to assess the relationship between users' subjective perceptions and the true potency of cannabis (e.g. THC content), they have shown that users' perceived potency plays a role in the price paid (e.g. Ben Lakhdar, 2009; Ben Lakhdar et al., 2016; Cole et al., 2008; Goudie et al., 2007; Sifaneck et al., 2007). However, there are mixed results on whether a drug's potency (whether real or perceived) has an impact on demand (Ben Lakhdar et al., 2016; Davis et al., 2016). Davis et al. (2016) found that users who perceive cannabis to be of high quality are more likely to purchase greater amounts, whereas Ben Lakhdar et al. (2016) found no such relationship.
| Variable | Mean | SD | Min | Max |
|---|---|---|---|---|
| Quantity (grams) | 17.04 | 11.03 | 1 | 28.40 |
| Price per gram | 7.32 | 3.76 | 0.04 | 35.21 |
| Quality | ||||
| High | 0.41 | 0.49 | 0 | 1 |
| Medium | 0.55 | 0.19 | 0 | 1 |
| Low | 0.04 | 0.50 | 0 | 1 |
| Bachelor's Degree | 0.22 | 0.03 | 0.13 | 0.27 |
| Cannabis Offence | 203.58 | 83.71 | 80 | 424 |
| Season | ||||
| Winter | 0.18 | 0.39 | 0 | 1 |
| Spring | 0.34 | 0.47 | 0 | 1 |
| Summer | 0.25 | 0.43 | 0 | 1 |
| Fall | 0.23 | 0.42 | 0 | 1 |
| N=8,815 | ||||
To capture transaction characteristics, the season the user purchased cannabis was included as a covariate. This measure was a categorical variable that captured Winter, Spring, Summer, and Fall. Most transactions occurred in the Spring (34%), followed by Summer (25%), Fall (23%), and Winter (18%).
Consistent with previous studies, education was included as proxy to control for users' income (e.g. Ben Lakhdar et al., 2016; Davis et al., 2016; DeSimone & Farrelly, 2003). Education measures the percent of the population that has acquired a bachelor's degree or higher in the month and province that the transaction took place. Data on education-level was obtained from the Labour Force Survey, a nationally representative survey of the civilian non-institutionalized population aged 15 years of age and older. The survey asks respondents about their highest level of educational attainment at the time of survey. Previous studies have suggested that individuals with more disposable income may be less sensitive to changes in prices (Pacula & Lundberg, 2014) and that cannabis prices are influenced more by individual characteristics than product characteristics (Ben Lakhdar et al., 2016).
Cannabis offences measure the rate of police-reported cannabis offences per 100,000 in the province where the transaction took place. Cannabis offences include possession, trafficking, and production of cannabis, as detected and reported by police. Data was obtained from the Police-Reported Crime Statistics in Canada publications for the years 2011 (Brennan, 2012), 2012 (Perreault, 2013), 2013 (Boyce, Cotter, & Perreault, 2014), 2014 (Boyce, 2015), and 2015 (Allen, 2016). The reports publish provincial cannabis offence rates for each year relying on data from the Uniform Crime Reporting (UCR) survey. The UCR reports each criminal incident recorded in the information systems of participating Canadian police surveys.Footnote 51 For each criminal incident, the UCR only counts the most serious violation and, thus, likely represents an underestimate of all cannabis offences. Previous studies have shown that variation in prosecution for cannabis use, as measured through decriminalization (Cameron & Williams, 2001) and the probability of arrest for possession (DeSimone & Farrelly, 2003), is associated with cannabis demand/use—with some exceptions (Davis et al., 2016).
In addition, to control for endogenous factors that may influence cannabis prices, electricity rates were included as a supply-side instrument. Electricity rates account for a large proportion of the total costs of domestically produced cannabis. Climate, security concerns, as well as greater control over the quality of the product, leads many producers to cultivate cannabis indoors. However, indoor growing, which generally requires high intensity lighting equipment for prolonged periods, creates substantial costs to producers. For instance, previous studies showed that the average cannabis grow-op consisted of approximately 36 lights, with each light using 1,000 watts per hour, and are on for an average 14 hours a day over the growing cycle (Diplock & Plecas, 2011). Electricity costs have been found to range from 42 percent for growers with 600 plants (large scale growers) to 76 percent of the total costs for growers with 23,000 plants (industrial growers) (Vanhove, Surmont, Van Damme, & De Ruyver, 2014). When broken down by pound, Caulkins (2010) found that electricity for lighting accounts for approximately US$75 of the $200 to $400 cost of indoor production for each pound of cannabis.
The electricity rate measures the average one-month residential bill in each province for 1,000 kilowatts of electricity. Data on electricity rates was obtained from Manitoba Hydro, who publishes annual estimates of electricity rates across various cities in Canada.Footnote 52 Information on electricity rates is obtained from consulting electricity suppliers within local municipalities. Because rates are only published for select cities across provinces (e.g. in Alberta electricity rates are only available for Calgary and Edmonton), city-level estimates are used to generate province-level averages. OLS estimates including electricity rates exclude cannabis transactions reported from Prince Edward Island, as electricity rates are not provided for any cities within this province (n = 96 observations).
A total of five models are estimated to examine how different sets of covariates influence price elasticity of cannabis demand. Model 1 is our baseline, regressing cannabis prices on the size of the transaction. Model 2 introduces product characteristics into the equation, examining how the quality of the purchase influences the quantity demanded. Model 3 looks at transaction characteristics, including the season the cannabis was purchased as a covariate. Model 4 adds in demographic characteristics, including education rate, as well as the rate of cannabis offences in the province in which the transaction occurred. Lastly, Model 5 includes electricity rates as a supply side instrument to control for an exogenous factor that may influence cannabis prices, but not demand. All models are weighted using inverse probability weighting. This method weights the observations by the number of transactions made within each province, capturing the inverse of the probability that each province is included in the current sample.
Results
Table 8 provides the OLS and IV regression estimates across all five models. Model 1 shows that the demand for cannabis is inelastic with a price elasticity estimate of -0.42. Price elasticity estimates stay similar in Model 2, even after controlling for product characteristics, such as the quality of the cannabis purchased. In addition, Model 2 shows that cannabis quality is associated with greater demand, a finding that stays stable across the models. This is consistent with Davis et al. (2016) and Ben Lakhdar et al. (2016), who both found higher self-assessed quality to be associated with heightened demand. But in contrast to Davis et al. (2016), the findings show that not only is self-perceived high quality cannabis associated with higher demand, but that demand is also strong for self-perceived medium quality cannabis. However, the subjective nature of the quality variables should be noted, given that self-reports reflect users' experiences, it may mean that individuals residing in areas where high quality cannabis is more common (e.g. British Columbia) may rate cannabis considered high quality elsewhere as being of medium or low quality. This same logic also applies over time, with cannabis once considered to be high quality potentially considered to be of low(er) quality as the market evolves.
Model 3 introduces transaction characteristics and the season the purchase was made. Findings show price elasticity estimates to be stable at -0.44. In addition, there is greater demand for cannabis in the Spring and Summer, as compared to purchases made in the Winter, and there is less demand for cannabis in the Fall, as compared to purchases made in the Winter. In Model 4, education and cannabis offence rates are included in the model, as well as province-level fixed effects. Findings show that price elasticity estimates stay stable at -0.44. Transactions made in provinces with a higher education rate were more likely to be smaller, whereas cannabis offence rates had no impact on cannabis demand. Lastly, Model 5 introduces electricity rates as a supply-side instrument into the model. Findings show estimate of price elasticity of -0.60, which is only slightly higher than estimates obtained through standard OLS regression in absolute value, which were more consistent across models, ranging -0.42 to -0.45.
In summary, results show the demand for cannabis to be inelastic to price changes, with price elasticity estimates staying relatively stable across models, ranging from -0.42 to -0.60. These estimates are consistent with previous studies (e.g. Clements, 2008; Kilmer et al., 2010), and only slightly lower than those found by Davis et al. (2016), who also examined price elasticity using crowdsourced data reported to Price of Weed in the US. Findings also show that higher quality cannabis is associated with greater demand, purchases made in the Spring and Summer are likely to be larger than purchases made in Fall and Winter, and purchases made in provinces with higher education rates were more likely to be smaller in size. The lack of a relationship between offence rates and cannabis demand may be related to the absence of a suitable means to measure risk. Cannabis offences capture the offence rate, but not the probability of apprehension among users, which would be the more ideal measure. DeSimone and Farrelly (2003) calculated the probability of detection by calculating the number of arrests for cannabis possession in a given year and dividing it by the number of users for the same period, although the lack of user data for the same period precludes us from including this in the models.
| Parameters | OLS (1) b (SE) |
OLS (2) b (SE) |
OLS (3) b (SE) |
OLS (4) b (SE) |
OLS (5) b (SE) |
|---|---|---|---|---|---|
| Price per gram (logged) | -0.42*** (0.02) |
-0.45*** (0.02) |
-0.44*** (0.02) |
-0.44*** (0.02) |
-0.60** (0.22) |
| High Quality | - | 0.44*** (0.02) |
0.43*** (0.02) |
0.44*** (0.02) |
0.48*** (0.06) |
| Medium Quality | - | 0.11*** (0.01) |
0.11*** (0.02) |
0.11*** (0.02) |
0.12*** (0.01) |
| Spring | - | - | 0.14*** (0.02) |
0.10*** (0.02) |
0.14*** (0.02) |
| Summer | - | - | 0.04** (0.01) |
0.14** (0.04) |
0.05*** (0.02) |
| Fall | - | - | -0.08* (0.03) |
0.07** (0.04) |
-0.08* (0.03) |
| Education | - | - | - | -17.42* (6.43) |
- |
| Cannabis Offences | - | - | - | 0.00 (0.00) |
- |
| Year | -0.05*** (0.00) |
-0.04*** (0.00) |
-0.05*** (0.01) |
0.06 (0.04) |
-0.05*** (0.01) |
| Province dummies | No | No | No | Yes | No |
| Constant | 96.60*** (6.47) |
76.68*** (7.26) |
101.09*** (12.49) |
-114.22 (69.18) |
- - |
| R2 | 0.11 | 0.13 | 0.14 | 0.15 | - |
| F Statistic | - | - | - | - | 27.24 |
| N= | 8,815 | 8,815 | 8,815 | 8,815 | 8,738 |
Findings should be interpreted within the confines of the data. In addition to the aforementioned limits (e.g. data is not representative and cannot be assumed to be independent), Price of Weed data presents unique challenges for calculating price elasticity estimates. First, Price of Weed data does not distinguish between user-types, such as initiates, regular, and chronic users. This distinction is important as heavy users represent a subset of all users, but consume the largest quantities of cannabis (Caulkins & Pacula, 2006; Kilmer & Pacula, 2009). Thus, even if the total number of users drops following an increase in price, it may not influence overall consumption if the number of heavy users remains stable or even increases. Further, previous studies have suggested that elasticity estimates vary by type of user (Pacula & Lundberg, 2014). Relatedly, because the data is likely to over represent individuals from higher income brackets that also have regular access to the Internet, the sample may be biased towards more casual users, as compared to regular and chronic cannabis consumers, found in arrestee and homeless populations. Finally, Price of Weed provides a cross-section of cannabis transactions across different periods. Ideally, a longitudinal dataset would allow for the examination of purchasing behaviour across a sample of users over time. This would enable examinations of individual variation before and following price changes, using the cannabis user as their own reference group. Despite these limitations, Price of Weed data provides a large sample of cannabis transactions, not previously available, and also allows for price elasticity estimates that account for the size of the transaction.
Discussion
This report provided a series of estimates on cannabis prices and the responsiveness of Canadian cannabis users to changes in prices. Whether in terms of cannabis prices or price responsiveness, evidence regarding the cannabis market is consistent. Cannabis prices have been relatively stable over the past five years showing only a slight decline, the average size of cannabis transactions is approximately one half ounce, similar to purchase sizes in the US, and price responsiveness falls in the range of previous estimates in other countries, including the US and Australia. To conclude, a general assessment of the study's results, ways forward for measuring prices of illegal cannabis, and research and policy recommendations are provided. Across all sub-sections, the discussion and findings are situated in the context of the potential implications of a transition from prohibition to legalization.
Summary of Results
Over the past five years retail prices of cannabis have declined slightly
This general statement is based on a series of analyses of consolidated data sets of almost 9,000 cannabis transactions across Canada between 2011 and 2015. Findings demonstrate that retail cannabis prices have stayed relatively stable from 2011 to 2015, with an average drop of the median national price of $0.0126 per month. Across this period, the average national price of high quality cannabis over this period was $7.69 per gram (SD: $3.63), followed by low quality (average: $7.26; SD: 5.59) and medium quality cannabis (average: $7.14; SD: $3.81). Most self-reported purchases are perceived to be medium or high quality, similar to self-report data in the US cannabis market (Davis et al., 2016). However, it should be emphasized that these are users perceptions of quality, and not necessarily representative of all cannabis transactions made across Canada. Findings also showed that the typical size of a cannabis purchase in Canada is 14.2 grams (one half ounce), consistent with transaction sizes in the US (Kilmer et al., 2014), and evidence of bulk discounts, with larger transaction sizes fetching lower prices per gram.
Medical cannabis prices as reported by licensed medical producers tend to be higher than cannabis prices reported to Price of Weed
Comparisons of cannabis prices as reported by licensed medical cannabis prices and to Price of Weed, showed that medical prices were, on average, nearly $2.00 per gram higher than illegal prices. However, caution should be used when interpreting this price discrepancy. The comparisons are based on self-reported cannabis prices and do not control for the size of the transaction or the potency of the product. Further, cannabis prices reported to Price of Weed may capture illegal as well as legal transactions related to medical cannabis. In terms of potency for cannabis products offered by licensed medical producers, high heterogeneity in THC content was found across Canada. In addition, within the medical cannabis market, no association was found between CBD levels and prices. In fact, THC levels surpassed CBD levels across medical cannabis strains, a finding that is consistent across past research in this area.
Under prohibition, demand for cannabis appears to be inelastic, with price elasticity estimates ranging from -0.42 to -0.60.
The range of price elasticity estimates is consistent with studies in Australia and the US. Also, the results highlight that demand varied according to the quality of cannabis, suggesting that changes to the supply and demand of cannabis may not be uniform across different potencies, a result also found by Davis et al. (2016). However, the elasticity estimates are based on demand for a product that was illegal in Canada, and the price estimate only takes into account a proxy of law enforcement risk. It is unknown whether price elasticity estimates would remain the same under a shift to legalization.
It should be noted that there are limitations to the current methodology, and more work is needed to approach the level of confidence needed to make, for example, concrete recommendations regarding setting prices or resource allocation. The main limitations extend from reliance on a single data source: transactions reported to Price of Weed. The Price of Weed represents a valuable resource to obtain national estimates of cannabis prices over time, where currently national data infrastructure does not exist, although estimates relying on this as their sole source should be interpreted within its limits. First, Price of Weed does not represent a random or representative sample of users. Cannabis users self-nominate to report prices to the website, and thus must be aware, as well as have access to the website. Respondents visiting Price of Weed likely represent a subset of the population who have more regular access to the Internet, thereby capturing those who have higher incomes and may be more likely to purchase more potent cannabis in larger quantities. Second, the website provides a cross-section of cannabis transactions across different periods. Although there may be repeated observations with a single individual reporting multiple transactions over time, there is no method to identify these repeat users. Third, the website does not collect information on individual demographics. While this may increase the response rate, as individuals may be hesitant to report identifying characteristics, it precludes researchers from understanding the characteristics of users. Relatedly, Price of Weed does not distinguish between types of users. Thus, it was impossible to distinguish whether the individual reporting to the website was a first-time, regular, or chronic user. Fourth, users' perceptions of quality may change over time. What was once perceived as high quality, may vary after using different products, changes in the market, etc. This may bias estimates of quality across users. Fifth, price data reported to Price of Weed may not exclusively contain illegal transactions. It is possible that users who purchase from licensed cannabis producers, also report prices to the website. Finally, transaction data reported to the website represents the total size of the transaction, and not the total amount consumed by the user. Users may redistribute their product to others, and not necessarily use the full amounts for themselves, thus biasing our elasticity estimates.
Despite these limitations, cannabis transaction data reported to the Price of Weed website represents a valuable resource for understanding price patterns. Price of Weed data has been used either as a sole data source or to augment traditional data sources to estimate cannabis prices (Boucher, Lawrence, & Maslov, 2013; Davis, Geisler, & Nichols, 2016; Malivert & Hall, 2013; Parliamentary Budget Officer, 2016; Werb et al., 2012; Zook, Graham, & Stephens, 2011) and has been found to share some degree of correlation with official and other self-reported datasets (Caulkins & Bond, 2012). Further, it provides insight into an illegal market on a scale that is currently not possible with other datasets. However, remaining cognizant of its limitations, various ways to generate reliable and robust measures of prices and elasticity estimates, as well as policy and research recommendations are outlined below.
Measuring Drug Prices
Knowing the price of cannabis is essential for assessing the consequences of current cannabis laws and making projections about policy changes. The retail price is critical for measuring total cannabis expenditures, which can then be used to help estimate the amount of money diverted to organized crime and other illegal market participants. Data about the retail price in the illegal market can also be informative for governments or licensed producers when they decide about the prices for legal medical cannabis products.
For jurisdictions like Canada that are considering cannabis legalization, knowing the price before the policy change is essential for making reasonable predictions and encouraging informed debates. Many of the major outcomes discussed in cannabis legalization debates—the size of the illegal market, tax revenues, and consumption (which will have implications for public health)—will be shaped by what happens to the retail price after the policy change. This report suggests that there has been a slight decline in retail prices from 2011 to 2015, although the change in price after legalization could be much more significant (Kilmer et al., 2010). Production and distribution costs are expected to plummet as suppliers no longer have to be compensated for risk and they can take advantage of economies of scale, as well as changes in technology. Governments seeking to minimize or delay the price decline have many options ranging from limiting production to imposing regulations to excise taxes to mandating minimum prices (Caulkins et al., 2015; Rolles & Murkin, 2016). Within this mix of lowering operational costs and a likely emergence of governmental taxing of a legal cannabis market, prices should be expected to remain stable to what Canadians have become accustomed to under prohibition. However, as with other highly-taxed markets (e.g. cigarettes), over-taxing would likely generate a parallel demand for contraband cannabis, a scenario that would seem to be in contradiction with a legalization process.
Most analyses of cannabis prices do not account for the heterogeneity in cannabinoids as these data are rarely available. This report makes a useful contribution by reporting prices as a function of self-reported quality (e.g. low, medium, and high), but it would be more informative if the price per unit of THC, the cannabinoid primarily responsible for intoxication, could be reported. For example, we may not be comparing apples with apples if the cannabis bud that was considered “medium quality” in 2011 would be considered “low quality” in 2015. More importantly, users are not just consuming bud or homemade baked goods anymore; the types of cannabis products being consumed are proliferating. THC and other cannabinoids are now being extracted from the plant to produce oils, waxes, lotions, cartridges for e-cigarette devices, and so on (only about half of the THC in the cannabis plant is in the flowers). To help with comparisons and projections, it would be useful to know the price per unit of THC for all of these products. It would also be useful to know how consumers react to changes in the price of THC and how it may differ across products.
In addition, there are other cannabinoids and chemicals in the cannabis plant that could affect demand, price, user health, and other outcomes. For example, CBD receives an increasing amount of attention for its potential therapeutic benefit and evidence suggesting that it may offset some of the negative effects of THC (e.g. see Devinsky et al., 2016; Karinol et al., 1974). This raises questions about whether jurisdictions allowing cannabis products should focus on THC:CBD ratios (in terms of regulations and/or excise taxes), but the research is not strong enough to make evidence-based recommendations about the optimal ratio. As there is so much to learn about cannabinoids and other chemicals (especially with respect to how their interactions affect users), jurisdictions considering or implementing changes to cannabis policy will want to build flexibility into their regulatory and taxation regimes, so new information can easily be incorporated (Kilmer, 2014).
Regardless of whether Canada decides to legalize cannabis, efforts should be made to improve existing survey instruments to collect better information about the types of products being consumed, how much is being consumed, how these products are obtained, and how much they cost (Kilmer & Pacula, 2016; Maslov, Lawrence, & Ferguson, 2016). In terms of collecting information about perceived quality, no one knows the best way to ask about this (e.g. scale of 1 to 10; High, Medium, or Low; ask specifically about sinsemilla and skunk). This is an area ripe for future research. Data collection efforts should not be solely focused on cannabis. On the contrary, any serious evaluation of the impact of cannabis legalization will require that data on other substances be collected more systematically, from alcohol to opioids. These efforts should start now, in pre-legalization stages. The current data collection efforts are simply not sufficient for scholars and policy makers to assess the impact of legalization on the behavior of consumers of cannabis and other substances.
If Canada legalizes cannabis supply, policymakers should seriously consider requiring market participants—from growers to testers to distributors to retail outlets—to enter data into a ‘seed-to-sale' system that will allow analysts to track transaction-level information about products, cannabinoids, testing results, and prices throughout the supply chain. One reason for this is to help reduce the possibility of diversion, but it also provides a tremendous amount of data for research purposes. Both Colorado and Washington have created such systems and preliminary analyses are yielding important insights about consumption and the economics of cannabis markets (Kilmer, personal communication). That said, these systems were not necessarily built for research purposes. If a decision is made to create a seed-to-sale system in Canada, ideally policy analysts and other researchers will be consulted before the system is built or contracted to an outside entity.
Type of Data Required to Model Price Elasticity
The limitations of cannabis price data used in the current report provide a useful starting point for recommendations on the type of data required to model price elasticity. The following four limitations highlight ways forward. First, the transaction data: 1) were not representative; 2) were not independent; 3) did not contain information on frequency of use; and 4) did not contain information on user demographics. Ideally, price elasticity estimates would rely on a representative sample of non-users and users (across user-types, e.g. casual, regular, and heavy users) that collected information on prices paid, and quantity purchased (and consumed) over time. Ideally, estimates would also be modelled across a period where there was an exogenous price shock, allowing researchers to address the endogeneity of price and demand. However, considering the time and financial resources to create this infrastructure, a more feasible strategy may be to capitalize on existing research surveys that currently capture these populations. For instance, CTADS currently surveys a nationally representative sample of the household population on their cannabis use (e.g. cannabis use in the past 30-days, 3-months). But the survey is limited in that it does not contain information on the quantity consumed by users, as well as prices paid for their cannabis (also see Appendix D). This same survey could be augmented by asking users about the quantity used, and characteristics of the transaction, such as price. Importantly, this could permit an additional section of questions on the characteristics of the transaction, such as source (e.g. from a licensed producer, or illicit storefront). This is similar to studies in the US such as ADAM II (Hunt & Rhodes, 2009) and the New Zealand National Drug Survey (Wilkins et al., 2005), and echoes previous calls to integrate cannabis use and price data into national surveys elsewhere (e.g. Maslov et al., 2016). In addition, this would also have the added benefit of allowing for information on demographic characteristics, which means that price elasticity estimates could control for other factors associated with cannabis use, creating more robust estimates.
Further, given that these nationally representative surveys capture the household population, they could be complemented by more targeted surveys that capture heavy users. Previous studies have shown that homeless and incarcerated populations tend to have heavier cannabis use, a population that is not captured in national surveys, and that heavy users may be more impacted by price changes (e.g. Pacula & Lundberg, 2014). Currently, research instruments are being developed to assess samples of regular and heavy users, such as efforts by the Marijuana Working Group. These data collection efforts are useful in that they capture the frequency and quantity of cannabis used across a variety of cannabis products (from oil, hash, to dried herb). However, while it also captures real prices paid, it also collects information on users' perception of prices. The problem with users' perceptions of cannabis prices is that it captures their assessment of the market, rather than true market conditions. Price data based on actual transactions across a representative sample may be more useful if the objective is to gain an understanding of cannabis prices. Given the challenges of obtaining price data, and respondents to complete these questionnaires, survey questions may be better directed at user characteristics or other factors related to cannabis use.
Lastly, given the finding that electricity rates appear to be a plausible instrument in the IV models, it would be useful to acquire information on electricity rates at the monthly or quarterly level (rather than the annual level, as presented in this report), as well as for sub-province geographic units. This would allow for more reliable estimates of price elasticity.
Research and Policy Recommendations
The current report aimed to provide a baseline of prices in the Canadian cannabis market prior to any legislative shift. As such, it provides an assessment of the cannabis market under prohibition. While this precludes us from making recommendations on how the market would operate under legalization, it does provide a baseline that allows us to outline factors that may be taken into consideration when setting prices in a legal cannabis market. In this section, specific factors that should be accounted for when transitioning into a licit market are outlined, echoing many of the recommendations made by the Task Force on Cannabis Legalization and Regulation (McLellan et al., 2016), while supporting them with the current report's findings. Specifically, this sub-section focuses on the need to develop strategies that: 1) minimize diversion; 2) discourage consumption; and 3) invest resources into increased understanding of drug markets.
Prices should be set so as to minimize diversion to the illegal market
Cannabis price estimates showed that cannabis prices are relatively low across Canada, ranging from an average of $7.26 to $7.69 per gram from 2011 to 2015. These prices are similar to the average recreational cannabis prices in the Denver metro, with the Marijuana Policy Group reporting a single gram purchase of a specific strain of marijuana to be $7.00 in Denver (Marijuana Policy Group, 2014), and PotGuide.com reporting cannabis to be US$7.88 per gram for the Winter 2015 (PotGuide.com, 2016)Footnote 53; however, this does not take into account the quality of the product, and does not include any taxes. After legalization, the legal market will have to compete with prices set in illegal markets so as not to avoid diversion. This may also require accounting for variation in prices across provinces. Currently, users in Quebec pay lower prices than users in Atlantic Provinces. Thus, standardized cannabis prices may have different impacts across regions of Canada. Prices set too high may sustain or generate illegal markets, and what is ‘too high' may vary across Canada. This is particularly important given parallels to the tobacco market, where the contraband and counterfeit markets are sustained largely due to price differentials with licit tobacco products. Given the lack of data on how transitions to legalization impacts both cannabis use and the black market, the Task Force on Cannabis Legalization's emphasis on creating a flexible taxing scheme that could be adapted is also supported here.
Second, retail prices in mountain communities were 50–100 percent higher than prices for similar marijuana strains in the Front Range. The price difference is most pronounced for small servings. For example, a single gram serving near Keystone resort costs $14.00, whereas the same gram for an identical strain costs $7.00 in Denver.
Prices should vary according to quality
The Task Force on Cannabis Legalization's Report recommends developing “strategies to encourage consumption of less potent cannabis, including a price and tax scheme to discourage the purchase of high potency products” (McLellan et al., 2016, p. 3). Given that the health consequences of high-potency products are still largely unknown, one method to discourage consumption is to impose a THC limit until more is learned about its effects. An alternative method to discourage the use of high potency cannabis is to impose potency-based taxes, or minimum taxes. The findings in the current report support this perspective. Cannabis of higher quality is more expensive in the illegal cannabis market, and this should remain the case.
Resources should be allocated to increase research infrastructure for understanding the markets for cannabis and other substances
This report supports the Task Force on Cannabis Legalization's recommendation that resources be allocated for prevention and treatment programs. Here, we emphasize that one way to develop effective programs is to increase our understanding of drug markets. One method to do this is by creating random and representative studies of drug use and prices for cannabis, as well as other drug markets (also see recommendations in sub-section 5.2). These data sources can form the cornerstone of policy changes, including: 1) measurements of the price elasticity of cannabis demand within a legal market; and 2) examinations of how cannabis legalization impacts other drug markets.
Conclusion
The current report used self-report data on cannabis transactions to estimate cannabis prices and the relationship between prices and cannabis use. MacCoun and Reuter's (2001) summary statement on the price elasticity of illegal drugs orients us in the right direction: “Even though the availability and price of drugs are only modestly affected by variations in the current levels of enforcement or interdiction, they would likely be more dramatically affected by the complete elimination of enforcement brought about by legalization or by substantial reductions in the penalties for use” (p.78). Indeed, the clearest statement that can be made regarding the results from this report is that, regardless of the constraints imposed by prohibition costs (Reuter's consequences of product illegality), Canadian cannabis prices have remained very stable during the period under analysis. Such a finding does not simply highlight the stability of prices. More importantly, it emphasizes the stability and persistence of Canadian demand for cannabis, an issue that any policymaker or regulator must place at the core of the decision-making process that determines what constitutes a ‘vice' in this country.
The recent developments surrounding legalization raises several challenges for scholars as well as public authorities in understanding how it will impact corresponding prices, the illegal market, and cannabis use. The estimates of prices and price elasticity in this report represent those during a period of prohibition, making it impossible to fully estimate how potential movements to legalization could impact the market. However, the importance of obtaining estimates prior to policy shifts should not be understated. As stated by Maslov et al. (2016), “metrics of relevance to assessing any policy are most beneficial when they exist prior to any shift in policy, during the shift, and measured continuously following the shift” (p. 51). Having estimates allow policymakers to avoid many of the pitfalls in other jurisdictions. For instance, States within the US lacked baseline data on price estimates and elasticity during periods of prohibition, as well as information about the location and number of medical outlets. These barriers have precluded researchers and policy-makers from fully analyzing the effects of legalization policy and the impact of legalizing cannabis on the market. Documenting this now in various provinces will play a significant role for evaluating the impact of legalization in Canada. An understanding of cannabis markets requires a meaningful starting point. Much of what is known about prices in Canada extends from a single source, self-reported transactions from Price of Weed. Nationally representative surveys that ask about drug transactions in combination with more focused efforts to target regular, chronic users would greatly strengthen the weak infrastructure currently in place for assessing the cannabis market.
List of Acronyms
ADAM – Arrestee Drug Abuse Monitoring System
CAS – College Alcohol Study
CBD – Cannabidiol
CCHS-MH – Canadian Community Health Survey-Mental Health
CTADS – Canadian Tobacco, Alcohol, and Drugs Survey
DEA – Drug Enforcement Agency
DUF – Drug use Forecasting
GDS – Global Drug Survey
IDPPR – Illegal Drug Price/Purity Report
IDRS – Illicit Drug Reporting System
MTF – Monitoring the Future
NDSHS – National Drug Strategy Household Survey
NHSDA – National Household Survey on Drug Abuse
NSDUH – National Survey on Drug Use and Health
OLS – Ordered Least Squares regression
RCMP – Royal Canadian Mounted Police
STRIDE – System to Retrieve Information for Drug Evidence
THC - Δ9-tetrahydrocannabinol
THMQ – Trans High Market Quotation
UCR – Uniform Crime Reporting Survey
References
Aldridge, J., & Décary-Hétu, D. (2016). Hidden wholesale: The drug diffusing capacity of online drug cryptomarkets. International Journal of Drug Policy, 35, 7-15.
Allen, M. (2016). Police-reported crime statistics in Canada, 2015. Juristat. Ottawa, ON: Minister of Industry.
Anderson, D. M., Hansen, B., & Rees, D. I. (2013). Medical marijuana laws, traffic fatalities, and alcohol consumption. Journal of Law and Economics, 56, 333-368.
Angrist, J. D., & Krueger, A. B. (2001). Instrumental variables and the search for identification: From supply and demand to natural experiments. The Journal of Economic Perspectives 15(4), 69-85.
Barratt, M. J., Ferris, J. A., & Winstock, A. R. (2014). Use of Silk Road, the online drug marketplace, in the United Kingdom, Australia and the United States. Addiction, 109(5), 774-783.
Ben Lakhdar, C. (2009). The determinants of cannabis pricing: between credence, brand name, and users' individual characteristics. In Proceedings of the 3rd annual ISSDP Conference (pp.1-19). UNODC: Vienna, Austria.
Ben Lakhdar, C., Vaillant, N. G., & Wolff, F. C. (2016). Price elasticity of demand for cannabis: does potency matter? Addiction Research & Theory, 24(4), 300-312.
Bond, B., Caulkins, J. P., Scott, N., Kilmer, B., & Dietze, P. (2014). Are users' most recent drug purchases representative? Drug and Alcohol Dependence, 142, 133-138.
Bouchard, M. (2007). On the resilience of illicit drug markets. Global Crime, 8, 325-344.
Bouchard, M., & Dion, C. B. (2009). Growers and facilitators: probing the role of entrepreneurs in the development of the cannabis cultivation industry. Journal of Small Business & Entrepreneurship, 22(1), 25-37.
Boucher, A., Lawrence, A., & Maslov, A. (2013). The price of marijuana in Canada: Preliminary discussion of using price data for operational and policy purposes. Ottawa, ON: Public Safety Canada.
Boyce, J. (2015). Police-reported crime statistics in Canada, 2014. Juristat. Ottawa, ON: Minister of Industry.
Boyce, J., Cotter, A., & Perreault, S. (2014). Police-reported crime statistics in Canada, 2013. Juristat. Ottawa, ON: Minister of Industry.
Brennan, S. (2012). Police-reported crime statistics in Canada, 2011. Juristat. Ottawa, ON: Minister of Industry.
Broséus, J., Rhumorbarbe, D., Mireault, C., Ouellette, V., Crispino, F., & Décary-Hétu, D. (2016). Studying illicit drug trafficking on Darknet markets: structure and organisation from a Canadian perspective. Forensic Science International, 264, 7-14.
Burgdorf, J. R., Kilmer, B., & Pacula, R. L. (2011). Heterogeneity in the Composition of Marijuana Seized in California. Drug Alcohol Dependence, 117(1), 59-61.
Cameron, L., & Williams, J. (2001). Cannabis, alcohol and cigarettes: Substitutes or complements? The Economic Record 77(236), 19-34.
Canadian Tobacco, Alcohol and Drugs Survey (CTADS). (2016). Summary of results for 2015. Retrieved from http://healthycanadians.gc.ca/science-research-sciences-recherches/data-donnees/ctads-ectad/summary-sommaire-2015-eng.php
Caulkins, J. P. (1995). Domestic geographic variation in illicit drug prices. Journal of Urban Economics, 37(1), 38-56.
Caulkins, J. P. (2007a). Price and purity analysis for illicit drugs: Data and conceptual issues. Drug and Alcohol Dependence, 90, S61-S68.
Caulkins, J. P. (2007b). The need for dynamic drug policy. Addiction, 102, 4-7.
Caulkins, J. P. (2010). Estimated cost of production for legalized cannabis. Santa Monica, CA: RAND Corporations.
Caulkins, J. P., & Baker, D. (2010). Cobweb dynamics and price dispersion in illicit drug markets. Socio-Economic Planning Sciences, 44(4), 220-230.
Caulkins, J. P., & Bond, B. M. (2012). Marijuana price gradients implications for exports and export-generated tax revenue for California after legalization. Journal of Drug Issues, 42(1), 28-45.
Caulkins, J. P., Kilmer, B., Kleiman, M. A. R., MacCoun, R. J., Midgette, G., Oglesby, P., Pacula, R. L., & Reuter, P. H. (2015). Considering marijuana legalization. Santa Monica: CA: RAND Corporation.
Caulkins, J. P., & Pacula, R. L. (2006). Marijuana markets: Inferences from reports by the household population. Journal of Drug Issues, 36(1), 173-200.
Caulkins, J. P., & Padman, R. (1993). Quantity discounts and quality premia for illicit drugs. Journal of the American Statistical Association, 88(423), 748-757.
Caulkins, J. P., & Reuter, P. (1998). What price data tell us about drug markets. Journal of Drug Issues, 28(3), 593-612.
Caulkins, J. P., & Reuter, P. (2010). How drug enforcement affects drug prices. Crime and Justice, 39(1), 213-271.
Caulkins, J. P., Reuter, P., & Taylor, L. J. (2006). Can supply restrictions lower price? Violence, drug dealing and positional advantage. Contributions to Economic Analysis & Policy, 5(1), 1-18,
Christin, N. (2013, May). Traveling the Silk Road: A measurement analysis of a large anonymous online marketplace. In Proceedings of the 22nd international conference on World Wide Web (pp. 213-224). ACM.
Clements, K. W. (2004). Three facts about marijuana prices. Australian Journal of Agricultural and Resource Economics, 48(2), 271-300.
Clements, K. W. (2006). Pricing and packaging: the case of marijuana. The Journal of Business, 79(4), 2019-2044.
Clements, K. W. (2008). Price of elasticities of demand are minus one-half. Economic Letters, 99, 490-493.
Clements, K. W., & Daryal, M. (2003). The economics of marijuana consumption. In S. Selvanathan, & E. A. Selvanathan (Eds.), The demand for alcohol, tobacco, and marijuana: International evidence. London, UK: Ashgate.
Clements, K. W., & Zhao, X. (2009). Economics and Marijuana: Consumption, Pricing and Legalisation. Cambridge University Press.
Cole, J. C., Goudie, A. J., Field, M., Loverseed, A. C., Charlton, S., & Sumnall, H. R. (2008). The effects of perceived quality on the behavioural economics of alcohol, amphetamine, cannabis, cocaine, and ecstasy purchases. Drug and Alcohol Dependence, 94(1), 183-190.
Collins, R. L., Vincent, P. C., Yu, J., Liu, L., & Epstein, L. H. (2014). A behavioral economic approach to assessing demand for marijuana. Experimental Clinical Psychopharmacology, 22(3), 211-221.
Davis, A. J., Geisler, K. R., & Nichols, M. W. (2016). The price elasticity of marijuana demand: Evidence from crowd-sourced transaction data. Empirical Economics, 50, 1171-1192.
Davenport, S. S., & Caulkins, J. P. (2016). Evolution of the United States marijuana market in the decade of liberalization before full legalization. Journal of Drug Issues, 46(4), 411-427.
Desimone, J. (2006). The relationship between illegal drug prices at the retail user and seller levels. Contemporary Economic Policy, 24(1), 64-73.
Desimone, J., & Farrelly, M. C. (2003). Price and enforcement effects of cocaine and marijuana demand. Economic Inquiry, 41, 98-115.
Devinsky, O., Marsh, E., Friedman, D., Thiele, E., Laux, L., Sullivan, J., & Wong, M. (2016). Cannabidiol in patients with treatment-resistant epilepsy: an open-label interventional trial. The Lancet Neurology, 15(3), 270-278.
Diplock, J., & Plecas, D. (2011). The increasing problem of electrical consumption in indoor marijuana grow operations in British Columbia University of Fraser Valley: Centre for Public Safety and Criminal Justice Research. Retrieved from http://cjr.ufv.ca/the-increasing-problem-ofelectrical-consumption-in-indoor-marihuana-grow-operations-in-british-columbia/ (December 5, 2016)
Eliany, M., Giesbrecht, N., & Nelson M. (1990). National alcohol and other drugs survey: Highlights report. Ottawa, ON: Health and Welfare Canada.
Gallet, C. A. (2014). Can price get the monkey off our back? A meta-analysis of illicit drug demand. Health Economics, 23, 55-68.
Goudie, A. J., Sumnall, H. R., Field, M., Clayton, H., & Cole, J. C. (2007). The effects of price and perceived quality on the behavioural economics of alcohol, amphetamine, cannabis, cocaine, and ecstasy purchases. Drug and Alcohol Dependence, 89(2), 107-115.
Hin, A. (2015, October 30). That one time we crowdsourced the price of marijuana. Retrieved from http://www.andyhin.com/
Hunt, D., & Rhodes, W. (2009). Arrestee Drug Abuse Monitoring Program II in the United States, ICPSR30061-v1. Ann Arbor, MI: Inter-university Consortium for Political and Social Research [distributor], 2011-02-24. http://doi.org/10.3886/ICPSR30061.v1
Jacobson, M. (2005). Baby booms and drug busts: Trends in youth drug use in the United States 1975-2000. Quarterly Journal of Economics, 119(4), 1481-1512.
Karniol, I. G., Shirakawa, I., Kasinski, N., Pfeferman, A., & Carlini, E. A. (1974). Cannabidiol interferes with the effects of Δ 9-tetrahydrocannabinol in man. European Journal of Pharmacology, 28(1), 172-177.
Kilmer, B. (2014). Policy designs for cannabis legalization: Starting with the eight Ps. American Journal of Drug and Alcohol Abuse, 40, 259-261.
Kilmer, B., Caulkins, J. P., Pacula, R. L., MacCoun, R. J., & Reuter, P. H. (2010). Altered state? Assessing how marijuana legalization in California could influence marijuana consumption and public budgets. Santa Monica, CA: RAND Corporation.
Kilmer, B., Everingham, S., Caulkins, J., Midgette, G., Pacula, R., Reuter, P., Burns, R., Han, B., & Lundberg, R. (2014). What America's users spend on illegal drugs: 2000-2010. Office of National Drug Control Policy, Office of Research and Data Analysis.
Kilmer, B., & Pacula, R. L. (2009). Estimating the size of the illicit drug markets: A demand-side approach. In P. Reuter & F. Trautmann (Eds.) A report on global illicit drug markets 1998-2007 (pp. 25-77).Netherlands: European Communities.
Kilmer, B., & Pacula, R. L. (2016). Understanding and learning from the diversification of cannabis supply laws. Addiction. 10.1111/add.13623
Kleiman, A. R., & Davenport, S. (2012). Strategies to control Mexican drug-trafficking violence. Journal of Drug Policy Analysis, 5(1), 1-7.
Krausz, R. M. (2011). British Columbia health of the homeless Survey Report. Vancouver, BC: Centre for Health Evaluation and Outcome Science.
Kruithof, K., Aldridge, J., Décary-Hétu, D., Sim, M., Dujso, E., & Hoorens, S. (2016). Internet-facilitated drugs trade: An analysis of the size, scope and the role of the Netherlands. Cambridge, UK: RAND Europe.
LeDain, G. (1973). Final report of the commission of inquiry into the non-medical use of drugs. Ottawa, ON: Information Canada.
MacCoun, R.J. and P. Reuter (2001). Drug War Heresies: Learning from Other Vices, Times, and Places. Cambridge: Cambridge University Press.
Macdonald, M., Frank, R., Mei, J., Monk, B. (2015). Identifying Digital Threats in a Hacker Web Forum. International Symposium on Foundations of Open Source Intelligence and Security Informatics. Paris, France.
MacNeil, P., & Webster, I. (1997). Canada's alcohol and other drugs survey 1994: A discussion of the findings Ottawa, ON: Office of Alcohol, Drugs and Dependency Issues Health Canada.
Malivert, R., & Hall, J. C. (2013). The effect of medical marijuana laws on extralegal marijuana prices. Atlantic Economic Journal, 41(4), 455.
Marijuana Policy Group (2014). Market size and demand for marijuana in Colorado. Retrieved from https://www.colorado.gov/pacific/sites/default/files/Market%20Size%20and%20Demand%20Study%2C%20July%209%2C%202014%5B1%5D.pdf
Martin, B. (2016, Oct 11). A CMPR and dispensary price comparison. Lift. Retrieved from https://news.lift.co/author/brad-martin/
Martin, J. (2014). Lost on the Silk Road: Online drug distribution and the ‘cryptomarket'. Criminology and Criminal Justice, 14(3), 351-367.
Maslov, A., Lawrence, A., & Ferguson, F. (2016). Cannabis performance metrics for policy consideration: What do we need to measure? Ottawa, ON: Public Safety Canada.
McLellan, A. A., Ware, M. A., Boyd, S., Chow, G., Jesso, M., Kendall, P., Souccar, R., von Tigerstrom, B., & Zahn, C. (2016). A framework for the legalization and regulation of cannabis in Canada: The final report of the task force on cannabis legalization and regulation. Ottawa, ON: Health Canada.
Moeller, K., & Pedersen, M. (2014). Cannabis retail purchases in a low-risk market: Purchase size and sex of buyers. Nordic Studies on Alcohol and Drugs, 31(2), 161-174.
Nisbet, C. T., & Vakil, F. (1972). Some estimates of price and expenditure elasticities of demand for marijuana among U.C.L.A. students. The Review of Economics and Statistics, 54(4), 473-475.
Owen, G., & Savage, N. (2015). The Tor Dark Net. Global Commission on Internet Governance. Retrieved from https://www.cigionline.org/sites/default/files/no20_0.pdf
Pacula, R. L. (2010). Examining the impact of marijuana legalization in marijuana consumption: Insights from the economics literature. Santa Monica, CA: RAND Corporation.
Pacula, R. L., Grossman, M., Chaloupka, F. J., O'Malley, P. M., Johnston, L. D., & Farrelly, M. C. (2001). Marijuana and youth. In J. Gruber (Ed.), Risky behavior among youths: An economic analysis (pp. 271-326). University of Chicago Press.
Pacula, R. L., Jacobson, M., & Maksabedian, E. J. (2016). In the weeds: A baseline view of cannabis use among legalizing states and their neighbours. Addiction, 111, 973-980.
Pacula, R. L., Kilmer, B., Grossman, M., & Chaloupka, F. J. (2010). Risks and prices: The role of user sanctions in marijuana markets. The B.E. Journal of Economic Analysis & Policy, 10(1), 1-36.
Pacula, R. L., & Lundberg, R. (2014). Why changes in price matter when thinking about marijuana policy: A review of the literature on the elasticity of demand. Public Health Review, 35(2), 1-18.
Parliamentary Budget Officer (PBO). (2016, November 1). Legalized cannabis: Fiscal considerations. Retrieved from http://www.pbo-dpb.gc.ca/en/blog/news/Legalized_Cannabis
Perreault, S. (2013). Police-reported crime statistics in Canada, 2012. Juristat. Ottawa, ON: Minister of Industry.
PotGuide.Com (20 February, 2016). Marijuana prices in Denver and Colorado: Winter 2015 Update. Retrieved from https://www.coloradopotguide.com/colorado-marijuana-blog/article/marijuana-prices-in-denver-and-colorado-winter-2015-update/ (Accessed January 20, 2017).
Potter, D. J., Clark, P., & Brown, M. B. (2008). Potency of Δ9–THC and other cannabinoids in cannabis in England in 2005: implications for psychoactivity and pharmacology. Journal of Forensic Sciences, 53(1), 90-94.
Potter, G., Bouchard, M., Decorte, T. (2011). The globalization of cannabis cultivation. Ch. 1 In T. Decorte, G. Potter, and M. Bouchard (Eds). World Wide Weed: Global Trends in Cannabis Cultivation and its Control. London: Ashgate
Ramful, P., & Zhao, X. (2009). Participation in marijuana, cocaine and heroin consumption in Australia: A multivariate probit approach. Applied Economics, 41(4), 481-496.
Reuter, P. (1983). Disorganized crime: The economics of the visible hand. Cambridge, MA: MIT Press.
Reuter, P., & Kleinman, M. A. (1986). Risks and Prices: An Economic Analysis of Drug Enforcement. Crime and Justice, 7, 289-340.
Reuter, P., MacCoun, R., & Murphy, P. (1990). Money from crime: A study of the economics of drug dealing in Washington, D.C. Santa Monica, CA: RAND Corporation.
Rhodes, W., Hyatt, R., & Scheiman, P. (1994). The Price of Cocaine, Heroin, and Marijuana, 1981 – 1993. The Journal of Drug Issues, 24(3), 383-402.
Rhodes, W., Johnston, P., Han, S., McMullen, Q., & Hozik, L. (2001). Illicit drugs: Price elasticity of demand and supply. U.S. Department of Justice.
Roberto, K. (2005). What is Hydroponics? In How-To-Hydroponics (4th Ed.), (pp. 10-15). Farmingdale, NY: The Futuregarden Press.
Rolles, S., & Murkin, G. (2016). How to regulate cannabis: A practical guide. (Second edition). Transform Drug Policy Foundation.
Sifaneck, S. J., Ream, G. L., Johnson, B. D., & Dunlap, E. (2007). Retail marijuana purchases in designer and commercial markets in New York City: Sales units, weights, and prices per gram. Drug and Alcohol Dependence, 90, S40-S51.
Soska, K., & Christin, N. (2015). Measuring the longitudinal evolution of the online anonymous marketplace ecosystem. In 24th USENIX Security Symposium (USENIX Security 15) (pp. 33-48).
Statistics Canada. (2016a, Sep 28). Population by year, by province and territory (Number). Retrieved from http://www.statcan.gc.ca/tables-tableaux/sum-som/l01/cst01/demo02a-eng.htm
Statistics Canada. (2016b, Nov 4). Authorized Licensed Producers for Medical Purposes. Drugs and Health Products. Retrieved from http://www.hc-sc.gc.ca/dhp-mps/marihuana/info/list-eng.php
Statistics Canada. (2016c, Jul 14). Individuals by total income level, by province and territory (Canada). Retrieved from http://www.statcan.gc.ca/tables-tableaux/sum-som/l01/cst01/famil105a-eng.htm
Statistics Canada. (2016d, Jul 12). Uniform Crime Reporting Survey (UCR). Retrieved from http://www23.statcan.gc.ca/imdb/p2SV.pl?Function=getSurvey&SDDS=3302
Storti, C. C., & De Grauwe, P. (2009). Globalization and the price decline of illicit drugs. International Journal of Drug Policy, 20(1), 48-61.
United Nations Office on Drugs and Crime (UNODC). (2010). World drug report, 2010. Vienna: United Nations Publication Sales No. E.10.XI.13.
van Ours, J. C., & Williams, J. (2007). Cannabis price and dynamics of cannabis use. Journal of Health Economics, 26, 578-596.
Vanhove, W., Surmont, T., Van Damme, P., & De Ruyver, B. (2012). Yield and turnover of illicit indoor cannabis (Cannabis spp.) plantations in Belgium. Forensic Science International, 220(1), 265-270.
Vanhove, W., Surmont, T., Van Damme, P., De Ruyver, B. (2014). Filling in the blanks. An estimation of illicit cannabis growers' profits in Belgium. International Journal of Drug Policy, 25, 436-443.
Werb, D., Nosyk, B., Kerr, T., Fischer, B., Montaner, J., & Wood, E. (2012). Estimating the economic value of British Columbia's domestic cannabis market: Implications for provincial cannabis policy. International Journal of Drug Policy, 23(6), 436-441.
Wilkins, C., Reilly, J. L., Pledger, M., & Casswell, S. (2005). Estimating the dollar value of the illicit market for cannabis in New Zealand. Drug and Alcohol Review, 24(3), 227-234.
Williams, J. (2004). The effects of price and policy on marijuana use: What can be learned from the Australian experience? Health Economics, 13, 123-137.
Williams, J., & Mahmoudi, P. (2004). Economic relationship between alcohol and cannabis revisited. The Economic Record, 80(248), 36-48.
Williams, J., Pacula, R. L., Chaloupka, F. J., & Wechsler, H. (2004). Alcohol and marijuana use among college students: Economic complements or substitutes. Health Economics, 13, 825-834.
Williams, J., Pacula, R. L., Chaloupka, F. J., & Wechsler, H. (2006). College students' use of cocaine. Substance Use & Misuse, 41(4), 489-509.
Zhao, X., & Harris, M. N. (2004). Demand for Marijuana, Alcohol and Tobacco: Participation, Levels of Consumption and Cross‐equation Correlations. Economic Record, 80(251), 394-410.
Zook, M., Graham, M., & Stephens, M. (2011). Data shadows of an underground economy: Volunteered geographic information and the economic geographies of marijuana (Floating Sheep Working Paper Series FSWP001). Retrieved from http://www.floatingsheep.org/2011/08/price-of-weed.html
Zulkarnine, A.T., Frank, R., Monk, B., Mitchell, J., Davies, G. (2016). Surfacing Collaborated Networks in Dark Web to find Illicit and Criminal Content. Intelligence and Security Informatics (ISI) Conference. Arizona, US.
Appendix A: Systematic Literature Review
A systematic literature review was conducted to examine extant research in three complementary areas, from the general to the specific:
- determinants of cannabis prices;
- estimates of cannabis prices; and
- price elasticity of demand for cannabis.
The objective of the review was to assess the state of knowledge in these three areas. We did not draw solely from studies presenting empirical findings, or solely from studies published in scholarly journals. Rather, the review cast a wide-net in order to capture conceptual essays, policy analyses, and empirical studies. It included books and book chapters, scientific articles, government, and think tank reports on these issues.
Literature was acquired through two main strategies. First, a keyword search was conducted using four search engines and citation indexing databases, including: Web of Science, Canadian Research Index, ProQuest, and Google search engines. This search strategy covered peer-reviewed journal articles, book chapters from edited volumes, government and think-tank reports, and unpublished empirical essays. To exhaust the search parameters and retrieve a wide range of extant literature pertaining to the research objectives, logical combinations and variations of keywords were used to search the databases: marijuana, cannabis, price, elasticity, participation, consumption, demand, economics, drug, markets, and policy. Variations on all of these words were also used with the aid of asterisks (e.g. extrem*), as well as different specifications (e.g. ‘AND' …).
The keyword search was complemented with a systematic examination of Curriculum Vitaes and/or publications of well-known and recognized scholars involved in research on drug prices, policy, and price elasticity. This included, Martin Bouchard (Simon Fraser U), David Bright (U New South Wales), Jonathan Caulkins (Carnegie Mellon), Susan Everingham (RAND Corporation), Beau Kilmer (RAND Corporation), Mark Kleiman (New York U), Carlo Morselli (U Montreal), Rosalie Pacula (RAND Corporation), Peter Reuter (Maryland U), Stephen Sifaneck (NA), Jan van Ours (U Melbourne), and Jenny Williams (U Melbourne).
Appendix B: Description of the Web-Crawler
This section compares the method of data collection from the three primary websites that were the sources of data for this study: 1) Price of Weed and 2) the Internet Archive (archived Price of Weed webpages), and 3) Lift.co.
A custom-built software called the Dark Crawler (Zulkarnine et al., 2016) was used to collect the websites that contained the sought after data. The Dark Crawler downloads webpages in their entirety, including optional images, then proceeds to extract links which point to other webpages, which are downloaded in turn. This process continues recursively. For each webpage downloaded, the content is parsed to capture the relevant information while retaining the original webpage structure (see Figure B1). In this method, the three sources (Price of Weed, the Internet Archive, and Lift) were downloaded in their entirety, thus the drug data provided on the websites were captured and stored in full, saved in a database so their contents could be extracted and analyzed.
However, the result of the data collection process is a series of HTML files, which cannot be analyzed directly. There are two major challenges that must be overcome before the cannabis data on the webpages can be analyzed statistically. First, each webpage contains a lot of spurious information which is not of interest and must be removed. Second, webpages are not conducive to large scale analysis, as each webpage can contain a variable number of data points (marijuana prices, for example), if any. The drug price data from these HTML pages must be extracted and then merged into one coherent dataset. In order to solve both these challenges, a generic framework for data extraction from webpages was developed. This is described in Macdonald et al. (2015). The next section describes the intricacies of the data capture affecting each of the three data sources.
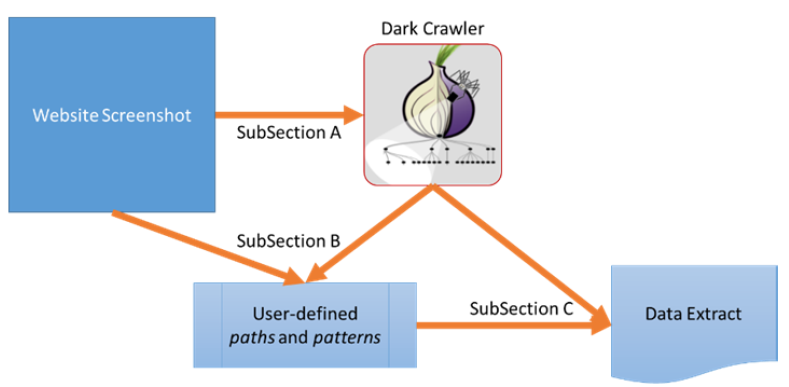
Image description
Figure B1:
This figure provides an overview of the dark web crawler. Starting on the left-hand side, a blue box called “Website Screenshot” points two arrows: one, called subsection A, to a picture of a peeled onion called “Dark Crawler”, and another, called Subsection B, to another blue box titled “User-defined paths and patterns.” Subsequently, both the picture of a peeled onion (“Dark Crawler”) and the blue box (“User-defined paths and patterns”) point arrows, called Subsection C, to another blue box called “Data Extract.”
Price of Weed
The website organizes and displays self-reported prices and qualities of cannabis for various locations, mainly within North America. Clicking on one of the locations will push the user to a more detailed webpage which details the location, price, and quality of cannabis purchases. Webpages are organized by location (country, state/province, city). Elements of a typical webpage on Price of Weed include relevant information, such as the location, prices, and sample size. Each webpage for each state or province repeats this structure, which allows the Dark Crawler to capture the data from all the webpages comprising the website. Data collection from this website proceeded relatively efficiently without any major issues.
The Internet Archive (archived Price of Weed webpages) and Lift.co
Price of Weed contains self-reported numbers going back only a short amount of time, depending on the location, but usually on the order of weeks. To compile historical information, we turned to the Internet Archive's constant re-crawling of Price of Weed. The Internet Archive is an online resource that strives to capture cultural artifacts from the web, so that they do not become censored or deleted in the future. The Internet Archive has visited, and captured, Price of Weed 324 times between September 5, 2010 and October 16, 2016.
Data capture from this website was a challenge. While the Dark Crawler can capture entire websites, in this instance that capability did not fit the goal correctly, as it would have captured the entire Web Archive, and not just the Price of Weed portion of it. Thus, further capability had to be built into the Dark Crawler to direct it to capture only pages that meet certain requirements. This was done by adding the capability of specifying a user-defined filter, in the format of Regex.Footnote 54 If a URL matches the Regex, the page is downloaded, otherwise it is skipped. The same data collection strategy used to extract data from the Price of Weed website was used to extract data from Lift.co.
Once all data from each of the required websites was captured, a different set of rules and paths were defined for each website (for a total of three sets of rules and paths). The final product for each extract is a text file where each row represents the details of a given observation from one of the webpages, and each column represents each user-defined data element (e.g. price, location, and quality for example). Once all the files are standardized for structure and merged into the final dataset, the resulting file may then be imported into Excel or statistical packages for analysis.
Appendix C: Price Data obtained from Licensed Medical Cannabis Producers
Data on cannabis prices from licensed medical cannabis producers was collected from two sources: 1) the websites of licensed producers; and, 2) Lift.co, a website that provides a centralized platform of listed medical cannabis prices.Footnote 55
The point of departure for data on licensed medical cannabis producers was Health Canada's website, Authorized Licensed Producers for Medical PurposesFootnote 56, which as of November 31, 2016 lists 28 producers who are licensed to sell cannabis in Canada. Producers were primarily concentrated in Ontario (52.4%), with producers also located in British Columbia (23.8%), Alberta (4.8%), Saskatchewan (4.8%), Manitoba (4.8%), Quebec (4.8%), and New Brunswick (4.8%). The website of each licensed producer was consulted to collect data on the: name of product; plant (e.g. Indica, Sativa, Hybrid); THC, CBD, and CBN levels; price per gram; and volume sold (grams). Each producer was also contacted by phone and/or email to request access to price data from previous periods (e.g. 2013 to 2015). However, only one cannabis producer provided price data for previous periods.
To supplement this data, the website Lift.co was consulted. Lift.co is an independent Canadian company that provides information on the name of the producer, the product name, THC, CBD, CBN levels, and price per gram. Each licensed cannabis producer was searched in the Lift.co database to obtain additional price information. Although producers' websites provided information on available cannabis products and prices, Lift.co listed additional products that were not currently advertised on producers' websites. It is assumed that these products indexed on Lift.co were offered in the past. Given that the date of initial licensing for all licensed medical producers was from 2013 onwards, all price data for products not currently listed on producers' websites was included in the final dataset. This created a final dataset of 379 prices across 21 producers,Footnote 57 with 66% of all price data obtained from Lift.co.
Appendix D: Participation Elasticity Estimates
Participation elasticity of cannabis demand estimates were calculated using national survey data on cannabis use and self-report transaction data, for a one-year period. However, due to the low variation in both cannabis use and cannabis prices over this year, price was not found to be associated with cannabis participation. We attribute this to the low variation in prices and use, rather than the lack of a relationship. To support this stance, below the data sources, method, and results, as well as a description of the data is provided.
Data on cannabis usage trends was obtained from CTADS (formerly CADUMS), a general population survey conducted by Health Canada. First launched in 2008, the survey uses random digit dial telephone to obtain a nationally representative sample of the Canadian household population aged 15 years and older. Important to the current study, the survey asks participants about their past cannabis use (e.g. past three-months and past-month), as well as the frequency of their cannabis use within the past three-months (e.g. less than monthly, weekly, daily, or almost daily), and past-month (e.g. number of days used) (Table D1).
| Survey | Year | N= | Sample | Questions Pertaining to Cannabis Use |
|---|---|---|---|---|
| CTADS | 2010 | 10,076 | General population aged 15 years and older | - Used cannabis in the past-year (Y/N)? - Used cannabis in the past three-months (Y/N)? If yes, frequency of cannabis use (e.g. never past three-months, less than monthly, weekly, daily, or almost daily)? |
Data on use was matched to province-level indicators of cannabis prices for the same period and province in which the user took the survey. Price data for 2011 was obtained from Boucher et al. (2013) (a description can be found in Section 3: Price of Marijuana in Canada), and represents cannabis transactions reported to Price of Weed for the year 2011 in Canada. To match price data with the survey data, the median price of cannabis for each month (and past three-months) across provinces was calculated and merged with the CTADS dataset.
Consistent with previous studies on the price-elasticity of demand for cannabis (e.g. Pacula et al., 2001; DeSimone & Farrelly, 2003; Williams, 2004; Ben Lakhdar et al., 2016), individual-level controls, including a respondent's age at time of survey (years), sex (male or female), and highest level of education (no high school, high school, and greater than high school) were included. All control variables were coded using survey data from CTADS. In addition, given that previous studies have shown variation in prices of cannabis in Canada across seasons (Boucher et al., 2013), a control for seasonality (Spring, Summer, Fall, Winter) was included in the models. The final sample included 9,957 respondents, representing all individuals who provided complete responses to all variables in the study. Data for provinces in Atlantic Canada as well as the Prairie region were aggregated, due to a low number of price observations across these provinces.
Three classes of models were used to examine participation elasticity. The first class of models examined participation elasticity (whether price influenced the decision to use or not to use cannabis) for the full sample (n = 9,957), using province-level fixed effects. The second class of models examined conditional demand (the frequency of cannabis consumptionFootnote 58), examining whether current users' consumption patterns were sensitive to changes in prices (n = 540, respondents who reported using cannabis in the past three-months; n = 427, respondents who reported using cannabis in the past-month). The third class of models tested whether cannabis prices influence participation elasticity over time. This approach was modelled off Pacula et al. (2001) and aggregated the individual-level survey data to the province-level to examine changes in cannabis use prevalence and prices over time across provinces.
For each class of models, analyses were conducted using two outcome variables: respondents who reported using cannabis in the past three-months and respondents who reported using cannabis in the past-month. All models relied on a similar set of predictor variables: median cannabis price in the respondent's province; sex; age; highest level of education; and province of residence (for Model 3, these variables were aggregated to the province-level (e.g. percentage of males)). In Models 1 and 2, results highlighted that males and adolescents were not only more likely to use cannabis, but also used cannabis more frequently. In Model 3, none of the variables were significant. Importantly, for the current study, the cannabis price variable was not significant across all models.
Despite the lack of relationship between cannabis prices and cannabis use across all three classes of models, it may not be concluded that the demand for cannabis in Canada is insensitive to changes in prices. Rather, the findings confirm that lack of variation in both our main independent variable (cannabis prices) as well as our outcome variable (cannabis use) does not allow us to appropriately model the impact of cannabis prices on use. Figures D1 and D2 demonstrate this, plotting average number of cannabis users and cannabis prices over time.

Image description
Figure D1:
This figure illustrates the average cannabis-use prevalence and median cannabis price across provinces for three-month periods. There are six windows in the figure. Starting from the top left-hand side, the first window represents Quebec, followed by Ontario, Alberta, British Columbia, Atlantic Canada, and Saskatchewan and Manitoba. The y-axis on the left represents the average cannabis use prevalence. The y-axis on the right represents the median cannabis price. The x-axis represents time in months. The blue dots on all graphs represent average cannabis use, and the red dots represent median cannabis price. The green line represents the fitted values for average cannabis use, and the orange line represents the fitted values for the median cannabis price. The trends for the fitted lines are as follows: for Quebec, the green line is fairly flat, whereas the orange line is slanted downwards; for Ontario, both the green and the orange lines are slanted upwards, with the orange one being steeper than the green one; for Alberta, both the green and the orange lines are slanted upwards, with the green one being steeper than the orange one; for British Columbia, the orange line is fairly flat, whereas the green line is slanted downwards; for Atlantic Canada, both the green and the orange lines are slanted upwards and are almost parallel to each other; and for Saskatchewan and Manitoba, the orange line is slanted slightly downwards and the green line is slanted slightly upwards.
Note 1: Y-axis 1: Average Cannabis Use-Prevalence.
Note 2: Y-axis 2: Median Cannabis Price.
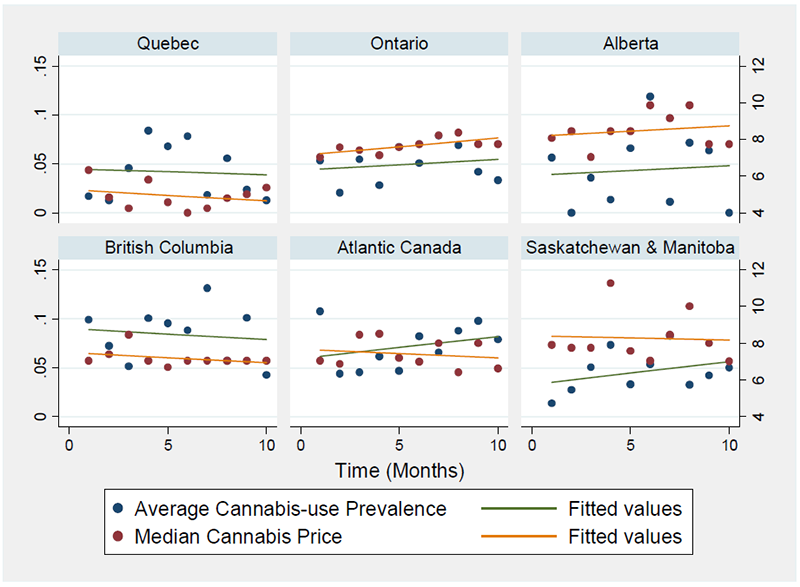
Image description
Figure D2:
This figure illustrates the average cannabis-use prevalence and median cannabis price across provinces for one-month periods. There are six windows in the figure. Starting from the top left-hand side, the first window represents Quebec, followed by Ontario, Alberta, British Columbia, Atlantic Canada, and Saskatchewan and Manitoba. The y-axis on the left represents the average cannabis use prevalence. The y-axis on the right represents the median cannabis price. The x-axis represents the time in months. The blue dots on all graphs represent the average cannabis use prevalence, and the red dots represent the median cannabis price. The green line represents the fitted values for the average cannabis use prevalence, and the orange line represents the fitted values for the median cannabis price. The trends for the fitted lines are as following: for Quebec, both the green and the orange lines are slanted slightly downwards and are almost parallel to each other; for Ontario, both the green and the orange lines are slanted upwards and are almost parallel to each other; for Alberta, both the green and the orange lines are slanted upwards and are almost parallel to each other; for British Columbia, both the green and the orange lines are slanted downwards and are almost parallel to each other; for Atlantic Canada, the orange line is slanted slightly downwards and the green line is slanted upward, and the lines are crossing each other; and for Saskatchewan and Manitoba, the orange line is almost flat and the green line is slanted upwards.
Note 1: Y-axis 1: Average Cannabis Use-Prevalence.
Note 2: Y-axis 2: Median Cannabis Price.
- Date modified: