2024 Corrections and Conditional Release Statistical Overview
Table of contents
- Preface
- Contributing Partners
- Section A: Crime and the Criminal Justice System
- Police-reported crime rate
- Police-reported crime rate by province/territory
- Crime Severity Index: 10-year trend
- Police-reported hate crimes: 10-year trend
- Police-reported homicide: 10-year trend
- Self-reported victimization rate
- Self-reported violent victimization rate by type, gender, and age
- Self-reported victimization reported to police
- The rate of adults charged
- Criminal Code and other Federal Statute charges among adults: 5-year trend
- Decisions in adult criminal court
- Length of adult custodial sentences
- The rate of youth charged
- Criminal Code and other Federal Statute charges among youth: 5-year trend
- Youth criminal court sentences: 5-year trend
- Youth criminal court sentences for most serious sentence: 5-year trend
- International incarceration rates
- International incarceration rates: 10-year trend
- Section B: Corrections Administration
- Costs of federal and provincial/territorial corrections
- Number of CSC employees by location
- Cost of incarceration in a federal institution: 5-year trend
- The number of Parole Board of Canada employees
- The number of employees in the Office of the Correctional Investigator
- Most common offender complaints to the Office of the Correctional Investigator
- Section C: Federal Offender and Registered Victims Populations
- Offenders under the responsibility of CSC
- Number of registered victims and number of offenders with a registered victim: 5-year trend
- The number of in-custody offenders: 10-year trend
- Number of admissions to CSC facilities by sex
- Warrant of committal admissions to CSC facilities by sex: 10-year trend
- Number of registered victims by gender: 5-year trend
- CSC total offender population by sentence length
- Offences of victimization among registered victims
- Warrant of committal admissions to a CSC facility by age
- Number of registered victims by age
- Warrant of committal admissions to a CSC facility for Indigenous and non-Indigenous offenders by age
- Age distribution of the CSC offender population
- CSC offender population by self-reported race
- Number of registered victims by self-reported race
- CSC offender population by religion
- CSC offenders by Indigenous and non-Indigenous self-identification
- Offenders in custody at a CSC facility by security risk classification
- Admissions to federal jurisdiction with a life and/or indeterminate sentence* by sex and Indigenous self-identification: 10-year trend
- Proportion of offenders with life and/or indeterminate sentences
- Percentage of total offender population serving a sentence for a violent offence
- Indigenous offenders under the responsibility of CSC
- Number of authorizations for transfer to Structured Intervention Units in federal institutions: 5-year trend
- Percentage of successful transfers out of Structured Intervention Units in federal institutions
- Structured Intervention Units: Time Outside of Cell
- Structured Intervention Units: Duration of Stay
- Characteristics of Offenders in Structured Intervention Unit Cells by Indigenous and non-Indigenous
- Reasons for Transfer to Structured Intervention Units
- Number of offender deaths while in custody: 10-year trend
- Number of escapees and escape incidents from federal institutions or Healing Lodges: 10-year trend
- CSC offenders in community under supervision by sex: 10-year trend
- Offenders under provincial/territorial supervision on probation or conditional sentence: 10-year trend
- Population of offenders on provincial parole*: 10-year trend
- Section D: Conditional Release
- Number of CSC offenders granted temporary absences: 10-year trend
- Offenders released from federal institutions, including Healing Lodges, on parole: 10-year trend
- Federal day and full parole grant rates by gender: 10-year trend
- Federal day and full parole grant rates by Indigenous and non-Indigenous offenders: 10-year trend
- Number of Culturally Responsive Hearings: 10-year trend
- Proportion of sentence served prior to being released on parole: 10-year trend
- Proportion of sentence served by Indigenous and non-Indigenous offenders prior to being released on parole: 10-year trend
- Outcome of federal day parole supervision periods
- Outcome of federal full parole supervision periods
- Offenders released from federal institutions including Healing Lodges on statutory release: 10-year trend
- Outcome of federal statutory release supervision periods
- Rates of violent offence convictions for offenders on federal conditional release: 10-year trend
- Section E: Special Applications of Criminal Justice
- Section F: Federal Services to Registered Victims
- Number of contacts with registered victims: 5-year trend
- Number of victim statements received for consideration in release decisions: 5-year trend
- Requests for financial assistance to attend parole hearings: 5-year trend
- Number of Parole Board of Canada contacts with victims: 10-year trend
- Victim presentations at PBC Hearings: 10-year trend
- Number of decisions sent from PBC decision registry: 5-year trend
Preface
The Corrections and Conditional Release Statistical Overview (CCRSO) has been published annually since 1998. The purpose of the CCRSO is to assist the public in understanding statistical information on corrections and conditional release. A primary consideration in producing the CCRSO was to present general statistical information in a user-friendly way that will facilitate understanding by a broad audience. There are several features of this document that make it different from typical statistical reports:
- The visual representation of the statistics is simple and uncluttered, and under each chart, a few key points assist the reader in extracting relevant information from the chart.
- For each chart, a table of numbers corresponds to the visual representation. In some instances, the table includes additional numbers (e.g., a 5-year series), even though the chart depicts the data for the most recent year (e.g., Figure A2).
The data used in the CCRSO reflects the most recent data available at the time of preparation. For much of the report, data are available from the 2024 calendar year or for the April 1, 2023 - March 31, 2024 fiscal year. There are a few figures for which the cycle of data collection is more infrequent – for example, the General Social Survey on Canadians' Safety (Victimization) is administered on a 5-year cycle with the most recent available data being from 2019.
Much of the data reported for 2020-21 was collected during the COVID-19 pandemic. As such, some trends observed between 2019–20 and 2020–21 should be interpreted with caution. The impacts of the pandemic may also be reflected in the data reported for 2021–22 and 2022–23.
The CCRSO includes data from partners that have different measures and methods for assessing gender and sex, and use different labels for these terms. For consistency across reporting, in the CCRSO, when sex was measured, the terms Male, Female, and Another sex were used; when gender was measured, the terms Men and Women and Boys and Girls were used.
In addition, beginning with the 2021 CCRSO, some data that was previously labelled as measuring ethnicity has been changed to race to more accurately reflect the identity concepts used by partners. As research measures pertaining to racialized groups advance, these terms and identity concepts may change in future years.
This report reflects terminology used in the source data, including the term “offender”. We recognize that this term may not align with person-first language and can be perceived as stigmatizing.
Considering the different types of crime statistics and terminology presented in the CCRSO, a certain level of data literacy is essential for accurate interpretation of the data. For example, some figures and tables in the CCRSO display frequencies, while others display rates; frequency and rate data answer different questions and inform responses to crime in different ways. To optimize the public's ability to form an accurate, informed, and critical interpretation of different crime statistics and terminology presented in the CCRSO, a data literacy focused companion product was published along with the 2022 CCRSO and is available on https://www.publicsafety.gc.ca/cnt/rsrcs/pblctns/ccrso-2022-dt-ltrcy/index-en.aspx.
To continually improve this annual publication, we welcome your comments. Any correspondence regarding this report, including permission to use tables and figures should be directed to horizontalpolicy-politiqueshorizontales@ps-sp.gc.ca.
Contributing Partners
Public Safety Canada
Public Safety Canada (PS) is Canada's lead federal department for public safety, which includes emergency management, national security and community safety. Its many responsibilities include developing legislation and policies that govern corrections, implementing innovative approaches to community justice, and providing research expertise and resources to the corrections community.
Correctional Service Canada
The Correctional Service of Canada (CSC) is the federal government department responsible for administering custodial sentences of a term of 2 years or more, as imposed by the courts. CSC is responsible for managing institutions of various security levels and supervising offenders under conditional release in the community.
Parole Board of Canada
The Parole Board of Canada (PBC) is an independent administrative tribunal responsible for making decisions about the timing and conditions of release of offenders into the community on various forms of conditional release. The Board also makes pardon, record suspension and expungement decisions and recommendations respecting clemency through the Royal Prerogative of Mercy.
Office of the Correctional Investigator
The Correctional Investigator is the Ombudsperson for federal offenders. The Office of the Correctional Investigator (OCI) conducts investigations into the problems of offenders related to decisions, recommendations, acts or omissions of the Correctional Service of Canada that affect offenders individually or as a group.
Canadian Centre for Justice and Community Safety Statistics (Statistics Canada)
The Canadian Centre for Justice and Community Safety Statistics (CCJCSS) is a division of Statistics Canada. The CCJCSS is the focal point of a federal-provincial-territorial partnership, known as the National Justice Statistics Initiative, for the collection of information on the nature and extent of crime and the administration of civil and criminal justice in Canada.
Section A: Crime and the Criminal Justice System
Police-reported crime rate
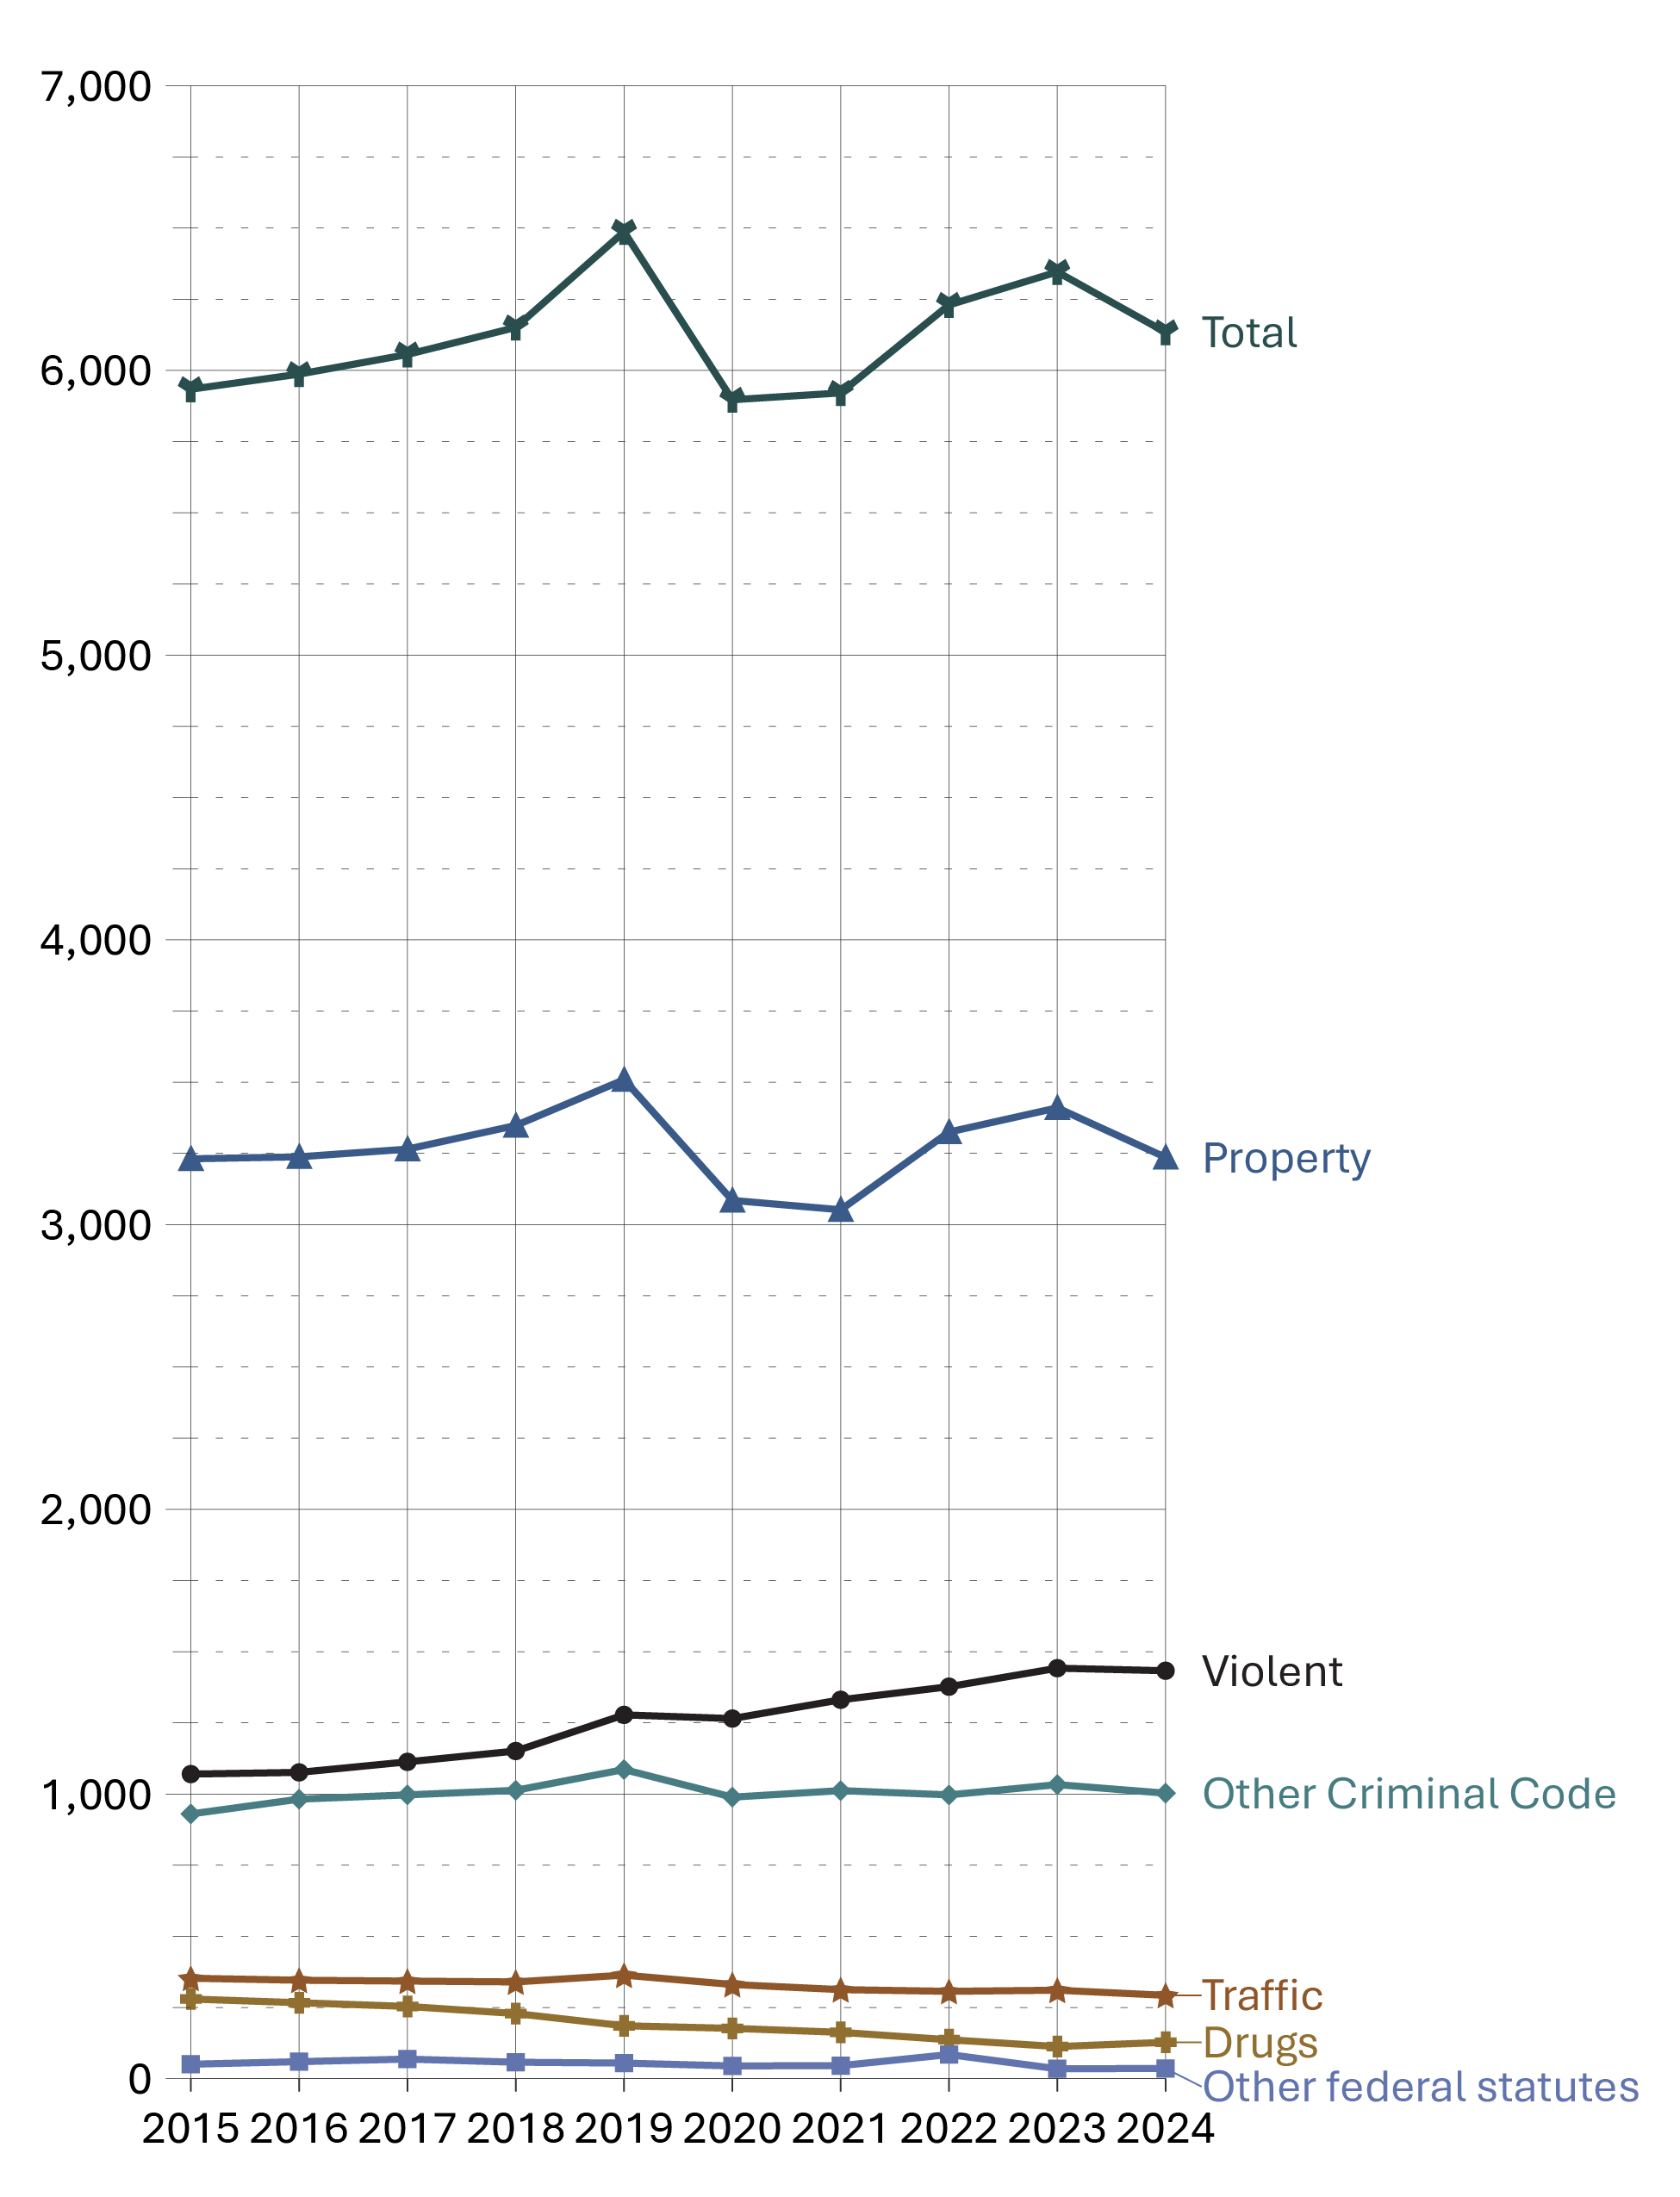
Image description
Line graph showing the police-reported crime rate by crime type, per 100,000 population, between calendar year 2015 and 2024. The graph includes the rates of total crime, property crime, violent crime, other Criminal Code violations, traffic violations, drug offences, and other federal statutes. Property offences represent the largest category, accounting for roughly half of all reported offences, while violent crime accounts for about a quarter of all reported offences. Other federal statutes offences consistently remain the smallest throughout the 10-year period. Full data are available in the table below.
Source: Statistics Canada. Table 35-10-0177-01, Incident-based crime statistics, by detailed violations, Canada, provinces, territories, Census Metropolitan Areas and Canadian Forces Military Police.
- The police-reported crime rate increased by 9.3% from 2015 to 2019, then decreased by 9.1% from 2019 to 2020. From 2020 to 2023, the rate rose by 7.6%, followed by a 3.3% decrease from 2023 to 2024. Fluctuations in the total police-reported crime rate between 2019 and 2022 may be due to the imposition and cessation of the COVID-19 pandemic lockdown restrictions.
- Despite fluctuations in the 10-year period between 2015 and 2024, the total police-reported crime rate slightly increased (+3.4%) from 2015 (5,934) to 2024 (6,134).
- The only type of offence that meaningfully increased from 2020 to 2024 was violent crime (+13.3%); though, over the past year (from 2023 to 2024), there was a minor decrease in violent crime (-0.6%).
- The offence types that meaningfully decreased from 2020 to 2024 were drug offences (-27.7%) and other federal statutes (-19.6%).
- Notably, the police-reported crime rate is lower in 2024 (6,134) than it was at the inception of the survey in 1998 (8,915) — a decrease of 31.2%.
| Year | Violent | Property | Traffic | Other CC | Drugs | Other federal statutes | Total charged |
|---|---|---|---|---|---|---|---|
| 1998 | 1,345 | 5,696 | 469 | 1,051 | 235 | 40 | 8,915 |
| 1999 | 1,440 | 5,345 | 388 | 910 | 264 | 44 | 8,474 |
| 2000 | 1,494 | 5,189 | 370 | 924 | 287 | 43 | 8,376 |
| 2001 | 1,473 | 5,124 | 393 | 989 | 288 | 62 | 8,390 |
| 2002 | 1,441 | 5,080 | 379 | 991 | 296 | 54 | 8,315 |
| 2003 | 1,435 | 5,299 | 373 | 1,037 | 274 | 46 | 8,532 |
| 2004 | 1,404 | 5,123 | 379 | 1,072 | 306 | 50 | 8,391 |
| 2005 | 1,389 | 4,884 | 378 | 1,052 | 290 | 60 | 8,090 |
| 2006 | 1,387 | 4,809 | 376 | 1,050 | 295 | 57 | 8,004 |
| 2007 | 1,354 | 4,525 | 402 | 1,029 | 308 | 59 | 7,707 |
| 2008 | 1,334 | 4,258 | 437 | 1,039 | 308 | 67 | 7,475 |
| 2009 | 1,322 | 4,122 | 435 | 1,017 | 291 | 57 | 7,281 |
| 2010 | 1,292 | 3,838 | 420 | 1,029 | 321 | 61 | 6,996 |
| 2011 | 1,236 | 3,536 | 424 | 1,008 | 330 | 60 | 6,628 |
| 2012 | 1,199 | 3,438 | 407 | 1,001 | 317 | 67 | 6,466 |
| 2013 | 1,096 | 3,154 | 387 | 956 | 311 | 52 | 5,982 |
| 2014 | 1,044 | 3,100 | 365 | 918 | 295 | 49 | 5,793 |
| 2015 | 1,070 | 3,231 | 353 | 930 | 280 | 51 | 5,934 |
| 2016 | 1,076 | 3,238 | 346 | 982 | 267 | 60 | 5,987 |
| 2017 | 1,113 | 3,265 | 343 | 997 | 254 | 69 | 6,056 |
| 2018 | 1,151 | 3,348 | 340 | 1,013 | 229 | 58 | 6,151 |
| 2019 | 1,278 | 3,509 | 364 | 1,086 | 186 | 55 | 6,487 |
| 2020 | 1,265 | 3,085 | 331 | 989 | 177 | 45 | 5,897 |
| 2021 | 1,331 | 3,052 | 313 | 1,012 | 163 | 46 | 5,921 |
| 2022 | 1,377 | 3,325 | 307 | 997 | 137 | 85 | 6,230 |
| 2023 | 1,442 | 3,410 | 311 | 1,033 | 113 | 35 | 6,346 |
| 2024 | 1,433 | 3,236 | 293 | 1,003 | 128 | 36 | 6,134 |
Source: Statistics Canada. Table 35-10-0177-01, Incident-based crime statistics, by detailed violations, Canada, provinces, territories, Census Metropolitan Areas and Canadian Forces Military Police.
Table A1 Notes
Other Criminal Code offences (Other CC) includes administration of justice violations, weapons/firearms violations, counterfeit, possession of, accessing, making or distribution of child pornography and prostitution.
Other federal statute offences refer to offences against Canadian federal statutes, such as Customs Act, Employment Insurance Act, Firearms Act, Food and Drugs Act (FDA), Income Tax Act, Controlled Drugs and Substances Act (CDSA) and Narcotic Control Act (NCA). This offence category excludes Criminal Code of Canada offences.
These crime statistics are based on crimes that are reported to the police. Since not all crimes are reported to the police, these figures underestimate actual crime statistics. See Sections A6 to A8 for self-reported rates based on Statistics Canada's General Social Survey (GSS) on Canadians' Safety surveys (victimization), an alternative method of measuring crime. GSS data is complementary to police-reported crime data, as many individuals who are victimized do not report their victimization to police; therefore, GSS data contributes to a more holistic representation of actual crime statistics.
Police-reported crime rate by province/territory
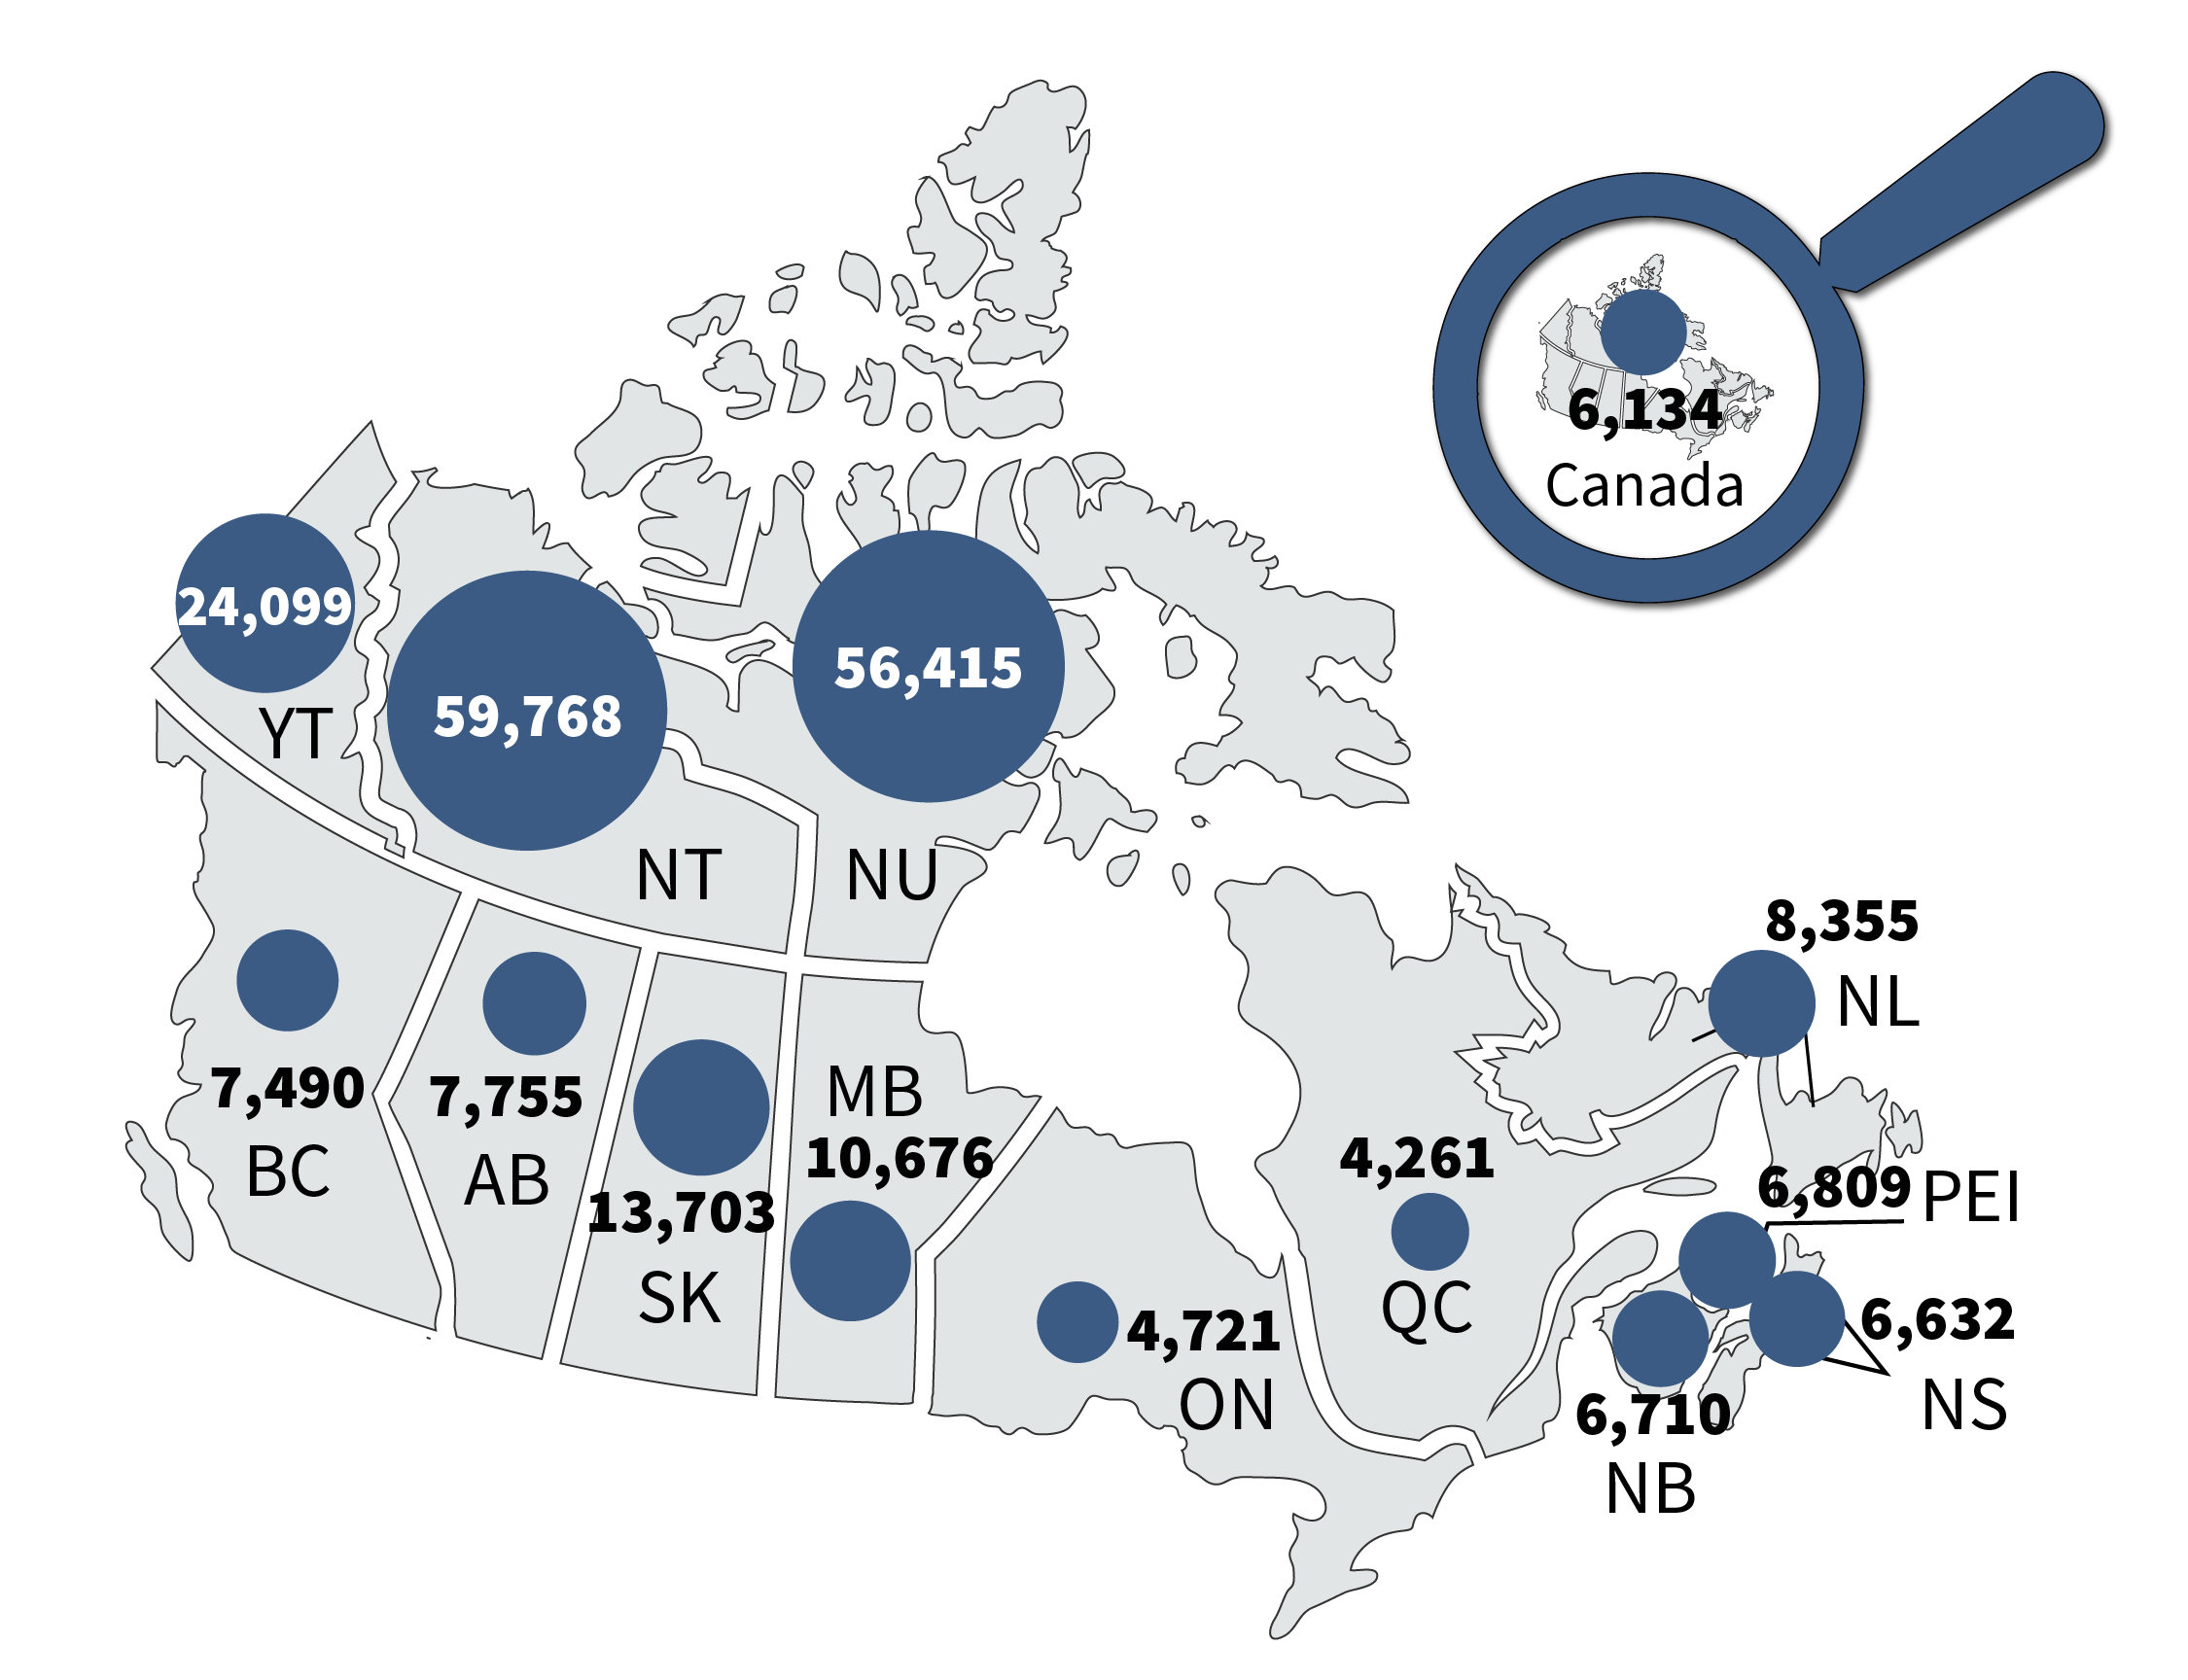
Image description
A map of Canada showing the police-reported crime rate, per 100,000 population, by province/territory in 2024. The map is a proportional area chart; each province/territory is overlaid with a circle, where the size of the circle is proportional to the crime rate in that region. The northern territories stand out with the highest rates, led by the Northwest Territories and Nunavut. Ontario and Quebec have the smallest rates, while the Atlantic provinces fall in the small range and Western provinces in the moderate range. Full data are available in the table below.
Source: Statistics Canada. Table 35-10-0177-01, Incident-based crime statistics, by detailed violations, Canada, provinces, territories, Census Metropolitan Areas and Canadian Forces Military Police.
- Crime rates were highest in the territories and elevated in central Canada. This general pattern has been stable over time.
- At the national level, the police-reported crime rate increased 7.6% from 2020 to 2023 and then decreased 3.3% from 2023 to 2024.
- In the 5-year period between 2020 and 2024, the crime rate in most provinces and territories increased. The three largest increases were observed in Newfoundland and Labrador (+24.7%), Prince Edward Island (+21.9%), and Quebec (+18.1%). In contrast, British Columbia (-13.7%) and Alberta (-12.2%) experienced the largest decreases in crime rate over this period.
| Province/territory | 2020 | 2021 | 2022 | 2023 | 2024 |
|---|---|---|---|---|---|
| Newfoundland and Labrador | 6,698 | 7,224 | 7,449 | 7,929 | 8,355 |
| Prince Edward Island | 5,588 | 5,407 | 5,926 | 6,998 | 6,809 |
| Nova Scotia | 5,811 | 6,009 | 6,440 | 6,467 | 6,632 |
| New Brunswick | 6,777 | 7,200 | 7,120 | 7,258 | 6,710 |
| Quebec | 3,607 | 3,770 | 4,302 | 4,295 | 4,261 |
| Ontario | 4,034 | 4,183 | 4,440 | 4,772 | 4,721 |
| Manitoba | 10,148 | 10,001 | 11,210 | 11,148 | 10,676 |
| Saskatchewan | 12,391 | 12,897 | 13,345 | 13,959 | 13,703 |
| Alberta | 8,832 | 8,380 | 8,775 | 8,474 | 7,755 |
| British Columbia | 8,681 | 8,303 | 8,124 | 7,991 | 7,490 |
| Yukon | 25,945 | 25,435 | 23,982 | 24,369 | 24,099 |
| Northwest Territories | 61,383 | 60,013 | 59,356 | 60,784 | 59,768 |
| Nunavut | 53,502 | 54,939 | 53,084 | 58,872 | 56,415 |
| Canada | 5,897 | 5,921 | 6,230 | 6,346 | 6,134 |
Source: Statistics Canada. Table 35-10-0177-01, Incident-based crime statistics, by detailed violations, Canada, provinces, territories, Census Metropolitan Areas and Canadian Forces Military Police.
Table A2 Notes
These crime statistics are based on crimes that are reported to the police. Since not all crimes are reported to the police, these figures underestimate actual crime statistics. See Tables A6 to A8 for self-reported rates based on General Social Survey (GSS) on Canadians' Safety surveys (victimization), an alternative method of measuring crime. GSS data is complementary to police-reported crime data, as many individuals who are victimized do not report their victimization to police; therefore, GSS data contributes to a more holistic representation of actual crime statistics.
Crime Severity Index: 10-year trend
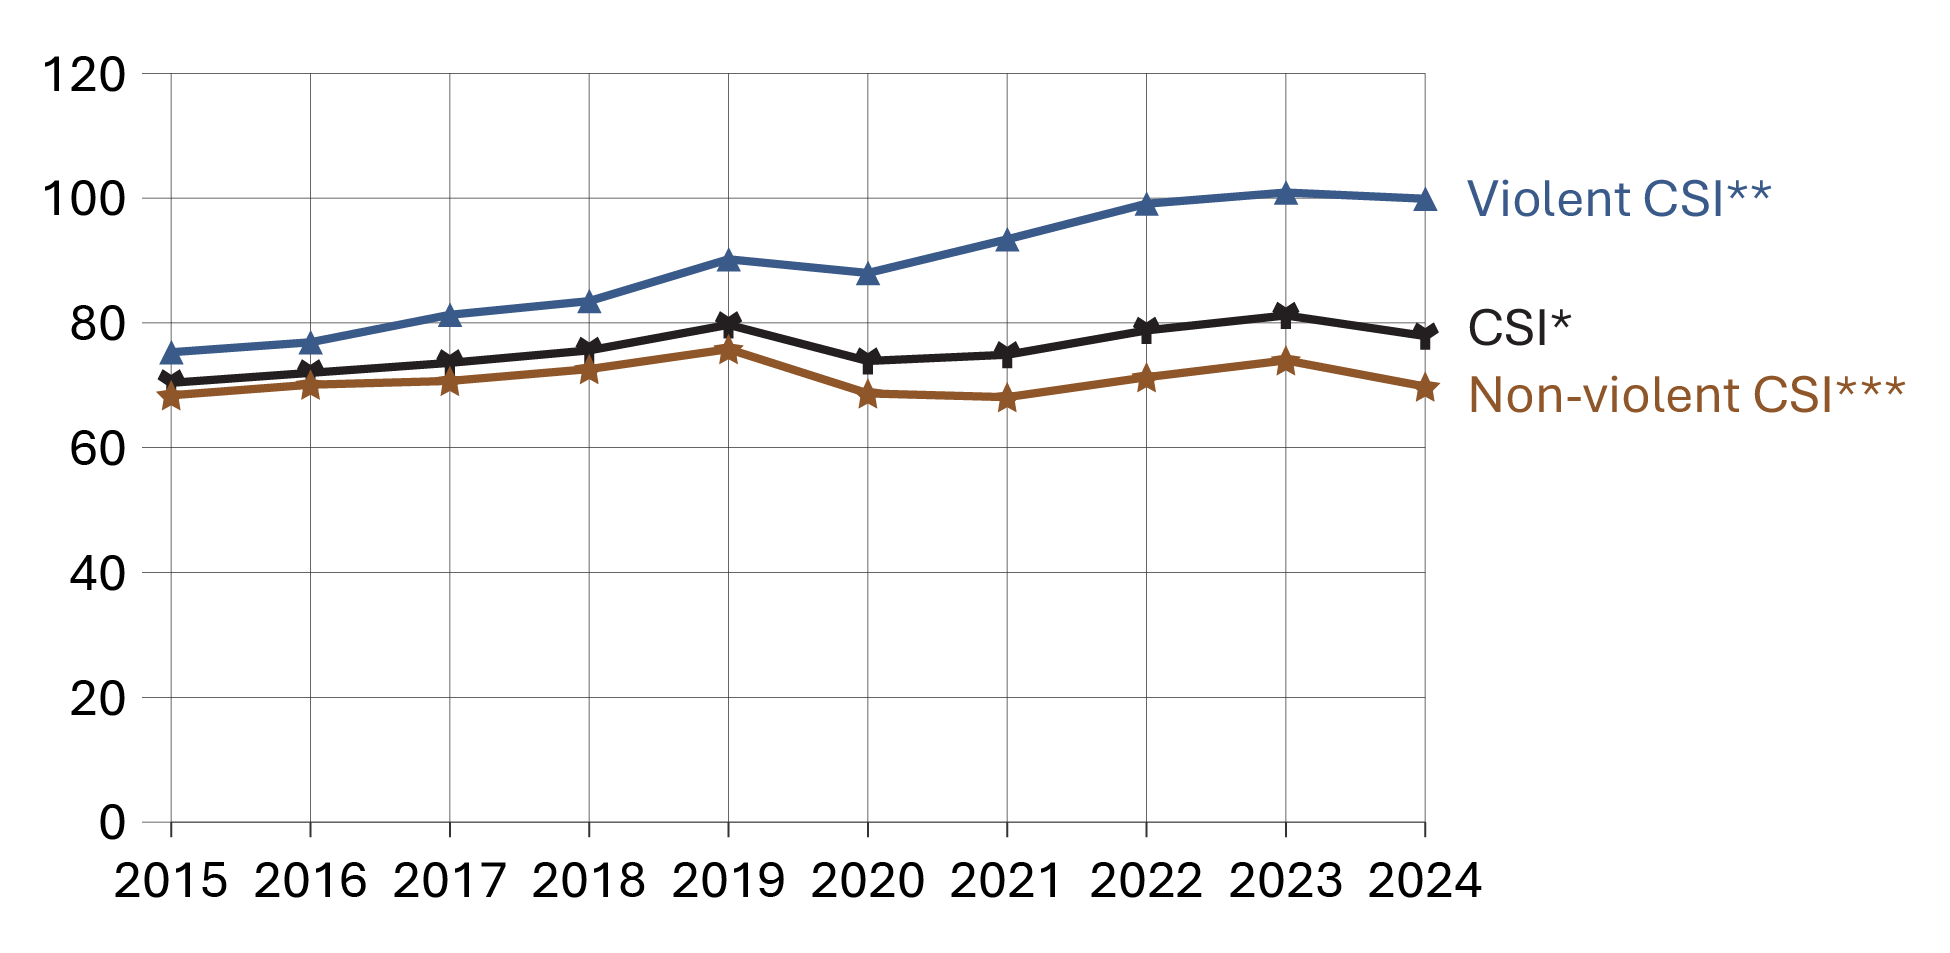
Image description
Line graph showing the crime severity index between calendar year 2015 and 2024. The graph compares the violent crime severity index, non-violent crime severity index, and overall crime severity index. While all three indices follow similar trends over the 10-year period, the violent crime severity index is consistently the highest index, while the non-violent crime severity index is the lowest. Full data are available in the table below.
Source: Statistics Canada. Table 35-10-0026-01, Crime severity index and weighted clearance rates, Canada, provinces, territories and Census Metropolitan Areas.
- From 2015 to 2019, the Crime Severity IndexFootnote * (CSI) increased steadily. Violent CSIFootnote ** rose from 75.3 to 90.2, non-violent CSIFootnote *** from 68.4 to 75.8, and the overall CSI from 70.4 to 79.7.
- Between 2019 and 2023, violent CSIFootnote ** increased from 90.2 to 100.9, while non-violent CSIFootnote *** decreased from 75.8 to 74.0. The overall CSI remained relatively stable, slightly increasing from 79.7 in 2019 to 81.2 in 2023. Fluctuations observed between 2019 and 2022 may be due to the imposition and cessation of the COVID-19 pandemic lockdown restrictions.
- Over the past year (from 2023 to 2024), the violentFootnote **, non-violentFootnote ***, and overall CSI decreased slightly.
| Year | Violent CSIFootnote ** | Non-violent CSIFootnote *** | Total CSIFootnote * |
|---|---|---|---|
| 2015 | 75.3 | 68.4 | 70.4 |
| 2016 | 76.9 | 70.1 | 72.0 |
| 2017 | 81.3 | 70.7 | 73.6 |
| 2018 | 83.5 | 72.6 | 75.6 |
| 2019 | 90.2 | 75.8 | 79.7 |
| 2020 | 88.0 | 68.7 | 73.9 |
| 2021 | 93.4 | 68.1 | 74.9 |
| 2022 | 99.1 | 71.3 | 78.8 |
| 2023 | 100.9 | 74.0 | 81.2 |
| 2024 | 99.9 | 69.8 | 77.9 |
Source: Statistics Canada. Table 35-10-0026-01, Crime severity index and weighted clearance rates, Canada, provinces, territories and Census Metropolitan Areas.
Police-reported hate crimes: 10-year trend
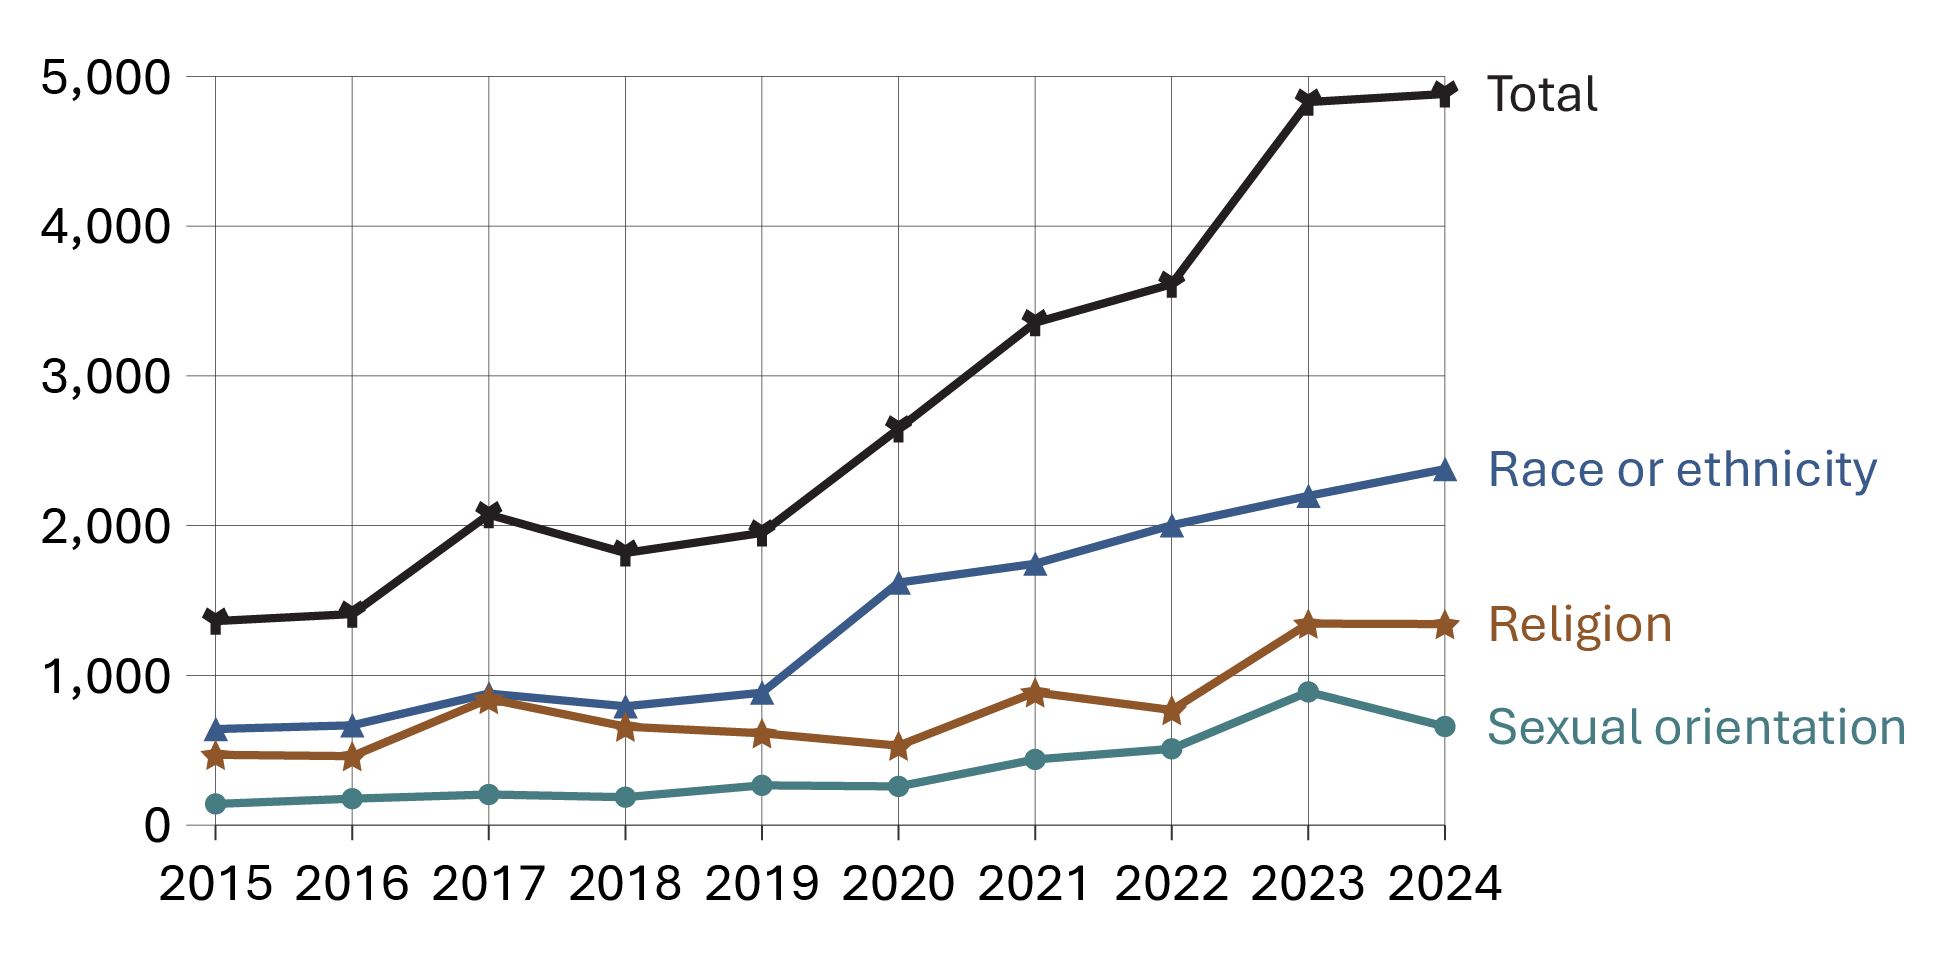
Image description
Line graph showing the number of police-reported hate crimes by motivation type between calendar year 2015 and 2024. The graph includes motivation types: race or ethnicity, religion, sexual orientation, and the total number of police-reported hate crimes. Race or ethnicity is consistently the most common motivation, while sexual orientation remains the least reported throughout the 10-year period. Full data are available in the table below.
Source: Statistics Canada. Table 35-10-0066-01, Police-reported hate crime, by type of motivation, selected regions and Canada (selected police services).
- The total number of police-reported hate crimes has significantly increasedFootnote * in the past 10 years, with an overall increase of 258.4% from 2015 to 2024.
- From 2015 to 2019, the total number of police-reported hate crimes increasedFootnote * by 43.2%. From 2019 to 2024, the number of police-reported hate crimes has more than doubled, representing a 150.2% increase (from 1,951 in 2019 to 4,882 in 2024).
- Categorized by motivation, the greatest type of hate crime to increase between 2019 and 2024 were hate crimes targeting race or ethnicity (+1,493 incidents), followed by religion (+729 incidents), and sexual orientation (+393 incidents).
| Year | Race or ethnicity | Religion | Sexual orientation | Total |
|---|---|---|---|---|
| 2015 | 641 | 469 | 141 | 1,362 |
| 2016 | 666 | 460 | 176 | 1,409 |
| 2017 | 878 | 842 | 204 | 2,073 |
| 2018 | 793 | 657 | 186 | 1,817 |
| 2019 | 884 | 613 | 265 | 1,951 |
| 2020 | 1,619 | 530 | 258 | 2,646 |
| 2021 | 1,745 | 886 | 438 | 3,355 |
| 2022 | 2,002 | 768 | 509 | 3,612 |
| 2023 | 2,198 | 1,345 | 889 | 4,828 |
| 2024 | 2,377 | 1,342 | 658 | 4,882 |
Source: Statistics Canada. Table 35-10-0066-01, Police-reported hate crime, by type of motivation, selected regions and Canada (selected police services).
Table A4 Notes
Higher rates of police-reported hate crimes may reflect changes in the recognition, reporting, and investigation of these incidents by police and community members. An October 2020 publication by The Ontario Association of Chiefs of Police stated that there have been increased efforts (e.g., training) on the part of police services across Canada to facilitate the reporting of hate motivated crimes.
Total includes all motivation types for which data is collected. The three motivation types displayed in the table represent the greatest three categories reported by Statistics Canada.
Police-reported homicide: 10-year trend
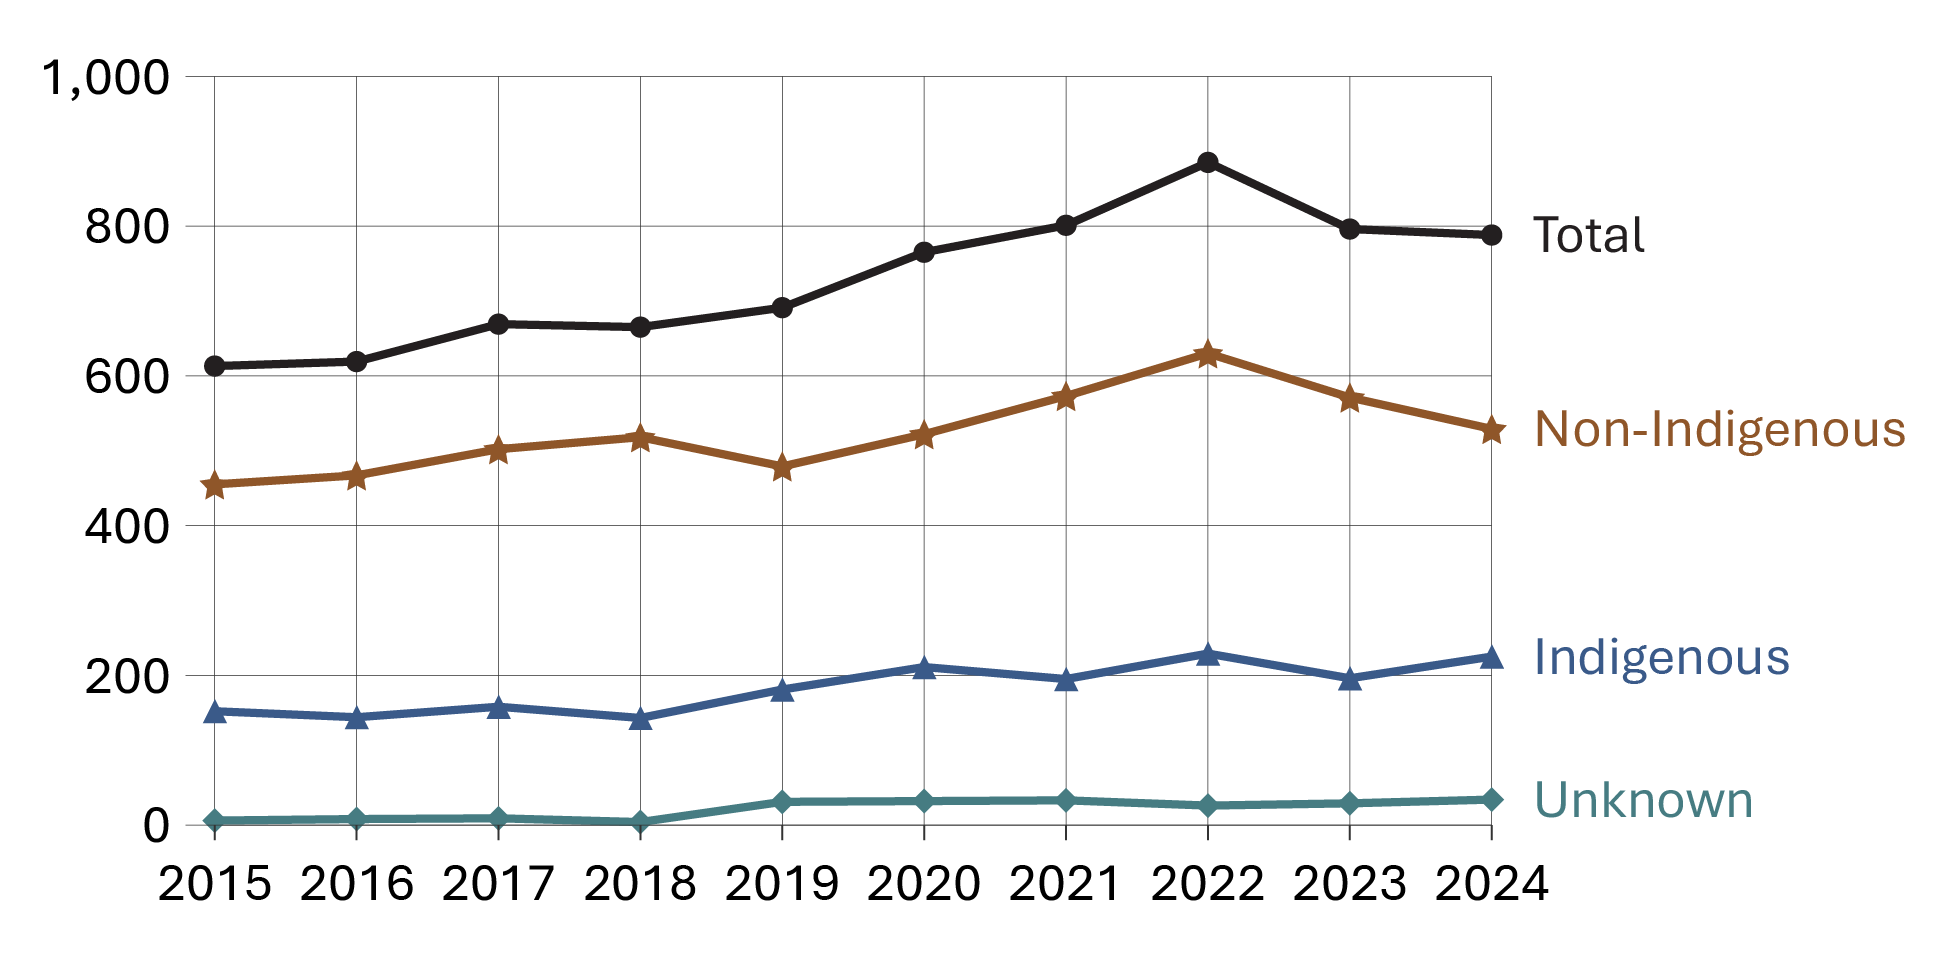
Image description
Line graph showing the number of police-reported homicide victims by Indigenous identity between calendar year 2015 and 2024. The identities represented are Indigenous, non-Indigenous, unknown, and the overall total. The greatest number of police-reported homicide victims were reported among non-Indigenous populations, followed by Indigenous and unknown population groups. Full data are available in the table below.
Source: Statistics Canada. Table 35-10-0060-01, Number of homicide victims and persons accused of homicide, by Indigenous identity, age group and gender.
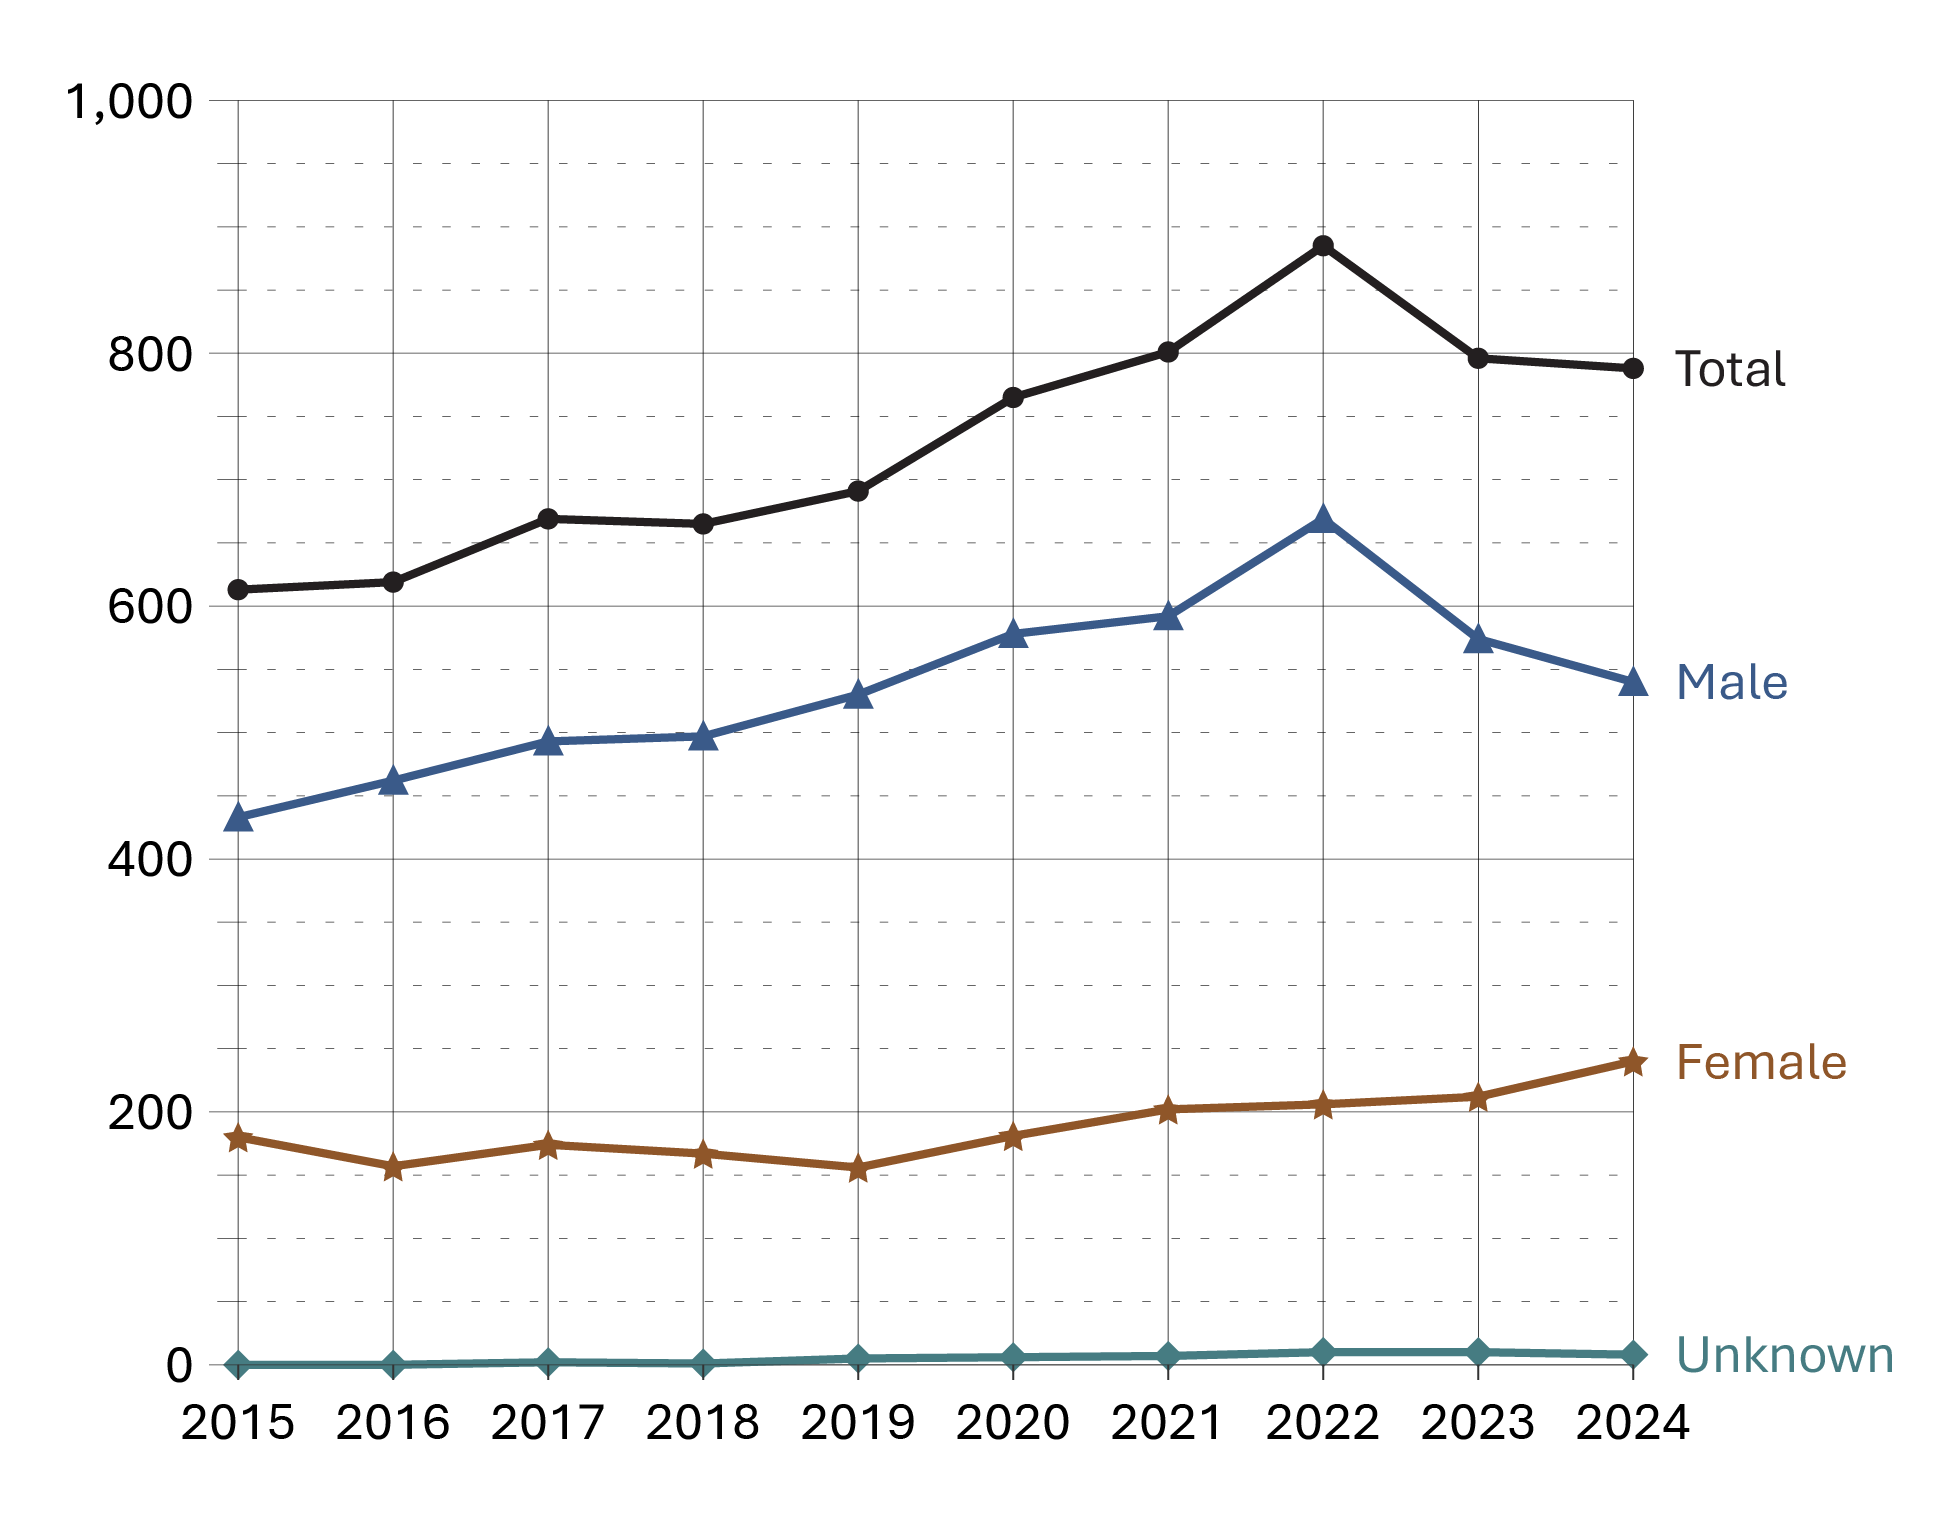
Image description
Line graph showing the number of police-reported homicide victims by sex between calendar year 2015 to 2024. The sex categories shown are total, male, female, and unknown. The greatest number of police-reported homicide victims were reported among males, followed by females and victims of unknown sex. Full data are available in the table below.
Source: Statistics Canada. Table 35-10-0060-01, Number of homicide victims and persons accused of homicide, by Indigenous identity, age group and gender.
- The total number of police-reported homicide victims in Canada has increased by 28.5% over the past 10 years (from 613 in 2015 to 788 in 2024). There was a 15.7% increase from 2020 to 2022 (from 765 in 2020 to 885 in 2022), followed by an 11.0% decrease between 2022 and 2024 (from 885 in 2022 to 788 in 2024).
- The total number of police-reported homicide victims remained stable (-1.0%) from 2023 to 2024.
- Indigenous homicide victims increased by 48.0% from 2015 to 2024 (from 152 to 225), whereas non-Indigenous homicide victims increased by 16.3% (from 455 to 529) in the same time period.
- The number of female homicide victims increased by 33.3% over the past 10 years (from 180 in 2015 to 240 in 2024), with a 13.2% increase between 2023 and 2024. Similarly, male victims increased 24.7% over the past 10 years (from 433 in 2015 to 540 in 2024), though there was a 5.9% decline from 2023 to 2024.
| Year | Indigenous | Non-Indigenous | Unknown | Total |
|---|---|---|---|---|
| 2015 | 152 | 455 | 6 | 613 |
| 2016 | 144 | 467 | 8 | 619 |
| 2017 | 158 | 502 | 9 | 669 |
| 2018 | 143 | 518 | 4 | 665 |
| 2019 | 181 | 479 | 31 | 691 |
| 2020 | 211 | 522 | 32 | 765 |
| 2021 | 195 | 573 | 33 | 801 |
| 2022 | 229 | 630 | 26 | 885 |
| 2023 | 196 | 571 | 29 | 796 |
| 2024 | 225 | 529 | 34 | 788 |
Source: Statistics Canada. Table 35-10-0060-01, Number of homicide victims and persons accused of homicide, by Indigenous identity, age group and gender.
| Year | Female | Male | Unknown | Total |
|---|---|---|---|---|
| 2015 | 180 | 433 | 0 | 613 |
| 2016 | 157 | 462 | 0 | 619 |
| 2017 | 174 | 493 | 2 | 669 |
| 2018 | 167 | 497 | 1 | 665 |
| 2019 | 156 | 530 | 5 | 691 |
| 2020 | 181 | 578 | 6 | 765 |
| 2021 | 202 | 592 | 7 | 801 |
| 2022 | 206 | 669 | 10 | 885 |
| 2023 | 212 | 574 | 10 | 796 |
| 2024 | 240 | 540 | 8 | 788 |
Source: Statistics Canada. Table 35-10-0060-01, Number of homicide victims and persons accused of homicide, by Indigenous identity, age group and gender.
Table A5 Notes
The Homicide Survey represents a complete count of the number of homicides known and reported by police services in Canada. Homicides are scored according to the year that they are reported by police to the Homicide Survey. In most cases the year in which the homicide occurred is the same as the reporting year; however, because some homicides become known to police long after they occur, there are typically some homicides included in a given year's total that actually occurred in previous years.
Source: Statistics Canada (2025). Data accuracy, Homicide Survey.
Self-reported victimization rate
Figure A6. Victims of self-reported crime by type (2019). Rate per 100,000
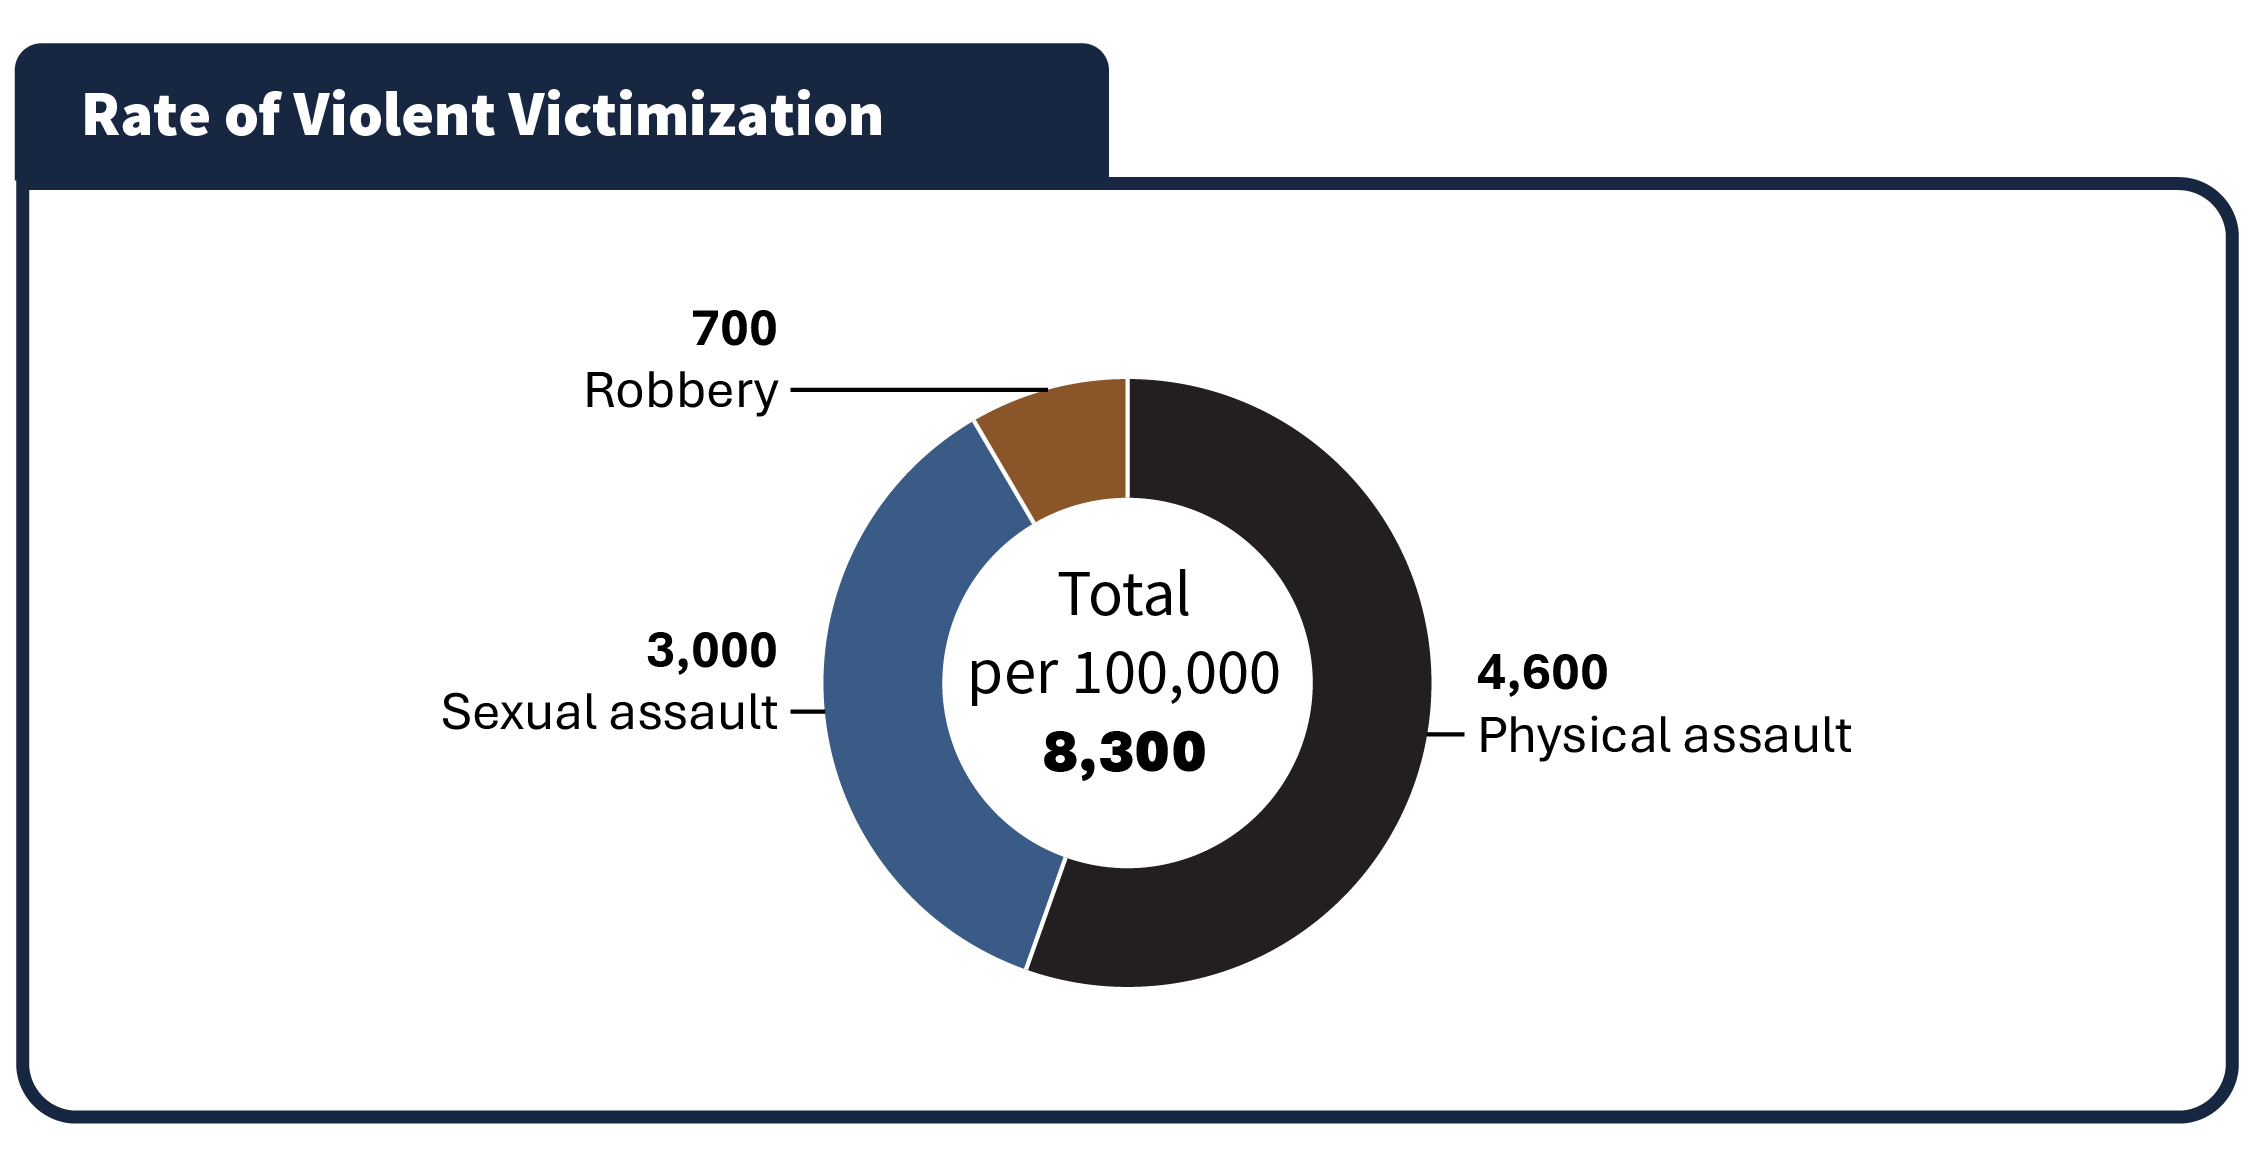
Image description
Donut chart showing the self-reported violent victimization rate, per 100,000 population, in calendar year 2019. This donut chart includes physical assault, sexual assault, and robbery. Physical assault accounts for the largest proportion of violent victimization, followed by a smaller proportion for sexual assault and an even smaller proportion for robbery. Full data are available in the table below.
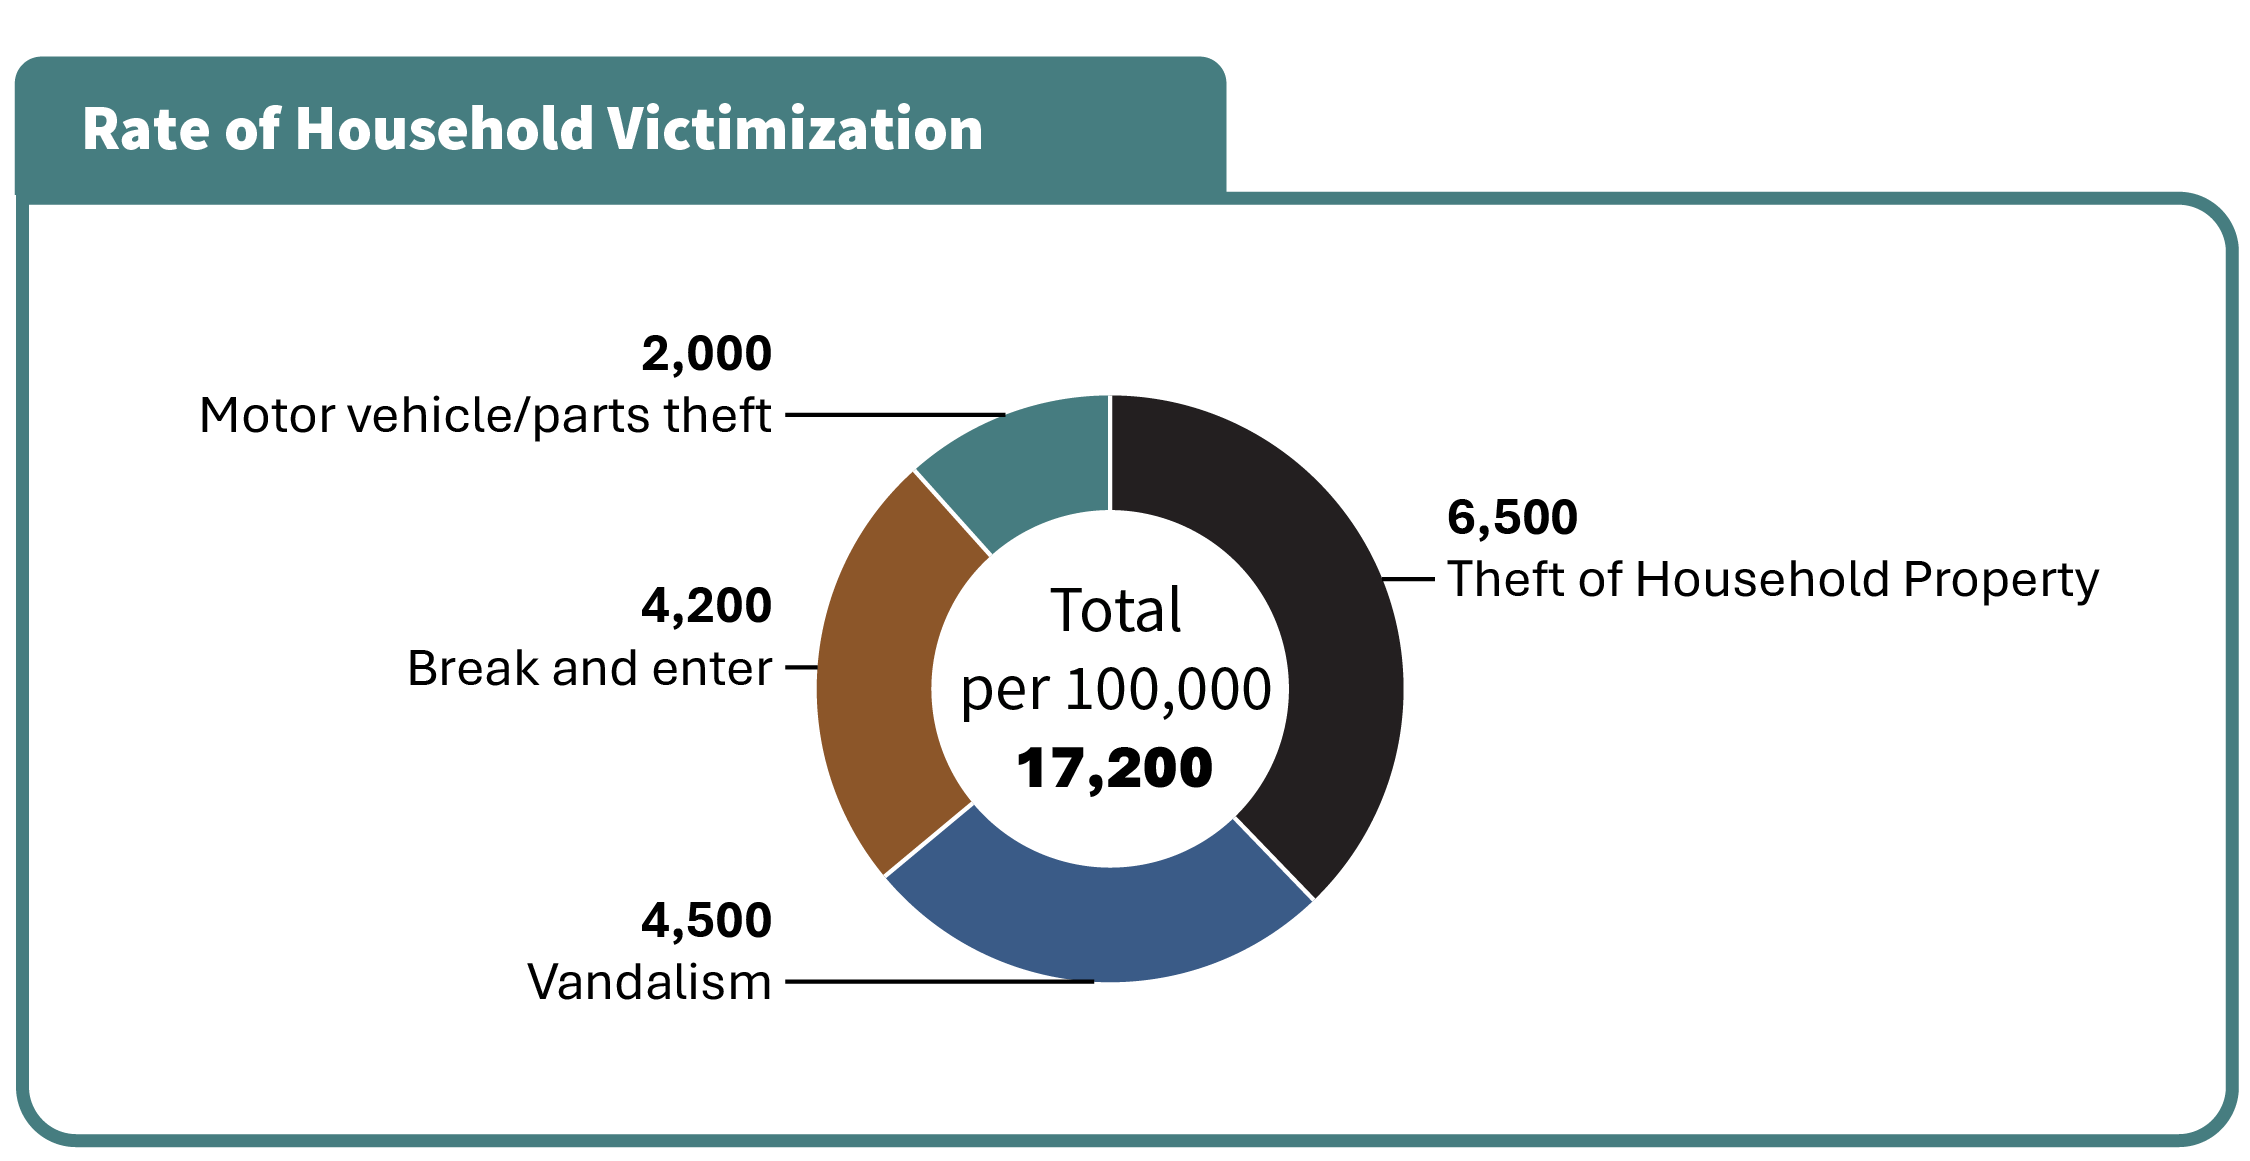
Image description
Donut chart showing the self-reported household victimization rate, per 100,000 population, in calendar year 2019. This donut chart includes theft of household property, vandalism, break and enter, and motor vehicle/parts theft. Theft of household property accounts for the largest proportion of household victimization, followed by vandalism and break and enter. Motor vehicle or parts theft represents the smallest proportion. Full data are available in the table below.
Source: Statistics Canada. General Social Survey (GSS).
- Assault was the third most common self-reported crime and the most common form of violent victimization.
- In 2019, theft of personal property was the most common self-reported form of victimization followed by theft of household property.
| Type of violent victimization | Rate |
|---|---|
| Theft of personal property | 9,800 |
| Household victimization total | 17,200 |
Theft of household property |
6,500 |
Vandalism |
4,500 |
Break and enter |
4,200 |
Motor vehicle/parts theft |
2,000 |
| Violent victimization total | 8,300 |
Physical assault |
4,600 |
Sexual assault |
3,000 |
Robbery |
700 |
Source: Statistics Canada. General Social Survey (GSS).
Table A6 Notes
General Social Survey (GSS) Canadians' Safety data are reported per 1,000 population, which are converted to per 100,000 in the CCRSO for ease of comparison with police-reported rates.
Police-reported rates are based on crimes that are reported to the police. Since not all crimes are reported to the police, these figures underestimate actual crime statistics. GSS data is complementary to police-reported crime data, as many individuals who are victimized do not report their victimization to police; therefore, GSS data contributes to a more holistic representation of actual crime statistics.
Total household victimization includes the following categories contained in the General Social Survey: motor vehicle/parts theft, break and enter, vandalism, theft of household property.
Total violent victimization includes the following categories contained in the General Social Survey: physical assault, sexual assault, and robbery.
The GSS Canadians' Safety is conducted every 5 years, and the most recent data available are from 2019. A new cycle of GSS Victimization data was in collection at the time of report preparation and will be included in a future CCRSO report once publicly available. The GSS excludes those under age 15.
Self-reported violent victimization rate by type, gender, and age
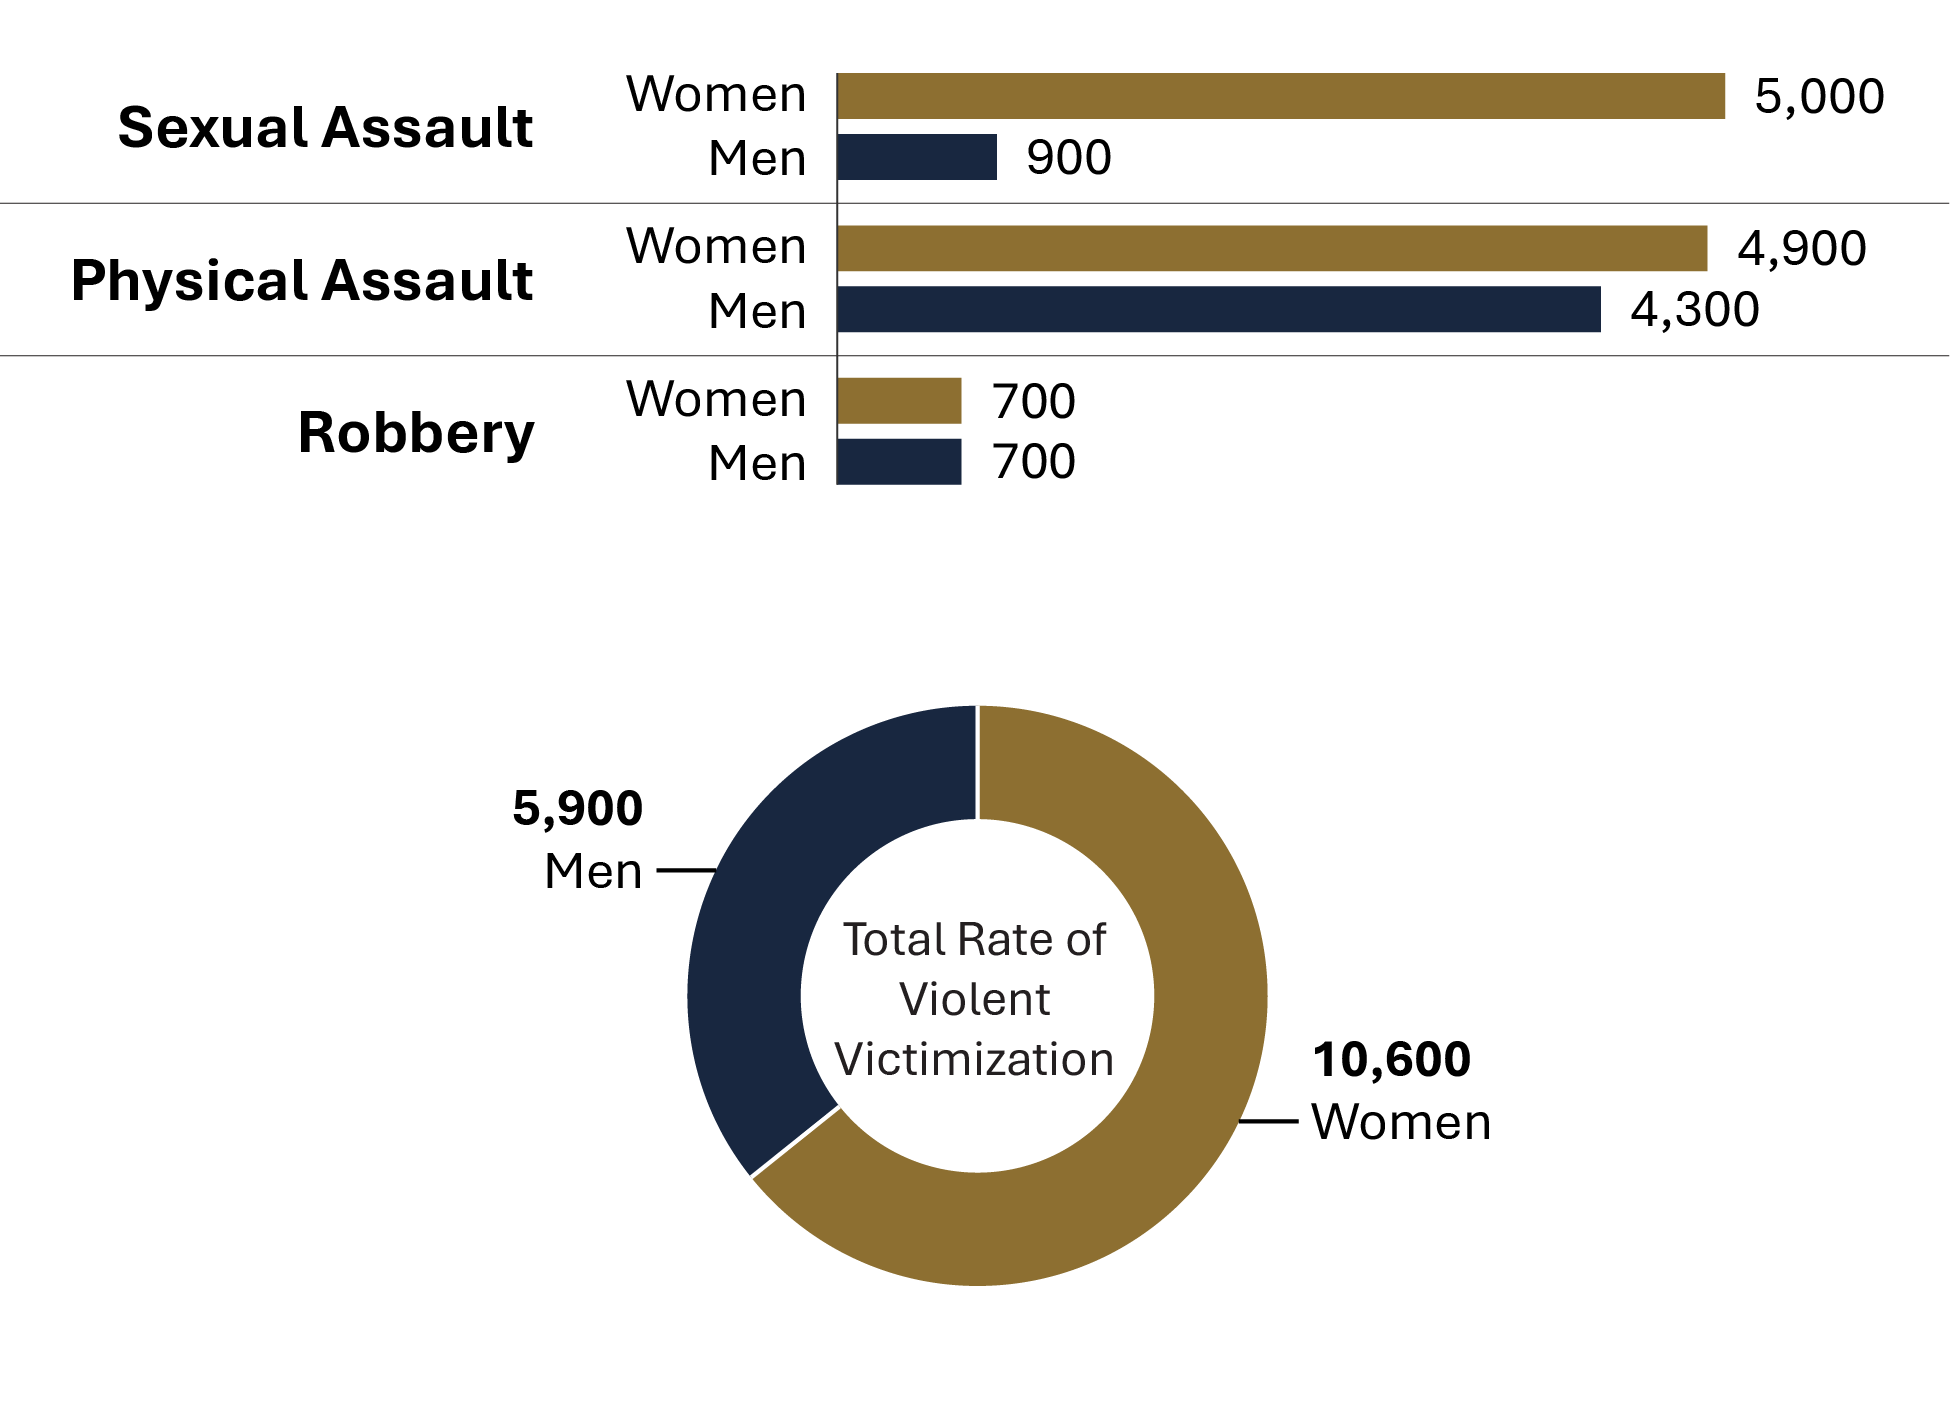
Image description
Two graphs showing the rate of self-reported violent victimizations, per 100,000 population, by crime type and gender in calendar year 2019. A bar graph shows the rates of sexual assault, physical assault, and robbery among women and men. A donut chart shows the total rate of violent victimization among women and men. Women are victims of sexual and physical assault more often than men, although rates of physical assault are more similar amongst men and women. Victimization of robbery is equal for men and women. Full data are available in the table below.
Source: Statistics Canada. General Social Survey (GSS).
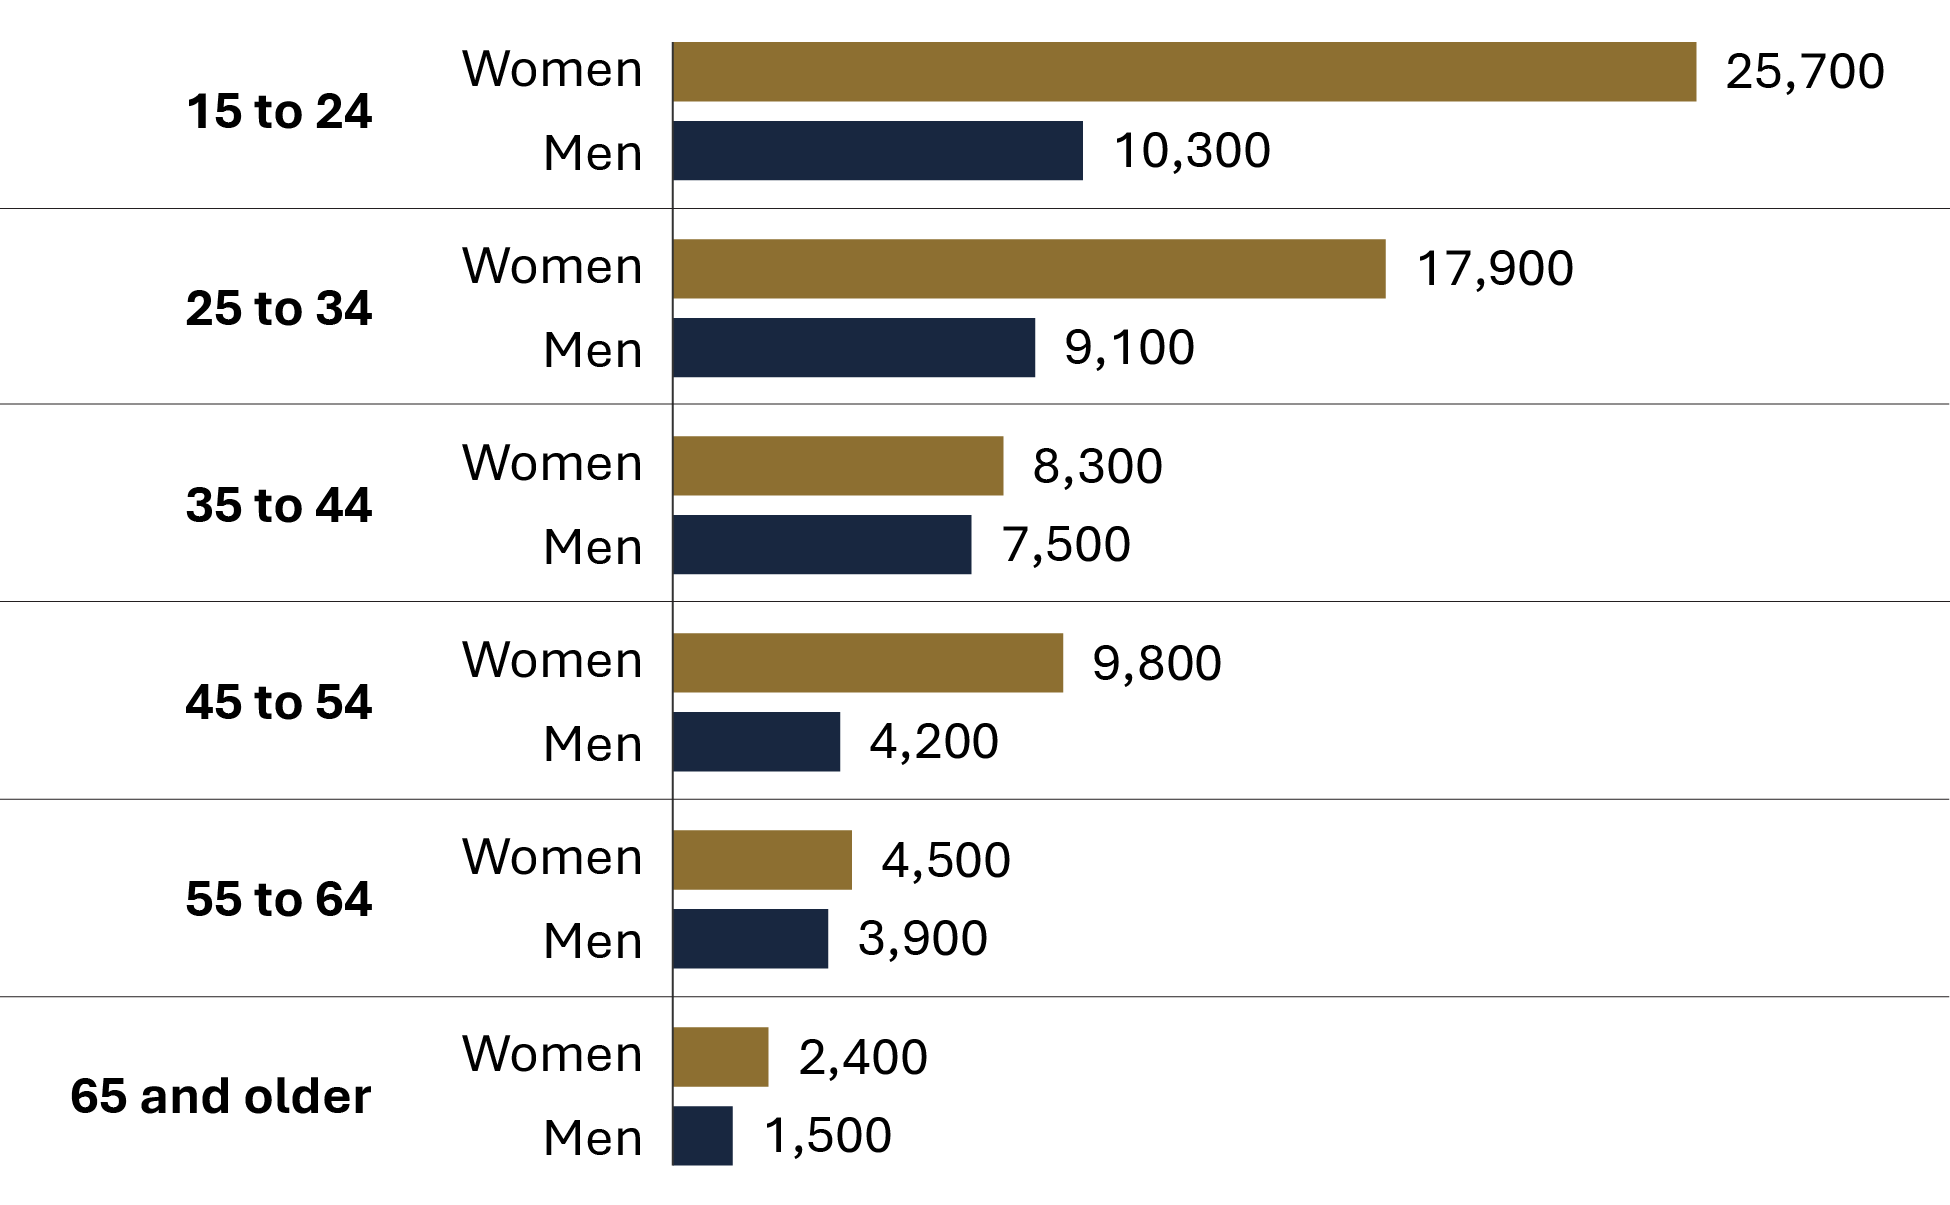
Image description
Bar graph showing the self-reported violent victimization rate by age and gender, per 100,000 population, in calendar year 2019. The age groups included in the graph are ages 15 to 24; ages 25 to 34; ages 35 to 44; ages 45 to 54; ages 55 to 64; and ages 65 and older. The age group 15 to 24 has the highest rate, while the 65 and older age groups has the lowest rate. Across all age groups, women self-reported greater rates of violent victimization compared to men. Gender differences in self-reported rates were greatest in age group 15 to 24, followed by 25 to 34, and 45 to 54. Full data are available in the table below.
Source: Statistics Canada. General Social Survey (GSS).
- Women were more likely to experience violent victimization than men. When broken down by types of crime, the gender difference is largely due to the substantially higher number of women who self-report sexual assault.
- The gender difference in self-reported crime was greatest at ages 15 to 24 (with a difference of 15,400 per 100,000), followed by ages 25 to 34 (with a difference of 8,800 per 100,000).
| Type of violent victimization | Women | Men |
|---|---|---|
| Sexual assault | 5,000 | 900 |
| Robbery | 700 | 700 |
| Physical assault | 4,900 | 4,300 |
| Total violent victimization | 10,600 | 5,900 |
| Age group | Women | Men |
|---|---|---|
| 15 to 24 | 25,700 | 10,300 |
| 25 to 34 | 17,900 | 9,100 |
| 35 to 44 | 8,300 | 7,500 |
| 45 to 54 | 9,800 | 4,200 |
| 55 to 64 | 4,500 | 3,900 |
| 65 and older | 2,400 | 1,500 |
Source: Statistics Canada. General Social Survey (GSS).
Table A7 Notes
General Social Survey (GSS) Canadians' Safety data are reported per 1,000 population, which are converted to per 100,000 in the CCRSO for ease of comparison with police-reported rates.
Police-reported rates are based on crimes that are reported to the police. Since not all crimes are reported to the police, these figures underestimate actual crime statistics. GSS data is complementary to police-reported crime data, as many individuals who are victimized do not report their victimization to police; therefore, GSS data contributes to a more holistic representation of actual crime statistics.
Total household victimization includes the following categories contained in the General Social Survey: motor vehicle/parts theft, break and enter, vandalism, theft of household property.
Total violent victimization includes the following categories contained in the General Social Survey: physical assault, sexual assault, and robbery.
The GSS Canadians' Safety is conducted every 5 years, and the most recent data available are from 2019. A new cycle of GSS Victimization data was in collection at the time of report preparation and will be included in a future CCRSO report once publicly available. The GSS excludes those under age 15.
Self-reported victimization reported to police
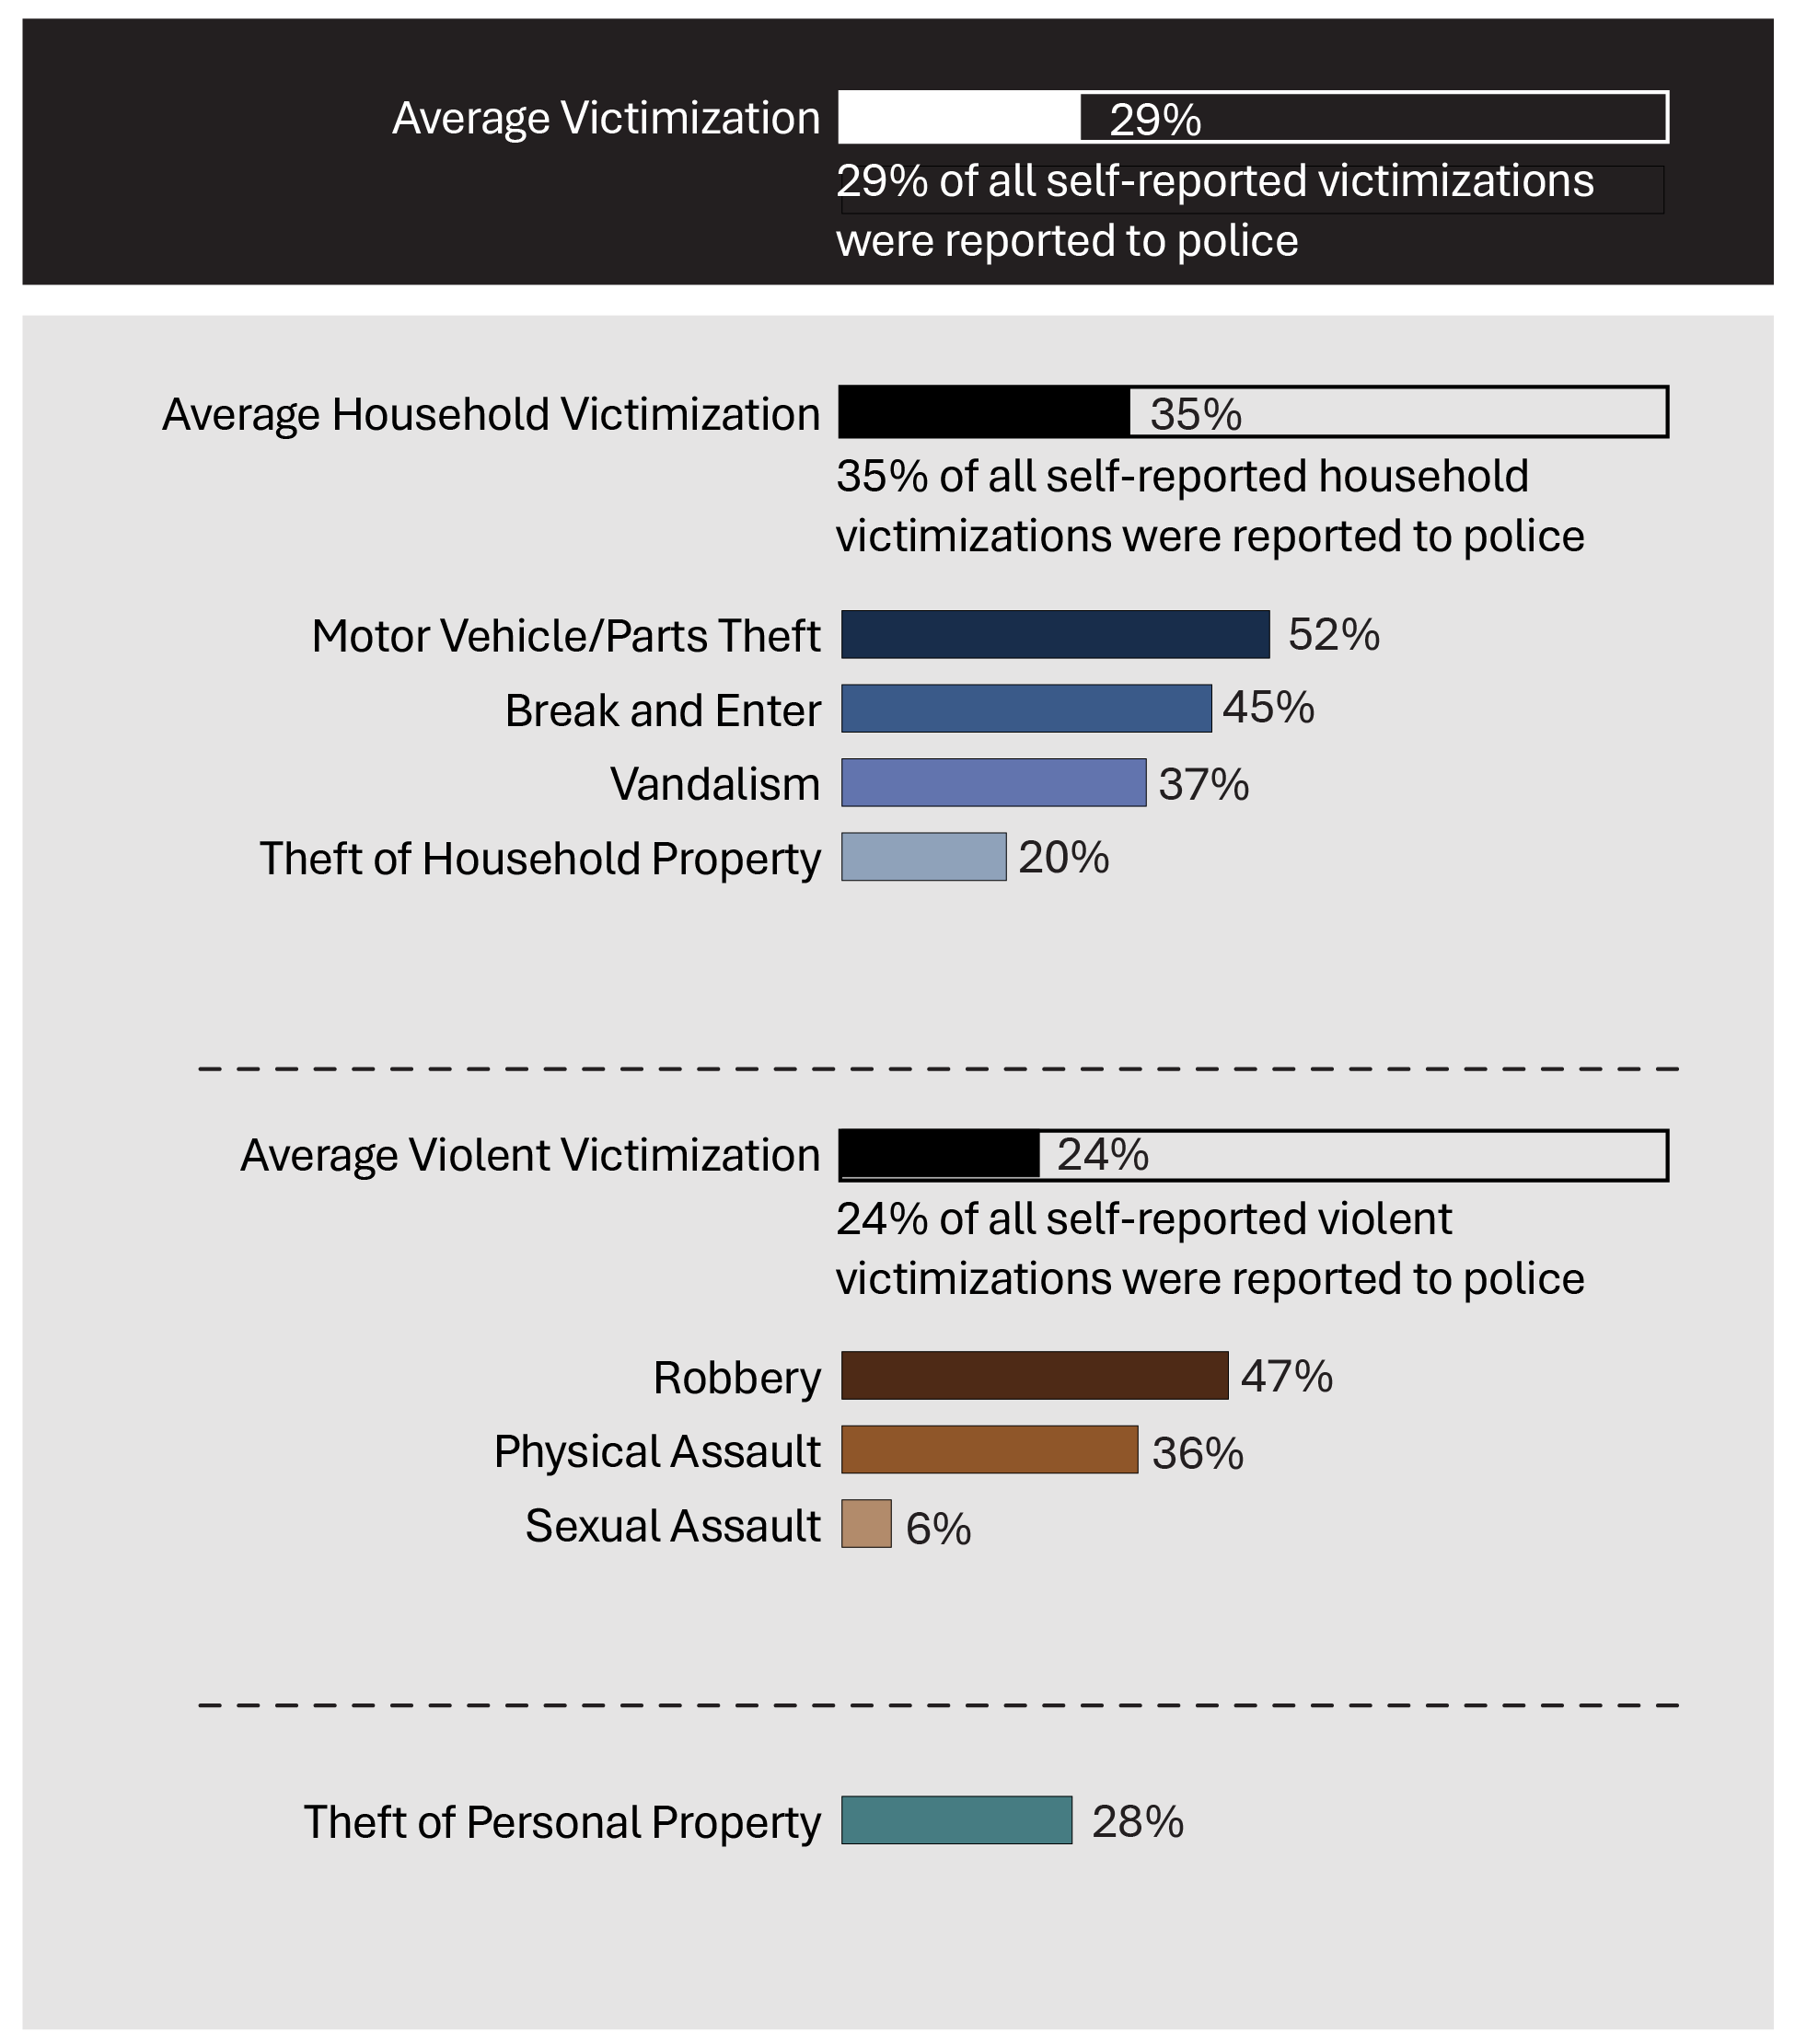
Image description
Bar illustration showing the percentage of self-reported victimization reported to police in calendar year 2019. The graph details the percentage of average overall victimization; the percentage of average household victimization, which includes motor vehicle/parts theft, break and enter, vandalism, and theft of household property; the percentage of average violent victimization, which includes robbery, physical assault, and sexual assault; and the percentage of theft of personal property. Overall, less than a third of all self-reported victimizations were reported to police. Full data are available in the table below.
Source: Statistics Canada. General Social Survey (GSS).
Note: The percentages for each crime category indicate the proportion of that specific type of crime reported to the police, compared to the overall incidence of that type of crime reported under the GSS. For example, out of 100% of the self-reported thefts of personal property, only 28% were reported to police.
- Among all self-reported victims of motor vehicle/parts theft in 2019, 52% of these crimes were reported to police. This was the most frequently self-reported crime type that was reported police. Among all self-reported victims of sexual assault, only 6% were reported to police. This was the least frequently self-reported crime type that was reported to police.
- On average, self-reported household victimization crimes were more commonly reported to police than self-reported violent victimization crimes.
| Type of victimization | Percent reported to police |
|---|---|
| Theft of personal property | 28 |
| Household victimization average | 35 |
Motor vehicle/parts theft |
52 |
Break and enter |
45 |
Vandalism |
37 |
Theft of household property |
20 |
| Violent victimization average | 24 |
Robbery |
47 |
Physical assault |
36 |
Sexual assault |
6 |
| Average overall victimization | 29 |
Source: Statistics Canada. General Social Survey (GSS).
Table A8 Notes
General Social Survey (GSS) Canadians' Safety data are reported per 1,000 population, which are converted to per 100,000 in the CCRSO for ease of comparison with police-reported rates.
Police-reported rates are based on crimes that are reported to the police. Since not all crimes are reported to the police, these figures underestimate actual crime statistics. GSS data is complementary to police-reported crime data, as many individuals who are victimized do not report their victimization to police; therefore, GSS data contributes to a more holistic representation of actual crime statistics.
Total household victimization includes the following categories contained in the General Social Survey: motor vehicle/parts theft, break and enter, vandalism, theft of household property.
Total violent victimization includes the following categories contained in the General Social Survey: physical assault, sexual assault, and robbery.
Theft of personal property is not captured under household victimization or violent victimization; it is therefore presented separately. Theft of personal property is included in the total average victimization.
The GSS Canadians' Safety is conducted every 5 years, and the most recent data available are from 2019. A new cycle of GSS Victimization data was in collection at the time of report preparation and will be included in a future CCRSO report once publicly available. The GSS excludes those under age 15.
The rate of adults charged
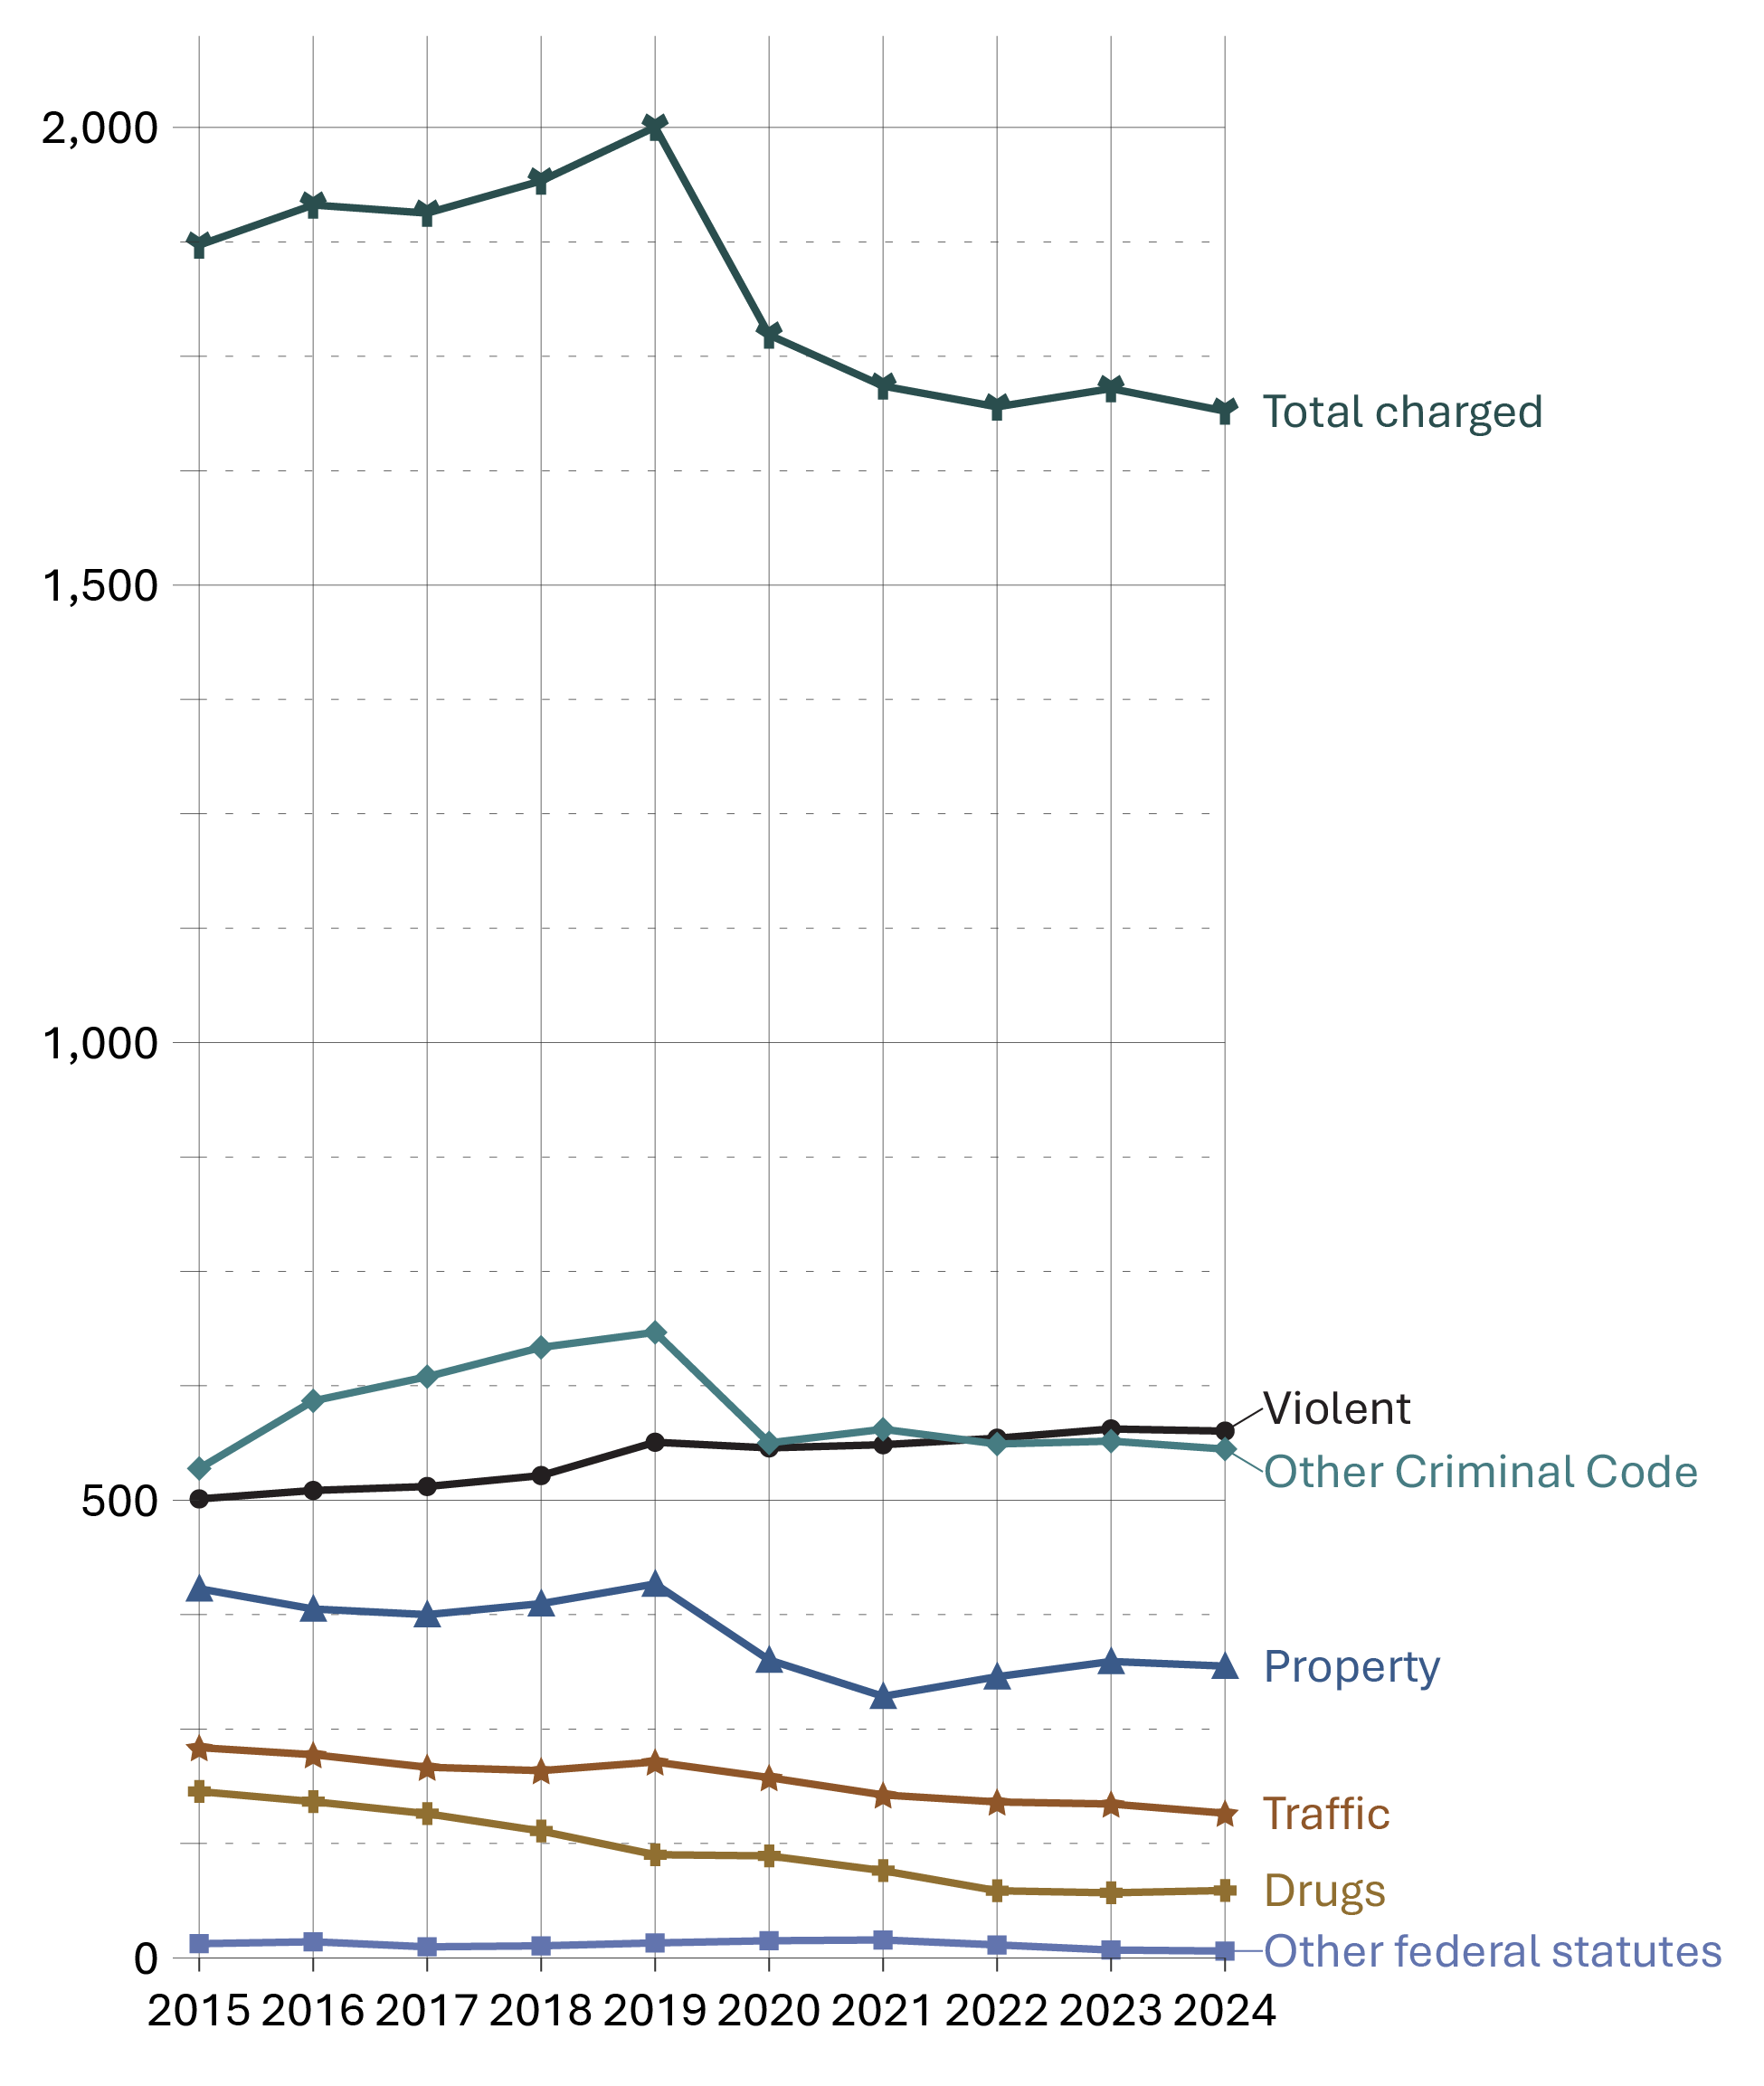
Image description
Line graph showing the rate of adults charged with a Criminal Code offence, per 100,000 population, between calendar year 2015 and 2024. The graph includes the rate of total charges, violent offences, other Criminal Code offences, property crimes, traffic violations, drug offences, and other federal statutes. Violent offences and other Criminal Code offences had the greatest rates, followed by property, traffic, and drug offences. Full data are available in the table below.
Source: Statistics Canada. Table 35-10-0177-01, Incident-based crime statistics, by detailed violations, Canada, provinces, territories, Census Metropolitan Areas and Canadian Forces Military Police.
- The overall rate of adults charged in 2024 was 9.7% lower than the rate recorded in 2015. From 2015 to 2019 there was a 6.8% increase, followed by a 14.2% decrease from 2019 to 2023.
- Notably, the overall rate of adults charged was 24.4% lower in 2024 (1,690) than it was at the inception of the survey in 1998 (2,236).
- The rate of adults charged with violent crimes slightly increased from 2020 to 2024 (+3.3%). The 2024 rate is 14.8% higher than in 2015.
- The rate of adults charged with drug offences has consistently decreased, with a total decrease of 59.5% over the 10-year period from 2015 and 2024.
| Year | Violent | Property | Traffic | Other CC | Drugs | Other federal statutes | Total charged |
|---|---|---|---|---|---|---|---|
| 1998 | 563 | 677 | 374 | 430 | 168 | 12 | 2,236 |
| 1999 | 590 | 632 | 371 | 396 | 185 | 18 | 2,203 |
| 2000 | 615 | 591 | 349 | 411 | 198 | 16 | 2,190 |
| 2001 | 641 | 584 | 349 | 451 | 202 | 18 | 2,256 |
| 2002 | 617 | 569 | 336 | 460 | 199 | 18 | 2,211 |
| 2003 | 598 | 573 | 326 | 476 | 172 | 15 | 2,168 |
| 2004 | 584 | 573 | 314 | 490 | 187 | 22 | 2,180 |
| 2005 | 589 | 550 | 299 | 479 | 185 | 22 | 2,131 |
| 2006 | 594 | 533 | 300 | 498 | 198 | 20 | 2,150 |
| 2007 | 577 | 499 | 298 | 521 | 208 | 20 | 2,132 |
| 2008 | 576 | 487 | 307 | 540 | 207 | 22 | 2,149 |
| 2009 | 585 | 490 | 311 | 532 | 201 | 20 | 2,152 |
| 2010 | 576 | 473 | 295 | 545 | 211 | 22 | 2,132 |
| 2011 | 548 | 441 | 271 | 527 | 213 | 23 | 2,034 |
| 2012 | 541 | 434 | 269 | 536 | 203 | 25 | 2,020 |
| 2013 | 505 | 417 | 242 | 519 | 200 | 18 | 1,910 |
| 2014 | 489 | 399 | 233 | 520 | 191 | 13 | 1,849 |
| 2015 | 501 | 403 | 230 | 535 | 182 | 15 | 1,872 |
| 2016 | 511 | 381 | 222 | 609 | 171 | 18 | 1,915 |
| 2017 | 515 | 375 | 208 | 635 | 157 | 12 | 1,906 |
| 2018 | 527 | 387 | 205 | 667 | 138 | 13 | 1,942 |
| 2019 | 563 | 409 | 214 | 683 | 113 | 16 | 2,000 |
| 2020 | 557 | 325 | 197 | 563 | 111 | 19 | 1,773 |
| 2021 | 561 | 286 | 178 | 578 | 95 | 20 | 1,717 |
| 2022 | 568 | 307 | 170 | 561 | 73 | 14 | 1,695 |
| 2023 | 578 | 324 | 168 | 565 | 71 | 9 | 1,715 |
| 2024 | 576 | 319 | 158 | 556 | 74 | 7 | 1,690 |
Source: Statistics Canada. Table 35-10-0177-01, Incident-based crime statistics, by detailed violations, Canada, provinces, territories, Census Metropolitan Areas and Canadian Forces Military Police.
Table A9 Notes
Other Criminal Code offences (Other CC) includes administration of justice offences, counterfeit, weapons/firearms violations, possession of, accessing, making or distribution of child pornography and prostitution.
Other federal statute offences refer to offences against Canadian federal statutes, such as Customs Act, Employment Insurance Act, Firearms Act, Food and Drugs Act (FDA), Income Tax Act, Controlled Drugs and Substances Act (CDSA) and Narcotic Control Act (NCA). This offence category excludes Criminal Code of Canada offences.
Violent crimes include homicide, attempted murder, assault, sexual offences, abduction, extortion, robbery, firearms, and other violent offences such as uttering threats and criminal harassment. Property crimes include break and enter, motor vehicle theft, other theft, possession of stolen property, fraud, mischief and arson.
Due to rounding, rates may not add up to totals.
Criminal Code and other Federal Statute charges among adults: 5-year trend
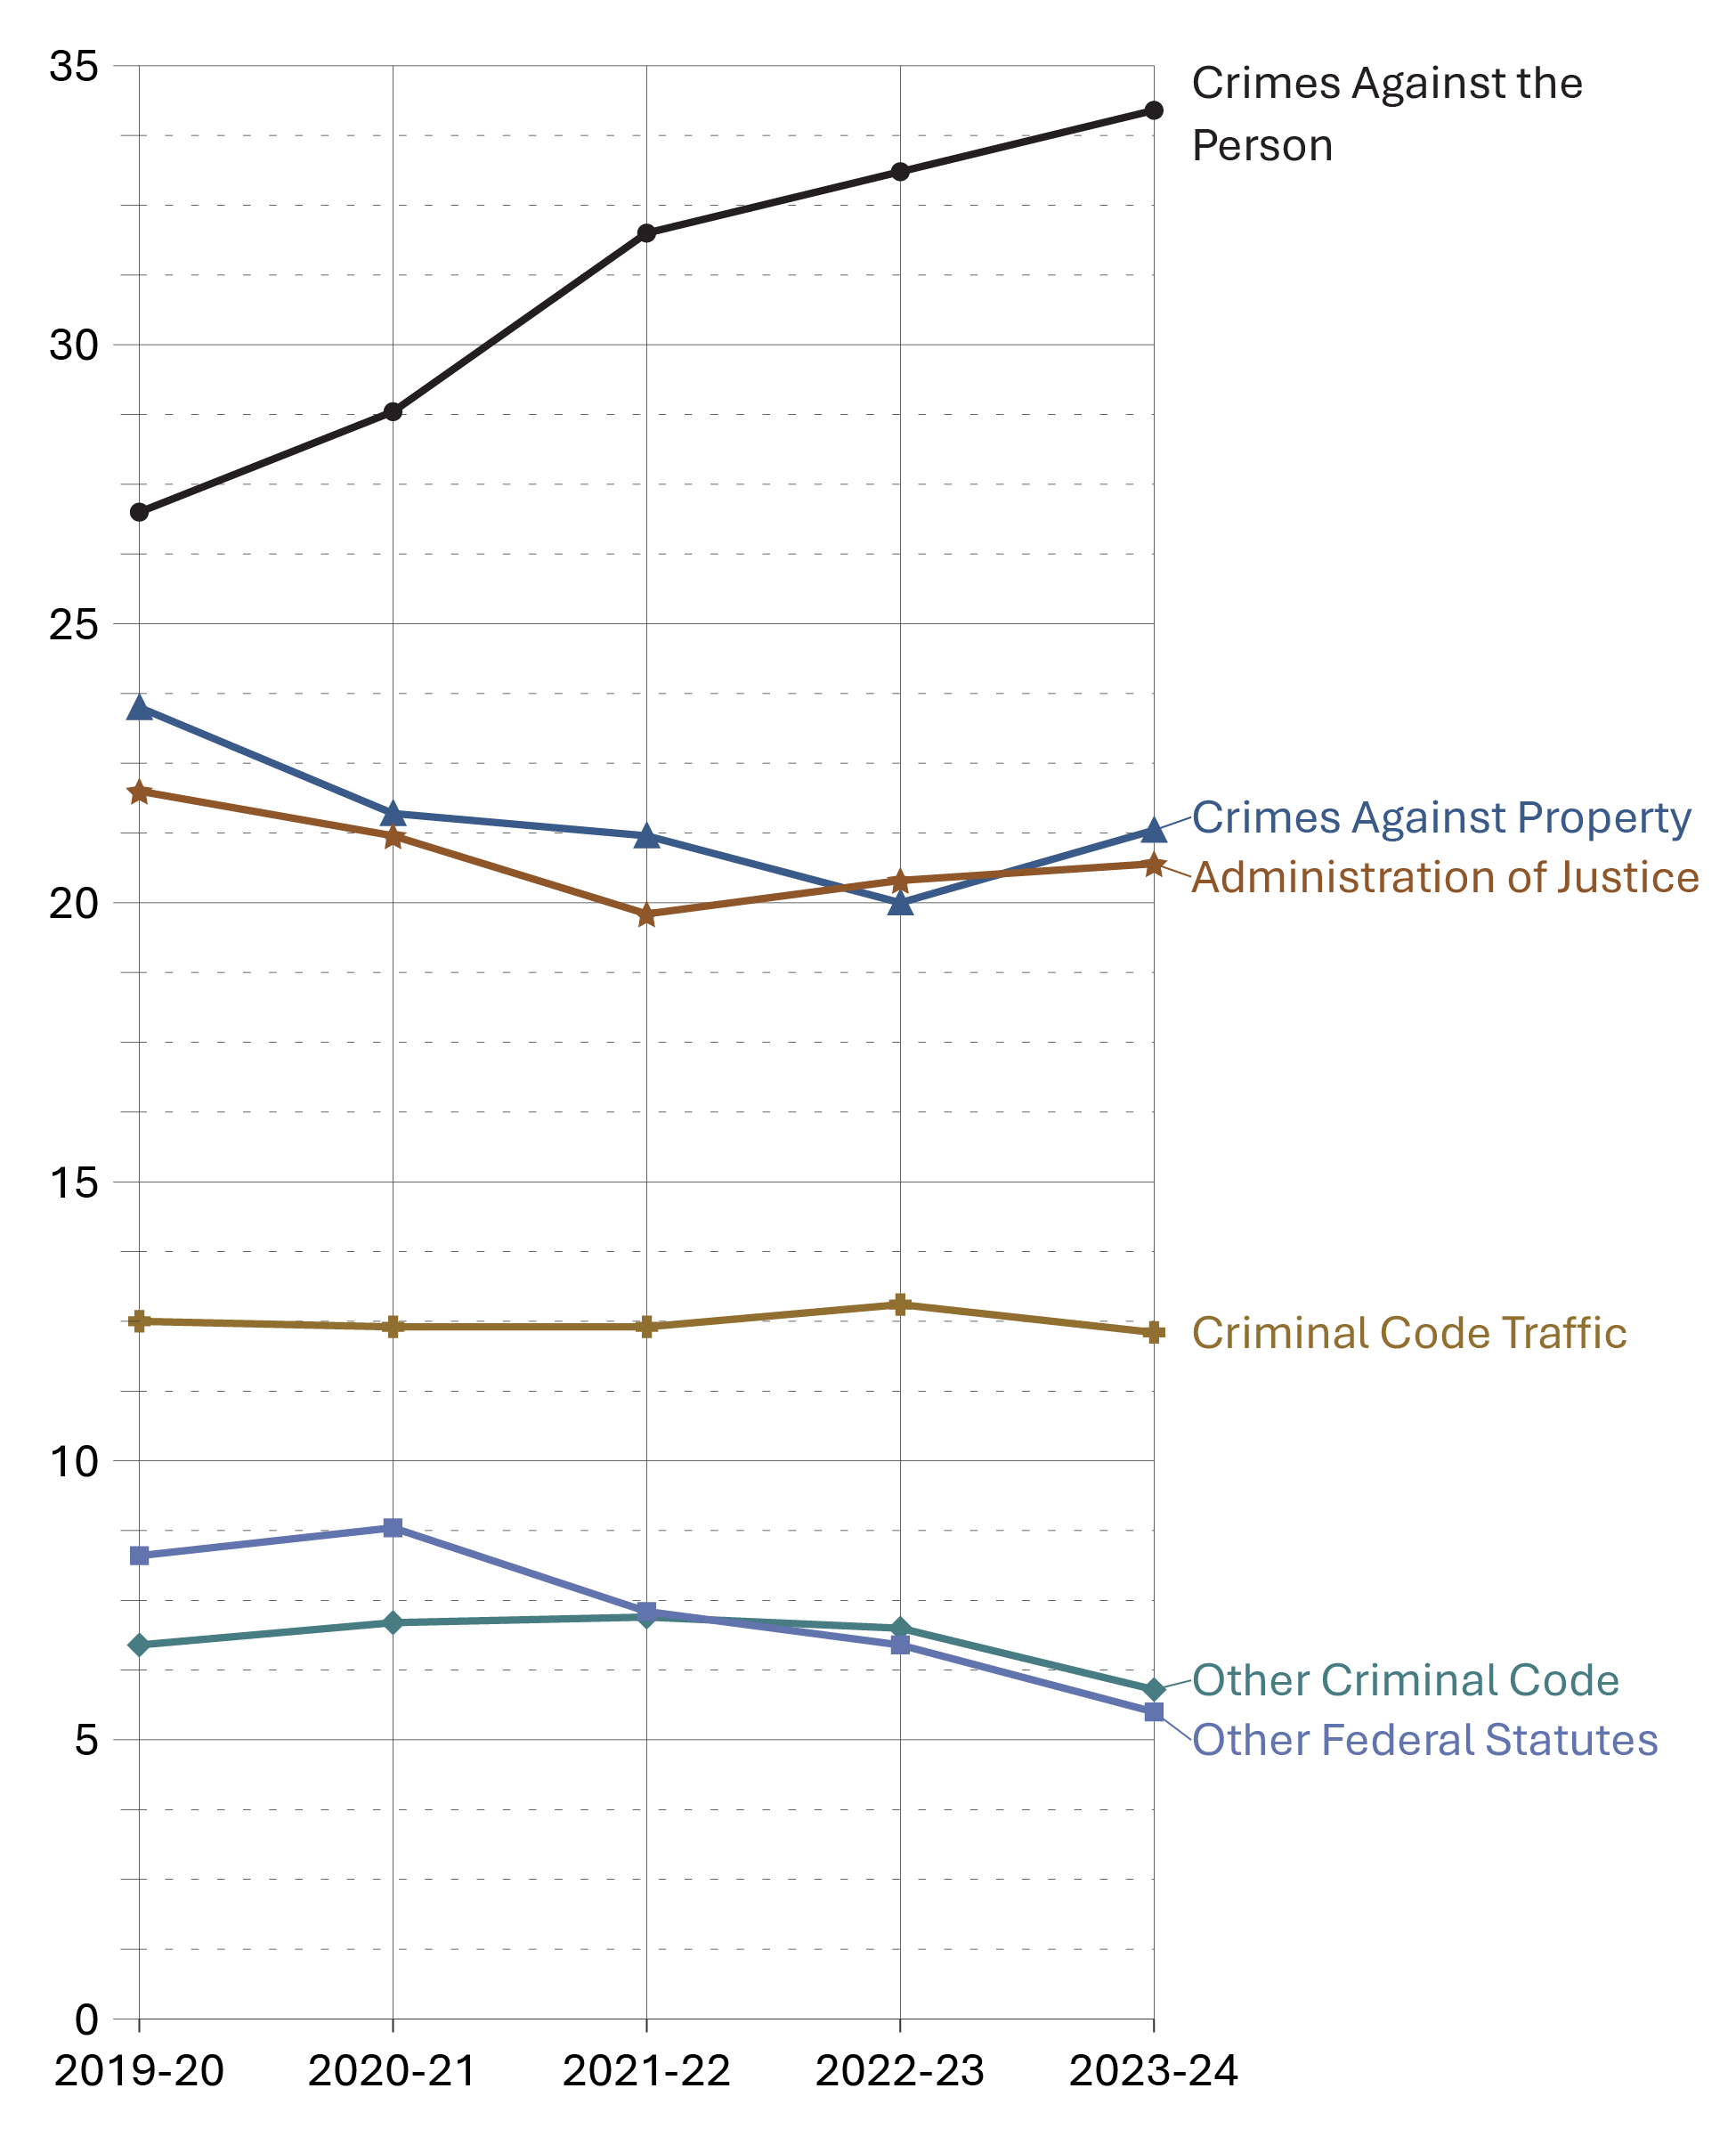
Image description
Line graph showing the percentage of Criminal Code and other federal statute charges by type of charge between fiscal years 2019-20 and 2023-24. The graph includes crimes against the person, crimes against property, administration of justice violations, Criminal Code traffic violations, other Criminal Code offences, and other federal statutes. Crime against the person represents the largest proportion of charges, followed by crimes against property, and administration of justice offences. Full data are available in the table below.
Source: Statistics Canada. Table 35-10-0027-01, Adult criminal courts, number of cases and charges by type of decision.
- From 2019-20 to 2022-24, crimes against the person increased from 27.0% to 34.2% of all charges among adults. In the same time period, the proportions of all other categories either decreased or remained stable.
- The most frequent charges in adult courts in 2023-24 were common assault (Level 1) (12.3%), failure to comply with order (10.2%), major assault (Level 2 and 3) (9.7%), and impaired driving (8.9%). These charges are captured in categories “Crimes against the person”, “Administration of justice”, and “Criminal Code traffic”, respectively.
| Type of charge | 2019-20 | 2020-21 | 2021-22 | 2022-23 | 2023-24 |
|---|---|---|---|---|---|
| Crimes against the person | 85,831 | 68,393 | 70,887 | 72,503 | 78,119 |
Homicide |
330 | 314 | 274 | 334 | 301 |
Attempted murder |
184 | 180 | 169 | 162 | 162 |
Robbery |
3,244 | 2,633 | 2,464 | 2,337 | 2,317 |
Sexual assault |
3,607 | 2,704 | 3,163 | 3,576 | 3,992 |
Other sexual offences |
4,081 | 2,896 | 3,380 | 3,841 | 3,845 |
Major assault (levels 2 & 3) |
20,778 | 17,520 | 18,813 | 20,139 | 22,122 |
Common assault (level 1) |
32,360 | 24,845 | 26,526 | 25,975 | 28,011 |
Uttering threats |
13,782 | 11,152 | 10,331 | 9,848 | 10,663 |
Criminal harassment |
3,702 | 3,067 | 2,727 | 2,865 | 3,110 |
Other crimes against persons |
3,325 | 2,889 | 2,840 | 3,246 | 3,427 |
| Crimes against property | 74,640 | 51,230 | 47,015 | 43,744 | 48,730 |
Theft |
28,278 | 16,564 | 13,342 | 12,191 | 14,809 |
Break and enter |
10,026 | 7,950 | 7,618 | 7,748 | 8,415 |
Fraud |
11,362 | 7,496 | 6,223 | 5,608 | 5,701 |
Mischief |
11,873 | 9,505 | 10,931 | 10,228 | 10,996 |
Possession of stolen property |
10,689 | 7,892 | 7,245 | 6,796 | 7,448 |
Other property crimes |
2,412 | 1,823 | 1,656 | 1,173 | 1,361 |
| Administration of justice | 69,668 | 50,416 | 43,732 | 44,771 | 47,243 |
Fail to appear |
4,280 | 3,146 | 3,429 | 4,277 | 3,951 |
Breach of probation |
28,265 | 19,063 | 12,768 | 12,618 | 13,905 |
Unlawfully at large |
2,715 | 1,349 | 521 | 461 | 565 |
Fail to comply with order |
27,460 | 21,889 | 22,127 | 22,548 | 23,387 |
Other admin. justice |
6,948 | 4,969 | 4,887 | 4,867 | 5,435 |
| Other Criminal Code | 21,242 | 16,893 | 16,010 | 15,351 | 13,561 |
Weapons/firearms |
11,170 | 9,819 | 10,228 | 9,892 | 10,310 |
Prostitution |
11 | 32 | 7 | 26 | 22 |
Disturbing the peace |
633 | 409 | 353 | 334 | 343 |
Residual Criminal Code |
9,428 | 6,633 | 5,422 | 5,099 | 2,886 |
| Criminal Code traffic | 39,797 | 29,534 | 27,472 | 28,055 | 28,167 |
Impaired driving |
31,264 | 22,758 | 19,517 | 20,247 | 20,260 |
Other CC traffic |
8,533 | 6,776 | 7,955 | 7,808 | 7,907 |
| Other federal statutes | 26,189 | 20,898 | 16,201 | 14,730 | 12,605 |
Drug possession |
6,165 | 6,683 | 4,982 | 4,399 | 3,330 |
Other drug offences |
6,909 | 6,156 | 7,059 | 6,809 | 6,498 |
Residual federal statutes |
12,450 | 7,675 | 3,944 | 3,382 | 2,611 |
| Total offences | 317,367 | 237,364 | 221,317 | 219,154 | 228,425 |
Source: Statistics Canada. Table 35-10-0027-01, Adult criminal courts, number of cases and charges by type of decision.
Table A10 Notes
Assault is a violent offence classified into 3 levels: level 1 or common assault, the least serious form including behaviours such as pushing, slapping, punching and face-to-face threats; level 2 assault, defined as assault with a weapon or causing bodily harm; and level 3 aggravated assault, defined as assault that wounds, maims, disfigures or endangers the life of the victim.
Administration of justice includes the offences failure to appear, breach of probation, and unlawfully at large.
Other Criminal Code offences (Other CC) includes administration of justice violations, weapons/firearms violations, counterfeit, possession of, accessing, making or distribution of child pornography and prostitution.
Other federal statute offences refer to offences against Canadian federal statutes, such as Customs Act, Employment Insurance Act, Firearms Act, Food and Drugs Act (FDA), Income Tax Act, Controlled Drugs and Substances Act (CDSA) and Narcotic Control Act (NCA). This offence category excludes Criminal Code of Canada offences.
The concept of a case has changed to more closely reflect court processing. Statistics from the Integrated Criminal Court Survey used in this report should not be compared to editions of the Corrections and Conditional Release Statistical Overview prior to 2007. A case is 1 or more charges against an accused person or corporation, processed by the courts at the same time, and where all of the charges in the case received a final disposition. Where a case has more than 1 charge, it is necessary to select a charge to represent the case. An offence is selected by applying 2 rules. First, the most serious decision rule is applied. In cases where 2 or more offences have the same decision, the most serious offence rule is applied. All charges are ranked according to an offence seriousness scale. Superior Court data are not reported to the Integrated Criminal Court Survey for Prince Edward Island, Quebec, Ontario, Manitoba and Saskatchewan. In addition, information from Quebec's municipal courts is not collected.
The Canadian Centre for Justice and Community Safety Statistics continues to make updates to the offence library used to classify offence data sent by the provinces and territories. These improvements have resulted in minor changes in the counts of charges and cases as well as the distributions by type of offence. Data presented have been revised to account for these updates.
Due to rounding, percentages may not add up to 100 percent.
Reported year periods reflect fiscal years. A fiscal year runs from April 1 to March 31 of the following year.
Decisions in adult criminal court
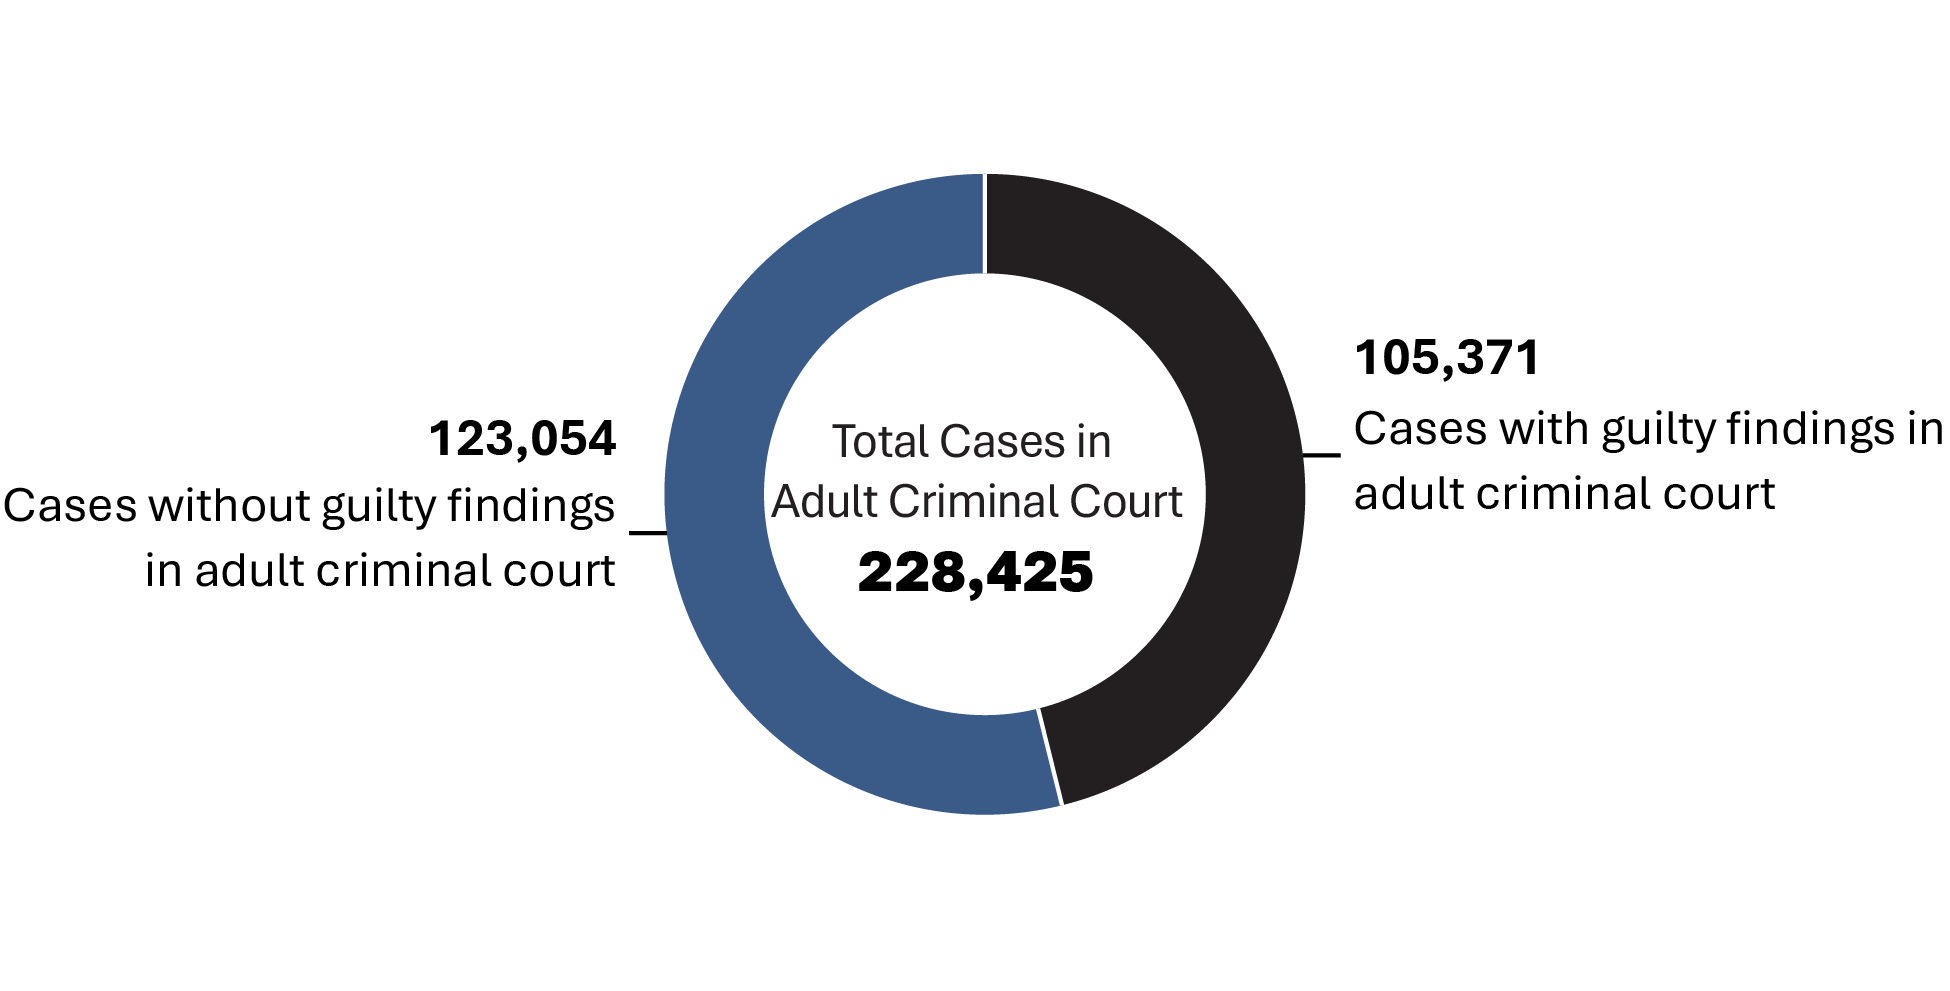
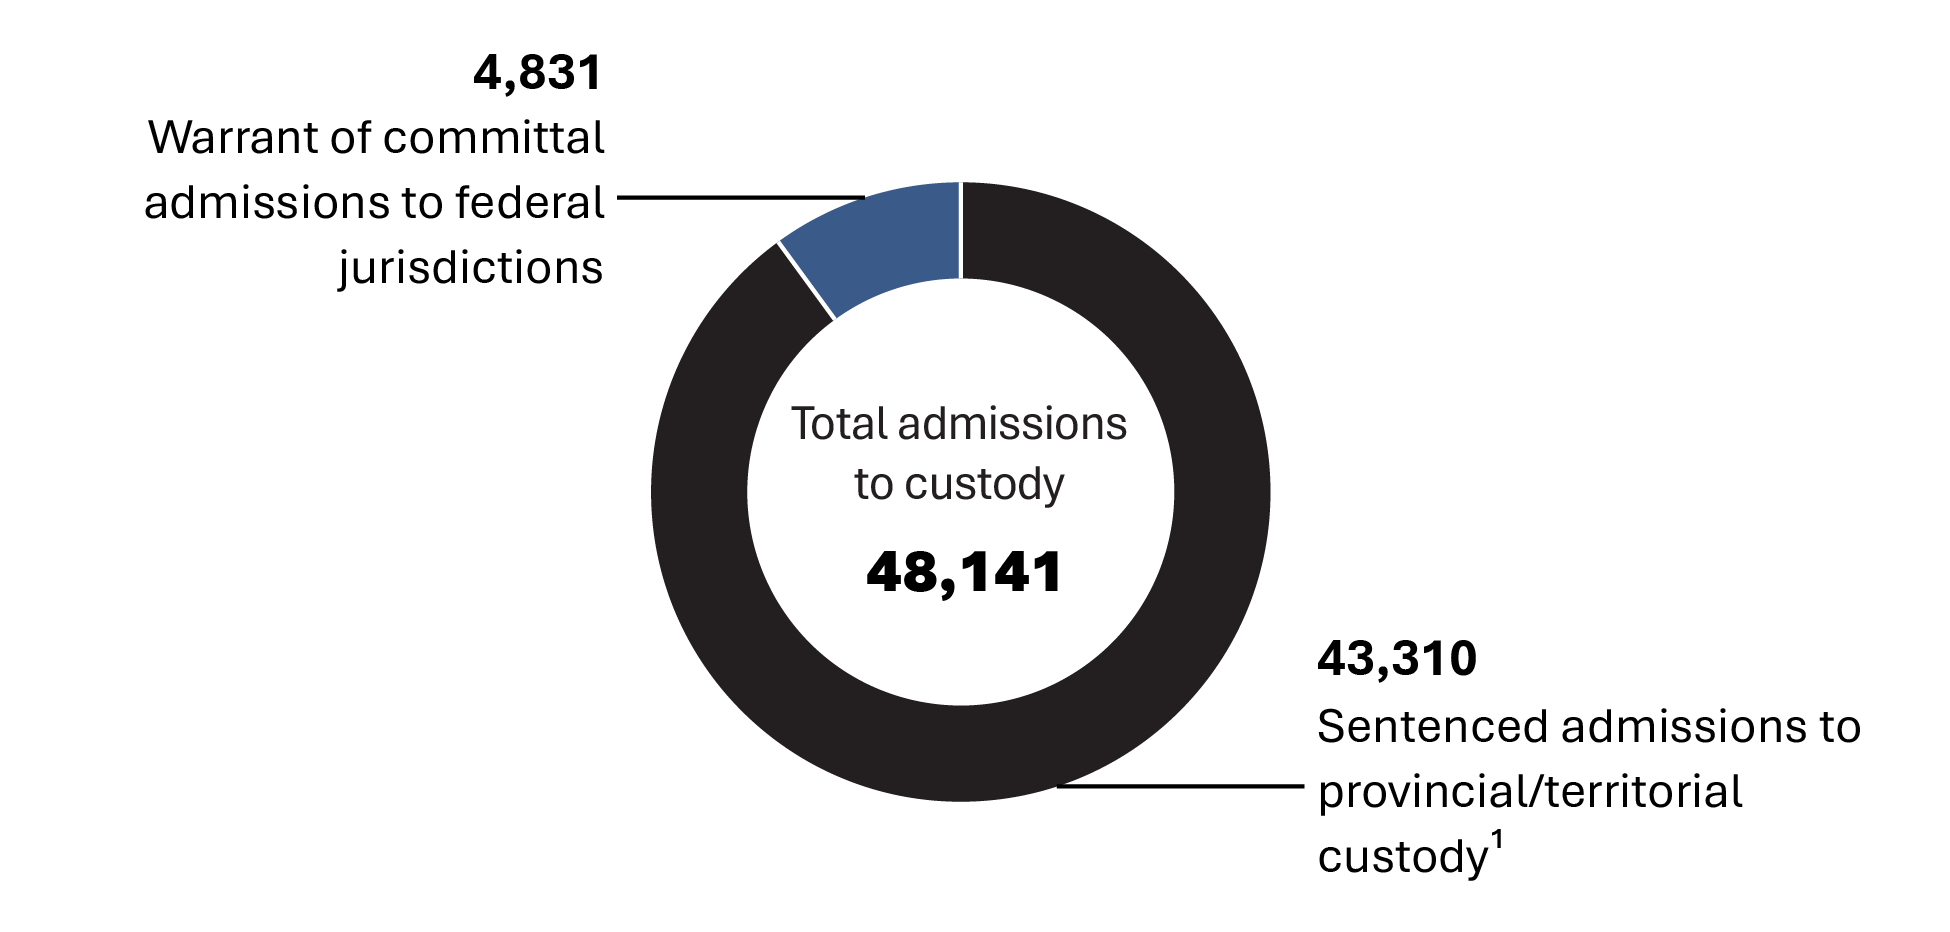
Image description
Two donut charts illustrating data for fiscal year 2023-24. The first chart shows total number of cases in adult criminal court, divided into cases with guilty findings and cases without guilty findings. Cases without guilty findings make up a little over half of the total cases. The second chart shows total admissions to custody, split between those sentenced admissions to provincial/territorial custody and warrant of committal admissions to federal jurisdiction. Provincial and territorial admissions account for the vast majority, while federal admissions represent a very small number of admissions to custody. Full data are available in the accompanying table.
Sources:
1Statistics Canada. Table 35-10-0018-01, Adult sentenced custody admissions to correctional services by sex and sentence length ordered;
Statistics Canada. Table 35-10-0027-01, Adult criminal courts, number of cases and charges by type of decision;
Correctional Service of Canada.
- In 2023-24, there were 105,371 cases with guilty findings in adult criminal court.
- Between 2019-20 and 2023-24, the total number of cases in adult criminal court decreased 28.0%. Over the same time period, the total number of sentenced admissions to provincial/territorial custody decreased 33.3%.
- In 2023-24, there were 4,831 warrant of committal admissions to a federal institution or Healing Lodge.
- In 2023-24, there were 43,310 sentenced admissions to provincial/territorial custody.
| Case type | 2019-20 | 2020-21 | 2021-22 | 2022-23 | 2023-24 |
|---|---|---|---|---|---|
| Total cases without guilty findings in criminal courtFootnote 1 | 124,597 | 118,223 | 116,126 | 117,072 | 123,054 |
AcquittedFootnote 1 |
9,811 | 7,147 | 2,012 | 2,300 | 2,442 |
Stayed or withdrawnFootnote 1 |
111,079 | 108,234 | 112,317 | 112,612 | 118,265 |
Other decisionsFootnote 1 |
3,707 | 2,842 | 1,797 | 2,160 | 2,347 |
| Total case decisionsFootnote * in adult criminal courtFootnote 1 | 317,367 | 237,364 | 221,317 | 219,154 | 228,425 |
| Cases with guilty findings in adult criminal courtFootnote 1 | 192,770 | 119,141 | 105,191 | 102,082 | 105,371 |
| Sentenced admissions to provincial/territorial custodyFootnote 2 | 64,964 | 35,566 | 37,932 | 40,900 | 43,310 |
| Warrant of committal —admission to FED (CSC)Footnote 3 | 4,642 | 3,228 | 4,007 | 4,729 | 4,831 |
Sources
Table A11 Notes
Length of adult custodial sentences
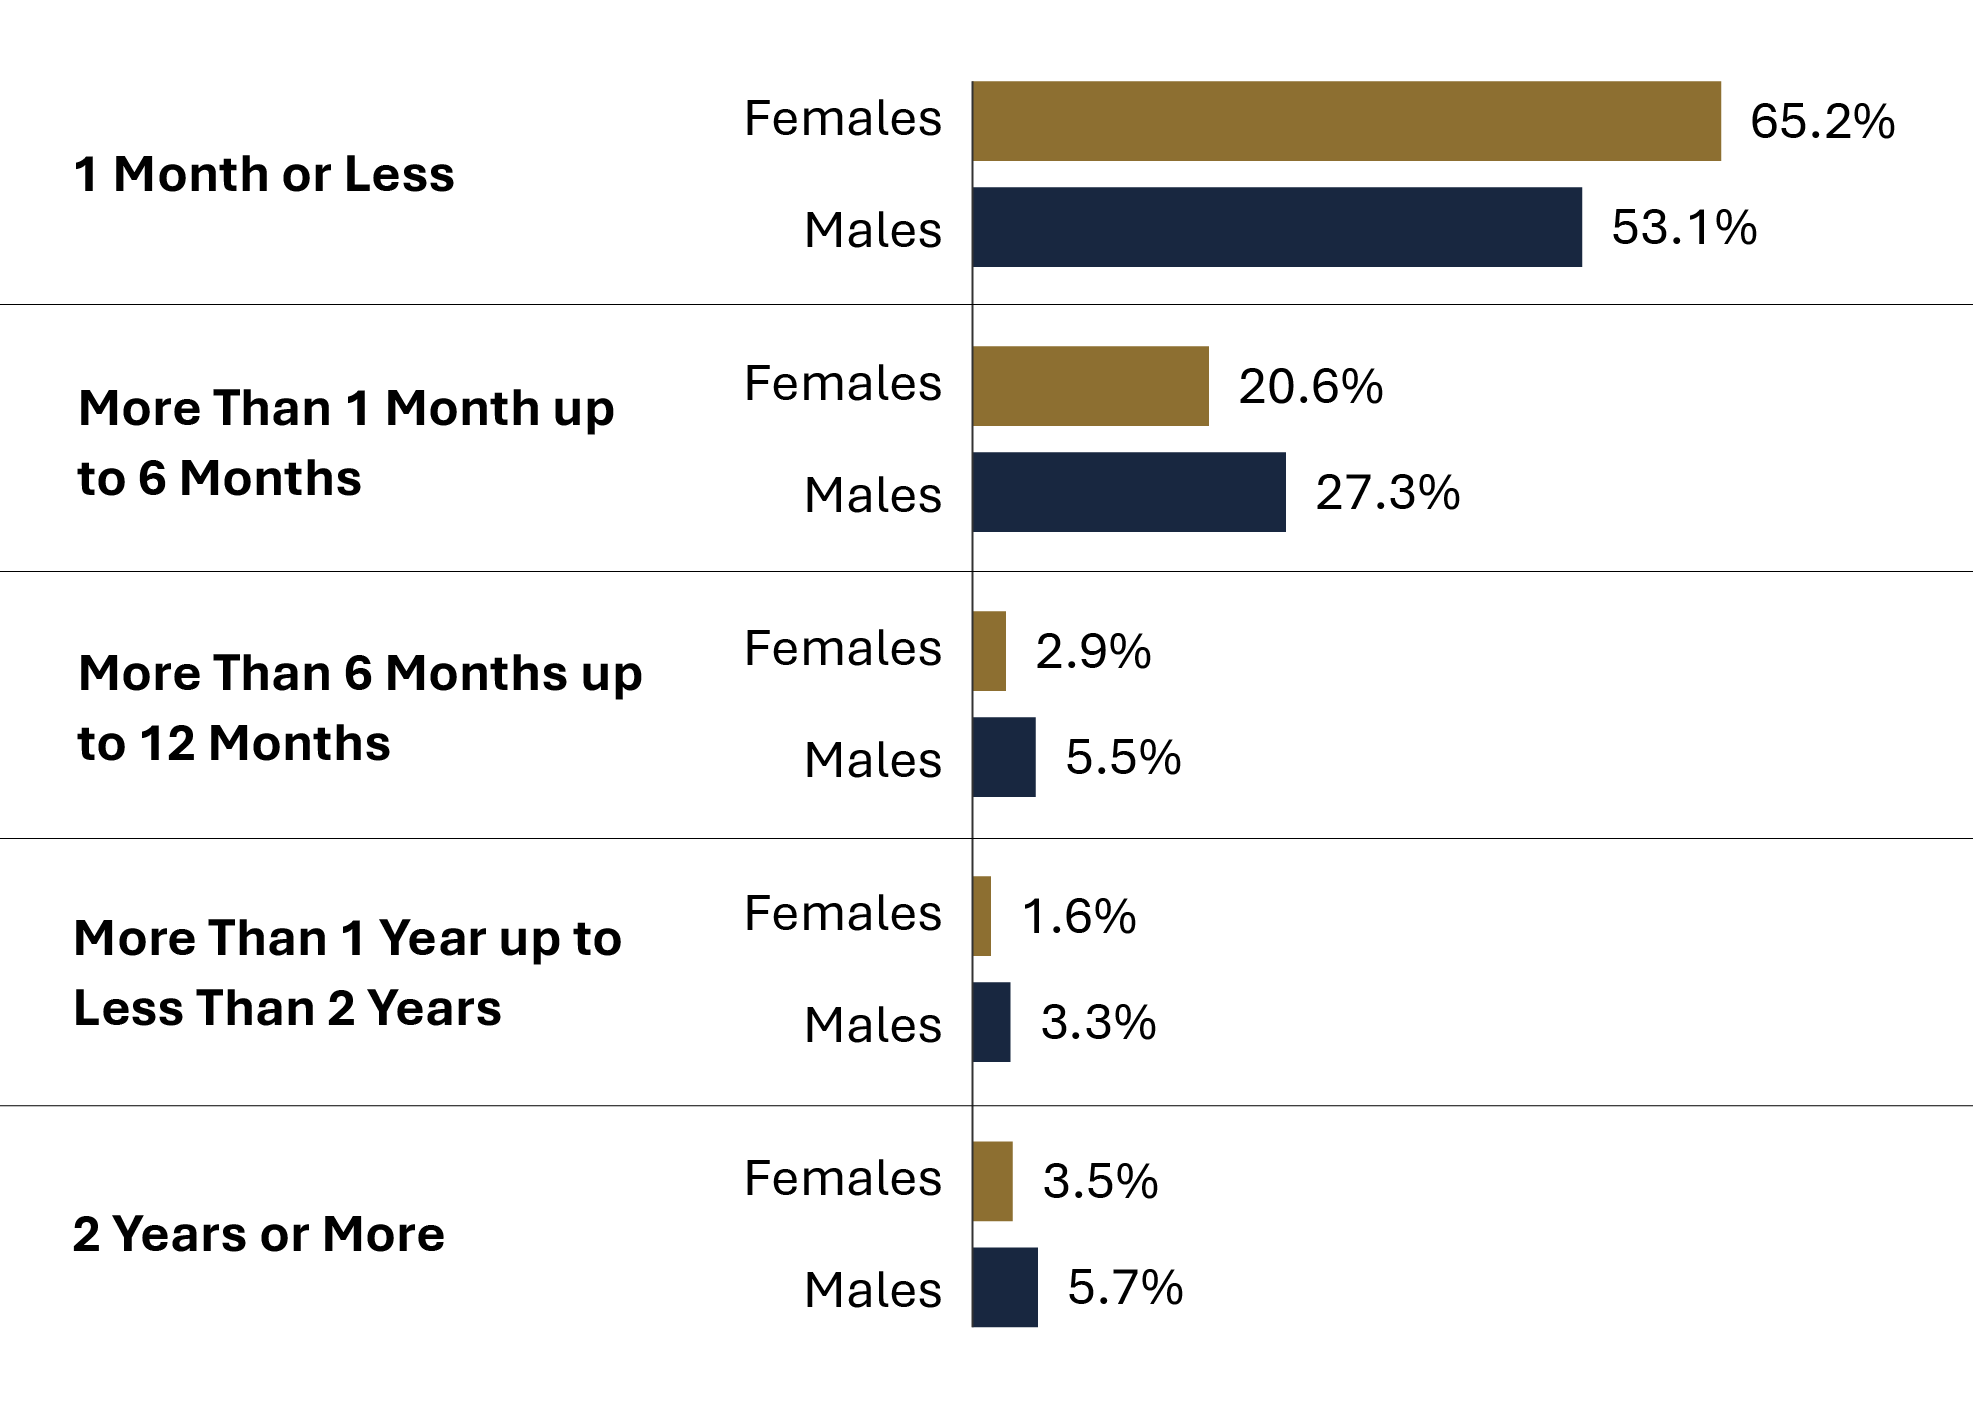
Image description
Bar graph showing the length of prison sentences ordered by the court by sex for fiscal year 2023-24. Sentence lengths include 1 month or less, more than 1 month up to 6 months, more than 6 months up to 12 months, more than 1 year up to less than 2 years, and 2 years or more. Prison sentences of one month of less accounted for the majority of sentences ordered by the court among both sexes, with females having a greater proportion ordered than males. The second most ordered sentence among both sexes was more than 1 month up to 6 months, with males having a greater proportion ordered than females. Full data are available in the table below.
Source: Statistics Canada. Table 35-10-0032-01, Adult criminal courts, guilty cases by length of custody.
- Just under half (49.8%) of all custodial sentences imposed by adult criminal courts were 1 month or less in fiscal year 2023-24.
- Prison sentences for males tended to be longer than for females, with the exception of sentences of 1 month or less.
- 65.2% of females and 53.1% of males who were incarcerated following a guiltyFootnote * finding received a sentence of 1 month or less, and 85.8% of females and 80.4% of males received a sentence of 6 months or less.
Table A12. Length of prison sentence ordered by the court
| Sex | 2019-20 | 2020-21 | 2021-22 | 2022-23 | 2023-24 |
|---|---|---|---|---|---|
| Females | 54.8 | 51.9 | 61.9 | 63.4 | 65.2 |
| Males | 46.6 | 43.4 | 51.5 | 51.8 | 53.1 |
| Total | 44.6 | 41.0 | 47.8 | 48.1 | 49.8 |
| Sex | 2019-20 | 2020-21 | 2021-22 | 2022-23 | 2023-24 |
|---|---|---|---|---|---|
| Females | 26.0 | 27.1 | 21.9 | 20.2 | 20.6 |
| Males | 31.0 | 31.7 | 28.0 | 27.4 | 27.3 |
| Total | 28.4 | 28.8 | 24.7 | 23.9 | 24.1 |
| Sex | 2019-20 | 2020-21 | 2021-22 | 2022-23 | 2023-24 |
|---|---|---|---|---|---|
| Females | 3.9 | 4.5 | 3.7 | 3.5 | 2.9 |
| Males | 5.9 | 6.8 | 6.1 | 5.7 | 5.5 |
| Total | 5.3 | 6.0 | 5.3 | 4.9 | 4.8 |
| Sex | 2019-20 | 2020-21 | 2021-22 | 2022-23 | 2023-24 |
|---|---|---|---|---|---|
| Females | 1.9 | 2.2 | 1.5 | 1.5 | 1.6 |
| Males | 3.4 | 3.9 | 3.4 | 3.4 | 3.3 |
| Total | 3.0 | 3.4 | 2.9 | 2.9 | 2.8 |
| Sex | 2019-20 | 2020-21 | 2021-22 | 2022-23 | 2023-24 |
|---|---|---|---|---|---|
| Females | 1.9 | 2.7 | 3.2 | 3.4 | 3.5 |
| Males | 3.6 | 4.2 | 4.8 | 5.4 | 5.7 |
| Total | 3.2 | 3.7 | 4.2 | 4.6 | 4.9 |
| Sex | 2019-20 | 2020-21 | 2021-22 | 2022-23 | 2023-24 |
|---|---|---|---|---|---|
| Females | 11.5 | 11.7 | 7.9 | 8.0 | 6.2 |
| Males | 9.6 | 10.1 | 6.2 | 6.3 | 5.1 |
| Total | 15.6 | 17.1 | 15.1 | 15.6 | 13.6 |
Source: Statistics Canada. Table 35-10-0032-01, Adult criminal courts, guilty cases by length of custody.
Table A12 Notes
Total includes the following categories: males, females, sex unknown, and any registered companies.
Length unknown includes indeterminate custody sentences. In some provinces/territories, particularly British Columbia, Saskatchewan, Quebec and New Brunswick, the unknown category may include guilty cases with custody where the custodial sentence ordered has already been served and the time remaining is equal to zero.
The concept of a case has changed to more closely reflect court processing. Statistics from the Integrated Criminal Court Survey used in this report should not be compared to editions of the Corrections and Conditional Release Statistical Overview prior to 2007.
Superior Court data are not reported to the Integrated Criminal Court Survey for Prince Edward Island, Quebec, Ontario, Manitoba and Saskatchewan. In addition, information from Quebec's municipal courts is not collected.
The Canadian Centre for Justice and Community Safety Statistics continues to make updates to the offence library used to classify offence data sent by the provinces and territories. These improvements have resulted in minor changes in the counts of charges and cases as well as the distributions by type of offence. Data presented have been revised to account for these updates.
Due to rounding, totals may not add up to 100 percent.
Reported year periods reflect fiscal years. A fiscal year runs from April 1 to March 31 of the following year.
The rate of youth charged
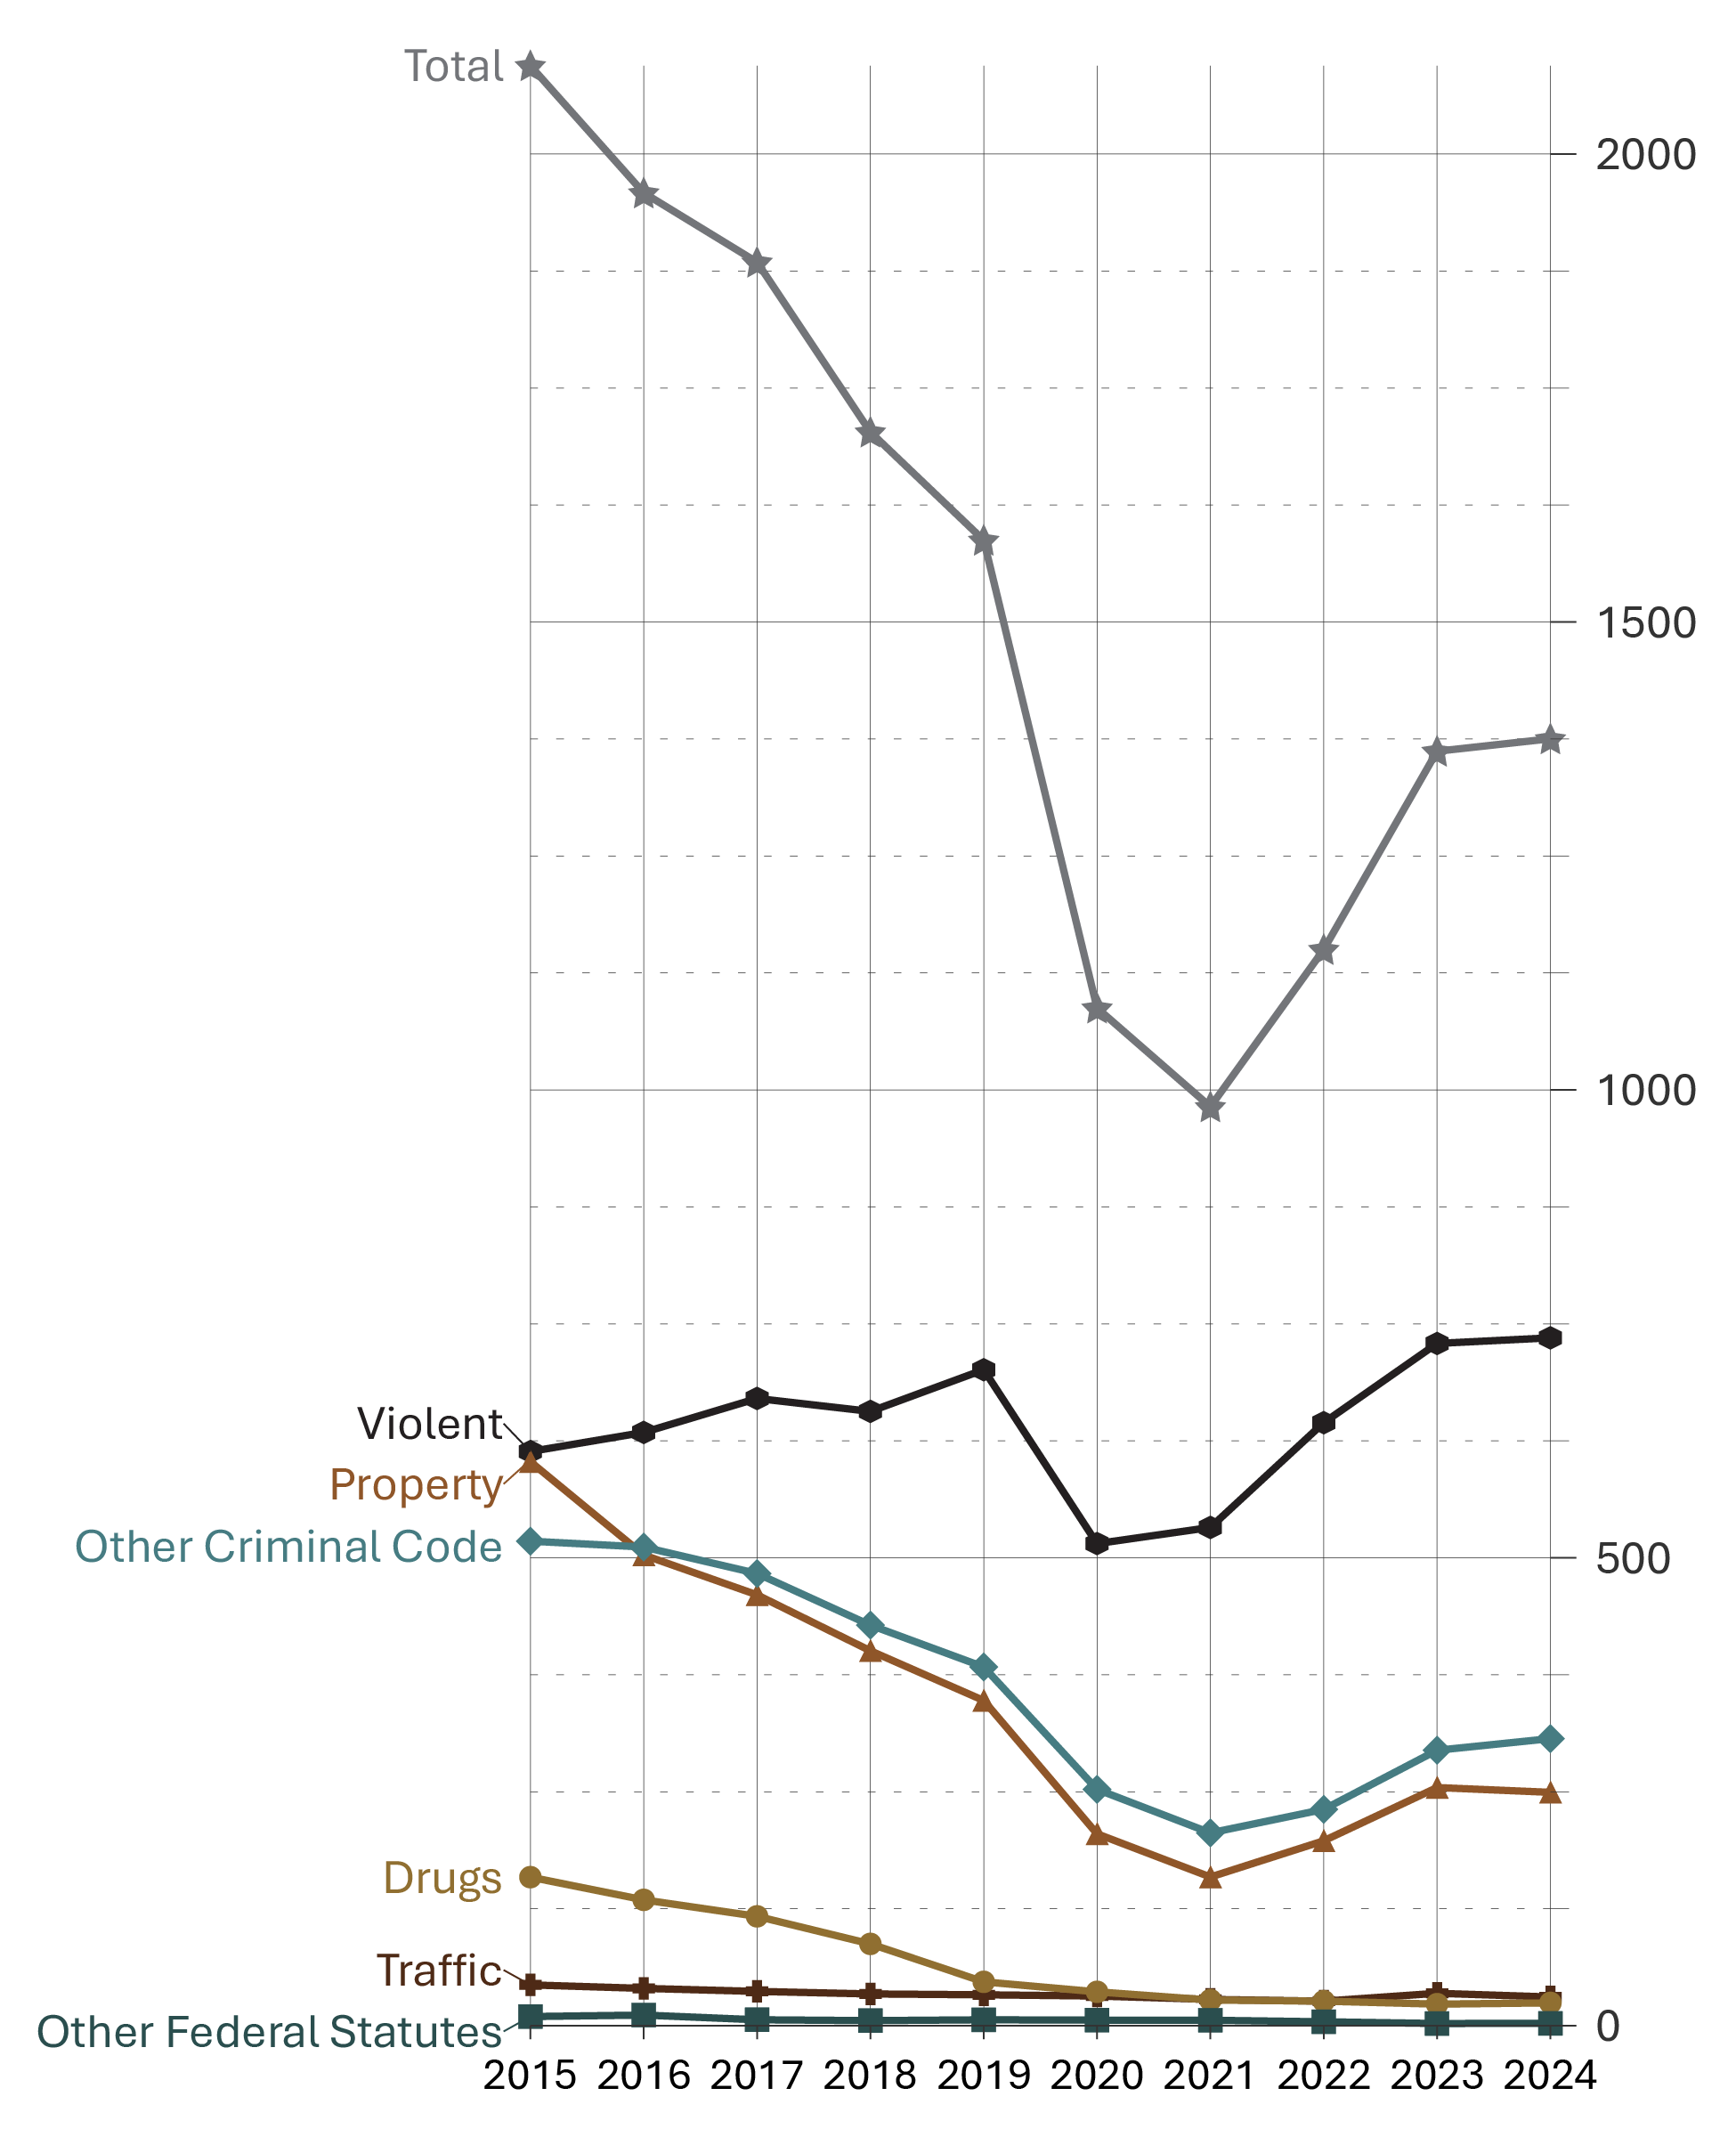
Image description
Line graph showing the rate of youth charged, per 100,000 population, by offence type between calendar year 2015 and 2024. The graph includes the rate of total charges, property crimes, violent offences, other Criminal Code violations, drug offences, traffic violations, and other federal statutes. The total rate of youth charged significantly decreased between 2015 and 2021. While the total rate has steadily increased from 2022 to 2024, it has not rebounded to previous levels. Violent offences represent roughly half of the total rate of youth charged, followed by other Criminal Code and property offences. Full data are available in the table below.
Source: Statistics Canada. Table 35-10-0177-01, Incident-based crime statistics, by detailed violations, Canada, provinces, territories, Census Metropolitan Areas and Canadian Forces Military Police.
- From 2015 to 2021, the rate of youth charged decreased substantially (-53.1%). The sharp decrease (-38.1%) seen between 2019 and 2021 may be due to lockdown restrictions resulting from the COVID-19 pandemic. From 2021 to 2024, after most lockdown restrictions had ended, there was an increase of 40.0%.
- Between 2015 to 2019 there was a 14.2% increase in the rate of youth charged with a violent crime, followed by a 24.0% decrease between 2019 to 2021, perhaps due to COVID-19 pandemic lockdown restrictions. The sharp increase (+38.1%) observed between 2021 and 2024 may be due to the lifting of many COVID-19 lockdown restrictions.
- In the 10-year period between 2015 and 2024, the rate of youth charged with drug offences decreased by 84.6%.
| Year | Violent | Property | Traffic | Other CC | Drugs | Other federal statutes | Total charged |
|---|---|---|---|---|---|---|---|
| 1998 | 994 | 2,500 | 0 | 870 | 226 | 4 | 4,775 |
| 1999 | 1,060 | 2,237 | 0 | 728 | 266 | 2 | 4,500 |
| 2000 | 1,136 | 2,177 | 2 | 760 | 317 | 4 | 4,589 |
| 2001 | 1,157 | 2,119 | 1 | 840 | 343 | 6 | 4,656 |
| 2002 | 1,102 | 2,009 | 0 | 793 | 337 | 6 | 4,476 |
| 2003 | 953 | 1,570 | 0 | 726 | 208 | 5 | 3,662 |
| 2004 | 918 | 1,395 | 1 | 691 | 230 | 5 | 3,457 |
| 2005 | 924 | 1,276 | 0 | 660 | 214 | 10 | 3,287 |
| 2006 | 917 | 1,216 | 0 | 680 | 240 | 16 | 3,269 |
| 2007 | 943 | 1,211 | 75 | 732 | 260 | 17 | 3,461 |
| 2008 | 909 | 1,130 | 74 | 730 | 267 | 19 | 3,369 |
| 2009 | 888 | 1,143 | 68 | 698 | 238 | 30 | 3,294 |
| 2010 | 860 | 1,035 | 62 | 669 | 255 | 31 | 3,147 |
| 2011 | 806 | 904 | 58 | 636 | 263 | 31 | 2,918 |
| 2012 | 765 | 842 | 58 | 629 | 240 | 20 | 2,771 |
| 2013 | 692 | 722 | 45 | 554 | 229 | 10 | 2,435 |
| 2014 | 625 | 625 | 42 | 526 | 198 | 6 | 2,184 |
| 2015 | 614 | 603 | 44 | 518 | 159 | 10 | 2,094 |
| 2016 | 634 | 503 | 40 | 512 | 135 | 11 | 1,959 |
| 2017 | 670 | 460 | 37 | 483 | 117 | 6 | 1,884 |
| 2018 | 656 | 401 | 34 | 428 | 87 | 5 | 1,703 |
| 2019 | 701 | 348 | 33 | 383 | 47 | 6 | 1,587 |
| 2020 | 515 | 205 | 32 | 253 | 36 | 6 | 1,087 |
| 2021 | 532 | 159 | 28 | 206 | 27 | 6 | 982 |
| 2022 | 644 | 198 | 26 | 231 | 26 | 4 | 1,150 |
| 2023 | 729 | 255 | 35 | 294 | 23 | 2 | 1,362 |
| 2024 | 735 | 249 | 31 | 307 | 24 | 3 | 1,375 |
Source: Statistics Canada. Table 35-10-0177-01, Incident-based crime statistics, by detailed violations, Canada, provinces, territories, Census Metropolitan Areas and Canadian Forces Military Police.
Table A13 Notes
Other Criminal Code offences (Other CC) includes administration of justice violations; weapons/firearms violations; counterfeit; possession of, accessing, making or distribution of child pornography; and prostitution.
Other federal statute offences refer to offences against Canadian federal statutes, such as Customs Act, Employment Insurance Act, Firearms Act, Food and Drugs Act (FDA), Income Tax Act, Controlled Drugs and Substances Act (CDSA) and Narcotic Control Act (NCA). This offence category excludes Criminal Code of Canada offences.
For criminal justice purposes, youth are defined under Canadian law as persons age 12 to 17.
Rates are based on 100,000 youth population (12 to 17 years old). Violent crimes include homicide, attempted murder, assault, sexual offences, abduction, extortion, robbery, firearms, and other violent offences such as uttering threats and criminal harassment. Property crimes include break and enter, motor vehicle theft, other theft, possession of stolen property, fraud, mischief and arson.
Criminal Code and other Federal Statute charges among youth: 5-year trend
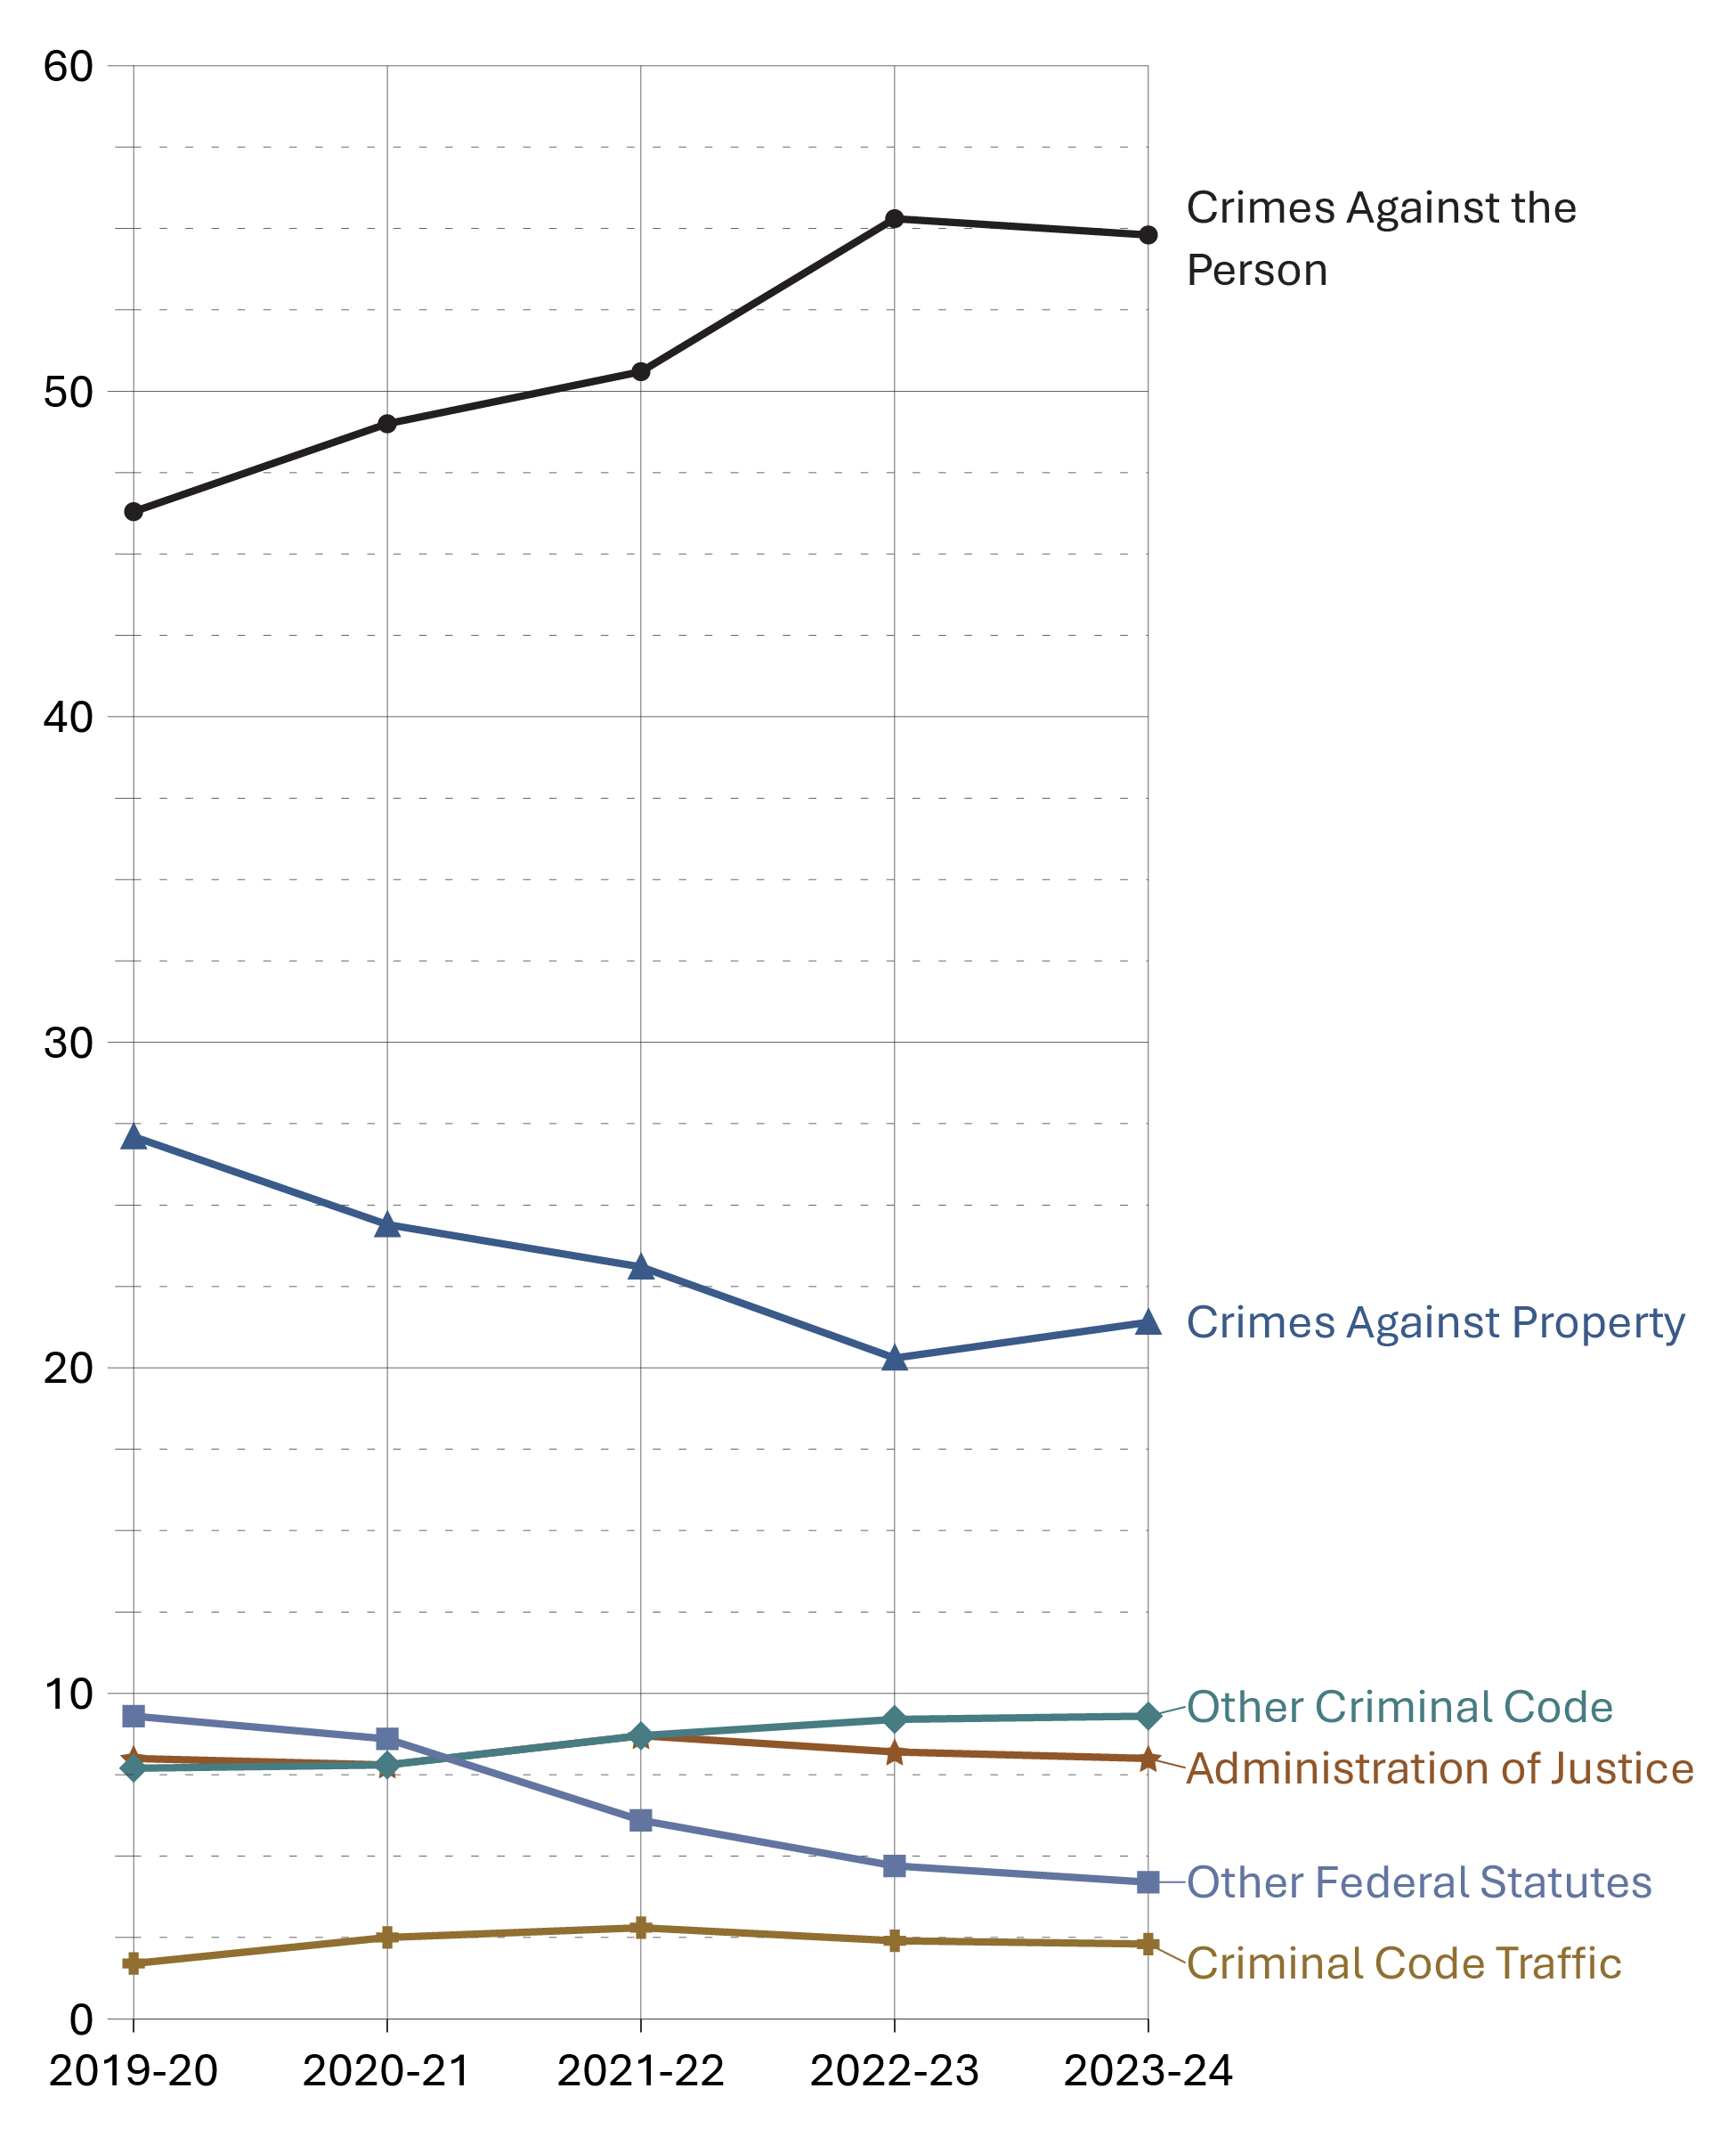
Image description
Line graph showing the percentage of all Criminal Code and other federal statute changes among youth between fiscal years 2019-20 and 2023-24. The graph includes crimes against the person, crimes against property, other federal statutes, administration of justice violations, Criminal Code traffic violations, and other Criminal Code violations. The greatest proportion of charges among youth were for crimes against the person. Crimes against property were the second largest category, accounting for roughly half the proportion of crimes against the person. Full data are available in the table below.
Source: Statistics Canada. Table 35-10-0038-01, Youth courts, number of cases and charges by type of decision.
- In 2023-24, crimes against the person accounted for approximately half (54.8%) of all charges among youth (increasing from 46.3% in 2019-20).
- In the 5-year period between 2019-20 and 2023-24, crimes against property and other federal statute charges decreased among youth, while crimes against the person and Other Criminal Code charges increased. Criminal Code traffic and administration of justice charges remained relatively stable.
- Common assault (included in “Crimes against the person”) has consistently been the most frequent charge in youth court in the 5-year period from 2019-20 to 2023-24.
| Type of charge | 2019-20 | 2020-21 | 2021-22 | 2022-23 | 2023-24 |
|---|---|---|---|---|---|
| Crimes against the person | 10,379 | 7,345 | 5,769 | 6,713 | 8,539 |
Homicide and Attempted Murder |
41 | 37 | 40 | 39 | 48 |
Robbery |
1,502 | 1,082 | 787 | 692 | 1,087 |
Sexual Assault/Other Sexual Offences |
1,821 | 1,486 | 1,322 | 1,467 | 1,558 |
Major Assault |
2,145 | 1,579 | 1,358 | 1,625 | 2,185 |
Common Assault |
2,828 | 1,825 | 1,522 | 2,049 | 2,585 |
Other Crimes Against the Person |
2,026 | 1,322 | 738 | 839 | 1,069 |
| Crimes against property | 6,087 | 3,659 | 2,633 | 2,460 | 3,335 |
Theft |
1,588 | 812 | 430 | 451 | 728 |
Break and Enter |
1,165 | 781 | 619 | 555 | 723 |
Fraud |
382 | 257 | 123 | 92 | 117 |
Mischief |
1,278 | 889 | 802 | 804 | 981 |
Possession of Stolen Property |
1,060 | 533 | 392 | 314 | 450 |
Other Crimes Against Property |
237 | 161 | 119 | 93 | 138 |
| Administration of justice | 1,788 | 1,164 | 988 | 998 | 1,240 |
Failure to comply with order |
1,064 | 725 | 648 | 654 | 828 |
Other administration of justice |
626 | 378 | 291 | 315 | 368 |
| Other Criminal Code | 1,718 | 1,170 | 988 | 1,113 | 1,444 |
Weapons/Firearms |
1,381 | 922 | 816 | 960 | 1294 |
Prostitution |
1 | 2 | 1 | 0 | 1 |
Disturbing the Peace |
33 | 23 | 32 | 28 | 17 |
Residual Criminal Code |
303 | 223 | 139 | 125 | 132 |
| Criminal Code traffic | 379 | 373 | 320 | 287 | 358 |
| Other federal statutes | 2,088 | 1,290 | 695 | 567 | 657 |
Drug Possession |
272 | 164 | 41 | 65 | 41 |
Other Drug Offences |
338 | 242 | 183 | 189 | 175 |
Youth Criminal Justice Act |
1,382 | 775 | 454 | 302 | 410 |
Residual Federal Statutes |
96 | 109 | 17 | 11 | 31 |
| Total | 22,439 | 15,001 | 11,393 | 12,138 | 15,573 |
Source: Statistics Canada. Table 35-10-0038-01, Youth courts, number of cases and charges by type of decision.
Table A14 Notes
Administration of justice includes the offences failure to appear, breach of probation, and unlawfully at large.
Other Criminal Code (Other CC) offences includes administration of justice violations, weapons/firearms violations, counterfeit, possession of, accessing, making or distribution of child pornography and prostitution.
Other federal statute offences refer to offences against Canadian federal statutes, such as Customs Act, Employment Insurance Act, Firearms Act, Food and Drugs Act (FDA), Income Tax Act, Controlled Drugs and Substances Act (CDSA) and Narcotic Control Act (NCA). This offence category excludes Criminal Code of Canada offences.
Youth Criminal Justice Act offences include failure to comply with a disposition or undertaking, contempt against youth court, assisting a youth to leave a place of custody and harbouring a youth unlawfully at large. Also included are similar offences under the Young Offenders Act, which preceded the Youth Criminal Justice Act.
The concept of a case has changed to more closely reflect court processing. Statistics from the Integrated Criminal Court Survey used in this report should not be compared to editions of the Corrections and Conditional Release Statistical Overview prior to 2007. A case is 1 or more charges against an accused person or corporation, processed by the courts at the same time, and where all of the charges in the case received a final disposition. Where a case has more than 1 charge, it is necessary to select a charge to represent the case. An offence is selected by applying 2 rules. First, the most serious decision rule is applied. In cases where 2 or more offences have the same decision, the most serious offence rule is applied. All charges are ranked according to an offence seriousness scale.
The Canadian Centre for Justice and Community Safety Statistics continues to make updates to the offence library used to classify offence data sent by the provinces and territories. These improvements have resulted in minor changes in the counts of charges and cases as well as the distributions by type of offence. Data presented have been revised to account for these updates.
The table includes data from the most recent year available at the time of preparation.
Reported year periods reflect fiscal years. A fiscal year runs from April 1 to March 31 of the following year.
Youth criminal court sentences: 5-year trend
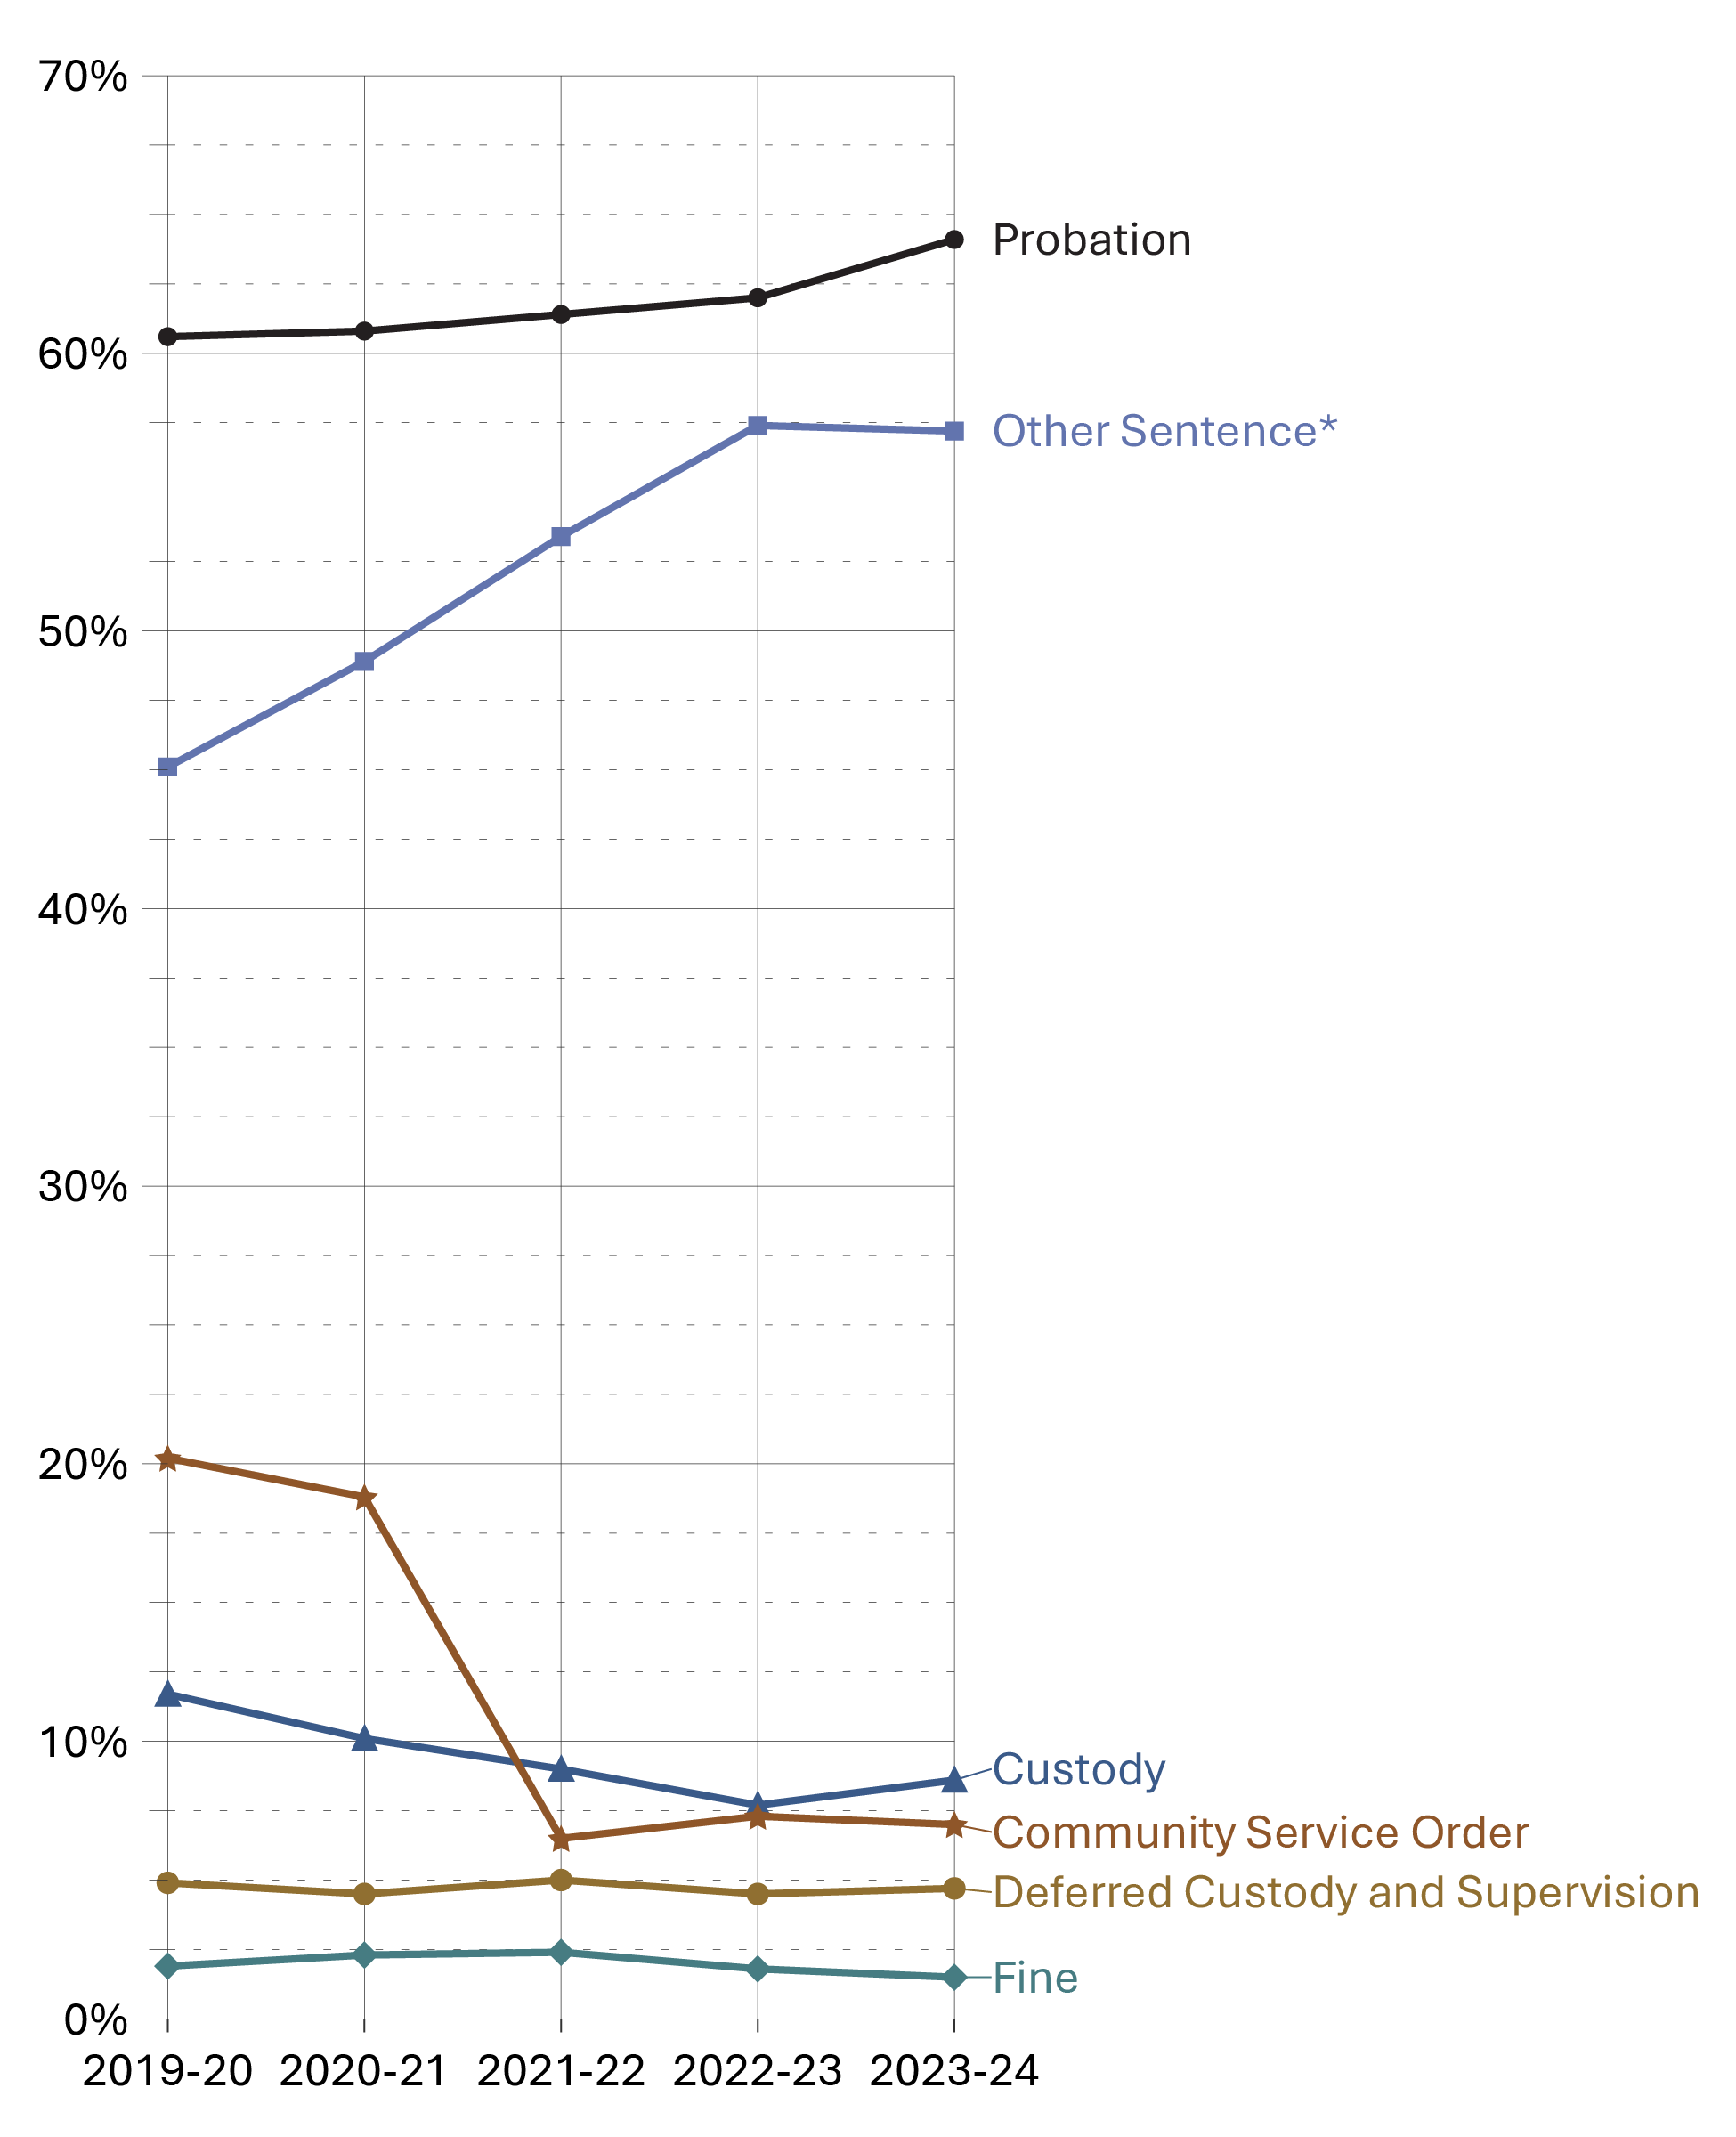
Image description
Line graph showing the percentage of sentence types received in youth criminal court between fiscal years 2019-20 and 2023-24. The graph includes probation, custody, deferred custody and supervision, community service order, fine, and other sentences. Probation and other sentences represent the largest categories, while fine and deferred custody and supervision remain the smallest proportions throughout the 10-year period. Full data are available in the table below.
Source: Statistics Canada. Table 35-10-0041-01, Youth courts, guilty cases by type of sentence.
- Probation has consistently been the most common sentence in youth criminal court. In fiscal year 2023-24, 64.1% of all youth found guilty were sentenced to probation. By sex, 60.7% of females and 64.8% of males were sentenced to probation in 2023-24.
- Community service orders steadily declined from 2019-20 to 2020-21, then had a sharp decline between 2020-21 and 2023-24 (from 18.8% to 7.0%). Fluctuations between 2019 and 2022 may be due to the imposition and cessation of the COVID-19 pandemic lockdown restrictions.
- In the 5-year period from 2019-20 to 2023-24, other sentencesFootnote * increased from 45.1% to 57.2%.
Table A15. Percentage of sentence type received in youth criminal court
| Sex | 2019-20 | 2020-21 | 2021-22 | 2022-23 | 2023-24 |
|---|---|---|---|---|---|
| Female | 53.9 | 51.9 | 55.3 | 57.1 | 60.7 |
| Male | 62.2 | 63.3 | 62.7 | 62.4 | 64.8 |
| Total | 60.6 | 60.8 | 61.4 | 62.0 | 64.1 |
| Sex | 2019-20 | 2020-21 | 2021-22 | 2022-23 | 2023-24 |
|---|---|---|---|---|---|
| Female | 4.7 | 4.4 | 4.6 | 3.0 | 4.0 |
| Male | 12.8 | 10.9 | 9.7 | 8.4 | 9.6 |
| Total | 11.7 | 10.1 | 9.0 | 7.7 | 8.6 |
| Sex | 2019-20 | 2020-21 | 2021-22 | 2022-23 | 2023-24 |
|---|---|---|---|---|---|
| Female | 18.9 | 19.0 | 6.5 | 6.7 | 6.6 |
| Male | 21.8 | 20.5 | 5.8 | 7.2 | 7.0 |
| Total | 20.2 | 18.8 | 6.5 | 7.3 | 7.0 |
| Sex | 2019-20 | 2020-21 | 2021-22 | 2022-23 | 2023-24 |
|---|---|---|---|---|---|
| Female | 3.7 | 3.4 | 3.9 | 3.8 | 3.0 |
| Male | 5.3 | 4.7 | 5.3 | 5.1 | 5.3 |
| Total | 4.9 | 4.5 | 5.0 | 4.5 | 4.7 |
| Sex | 2019-20 | 2020-21 | 2021-22 | 2022-23 | 2023-24 |
|---|---|---|---|---|---|
| Female | 1.6 | 2.0 | 1.7 | 0.8 | 1.0 |
| Male | 1.9 | 2.2 | 2.5 | 1.9 | 1.5 |
| Total | 1.9 | 2.3 | 2.4 | 1.8 | 1.5 |
| Sex | 2019-20 | 2020-21 | 2021-22 | 2022-23 | 2023-24 |
|---|---|---|---|---|---|
| Female | 43.7 | 49.9 | 52.5 | 55.4 | 57.8 |
| Male | 46.4 | 48.7 | 54.5 | 59.0 | 57.3 |
| Total | 45.1 | 48.9 | 53.4 | 57.4 | 57.2 |
Source: Statistics Canada. Table 35-10-0041-01, Youth courts, guilty cases by type of sentence.
Table A15 Notes
Youth criminal court sentences for most serious sentence: 5-year trend
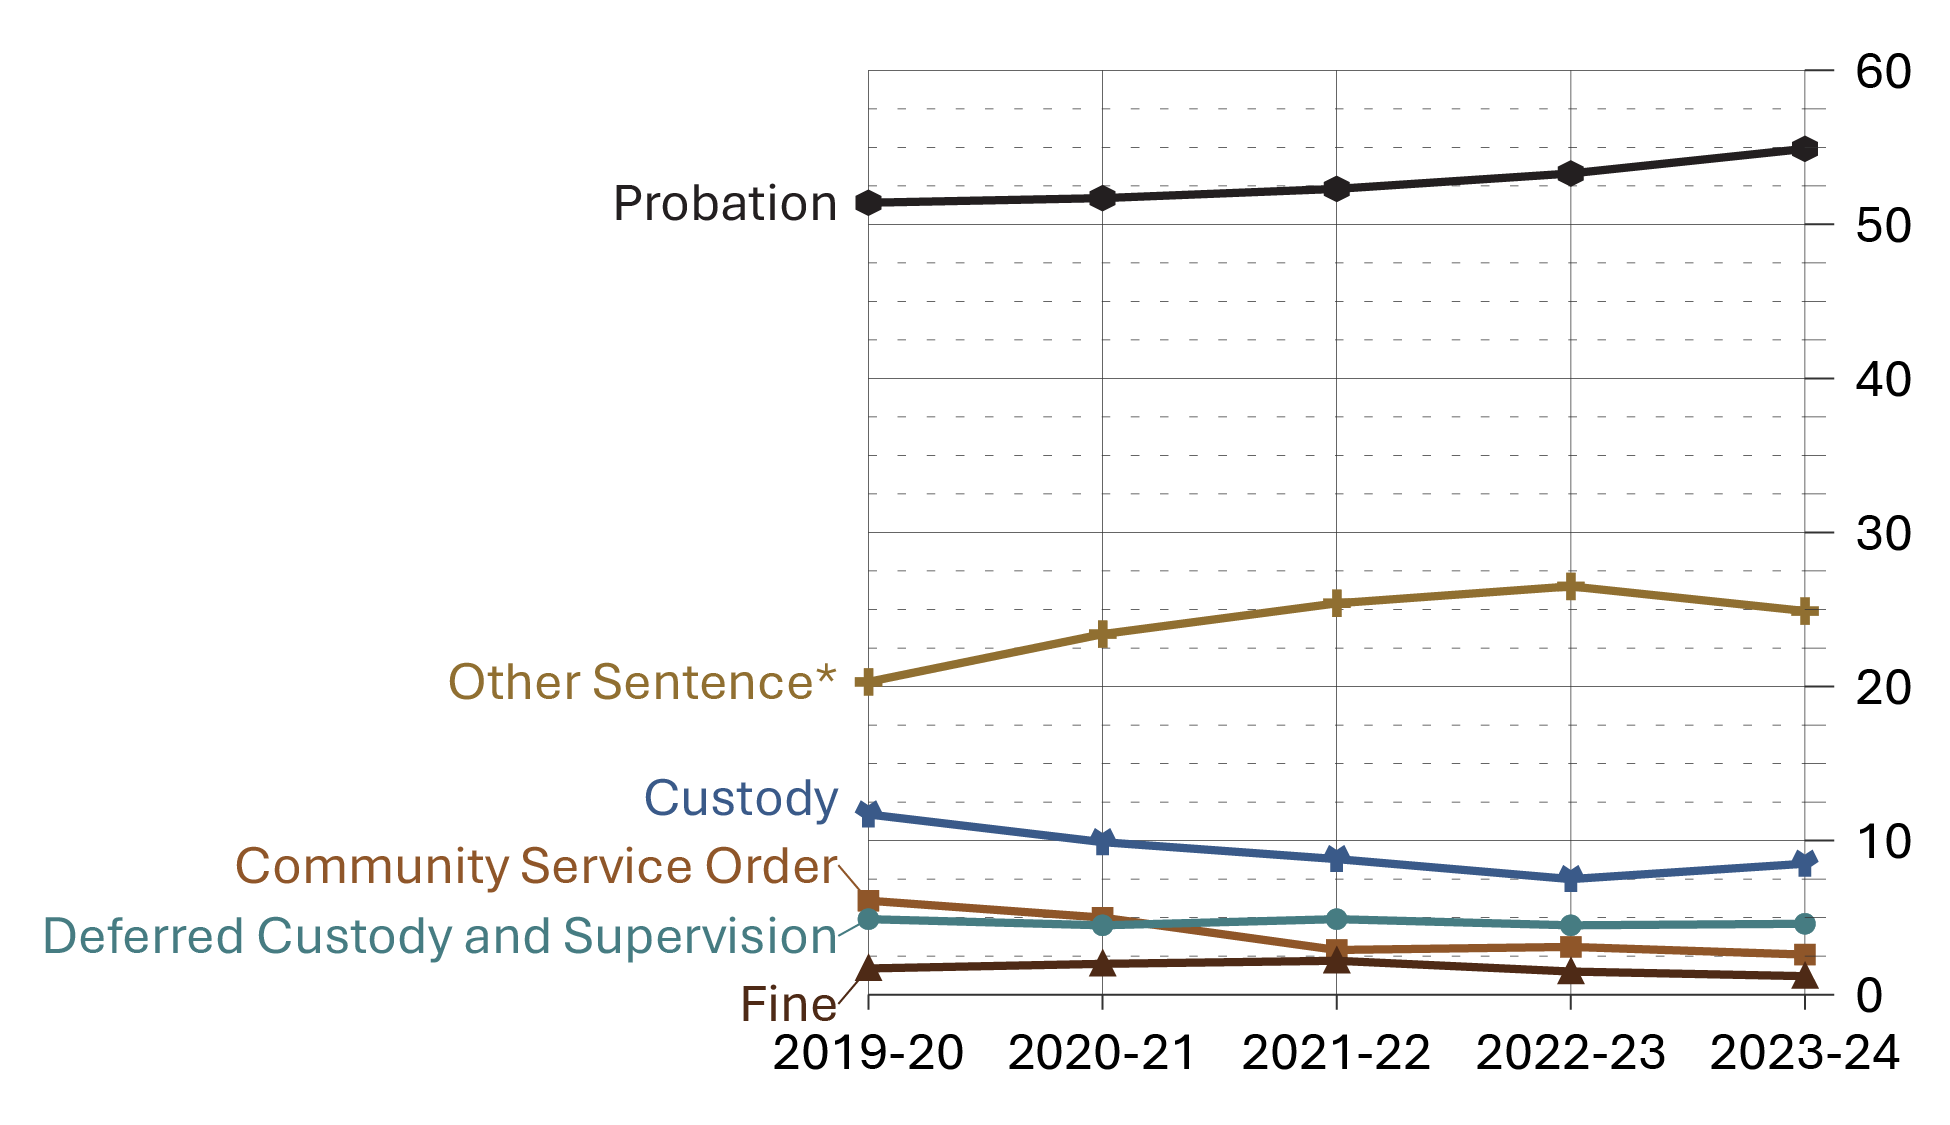
Image description
Line graph showing the percentage of youth criminal court sentences by most serious sentence between fiscal years 2019-20 and 2023-24. The graph includes probation, custody, community service order, deferred custody and supervision order, fine, and other sentences. Probation represents the largest proportion, followed by other sentence, which accounted for roughly half of the proportion of probation. Fine was the least frequently used sentence over the 5-year fiscal period. Full data are available in the table below.
Source: Statistics Canada. Table 35-10-0042-01, Youth courts, guilty cases by most serious sentence.
- In 2023-24, 54.9% of youth found guilty were given probation as the most serious sentence. This rate has remained relatively stable since the implementation of the Youth Criminal Justice Act in April 2003.
- Of the Youth Criminal Justice Act sentences in 2023-24, fine orders were the least frequent sentences (1.2%), followed by community service orders (2.6%).
Figure A16 Notes
*Other sentence includes absolute discharge, restitution, prohibition, seizure, forfeiture, compensation, pay purchaser, essays, apologies, counselling programs and conditional discharge, conditional sentence, intensive support and supervision, attendance at non-residential program(s), and reprimand. This category also includes intensive support and supervision, attendance at non-residential program(s) and reprimand where sentencing data under the Youth Criminal Justice Act are not available.
Table A16. Percentage of youth criminal court sentence for most serious sentence
| Sex | 2019-20 | 2020-21 | 2021-22 | 2022-23 | 2023-24 |
|---|---|---|---|---|---|
| Female | 49.2 | 47.1 | 49.9 | 53.1 | 54.9 |
| Male | 51.6 | 53.2 | 52.6 | 52.5 | 54.2 |
| Total | 51.4 | 51.7 | 52.3 | 53.3 | 54.9 |
| Sex | 2019-20 | 2020-21 | 2021-22 | 2022-23 | 2023-24 |
|---|---|---|---|---|---|
| Female | 4.7 | 4.3 | 4.2 | 2.9 | 4.0 |
| Male | 12.8 | 10.6 | 9.5 | 8.1 | 9.4 |
| Total | 11.7 | 9.9 | 8.8 | 7.5 | 8.5 |
| Sex | 2019-20 | 2020-21 | 2021-22 | 2022-23 | 2023-24 |
|---|---|---|---|---|---|
| Female | 7.5 | 6.9 | 3.8 | 3.6 | 2.1 |
| Male | 5.3 | 4.7 | 1.9 | 2.6 | 2.4 |
| Total | 6.1 | 5.0 | 2.9 | 3.1 | 2.6 |
| Sex | 2019-20 | 2020-21 | 2021-22 | 2022-23 | 2023-24 |
|---|---|---|---|---|---|
| Female | 3.7 | 3.4 | 3.9 | 3.8 | 3.0 |
| Male | 5.3 | 4.7 | 5.2 | 5.0 | 5.3 |
| Total | 4.9 | 4.5 | 4.9 | 4.5 | 4.6 |
| Sex | 2019-20 | 2020-21 | 2021-22 | 2022-23 | 2023-24 |
|---|---|---|---|---|---|
| Female | 1.3 | 2.0 | 1.4 | 0.5 | 0.7 |
| Male | 1.6 | 1.9 | 2.2 | 1.7 | 1.3 |
| Total | 1.7 | 2.0 | 2.2 | 1.5 | 1.2 |
| Sex | 2019-20 | 2020-21 | 2021-22 | 2022-23 | 2023-24 |
|---|---|---|---|---|---|
| Female | 27.3 | 31.2 | 31.1 | 31.9 | 31.3 |
| Male | 19.6 | 21.6 | 25.3 | 26.5 | 24.0 |
| Total | 20.3 | 23.4 | 25.4 | 26.5 | 24.9 |
Source: Statistics Canada. Table 35-10-0042-01, Youth courts, guilty cases by most serious sentence.
Table A16 Notes
International incarceration rates
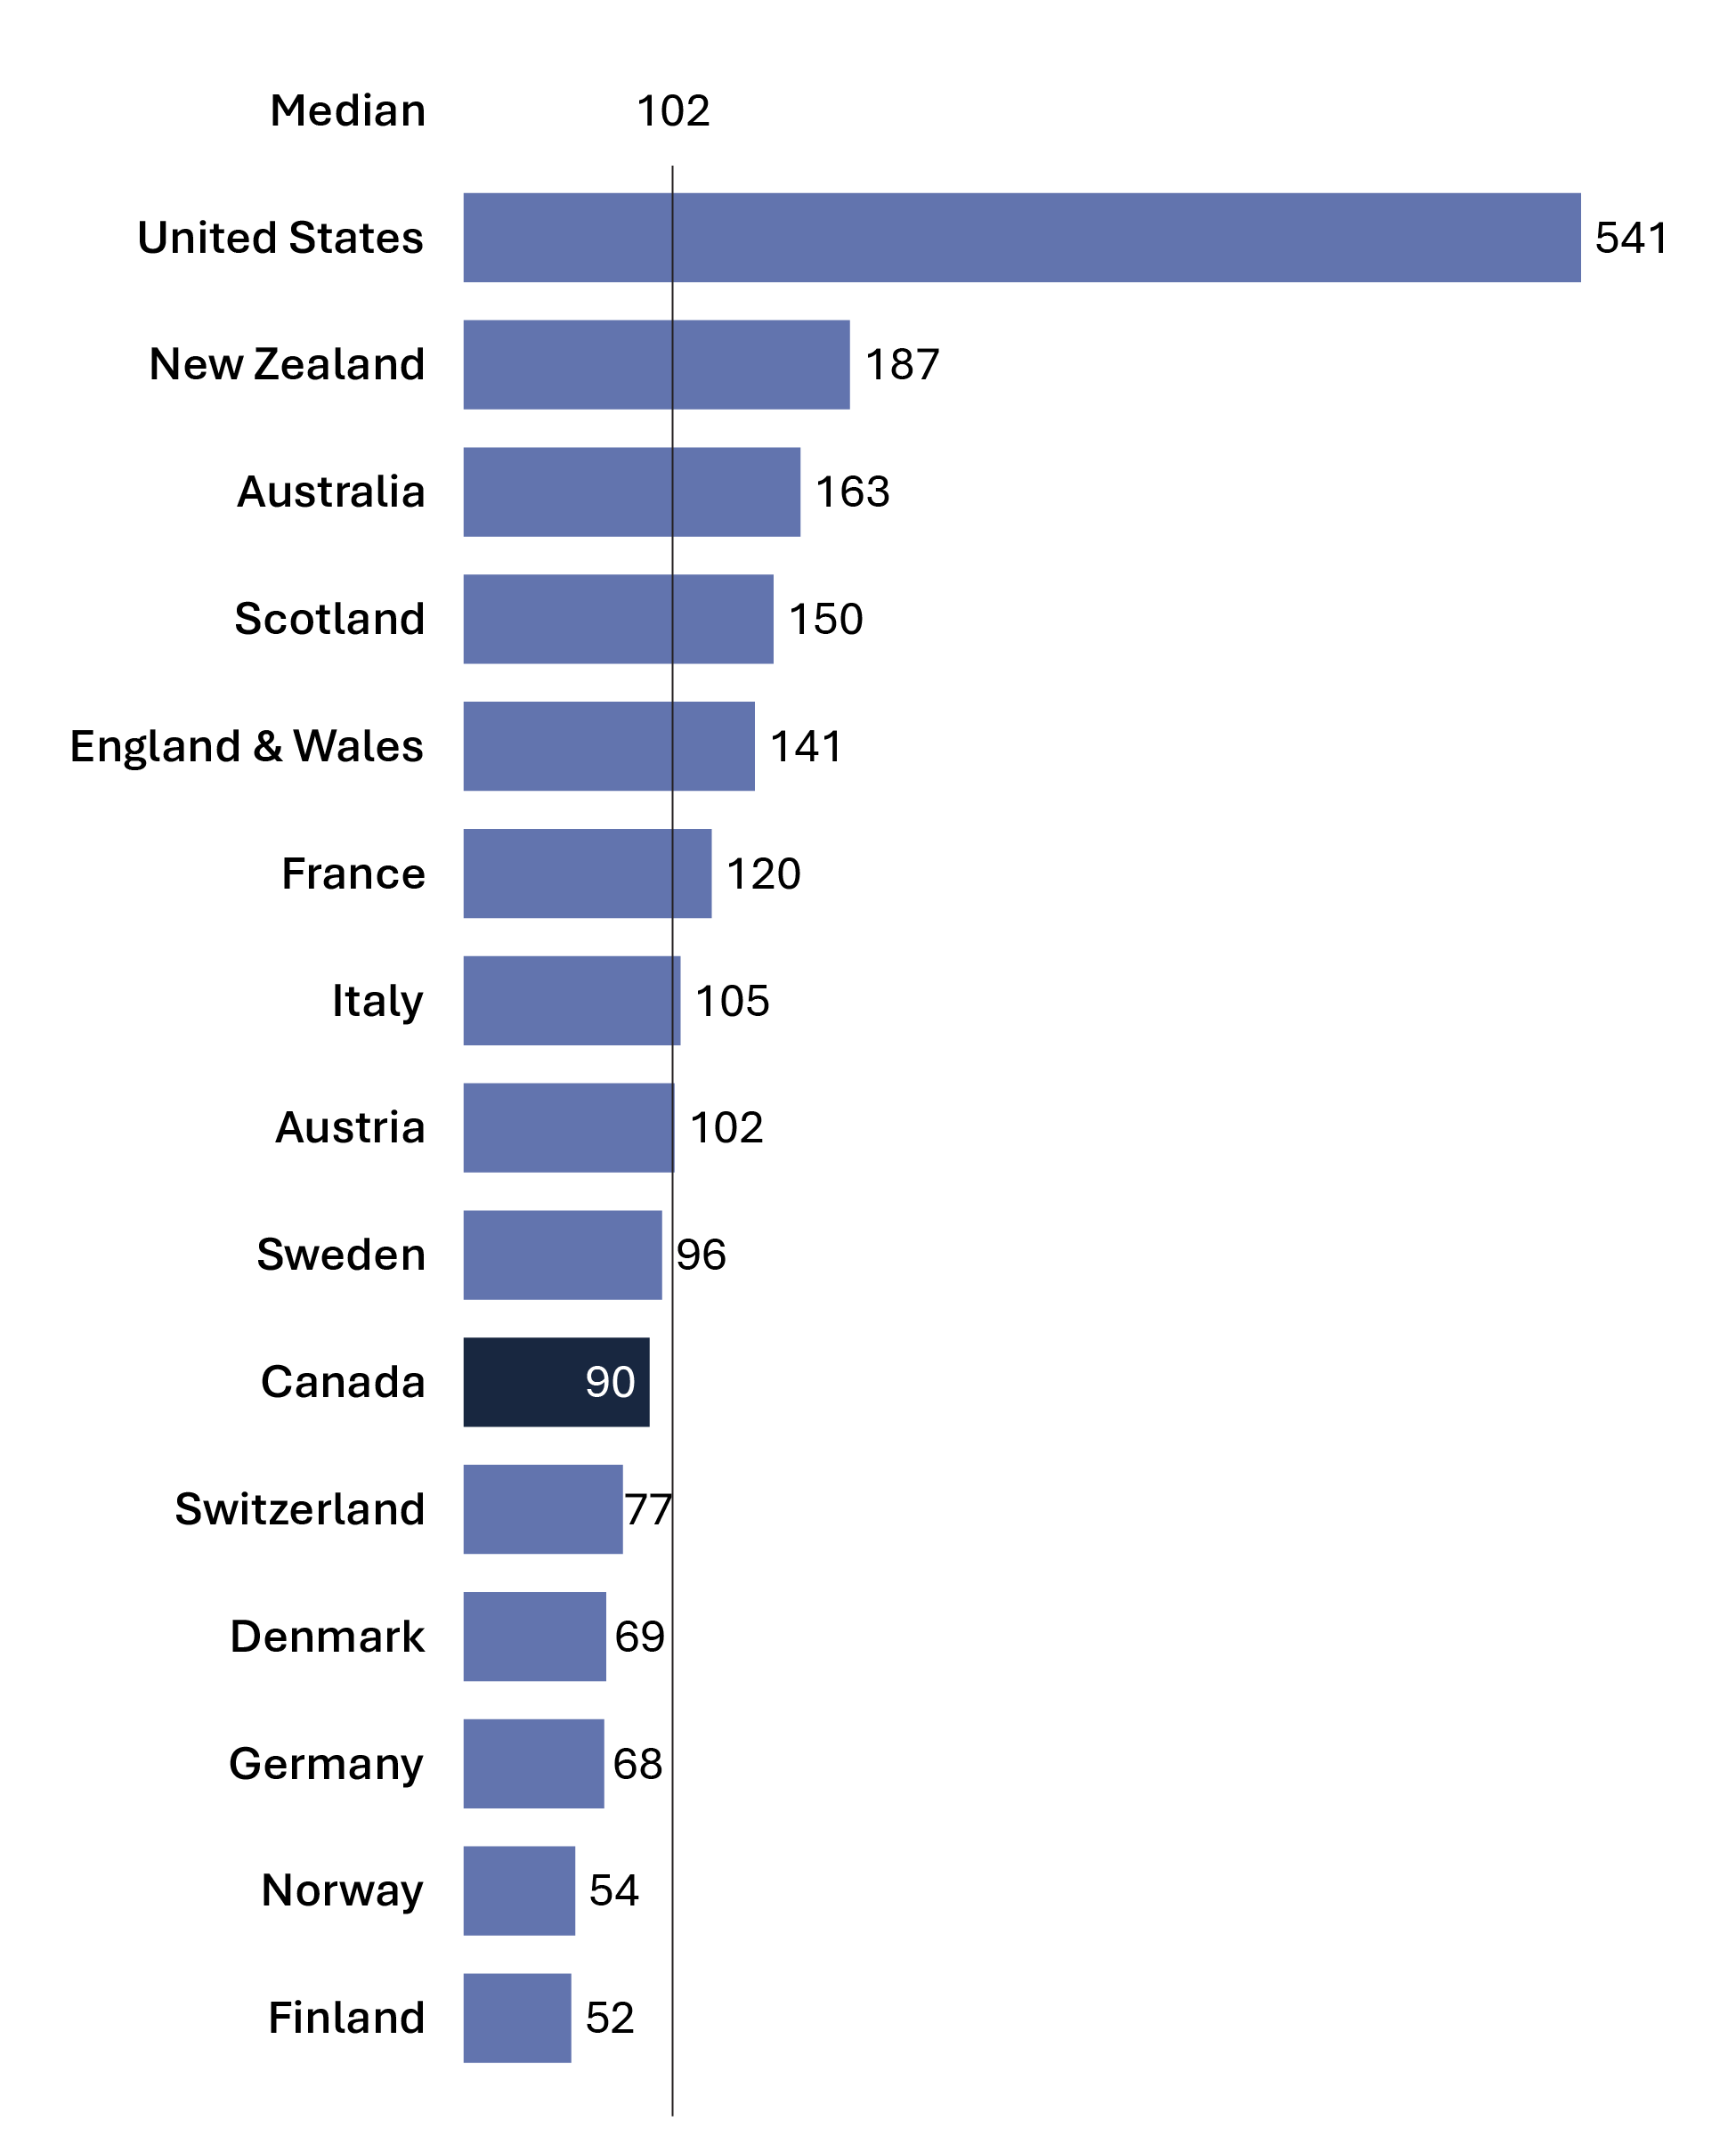
Image description
Bar graph showing the prison population rates among 15 countries, per 100,000 population, for the calendar year 2024. Countries included are Canada, the United States, New Zealand, Australia, England & Wales, Scotland, France, Italy, Austria, Sweden, Switzerland, Denmark, Germany, Norway, and Finland. The graph includes a reference line for the median prison population rate among these countries; the median rate is 102. The United States has the greatest prison population rates, followed by New Zealand, Australia, and Scotland. Canada's prison population rate falls below the median rate, and is 10th out of the 15 countries reported. Full data are available in the table below.
Source: World Prison Brief, Institute for Crime & Justice Policy Research (ICPR) (www.prisonstudies.org/highest-to-lowest/prison-population-total).
- In 2024, Canada's incarceration rate was 90 per 100,000. When ranked from highest incarceration rate (i.e., 1) to lowest (i.e., 224), Canada's prison population rate was ranked 163 of 224 countries. Canada's incarceration rate is lower than the median of Western and European countries, and much lower than the United States where the incarceration rate was 541 per 100,000 in 2024.
- Finland's incarceration rate was 52 per 100,000, the lowest incarceration rate among western European countries.
Figure A17 Notes
The median is the middle value where half the values fall below the median and the other half above. The median is the preferred way to measure the average when there is an extreme outlier in the data.
| Country | 2015 | 2016 | 2017 | 2018 | 2019 | 2020 | 2021 | 2022 | 2023 | 2024 |
|---|---|---|---|---|---|---|---|---|---|---|
| United States | 698 | 693 | 666 | 655 | 655 | 639 | 629 | 505 | 531 | 541 |
| New Zealand | 190 | 203 | 214 | 214 | 201 | 188 | 150 | 157 | 173 | 187 |
| Australia | 151 | 152 | 168 | 172 | 170 | 160 | 165 | 165 | 158 | 163 |
| Scotland | 144 | 142 | 138 | 143 | 149 | 136 | 138 | 136 | 144 | 150 |
| England & Wales | 148 | 147 | 146 | 140 | 140 | 131 | 132 | 139 | 146 | 141 |
| France | 100 | 103 | 103 | 100 | 105 | 90 | 103 | 106 | 109 | 120 |
| Italy | 86 | 90 | 95 | 98 | 101 | 89 | 92 | 96 | 104 | 105 |
| Austria | 95 | 93 | 94 | 98 | 98 | 95 | 90 | 97 | 99 | 102 |
| Sweden | 60 | 53 | 57 | 59 | 61 | 68 | 73 | 74 | 82 | 96 |
| Canada | 106 | 114 | 114 | 114 | 107 | 104 | 104 | 85 | 88 | 90 |
| Switzerland | 84 | 83 | 82 | 81 | 81 | 80 | 73 | 72 | 73 | 77 |
| Denmark | 61 | 58 | 59 | 63 | 63 | 68 | 72 | 72 | 69 | 69 |
| Germany | 78 | 78 | 77 | 75 | 77 | 69 | 71 | 67 | 67 | 68 |
| Norway | 71 | 74 | 74 | 63 | 60 | 49 | 57 | 56 | 54 | 54 |
| Finland | 57 | 55 | 57 | 51 | 53 | 53 | 50 | 51 | 51 | 52 |
Source: World Prison Brief, Institute for Crime & Justice Policy Research (ICPR) (www.prisonstudies.org/highest-to-lowest/prison-population-total ).
Table A17 Notes
Table A17 and A18 display the same data for ease of reference and accessibility purposes.
The incarceration rate presented here is a measure of the number of people (i.e., adults and youth) in custody per 100,000 people in the general population. Incarceration rates from the World Prison Brief hosted by the Institute for Crime & Justice Policy Research (ICPR) are based on the most recently available data at the time the list was compiled. The data were retrieved online on April 2nd, 2025 from http://www.prisonstudies.org, which contains the most up-to-date information available. Additionally, different practices and variations in measurement in different countries limit the comparability of these figures.
International incarceration rates: 10-year trend
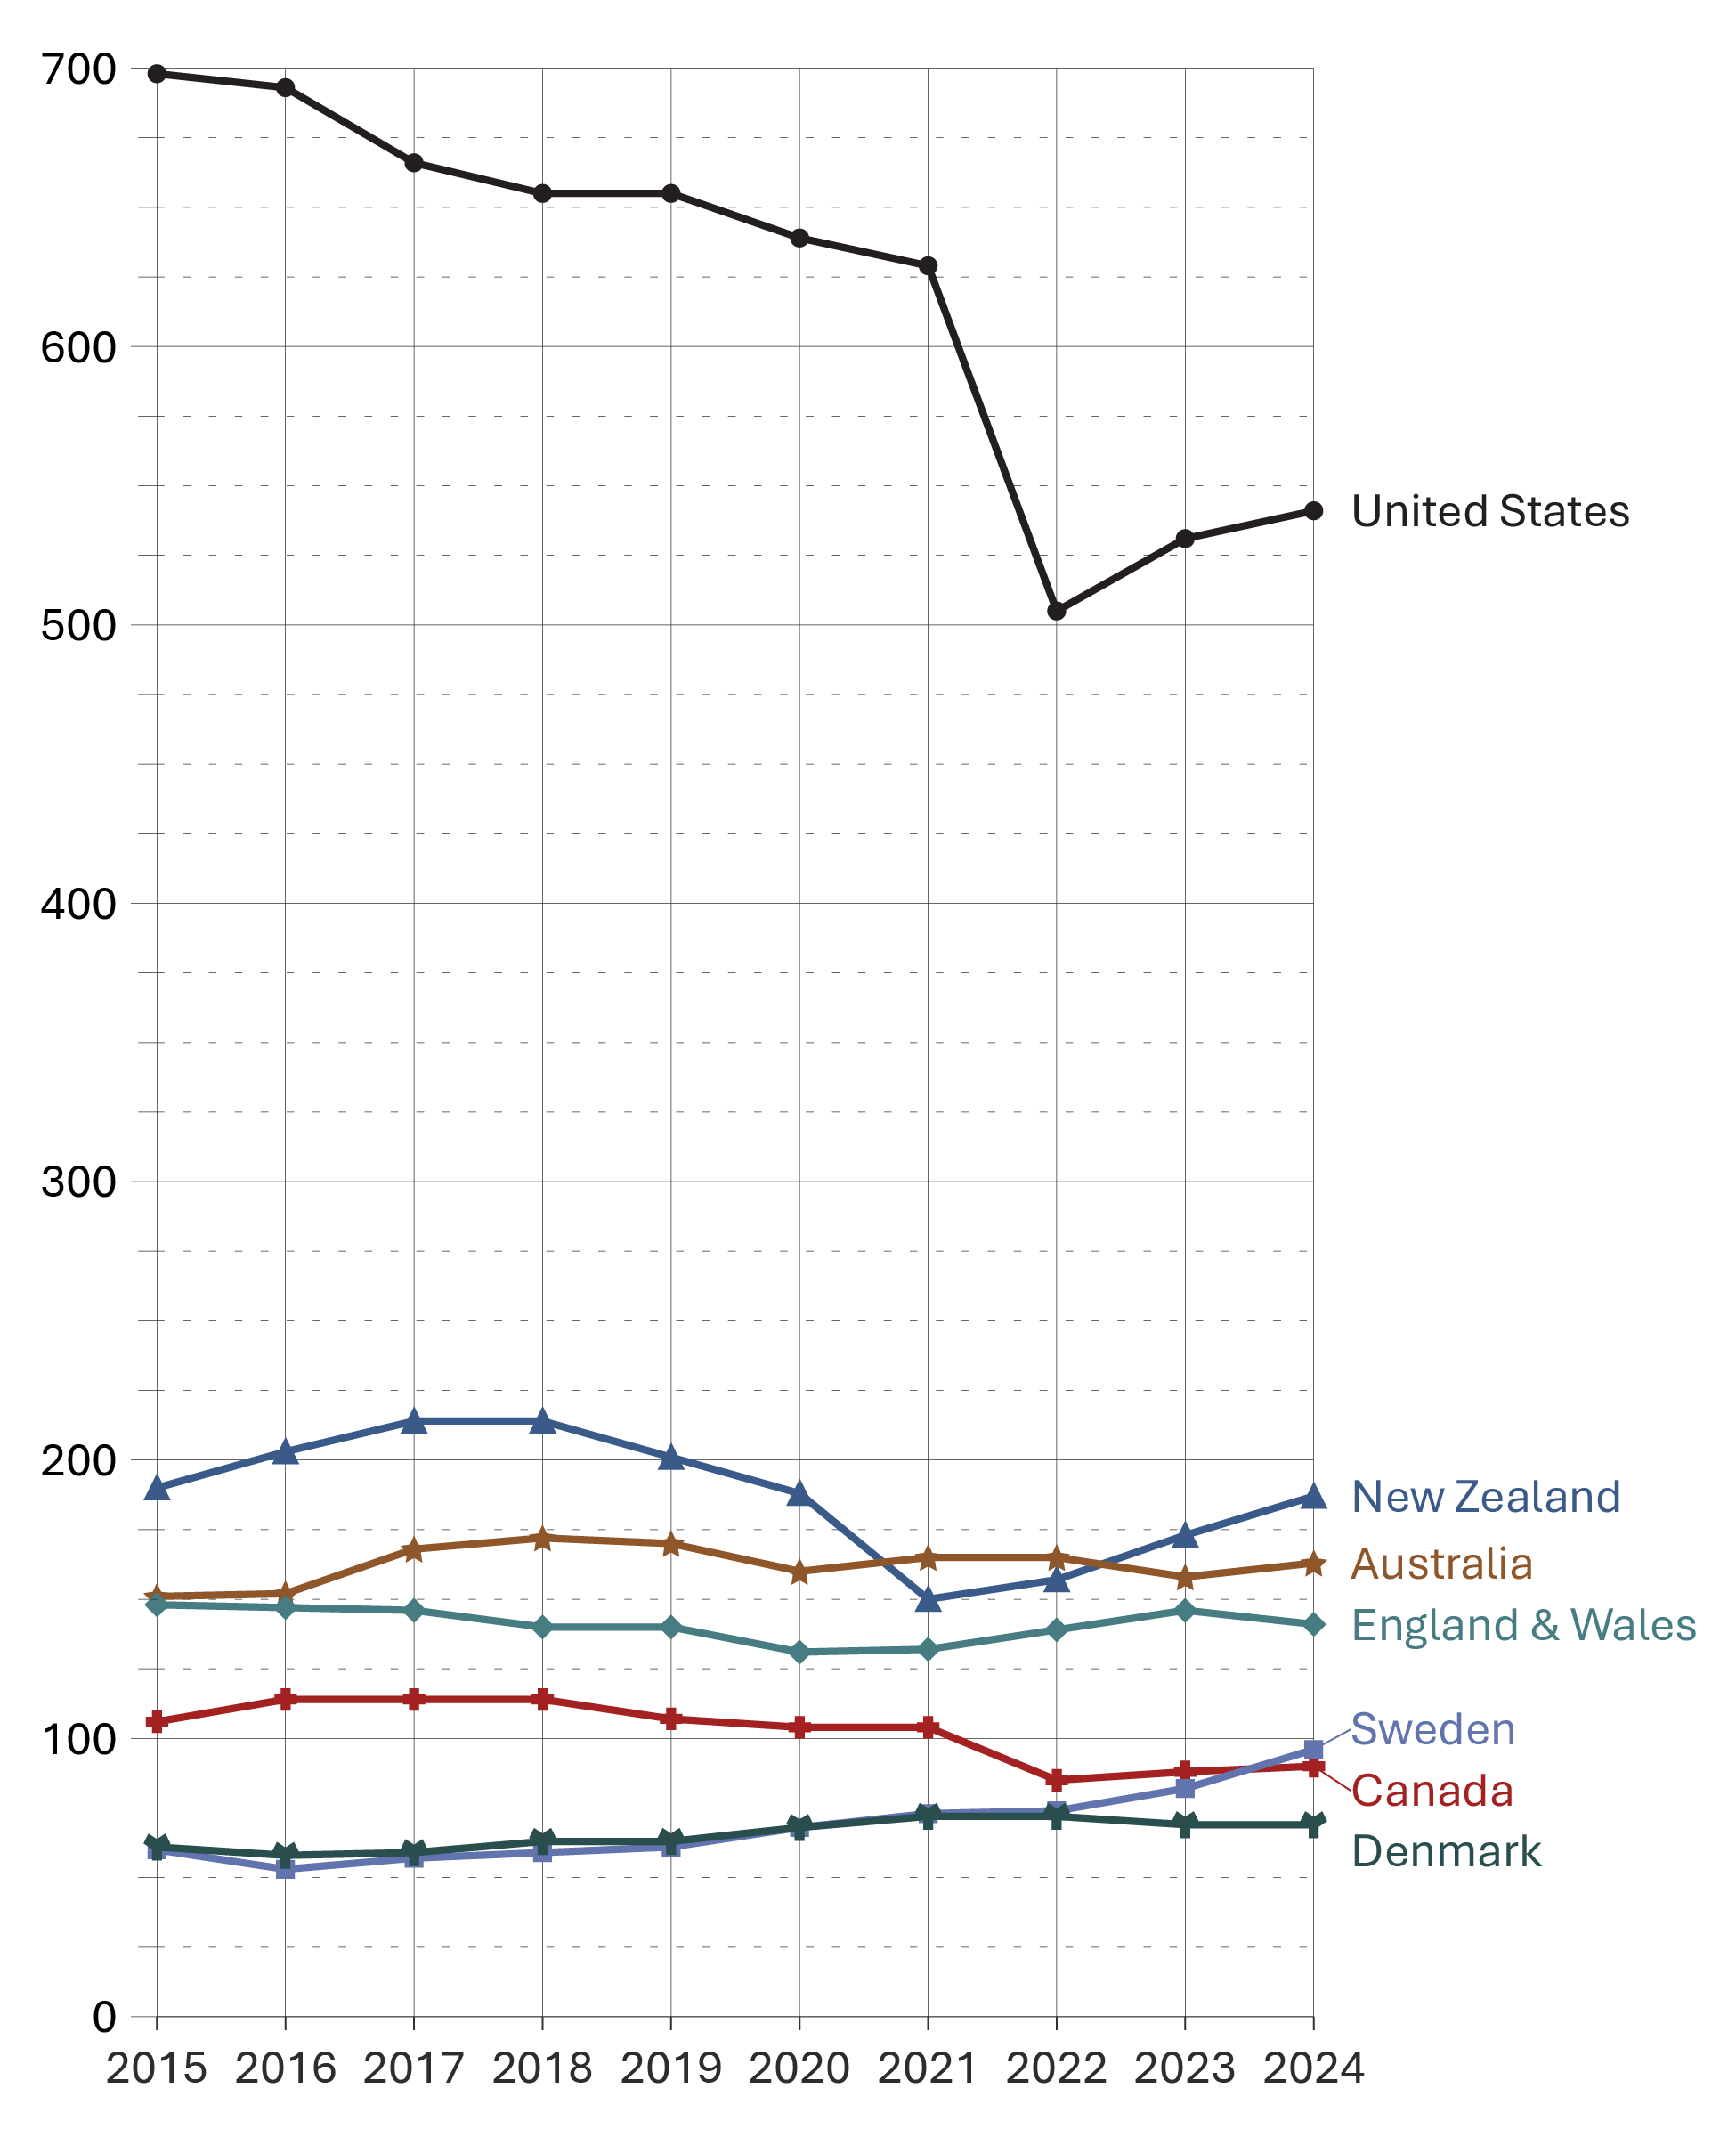
Image description
Line graph showing the prison population rate across 7 countries, per 100,000 population, between calendar year 2015 to 2024. Countries included are Canada, the United States, New Zealand, Australia, England and Wales, Sweden, and Denmark. The United States consistently has the highest prison population rate, far exceeding all other countries, while Canada, Sweden, and Denmark maintain the lowest rates throughout the 10-year period. Full data are available in the table below.
Source: World Prison Brief, Institute for Crime & Justice Policy Research (ICPR) (www.prisonstudies.org/highest-to-lowest/prison-population-total ).
- In the past 10 years (from 2015 to 2024), Canada's incarceration rate declined 15.1%.
- From 2015 to 2023, incarceration rates declined in 8 of the 16 countries displayed in the table below, while the remaining 8 countries increased. Notable decreases were the United States and Norway, with both countries reporting decreases of 23.9% between 2015 to 2023. Notable increases in the incarceration rate over the same time period were Sweden (+36.7%) and Italy (+20.9%).
- From 2023 to 2024, incarceration rates either remained stable or increased. The greatest increases were in Sweden (+17.1%) and France (+10.1%). The only country reporting a decrease in the incarceration rate between 2023 to 2024 was England & Wales (-3.4%).
| Country | 2015 | 2016 | 2017 | 2018 | 2019 | 2020 | 2021 | 2022 | 2023 | 2024 |
|---|---|---|---|---|---|---|---|---|---|---|
| United States | 698 | 693 | 666 | 655 | 655 | 639 | 629 | 505 | 531 | 541 |
| New Zealand | 190 | 203 | 214 | 214 | 201 | 188 | 150 | 157 | 173 | 187 |
| Australia | 151 | 152 | 168 | 172 | 170 | 160 | 165 | 165 | 158 | 163 |
| Scotland | 144 | 142 | 138 | 143 | 149 | 136 | 138 | 136 | 144 | 150 |
| England & Wales | 148 | 147 | 146 | 140 | 140 | 131 | 132 | 139 | 146 | 141 |
| France | 100 | 103 | 103 | 100 | 105 | 90 | 103 | 106 | 109 | 120 |
| Italy | 86 | 90 | 95 | 98 | 101 | 89 | 92 | 96 | 104 | 105 |
| Austria | 95 | 93 | 94 | 98 | 98 | 95 | 90 | 97 | 99 | 102 |
| Sweden | 60 | 53 | 57 | 59 | 61 | 68 | 73 | 74 | 82 | 96 |
| Canada | 106 | 114 | 114 | 114 | 107 | 104 | 104 | 85 | 88 | 90 |
| Switzerland | 84 | 83 | 82 | 81 | 81 | 80 | 73 | 72 | 73 | 77 |
| Denmark | 61 | 58 | 59 | 63 | 63 | 68 | 72 | 72 | 69 | 69 |
| Germany | 78 | 78 | 77 | 75 | 77 | 69 | 71 | 67 | 67 | 68 |
| Norway | 71 | 74 | 74 | 63 | 60 | 49 | 57 | 56 | 54 | 54 |
| Finland | 57 | 55 | 57 | 51 | 53 | 53 | 50 | 51 | 51 | 52 |
Source: World Prison Brief, Institute for Crime & Justice Policy Research (ICPR) (www.prisonstudies.org/highest-to-lowest/prison-population-total ).
Table A18 Notes
Table A17 and A18 display the same data for ease of reference and accessibility purposes.
The incarceration rate presented here is a measure of the number of people (i.e., adults and youth) in custody per 100,000 people in the general population. Incarceration rates from the World Prison Brief are based on the most recently available data at the time the list was compiled. The data were retrieved online on April 2nd, 2025 at www.prisonstudies.org, which contains the most up to date information available. Additionally, different practices and variations in measurement in different countries limit the comparability of these figures.
Section B: Corrections Administration
Costs of federal and provincial/territorial corrections
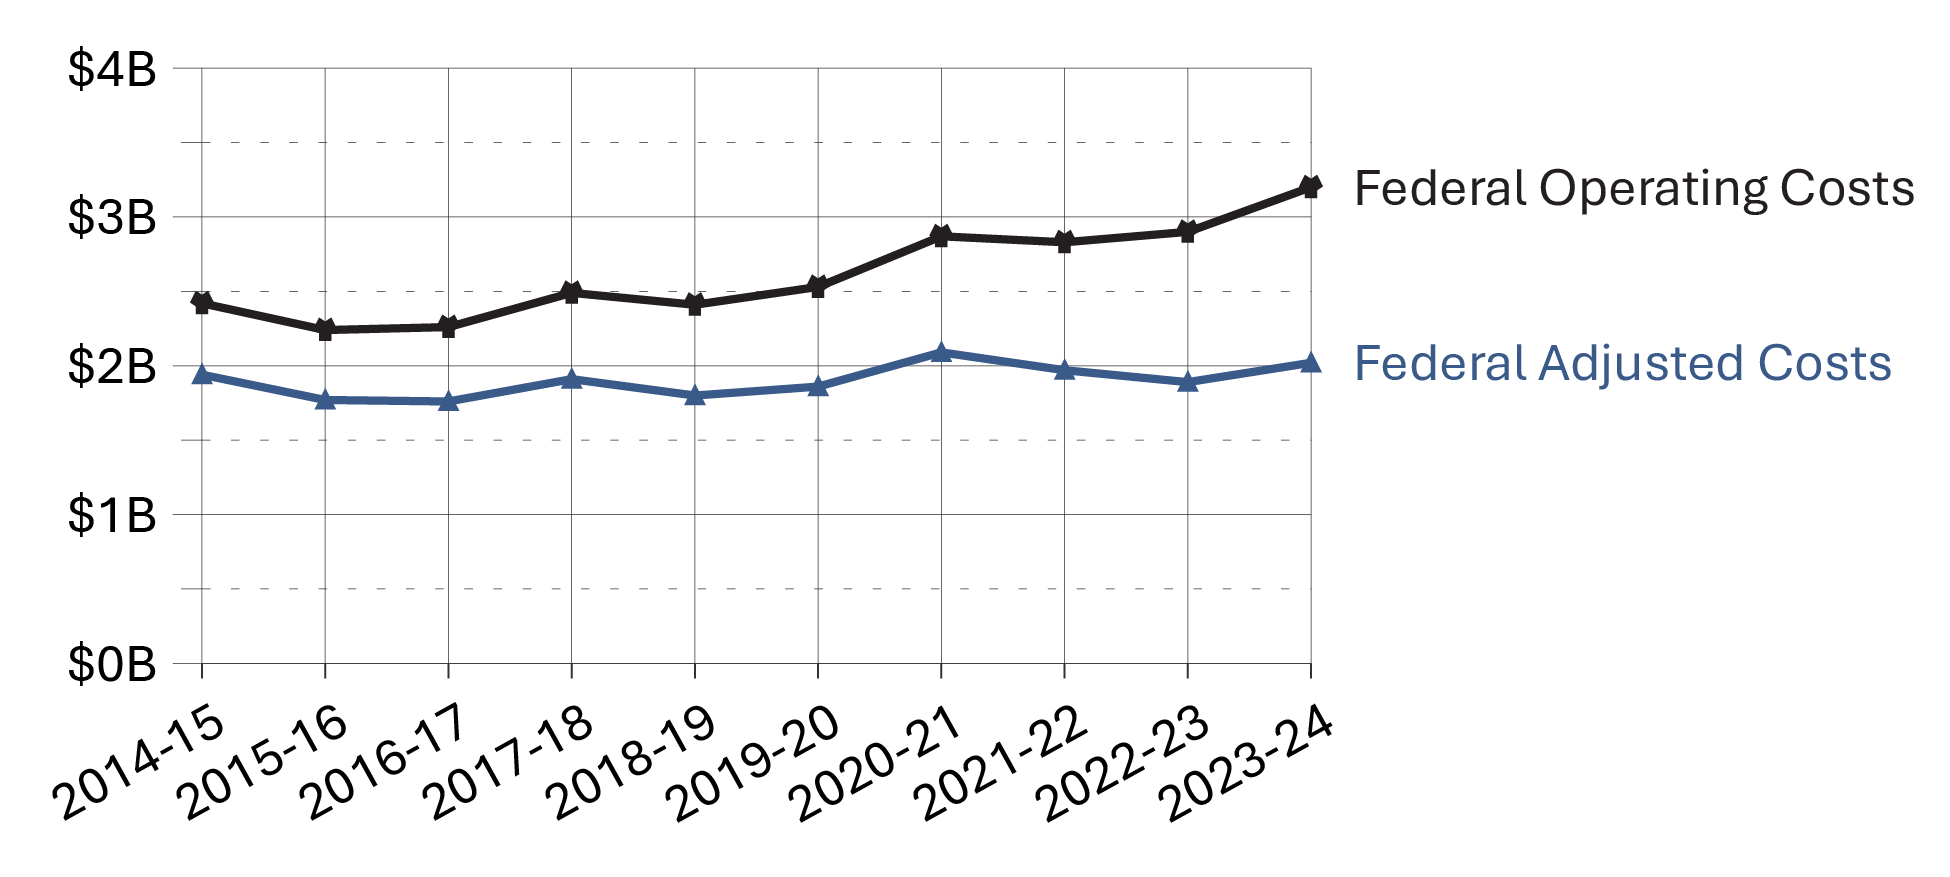
Image description
Line graph showing the costs of federal corrections between fiscal years 2014-15 and 2023-24. The graph includes federal operating costs and adjusted costs. Operating costs remain consistently higher than adjusted costs throughout the period and show a noticeable upward trend in recent years. Full data are available in the table below.
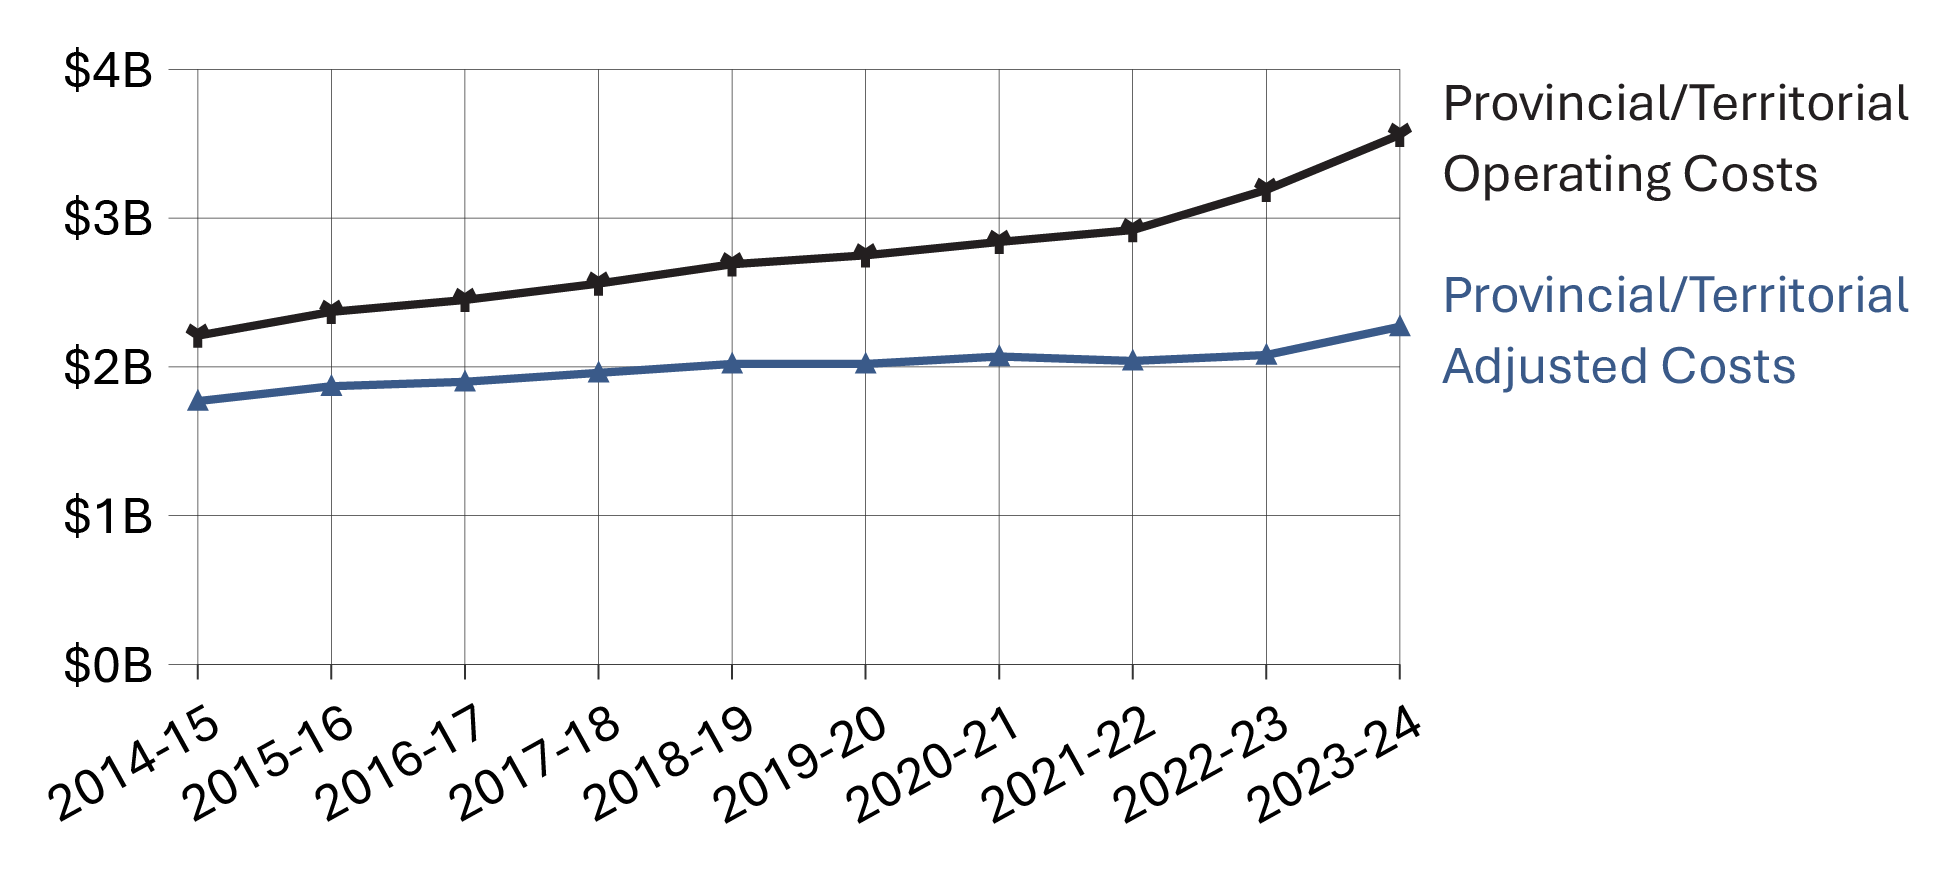
Image description
Line graph showing the costs of provincial/territorial corrections between fiscal years 2014-15 and 2023-24. The graph includes operating costs and adjusted costs. Operating costs remain consistently higher than adjusted costs throughout the period and show a sharp upward trend in recent years, while adjusted costs also increase but at a slower pace. Full data are available in the table below.
Sources:
- Costs of federal corrections were about $3.2 billion in 2023-24. This was a 10.4% increase compared to the prior year and 32.0% higher than 2014-15. When considering adjusted costs, there was a 4.4% increase in spending between 2014-15 to 2023-24.
- Costs of provincial/territorial corrections were about $3.6 billion in 2023-24. This represented an 11.5% increase from 2022-23, and a 60.9% increase since 2014-15. When considering adjusted costs, there was a 28.2% increase in spending between 2014-15 to 2023-24.
Table B1a. Federal corrections costs in current dollars
| Organization | Operating ($'000) | Capital ($'000) | Total ($'000) | Per capitaFootnote * ($) |
|---|---|---|---|---|
| CSC | 2,477,237 | 164,643 | 2,641,879 | 70.28 |
| PBC | 51,489 | NA | 51,489 | 1.37 |
| OCI | 5,441 | NA | 5,441 | 0.14 |
| Total | 2,534,167 | 164,643 | 2,698,809 | 71.79 |
| Organization | Operating ($'000) | Capital ($'000) | Total ($'000) | Per capitaFootnote * ($) |
|---|---|---|---|---|
| CSC | 2,811,113 | 121,987 | 2,933,100 | 77.17 |
| PBC | 57,745 | NA | 57,745 | 1.52 |
| OCI | 5,304 | NA | 5,304 | 0.14 |
| Total | 2,874,162 | 121,987 | 2,996,149 | 78.83 |
| Organization | Operating ($'000) | Capital ($'000) | Total ($'000) | Per capitaFootnote * ($) |
|---|---|---|---|---|
| CSC | 2,764,000 | 146,976 | 2,910,977 | 76.12 |
| PBC | 58,753 | NA | 58,753 | 1.54 |
| OCI | 5,467 | NA | 5,467 | 0.14 |
| Total | 2,828,220 | 146,976 | 2,975,197 | 77.80 |
| Organization | Operating ($'000) | Capital ($'000) | Total ($'000) | Per capitaFootnote * ($) |
|---|---|---|---|---|
| CSC | 2,824,285 | 199,357 | 3,023,642 | 77.66 |
| PBC | 68,776 | NA | 68,776 | 1.77 |
| OCI | 5,478 | NA | 5,478 | 0.14 |
| Total | 2,898,539 | 199,357 | 3,097,896 | 79.56 |
| Organization | Operating ($'000) | Capital ($'000) | Total ($'000) | Per capitaFootnote * ($) |
|---|---|---|---|---|
| CSC | 3,116,475 | 256,363 | 3,372,838 | 84.15 |
| PBC | 77,448 | NA | 77,448 | 1.93 |
| OCI | 5,575 | NA | 5,575 | 0.14 |
| Total | 3,199,498 | 256,363 | 3,455,861 | 86.22 |
Sources: Federal costs are from Correctional Service Canada; Office of the Correctional Investigator; Parole Board of Canada.
Table B1b. Federal corrections costs in constant 2002 dollars
| Organization | Operating ($'000) | Capital ($'000) | Total ($'000) | Per capitaFootnote * ($) |
|---|---|---|---|---|
| CSC | 1,821,498 | 121,061 | 1,942,558 | 51.67 |
| PBC | 37,860 | NA | 37,860 | 1.01 |
| OCI | 4,001 | NA | 4,001 | 0.11 |
| Total | 1,863,358 | 121,061 | 1,984,418 | 52.79 |
| Organization | Operating ($'000) | Capital ($'000) | Total ($'000) | Per capitaFootnote * ($) |
|---|---|---|---|---|
| CSC | 2,044,446 | 88,718 | 2,133,164 | 56.13 |
| PBC | 41,996 | NA | 41,996 | 1.10 |
| OCI | 3,857 | NA | 3,857 | 0.10 |
| Total | 2,090,300 | 88,718 | 2,179,017 | 57.33 |
| Organization | Operating ($'000) | Capital ($'000) | Total ($'000) | Per capitaFootnote * ($) |
|---|---|---|---|---|
| CSC | 1,924,344 | 102,327 | 2,026,672 | 53.00 |
| PBC | 40,905 | NA | 40,905 | 1.07 |
| OCI | 3,806 | NA | 3,806 | 0.10 |
| Total | 1,969,055 | 102,327 | 2,071,383 | 54.17 |
| Organization | Operating ($'000) | Capital ($'000) | Total ($'000) | Per capitaFootnote * ($) |
|---|---|---|---|---|
| CSC | 1,844,431 | 130,192 | 1,974,623 | 50.71 |
| PBC | 44,915 | NA | 44,915 | 1.15 |
| OCI | 3,577 | NA | 3,577 | 0.09 |
| Total | 1,892,923 | 130,192 | 2,023,116 | 51.96 |
| Organization | Operating ($'000) | Capital ($'000) | Total ($'000) | Per capitaFootnote * ($) |
|---|---|---|---|---|
| CSC | 1,969,834 | 162,040 | 2,131,874 | 53.19 |
| PBC | 48,953 | NA | 48,953 | 1.22 |
| OCI | 3,524 | NA | 3,524 | 0.09 |
| Total | 2,022,311 | 162,040 | 2,184,351 | 54.50 |
Sources: Correctional Service Canada; Office of the Correctional Investigator; Parole Board of Canada.
Table B1 Notes
Number of CSC employees by location
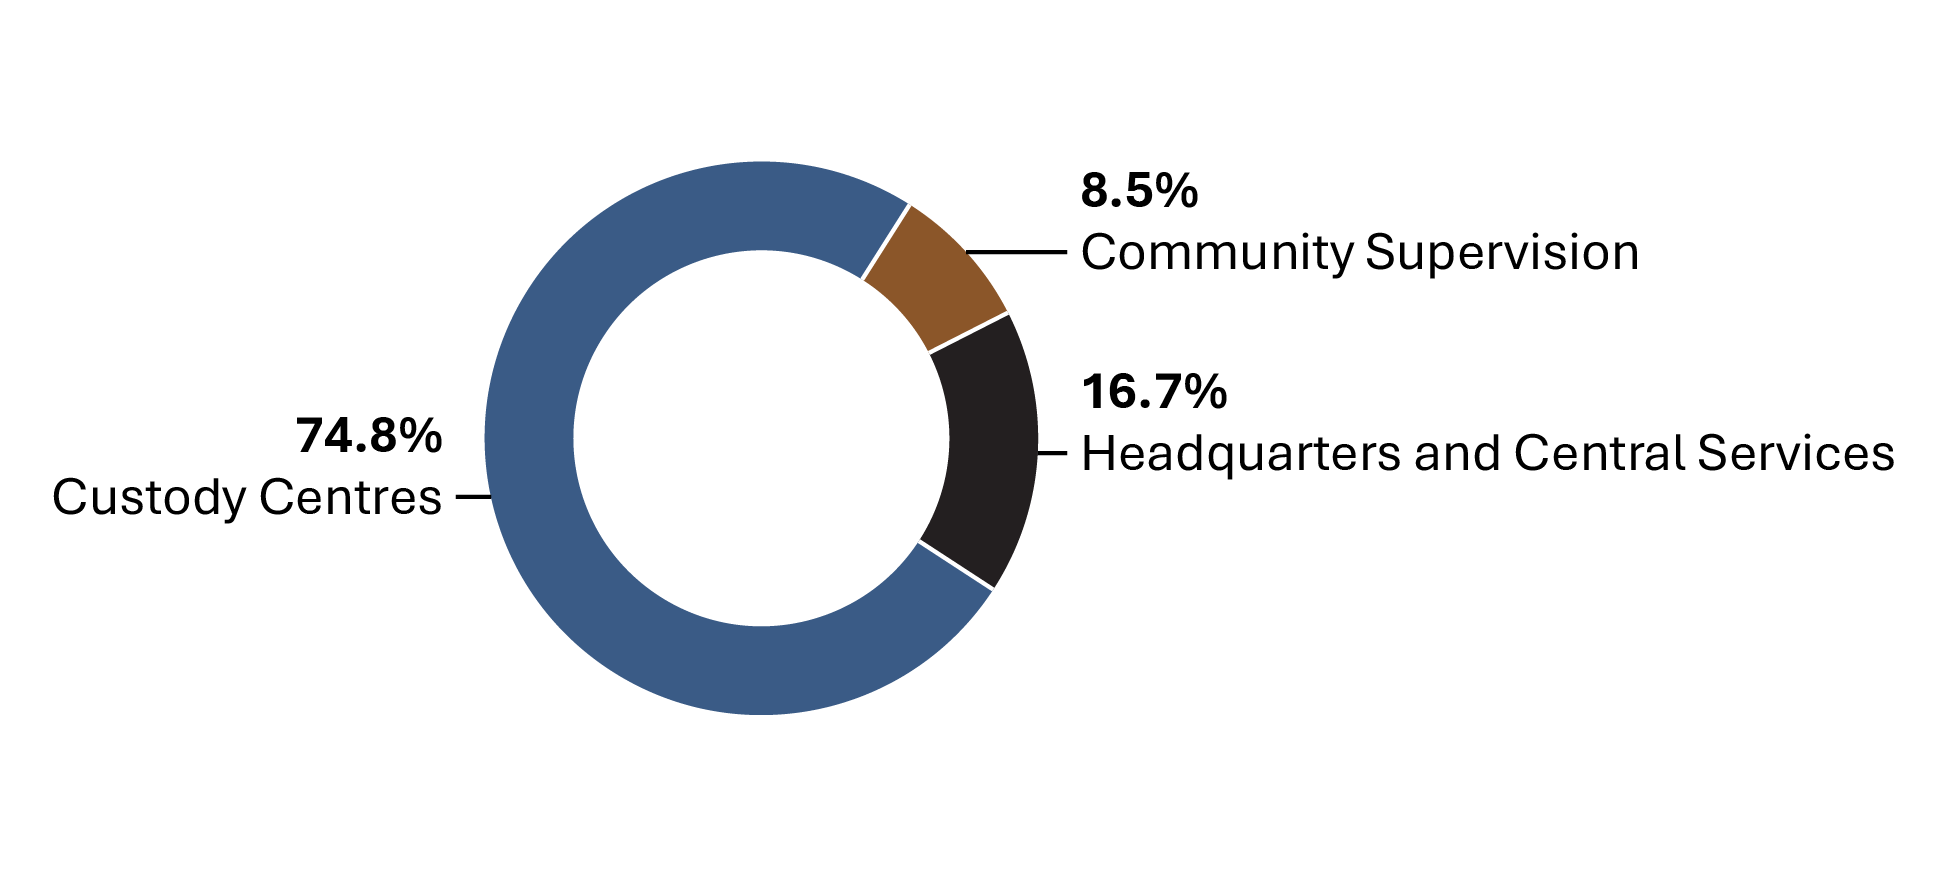
Image description
Donut chart showing the percentage of Correctional Service of Canada employees by service area at the end of the 2023-24 fiscal year. The chart includes employee locations: custody centers, community supervision, and headquarters and central services. The majority of Correctional Service of Canada employees are located in custody centres. A smaller proportion of employees are located in headquarters and central services, and an even smaller proportion are dedicated to community supervision. Full data are available in the table below.
Source: Correctional Service of Canada.
- The Correctional Service of Canada (CSC) has a total staff of 18,605.
- 74.8% of CSC staff work in institutions.
- Staff employed in community supervision account for 8.5% of the total number of CSC employees.
| Service area | March 31, 2015 | % | March 31, 2024 | % |
|---|---|---|---|---|
| Headquarters and central services total | 2,641 | 15.0 | 3,106 | 16.7 |
Administration |
2,256 | 12.8 | 2,209 | 11.9 |
Program staff |
71 | 0.4 | 66 | 0.4 |
Health care |
95 | 0.5 | 92 | 0.5 |
Correctional officers |
29 | 0.2 | 44 | 0.2 |
Instructors/supervisors |
9 | 0.1 | 15 | 0.1 |
Parole officers/parole supervisorsFootnote * |
2 | 0.0 | 1 | 0.0 |
OtherFootnote ** |
179 | 1.0 | 679 | 3.6 |
| Custody centres total | 13,510 | 76.9 | 13,925 | 74.8 |
Administration |
1,838 | 10.5 | 1,800 | 9.7 |
Program staff |
888 | 5.1 | 1,094 | 5.9 |
Health care |
882 | 5.0 | 1,121 | 6.0 |
Correctional officers |
7,730 | 44.0 | 7,299 | 39.2 |
Instructors/supervisors |
369 | 2.1 | 430 | 2.3 |
Parole officers/parole supervisorsFootnote * |
665 | 3.8 | 589 | 3.2 |
OtherFootnote ** |
1,138 | 6.5 | 1,592 | 8.6 |
| Community supervision total | 1,408 | 8.0 | 1,574 | 8.5 |
Administration |
367 | 2.1 | 371 | 2.0 |
Program staff |
280 | 1.6 | 268 | 1.4 |
Health care |
74 | 0.4 | 86 | 0.5 |
Correctional officers |
0 | 0.0 | NA | NA |
Parole officers/parole supervisors |
686 | 3.9 | 816 | 4.4 |
OtherFootnote ** |
1 | 0.0 | 33 | 0.2 |
| Total | 17,559 | 100.0 | 18,605 | 100.0 |
Source: Correctional Service of Canada.
Table B2 Notes
Cost of incarceration in a federal institution: 5-year trend
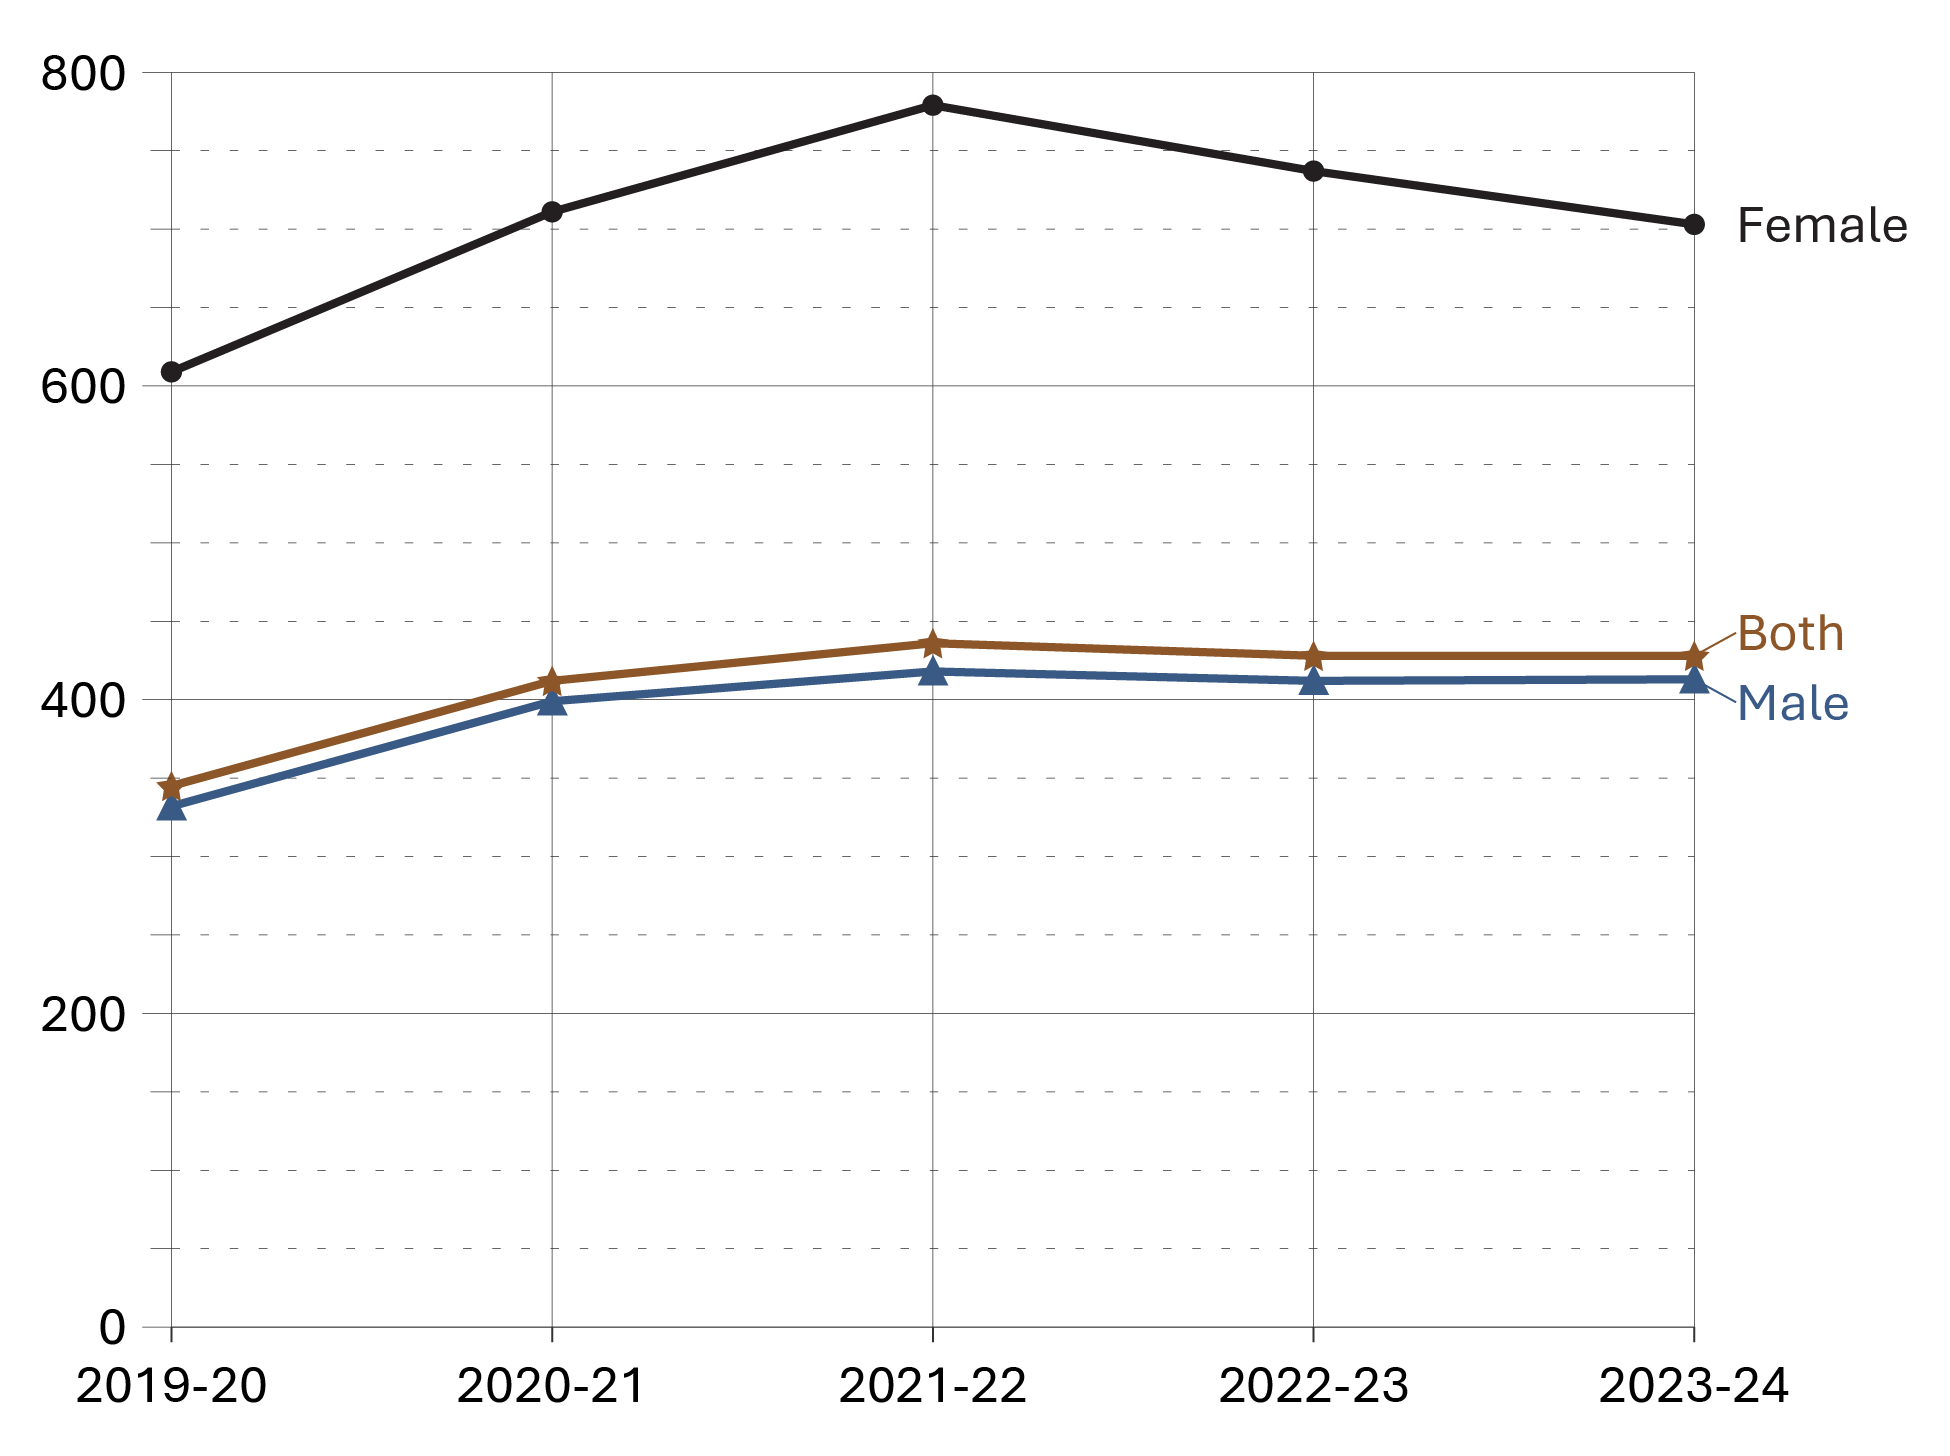
Image description
Line graph showing the cost of incarceration in a federal institution as an average daily inmate cost in current dollars between fiscal years 2019-20 and 2023-24. The graph includes the federal average daily inmate cost for males, females, and both offender groups in custody. Costs are consistently highest for females, while those for males and the combined group remain much lower, with the combined cost only slightly above that for males. Full data are available in the table below.
Source: Correctional Service of Canada.
- The federal average daily inmate cost has increased from $345 in 2019-20 to $428 in 2023-24. In 2023-24, the annual average cost of keeping an inmate incarcerated was $156,744 per year, an increase from $126,253 per year in 2019-20. In 2023-24, the annual average cost of keeping a male incarcerated was $150,666 per year, whereas the annual average cost for incarcerating a female was $256,682.
- The cost associated with maintaining an offender in the community is 69.7% less than what it costs to maintain an offender in custody ($47,522 per year versus $156,744 per year).
| Categories | 2019-20 | 2020-21 | 2021-22 | 2022-23 | 2023-24 |
|---|---|---|---|---|---|
| Maximum security (men's facilities) | 174,939 | 204,048 | 221,993 | 223,071 | 214,426 |
| Medium security (men's facilities) | 111,243 | 131,533 | 135,676 | 134,281 | 136,263 |
| Minimum security (men's facilities) | 92,877 | 121,898 | 128,889 | 118,601 | 121,617 |
| Women's facilities | 222,942 | 259,654 | 284,157 | 268,829 | 256,682 |
| Exchange of services agreementsFootnote * (males and females) | 131,322 | 130,729 | 174,218 | 169,164 | 182,033 |
| Incarcerated average | 126,253 | 150,505 | 159,115 | 156,366 | 156,744 |
| Offenders in the community | 34,214 | 38,418 | 41,519 | 42,691 | 47,522 |
| Total incarcerated and in community | 104,963 | 119,735 | 128,478 | 131,423 | 137,248 |
Source: Correctional Service of Canada.
Table B3 Notes
The number of Parole Board of Canada employees
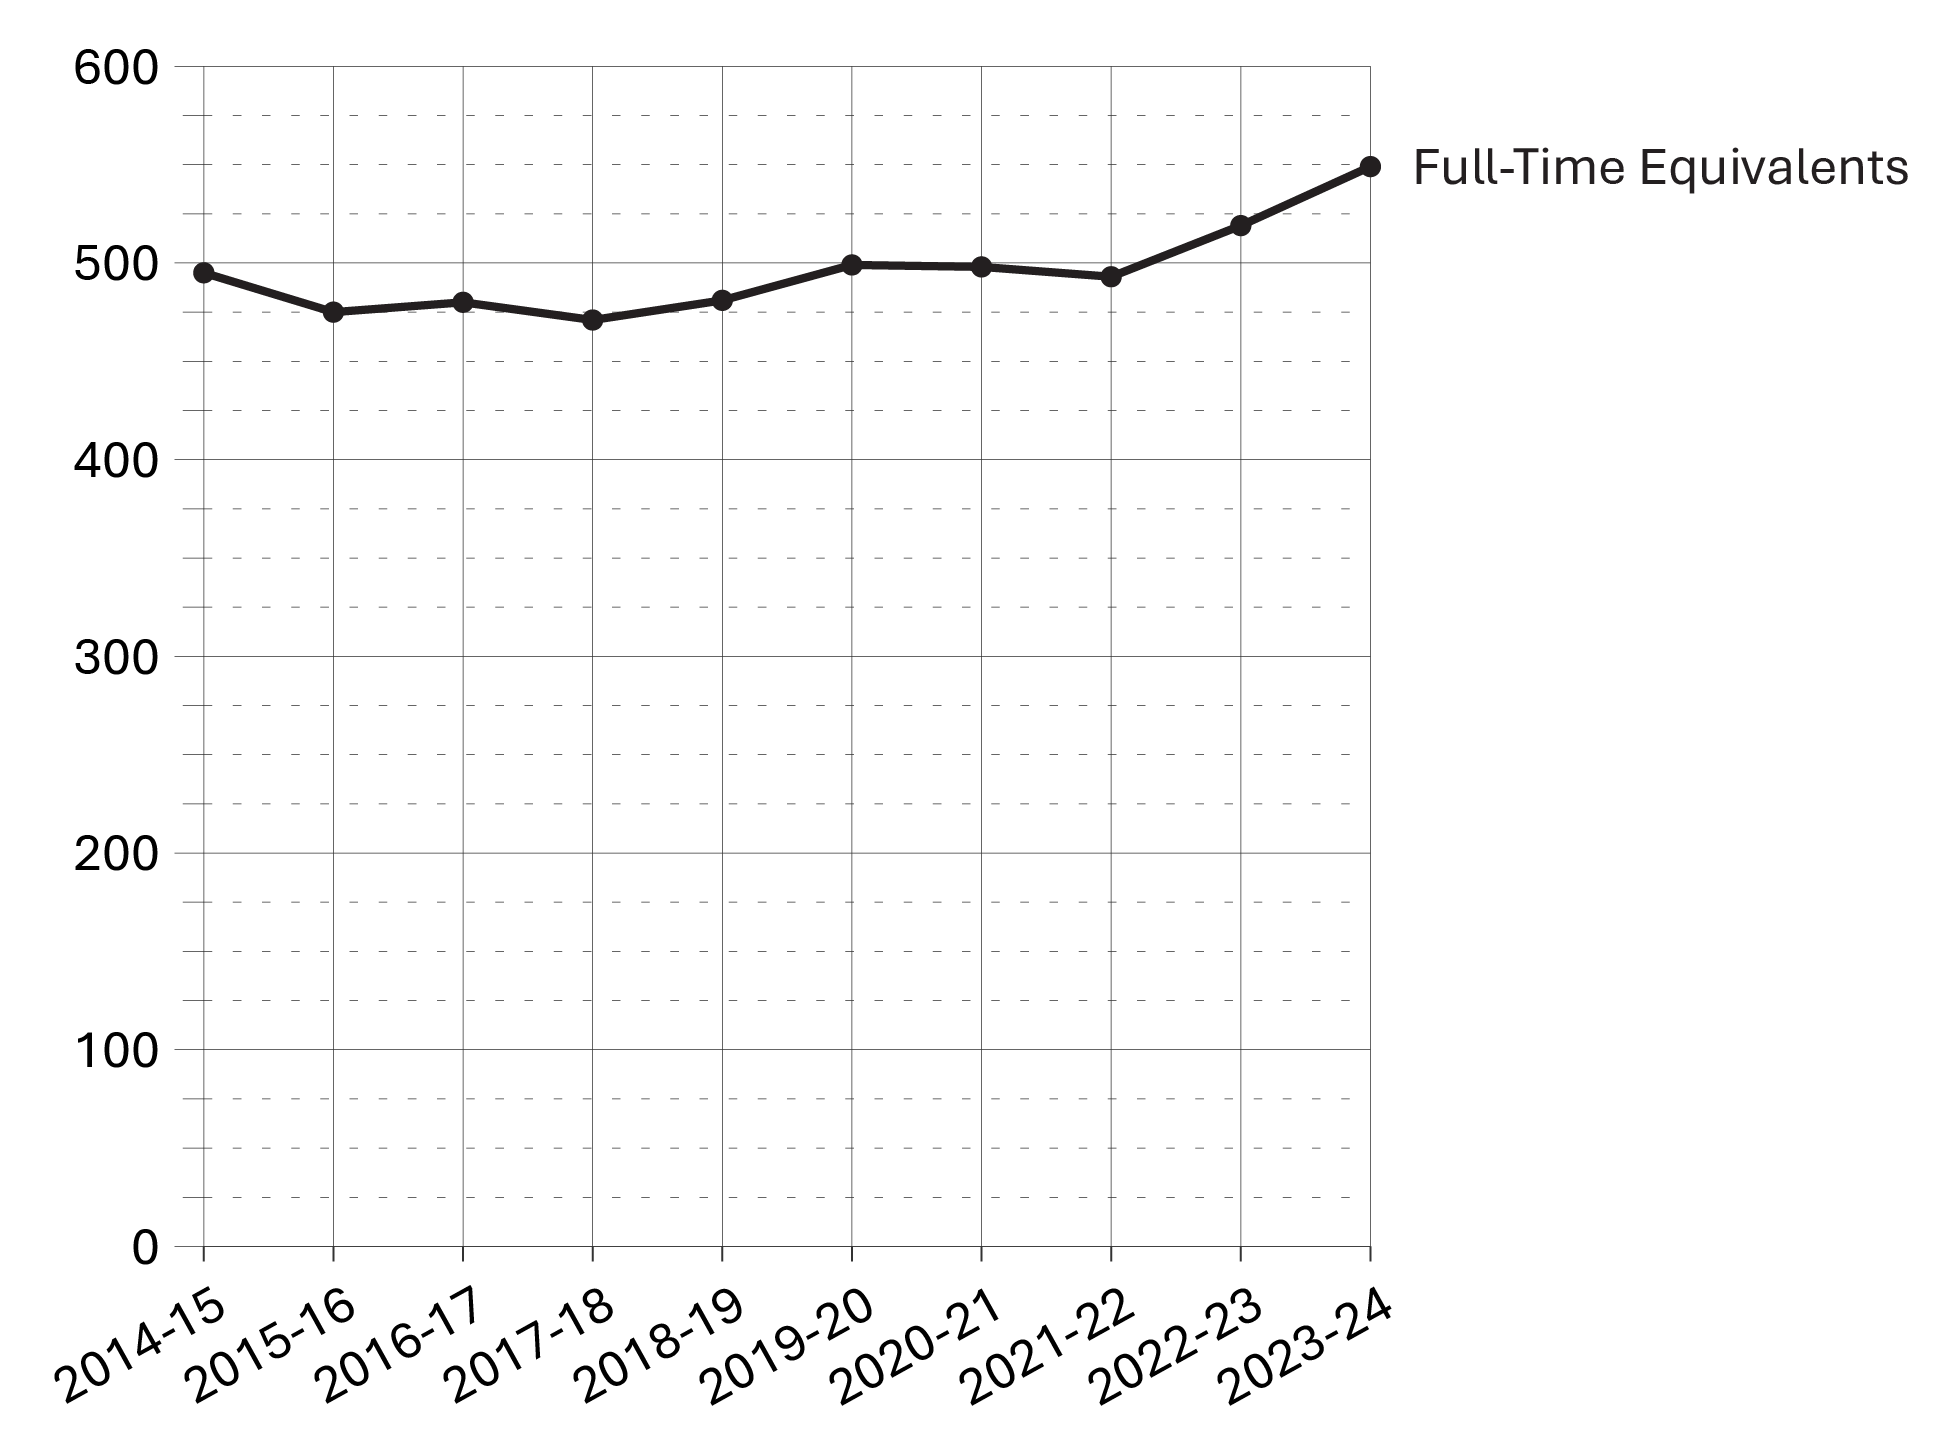
Image description
Line graph showing the number of full-time equivalents (i.e., employees) employed by the Parole Board of Canada between fiscal years 2014-15 and 2023-24. The trend remained relatively stable over the 10-year period. Full data are available in the table below.
Source: Parole Board of Canada.
- In 2023-24, the full-time equivalents employed by the Parole Board of Canada increased by 5.8% to 549 (30 more) compared to 2022-23.
- Over the past 10 fiscal years (from 2014-15 to 2023-24), there has been a 10.9% increase (from 495 to 549) in the number of full-time equivalents employed by the Parole Board of Canada.
| Parole Board of Canada employees | 2019-20 | 2020-21 | 2021-22 | 2022-23 | 2023-24 |
|---|---|---|---|---|---|
| Total program activity | 499 | 498 | 493 | 519 | 549 |
Conditional release decisions |
320 | 323 | 320 | 329 | 345 |
Conditional release openness and accountability |
45 | 45 | 49 | 49 | 52 |
Record suspension and clemency recommendations |
72 | 62 | 57 | 65 | 70 |
Internal services |
62 | 68 | 67 | 76 | 82 |
| Total types of employees | 499 | 498 | 493 | 519 | 549 |
Full-time board members |
40 | 36 | 40 | 39 | 42 |
Part-time board members |
20 | 20 | 19 | 18 | 19 |
Staff |
439 | 442 | 434 | 462 | 488 |
Source: Parole Board of Canada.
Table B4 Notes
A full-time equivalent is a measure of the extent to which an employee represents a full person-year charge against a departmental budget. Section 103 of the Corrections and Conditional Release Act limits the Parole Board of Canada to 60 full-time members.
Reported year periods reflect fiscal years. A fiscal year runs from April 1 to March 31 of the following year.
The number of employees in the Office of the Correctional Investigator
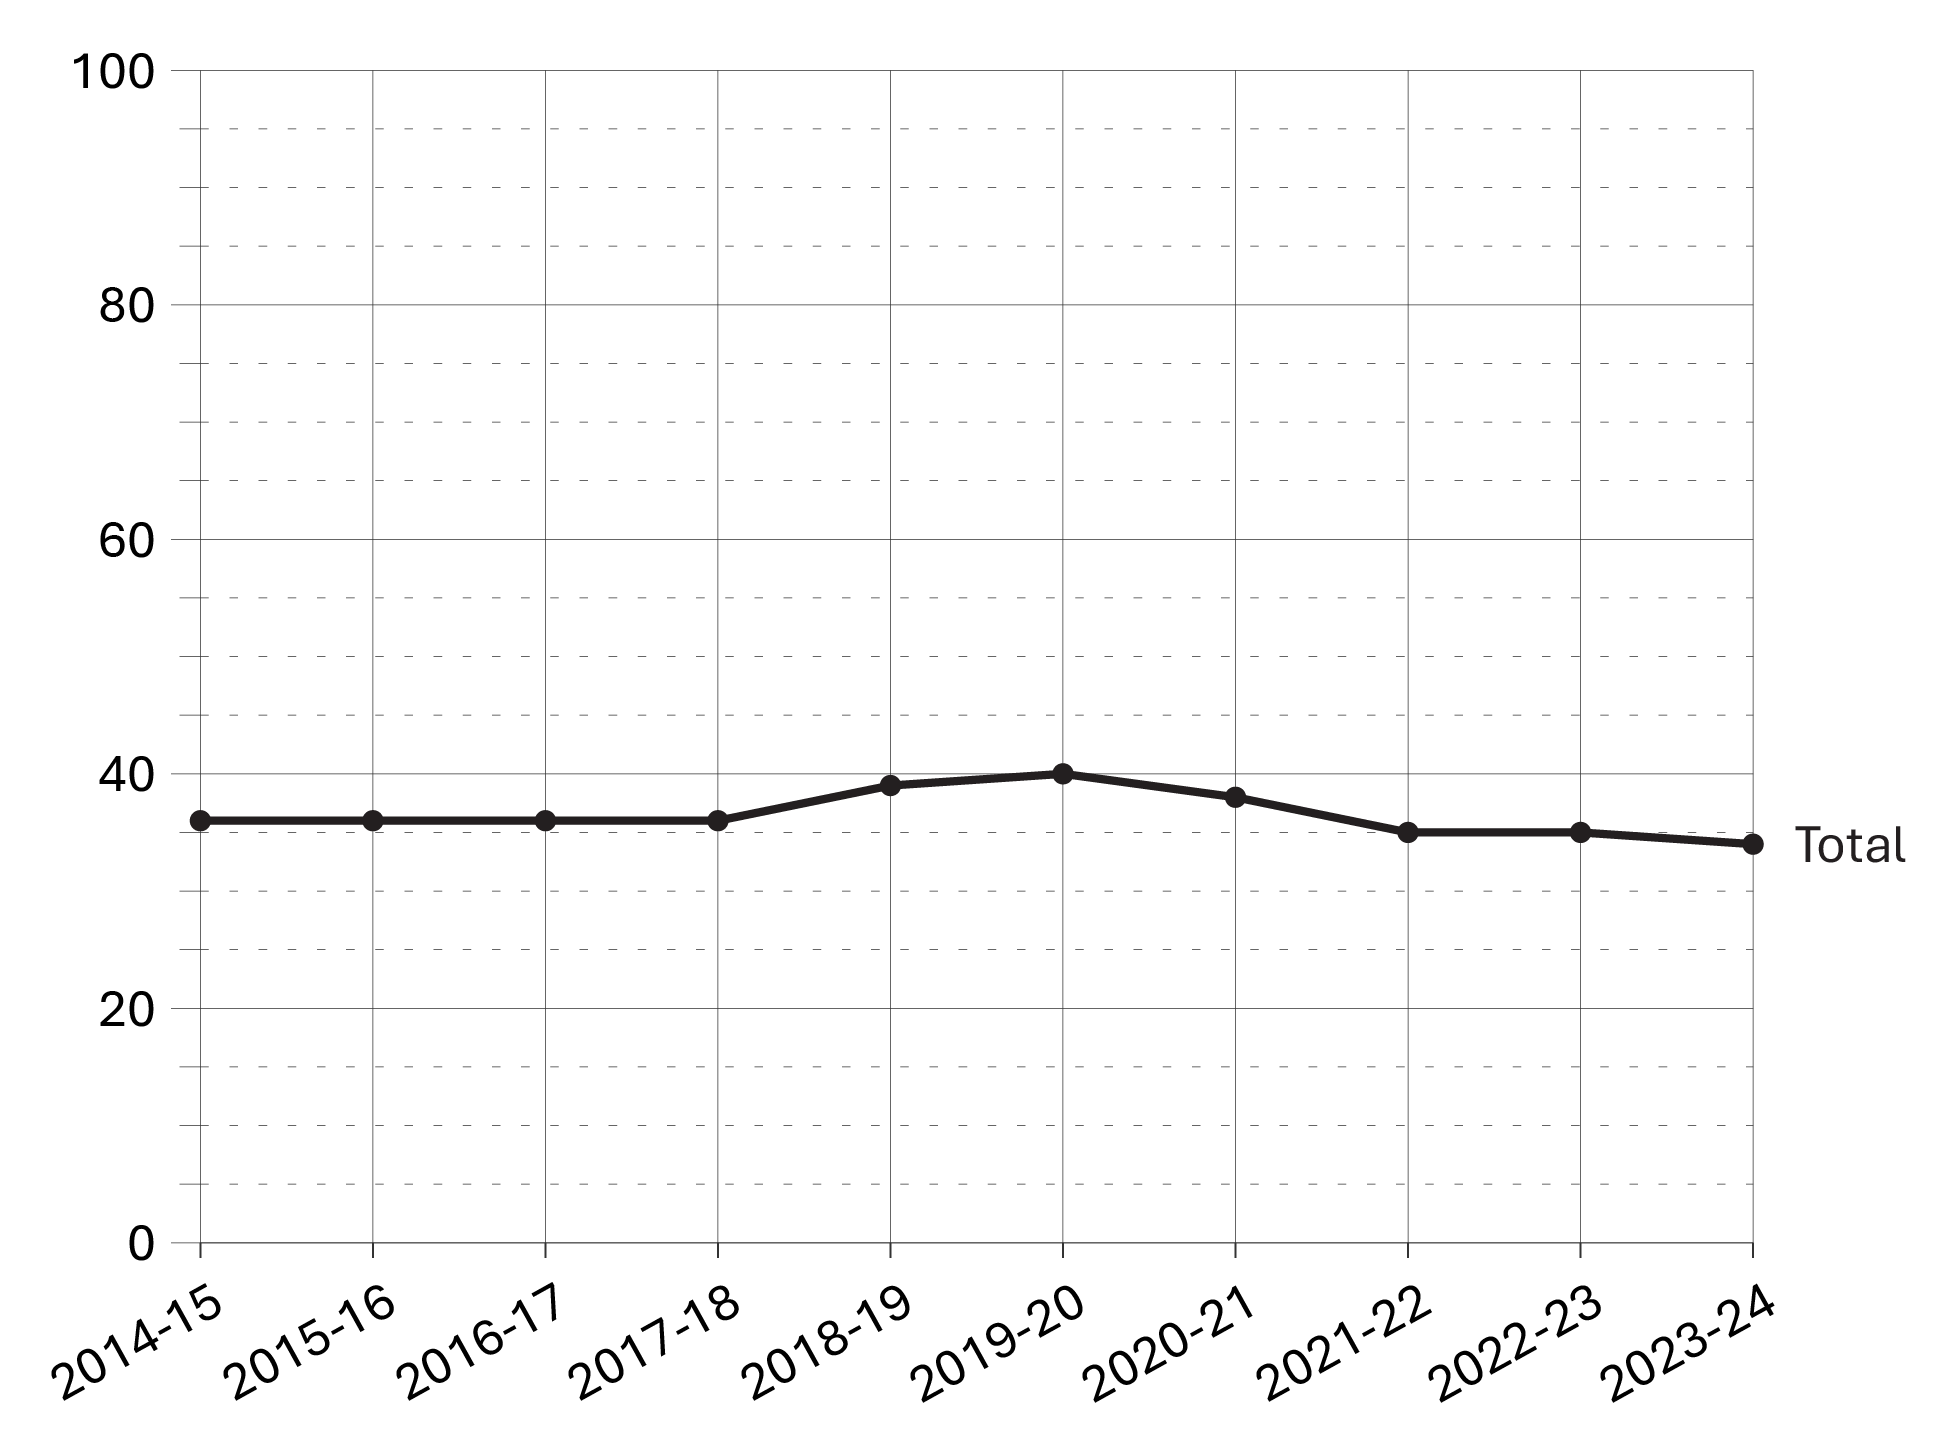
Image description
Line graph showing the number of full-time equivalents (i.e., employees) at the Office of the Correctional Investigator between fiscal years 2014-15 and 2023-24. The trend has remained stable over the 10-year period. Full data are available in the table below.
Source: Office of the Correctional Investigator.
- In 2023-24, the total number of full-time equivalents at the Office of the Correctional Investigator was 34, which is 1 less than the year prior.
- In the 10 year period between 2014-15 to 2023-24, the total number of full-time equivalents at the Office of the Correctional Investigator has remained relatively stable.
| Types of employees | 2019-20 | 2020-21 | 2021-22 | 2022-23 | 2023-24 |
|---|---|---|---|---|---|
| Correctional investigator | 1 | 1 | 1 | 1 | 1 |
| Senior management and investigative services | 28 | 26 | 24 | 22 | 20 |
| Internal services | 5 | 5 | 5 | 8 | 8 |
| Policy and research | 6 | 6 | 5 | 4 | 5 |
| Total | 40 | 38 | 35 | 35 | 34 |
Source: Office of the Correctional Investigator.
Table B5 Notes
The Office of the Correctional Investigator (OCI) may commence an investigation on receipt of a complaint by or on behalf of an offender or on its own initiative. Complaints are made by telephone, letter and during interviews with the OCI's investigative staff at federal correctional facilities. The dispositions in response to complaints involve a combination of internal responses (where the information or assistance sought by the offender can generally be provided by the OCI's investigative staff) and investigations (where, further to a review/analysis of law, policies and documentation, OCI investigative staff make an inquiry or several interventions with Correctional Service Canada and submit recommendations to address the complaint). Investigations vary considerably in terms of scope, complexity, duration, and resources required.
Reported year periods reflect fiscal years. A fiscal year runs from April 1 to March 31 of the following year.
Most common offender complaints to the Office of the Correctional Investigator
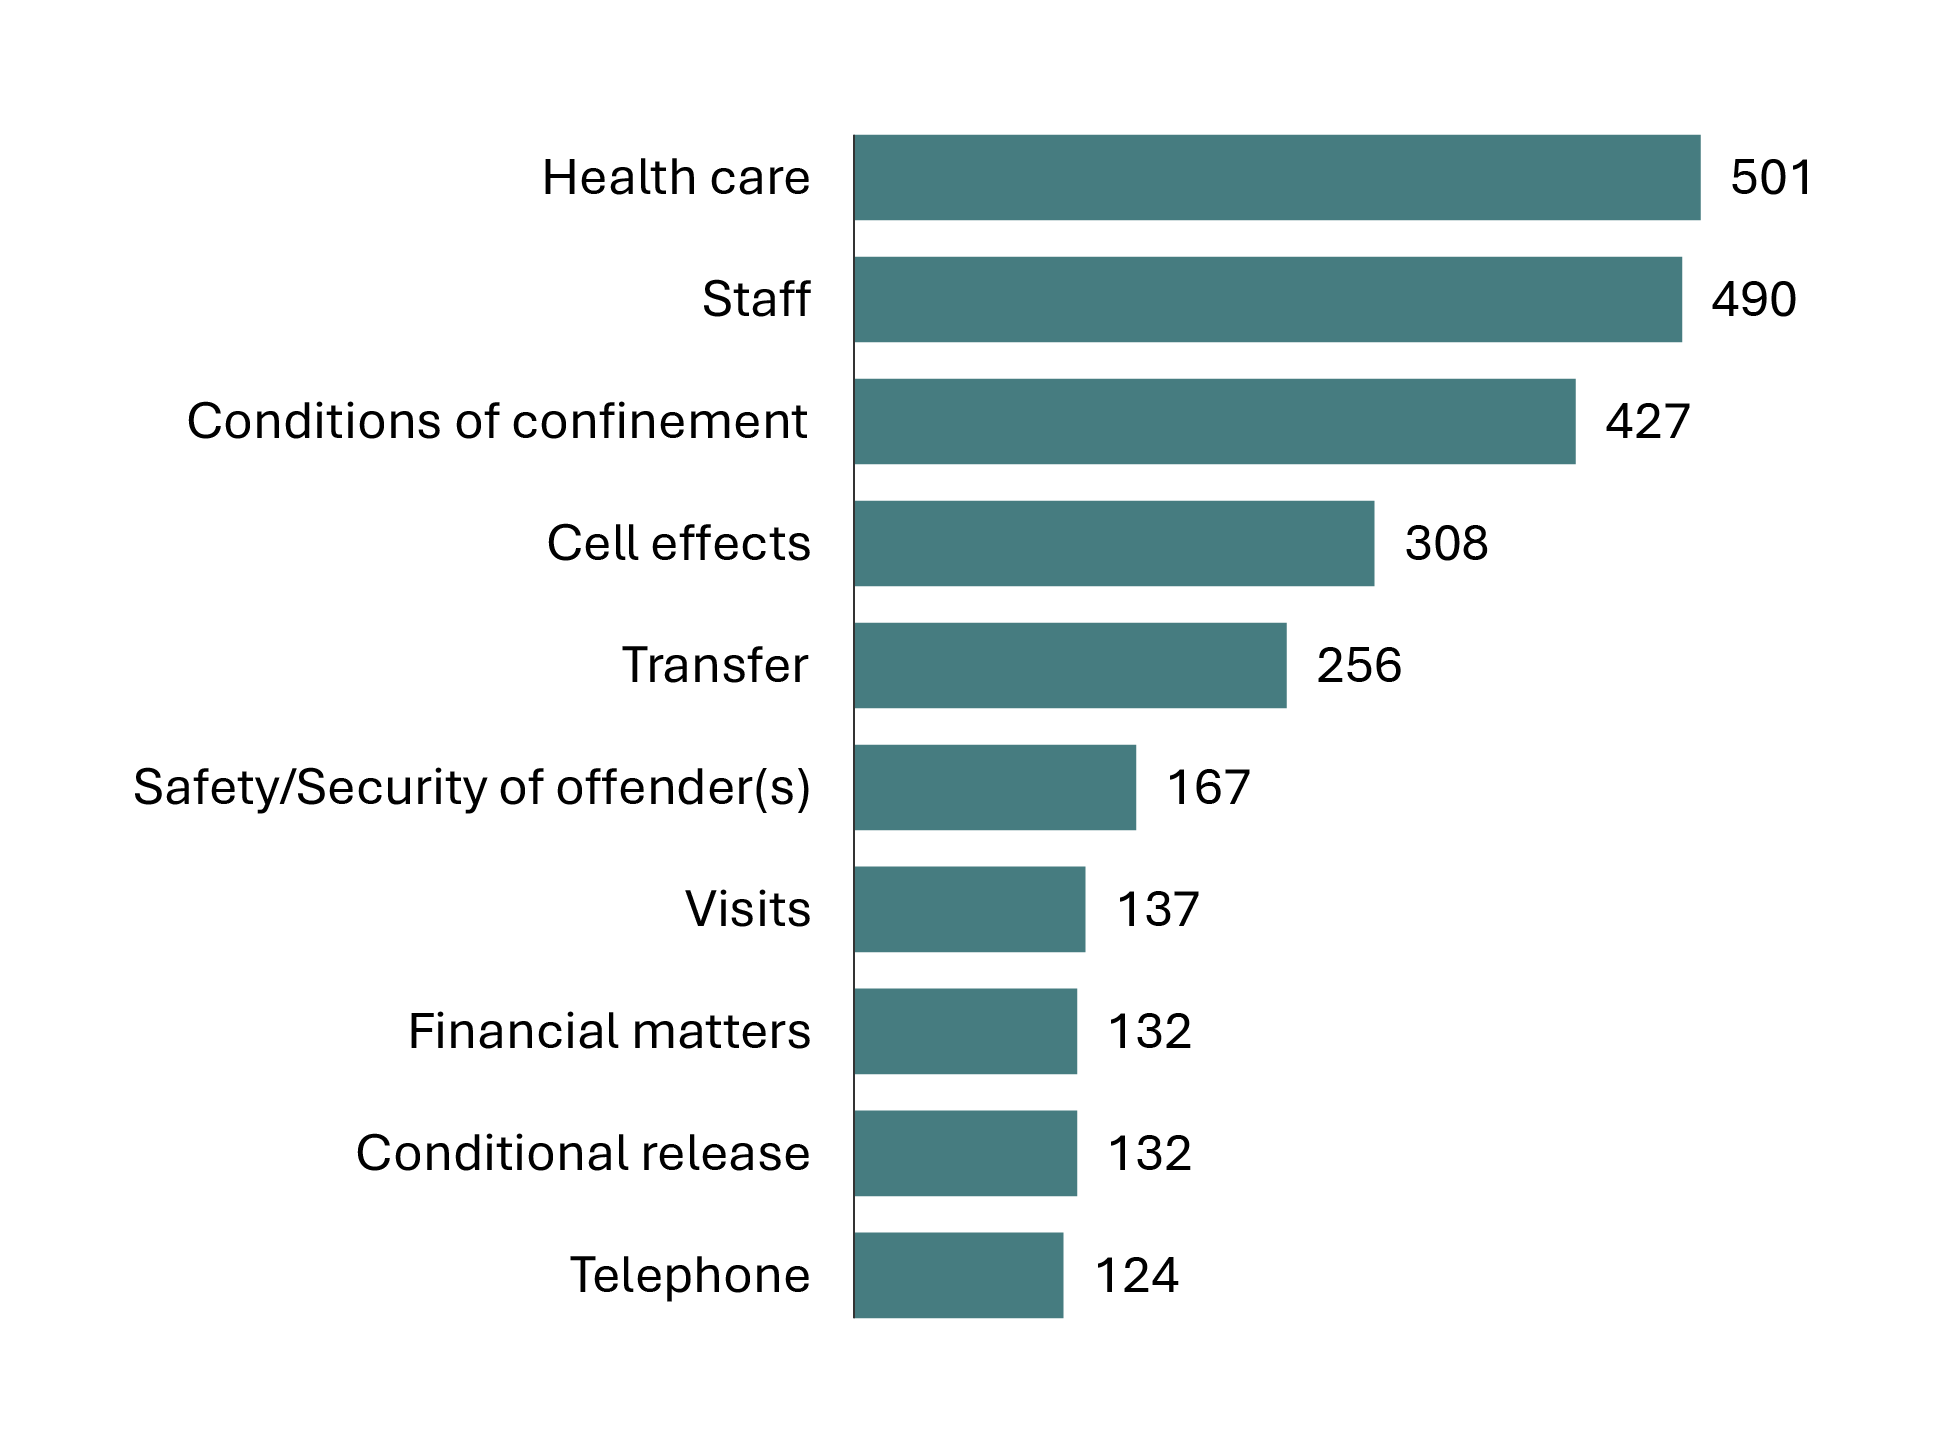
Image description
Bar graph showing the 10 most common offender complaints at the end of the 2023-24 fiscal year. The complaint categories included are health care, staff, conditions of confinement, cell effects, transfer, safety/security of offender(s), visits, financial matters, conditional release, and telephone. Health care, staff, and conditions of confinement were the most common complaints. Complaints regarding telephone use, conditional release, and financial matters were the least common. Full data are available in the table below.
Source: Office of the Correctional Investigator.
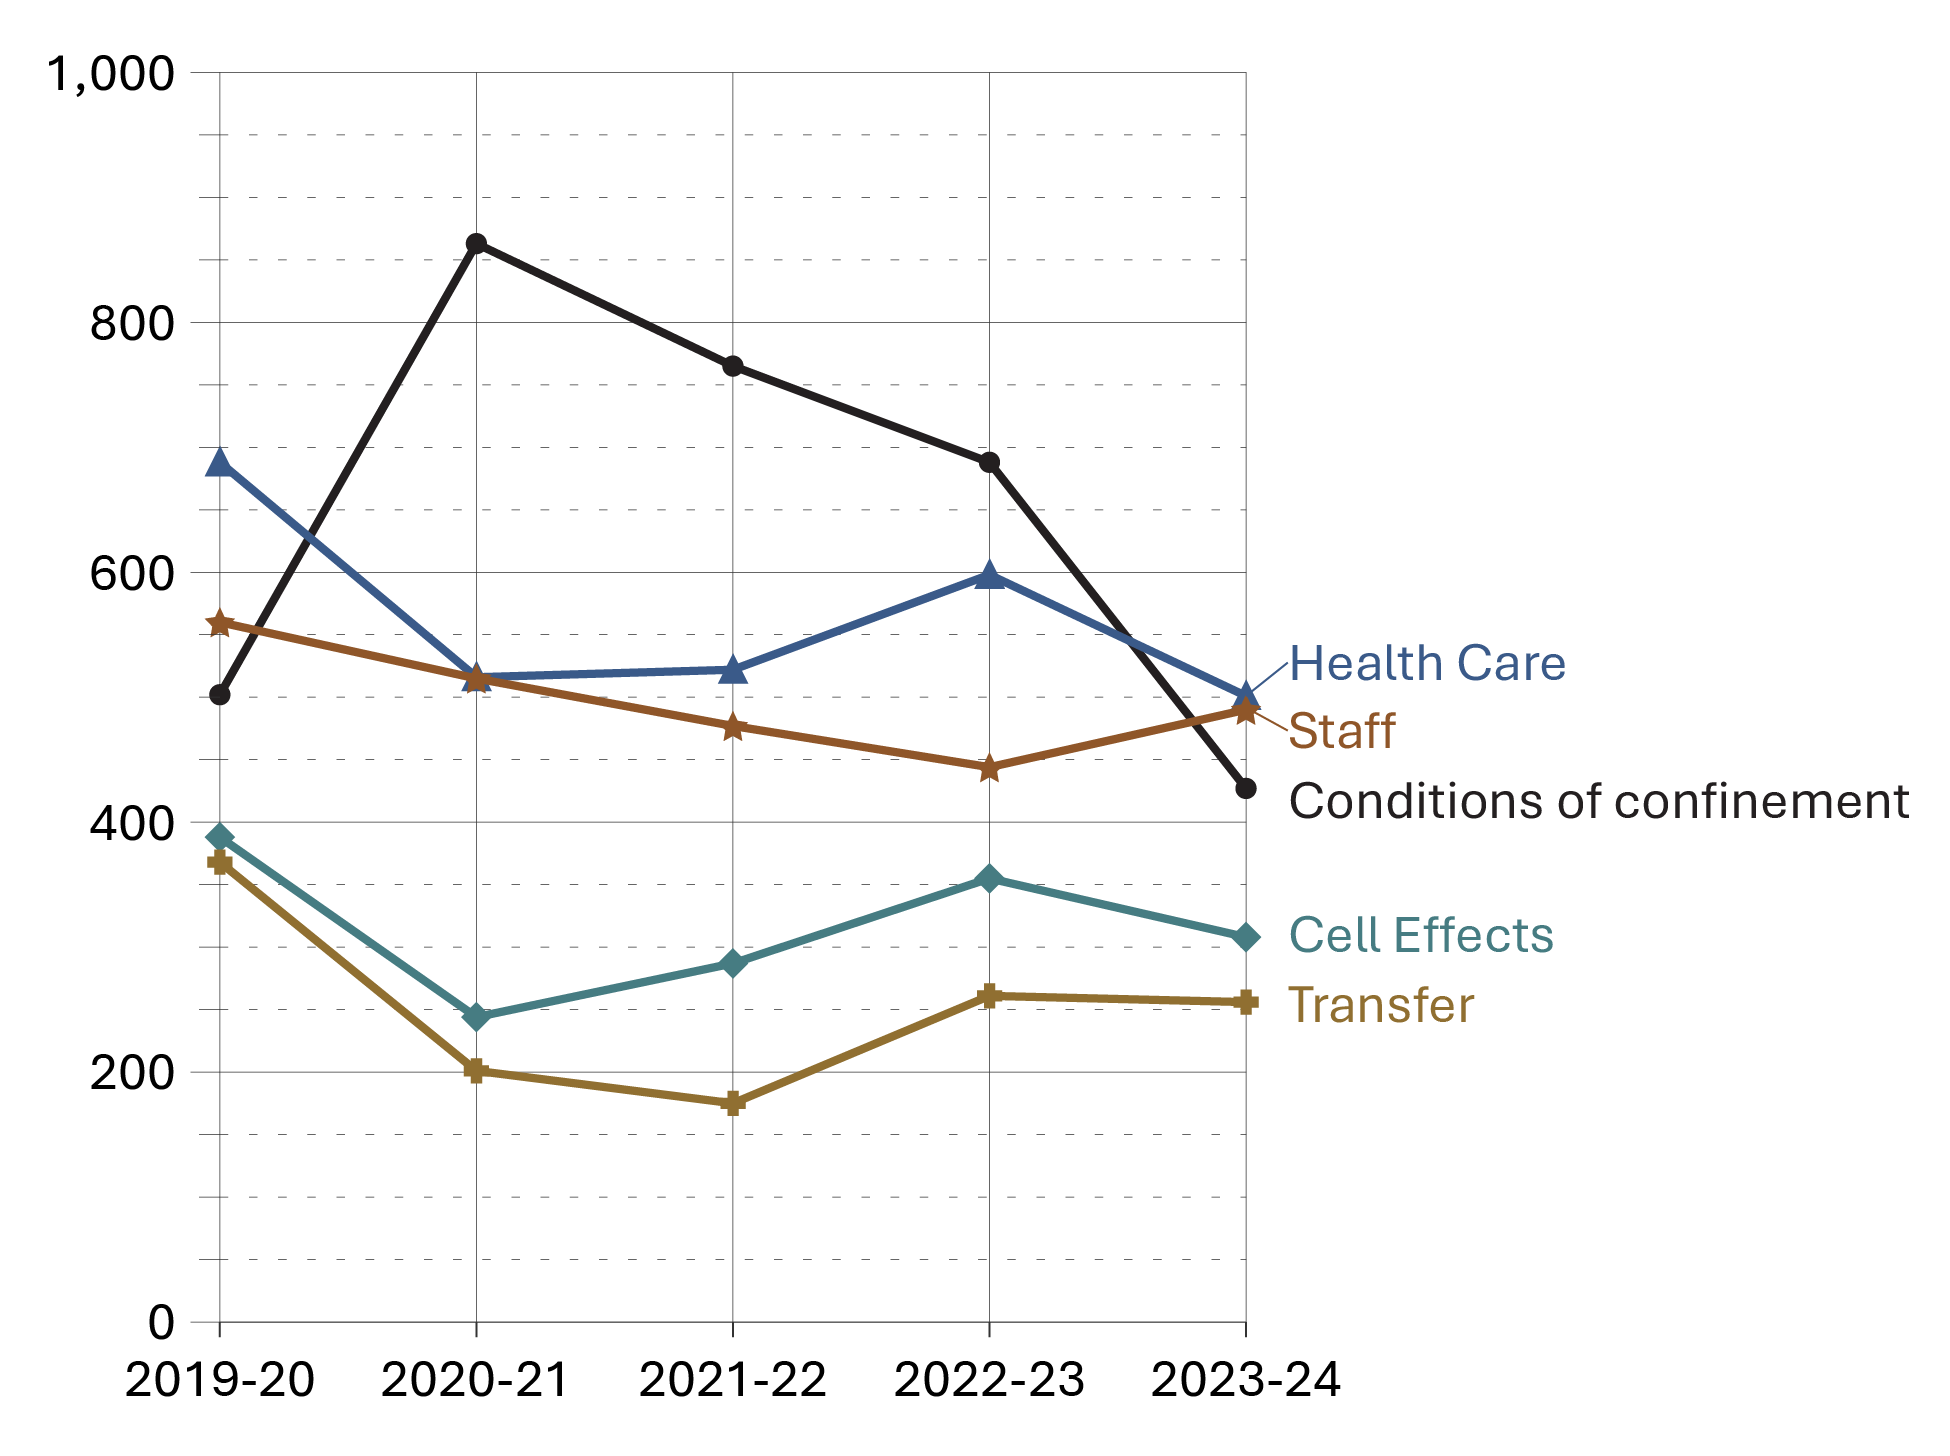
Image description
Line graph showing the 5 most common offender complaints between fiscal years 2019-20 and 2023-24. The complaint categories included are health care, staff, conditions of confinement, cell effects, and transfer. Health care, staff, and conditions of confinement are the most common complaints. All complaint categories have fluctuated over the 5-year period. Complaints regarding conditions of confinement greatly increased from fiscal year 2019-20 to 2020-21 fiscal year, and declined therefore after. Full data are available in the table below.
Source: Office of the Correctional Investigator.
- There were 4,237 complaints/enquiries received at the Office of the Correctional Investigator (OCI) in 2023-24, a decrease of 10.6% since 2022-23.
- Health care was the most common offender complaint category in 2023-24. From 2020-21 to 2022-23, the most common complaint was conditions of confinement. Fluctuations observed in the conditions of confinement category may be due to changes in data collection practices and how complaints are categorized. Since 2019-20, the conditions of confinement category has undergone numerous changes.
- In 2023-24, the top four reasons for complaints were health care (11.8%), staff (11.6%), conditions of confinement (10.1%), and cell effects (7.3%). Taken together, these four complaint categories accounted for 40.7% of all complaints.
| Category of complaint | 2019-20 | 2020-21 | 2021-22 | 2022-23 | 2023-24 |
|---|---|---|---|---|---|
| Conditions of confinement | 502 | 863 | 765 | 688 | 427 |
| Health Care | 688 | 516 | 522 | 598 | 501 |
| Staff | 560 | 515 | 477 | 444 | 490 |
| Cell Effects | 388 | 244 | 287 | 355 | 308 |
| Transfer | 368 | 201 | 175 | 261 | 256 |
| Safety/Security of Offender(s) | 230 | 183 | 165 | 213 | 167 |
| File Information | 245 | 204 | 139 | 169 | 122 |
| Visits | 209 | 123 | 140 | 125 | 137 |
| Telephone | 185 | 133 | 127 | 136 | 124 |
| Financial Matters | 119 | 112 | 149 | 140 | 132 |
| Grievance | 129 | 106 | 92 | 133 | 101 |
| Outside OCI Jurisdiction | 133 | 65 | 71 | 119 | 88 |
| Case Preparation | 96 | 149 | 166 | 38 | 26 |
| Legal Counsel Access | 136 | 61 | 81 | 95 | 101 |
| Security Classification | 63 | 69 | 128 | 107 | 97 |
| Correspondence | 130 | 103 | 84 | 87 | 56 |
| Programs | 112 | 71 | 73 | 93 | 108 |
| Conditional Release | 60 | 62 | 77 | 109 | 132 |
| Mental Health | 100 | 49 | 66 | 103 | 70 |
| Discrimination | 38 | 65 | 86 | 78 | 102 |
| Total of remaining categories | 1,075 | 613 | 666 | 649 | 692 |
| Total of all categoriesFootnote ** | 5,566 | 4,507 | 4,536 | 4,740 | 4,237 |
Source: Office of the Correctional Investigator.
Table B6 Notes
Section C: Federal Offender and Registered Victims Populations
Offenders under the responsibility of CSC
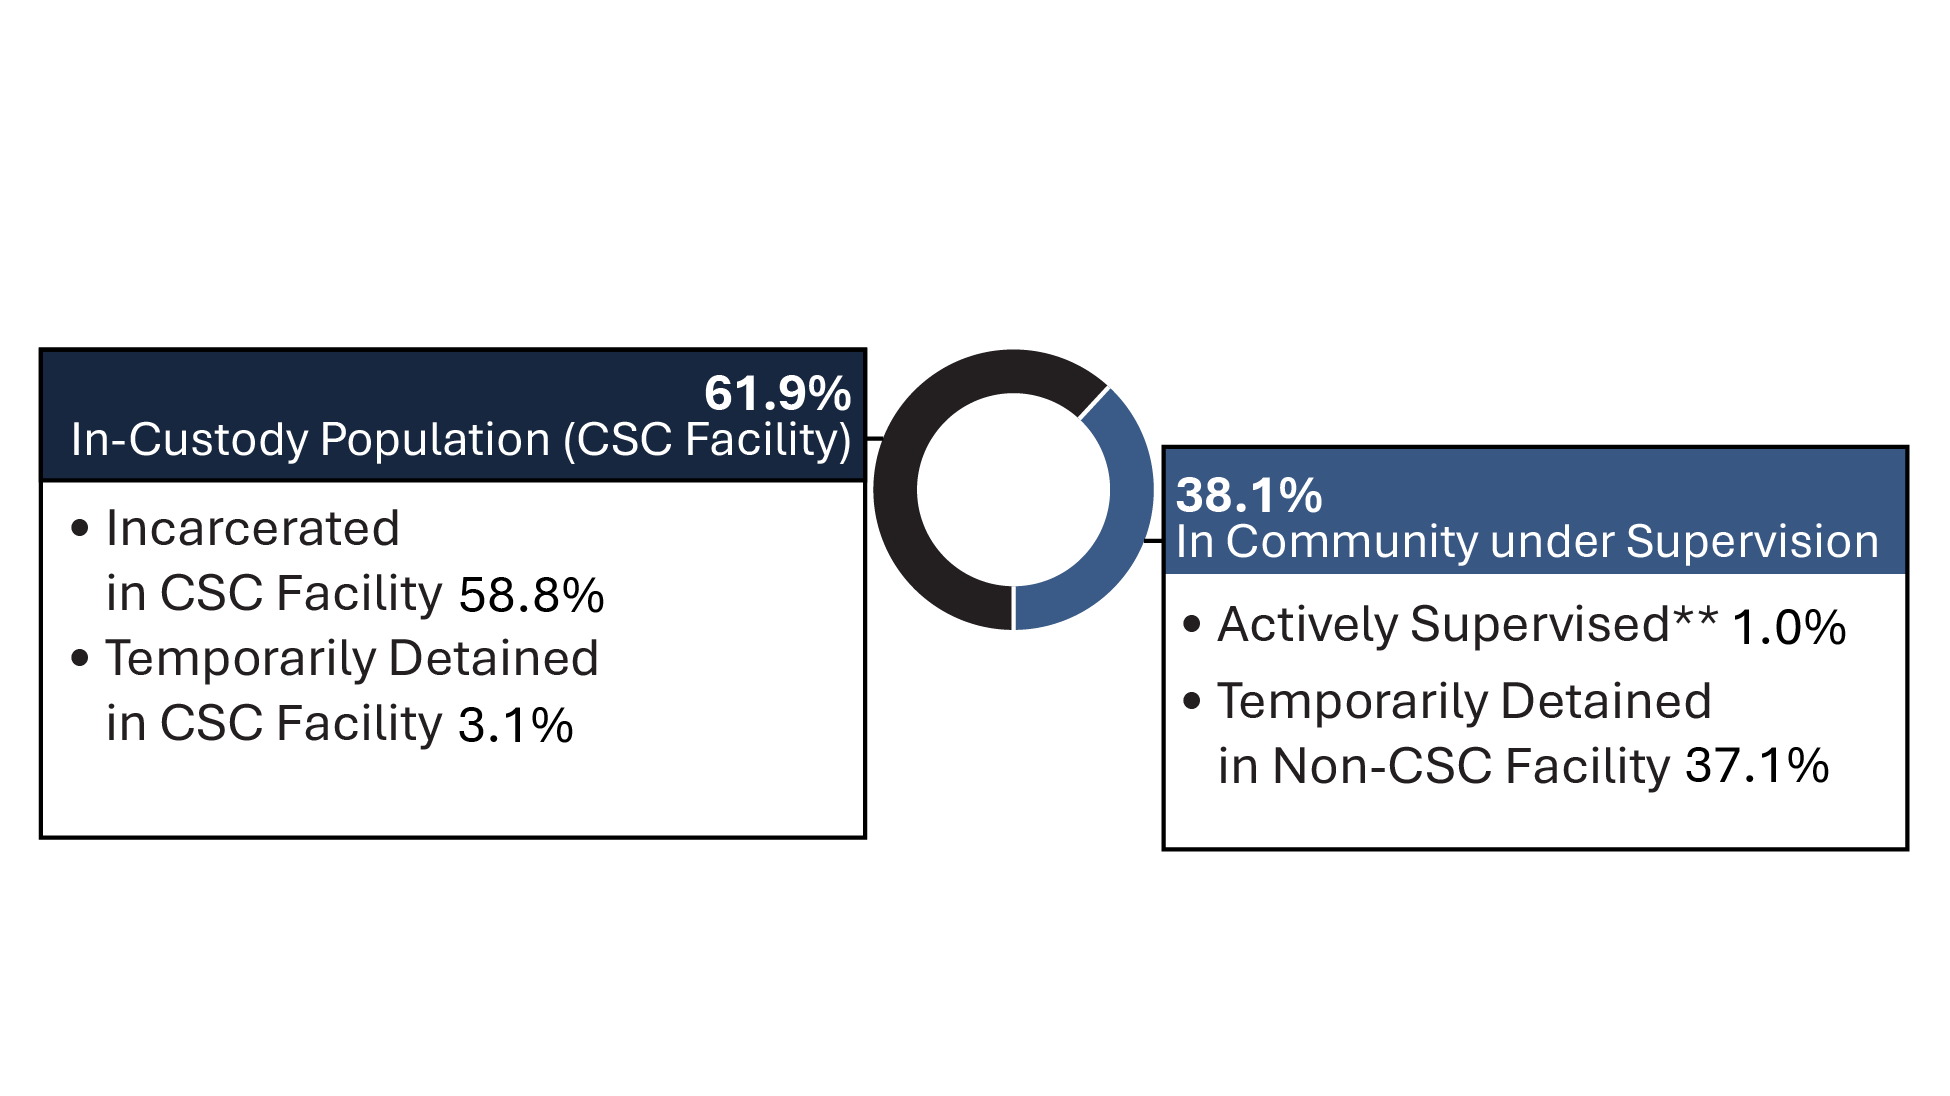
Image description
Donut chart showing the total offender population in the 2023-24 fiscal year. The chart is separated into two categories: the in-custody population, which includes incarceration and temporary detention in CSC facilities, and the in community under supervision population, which includes active supervision and temporary detention in non-CSC facilities. Over half of the total offender population are currently incarcerated in a CSC facility. Full data is available in the table below.
Source: Correctional Service of Canada.
- After a consistent yearly decrease in the in-custody population between 2014-15 and 2021-22, the in-custody population has seen a noticeable increase of 6.1% from 13,054 in 2022-23 to 13,855 in 2023-24.
Definitions C1:
Total Offender Population includes all active offenders who are incarcerated in a CSC facility, offenders on temporary absence from a CSC facility, offenders who are temporarily detained, offenders who are actively supervised, and offenders who are unlawfully at large for less than 90 days.
CSC Facilities include all federal institutions and federally funded Healing Lodges.
In Custody includes all active offenders incarcerated in a CSC facility, offenders on temporary absence from a CSC facility, offenders who are temporarily detained in a CSC facility and offenders on remand in a CSC facility.
In Community Under Supervision includes all active offenders on day parole, full parole, statutory release, in the community supervised on a long-term supervision order, offenders who are temporarily detained in a non-CSC facility, offenders who are unlawfully at large for less than 90 days, offenders on remand in a non-CSC facility, and offenders supervised and subject to an immigration hold by Canada Border Services Agency.
**Actively Supervised includes all active offenders on day parole, full parole or statutory release, as well as those who are in the community on long-term supervision orders.
Temporarily Detained includes offenders who are physically held in a CSC facility or a non-CSC facility after being suspended for a breach of a parole condition or to prevent a breach of parole conditions.
In addition to the total offender population, there are excluded groups such as:
Federal jurisdiction offenders incarcerated in a Community Correctional Centre or in a non-CSC facility.
Federal jurisdiction offenders deported /extradited including offenders for whom a deportation order has been enforced by Canada Border Services Agency.
Federal offenders on bail which includes offenders on a judicial interim release; they have appealed their conviction or sentence and have been released to await the results of a new trial.
Escaped includes offenders who have absconded from either a correctional facility or while on a temporary absence and whose whereabouts are unknown.
Unlawfully at Large for 90 days or more. This includes offenders who have been released to the community on day parole, full parole, statutory release or a long term supervision order for whom a warrant for suspension has been issued at least 90 days ago, but has not yet been executed. Being unlawfully at large may lead to new criminal charges, which could carry further penalties.
| Status | Offenders under the responsibility of CSC | % |
|---|---|---|
| In-custody population (CSC facility) | 13,855 | 61.9 |
Incarcerated in CSC facility |
13,159 | 58.8 |
Temporarily detained in CSC facility |
696 | 3.1 |
Day parole |
142 | 0.6 |
Full parole |
66 | 0.3 |
Statutory release |
445 | 2.0 |
Long-term supervision order |
43 | 0.2 |
| In community under supervision | 8,520 | 38.1 |
Actively supervised |
8,299 | 37.1 |
Day parole |
1,571 | 7.0 |
Full parole |
4,092 | 18.3 |
Statutory release |
2,170 | 9.7 |
Long-term supervision order |
466 | 2.1 |
Offenders temporarily detained in non-CSC facility |
221 | 1.0 |
| Total | 22,375 | 100.0 |
Source: Correctional Service of Canada.
Table C1 Notes
Number of registered victims and number of offenders with a registered victim: 5-year trend
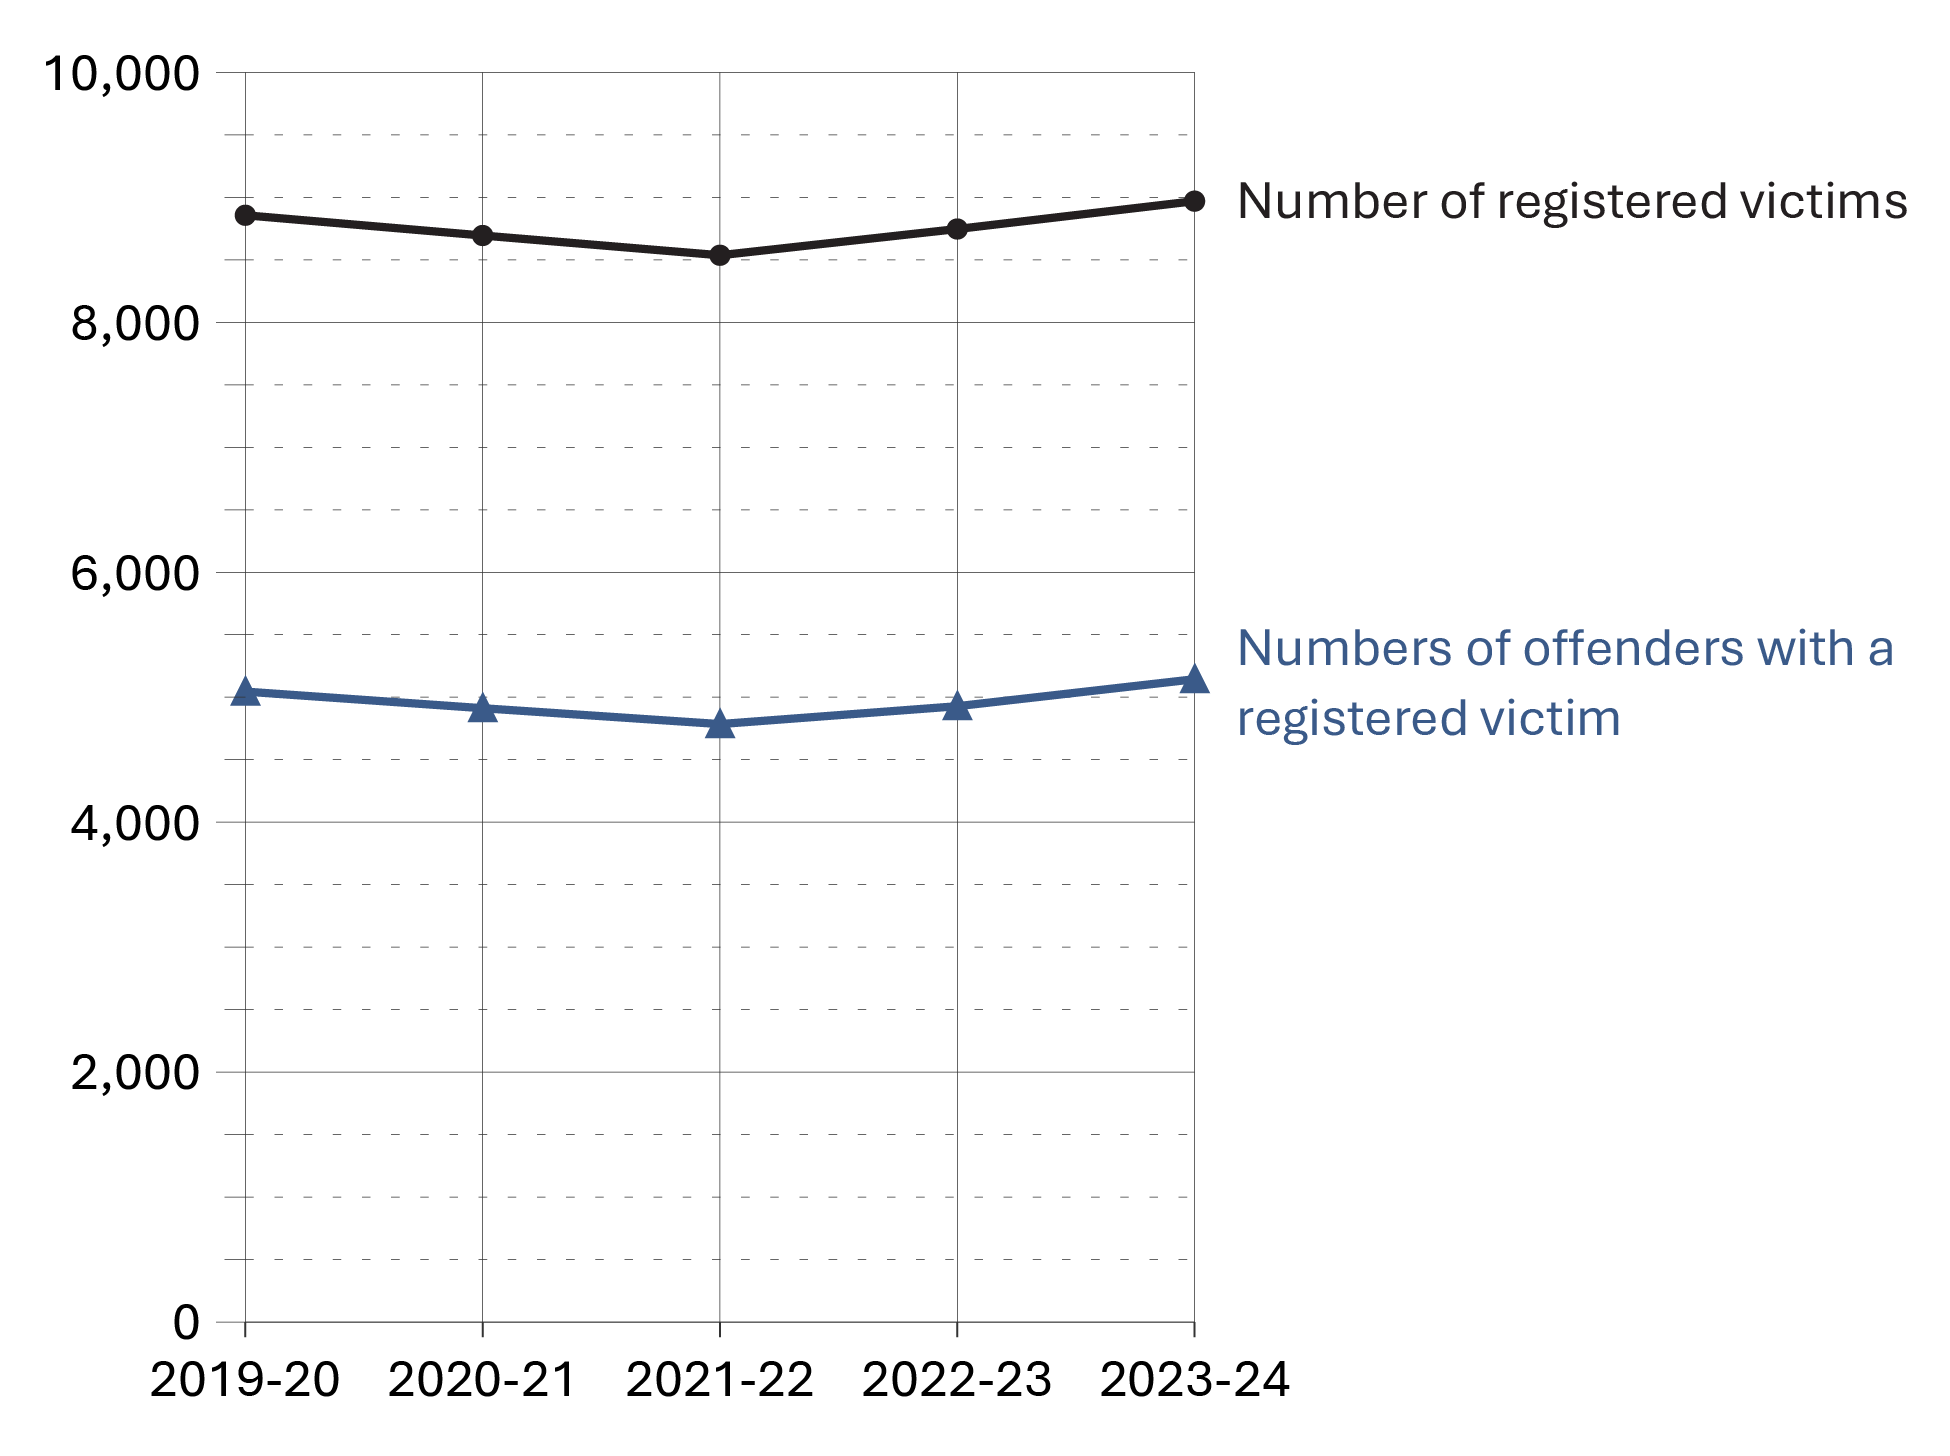
Image description
Line graph illustrating the number of registered victims and registered offenders over a five year period from fiscal year 2019-20 to 2023-24. There are far more registered victims than offenders with a registered victim. Numbers in both groups remained consistent over the 5-year period. Full data is available in the table below.
Source: Correctional Service of Canada.
- In order to register to receive information, a victim must meet the definition of a victim under the Corrections and Conditional Release Act (CCRA). Victims of federal offenders must be at least 18 years old or legally emancipated or demonstrate they can act for themselves. Victims can register with the Correctional Service of Canada or the Parole Board of Canada.
- Although the number of victims registered with the federal correctional system has fluctuated over the past 5 fiscal years, it has increased by 1.3%, from 8,857 in 2019-20 to 8,970 in 2023-24.
- Although the number of offenders with registered victims has fluctuated over the past 5 fiscal years, it has increased by 2.0% from 5,045 in 2019-20 to 5,144 in 2023-24.
| Fiscal year | Number of registered victims | Number of offenders with a registered victim |
|---|---|---|
| 2019-20 | 8,857 | 5,045 |
| 2020-21 | 8,695 | 4,912 |
| 2021-22 | 8,537 | 4,785 |
| 2022-23 | 8,747 | 4,928 |
| 2023-24 | 8,970 | 5,144 |
Source: Correctional Service of Canada.
Table C2 Notes
The Canadian Victims Bill of Rights defines a victim as an individual who has suffered physical or emotional harm, property damage, or economic loss as the result of the commission or alleged commission of an offence. The CCRA also allows a spouse, a relative or dependant, an individual who is responsible for the care or support of the victim or the care or support of a dependant of the victim, to act on behalf of a victim, if the victim cannot act on their own behalf. Victims include persons harmed as the result of an act of an offender, whether or not the offender was prosecuted or convicted for that act, as long as an official complaint has been made to the police or to the Crown.
Victims do not automatically receive information about the offender who harmed them. If they have been harmed by an offender serving a sentence of two years or more, victims are asked to register with the Correctional Service of Canada (CSC) or the Parole Board of Canada to receive information or access services. The registration process allows CSC to verify that the individual meets the definition of victim, which is required under law before sharing protected offender information.
Victim registration fluctuates for a number of reasons beyond organizational control. Contributing factors impacting victim registration data could be due to offenders reaching the end of their sentence or death, victims opting out of notifications for reasons such as personal preferences, death or loss of contact.
For more information about victim registration, visit: https://www.canada.ca/en/correctional-service/services/you-csc/victims/register.html
An offender may have more than one registered victim.
Reported data is current up to the end of each fiscal year.
A fiscal year runs from April 1 to March 31 of the following year.
The number of in-custody offenders: 10-year trend
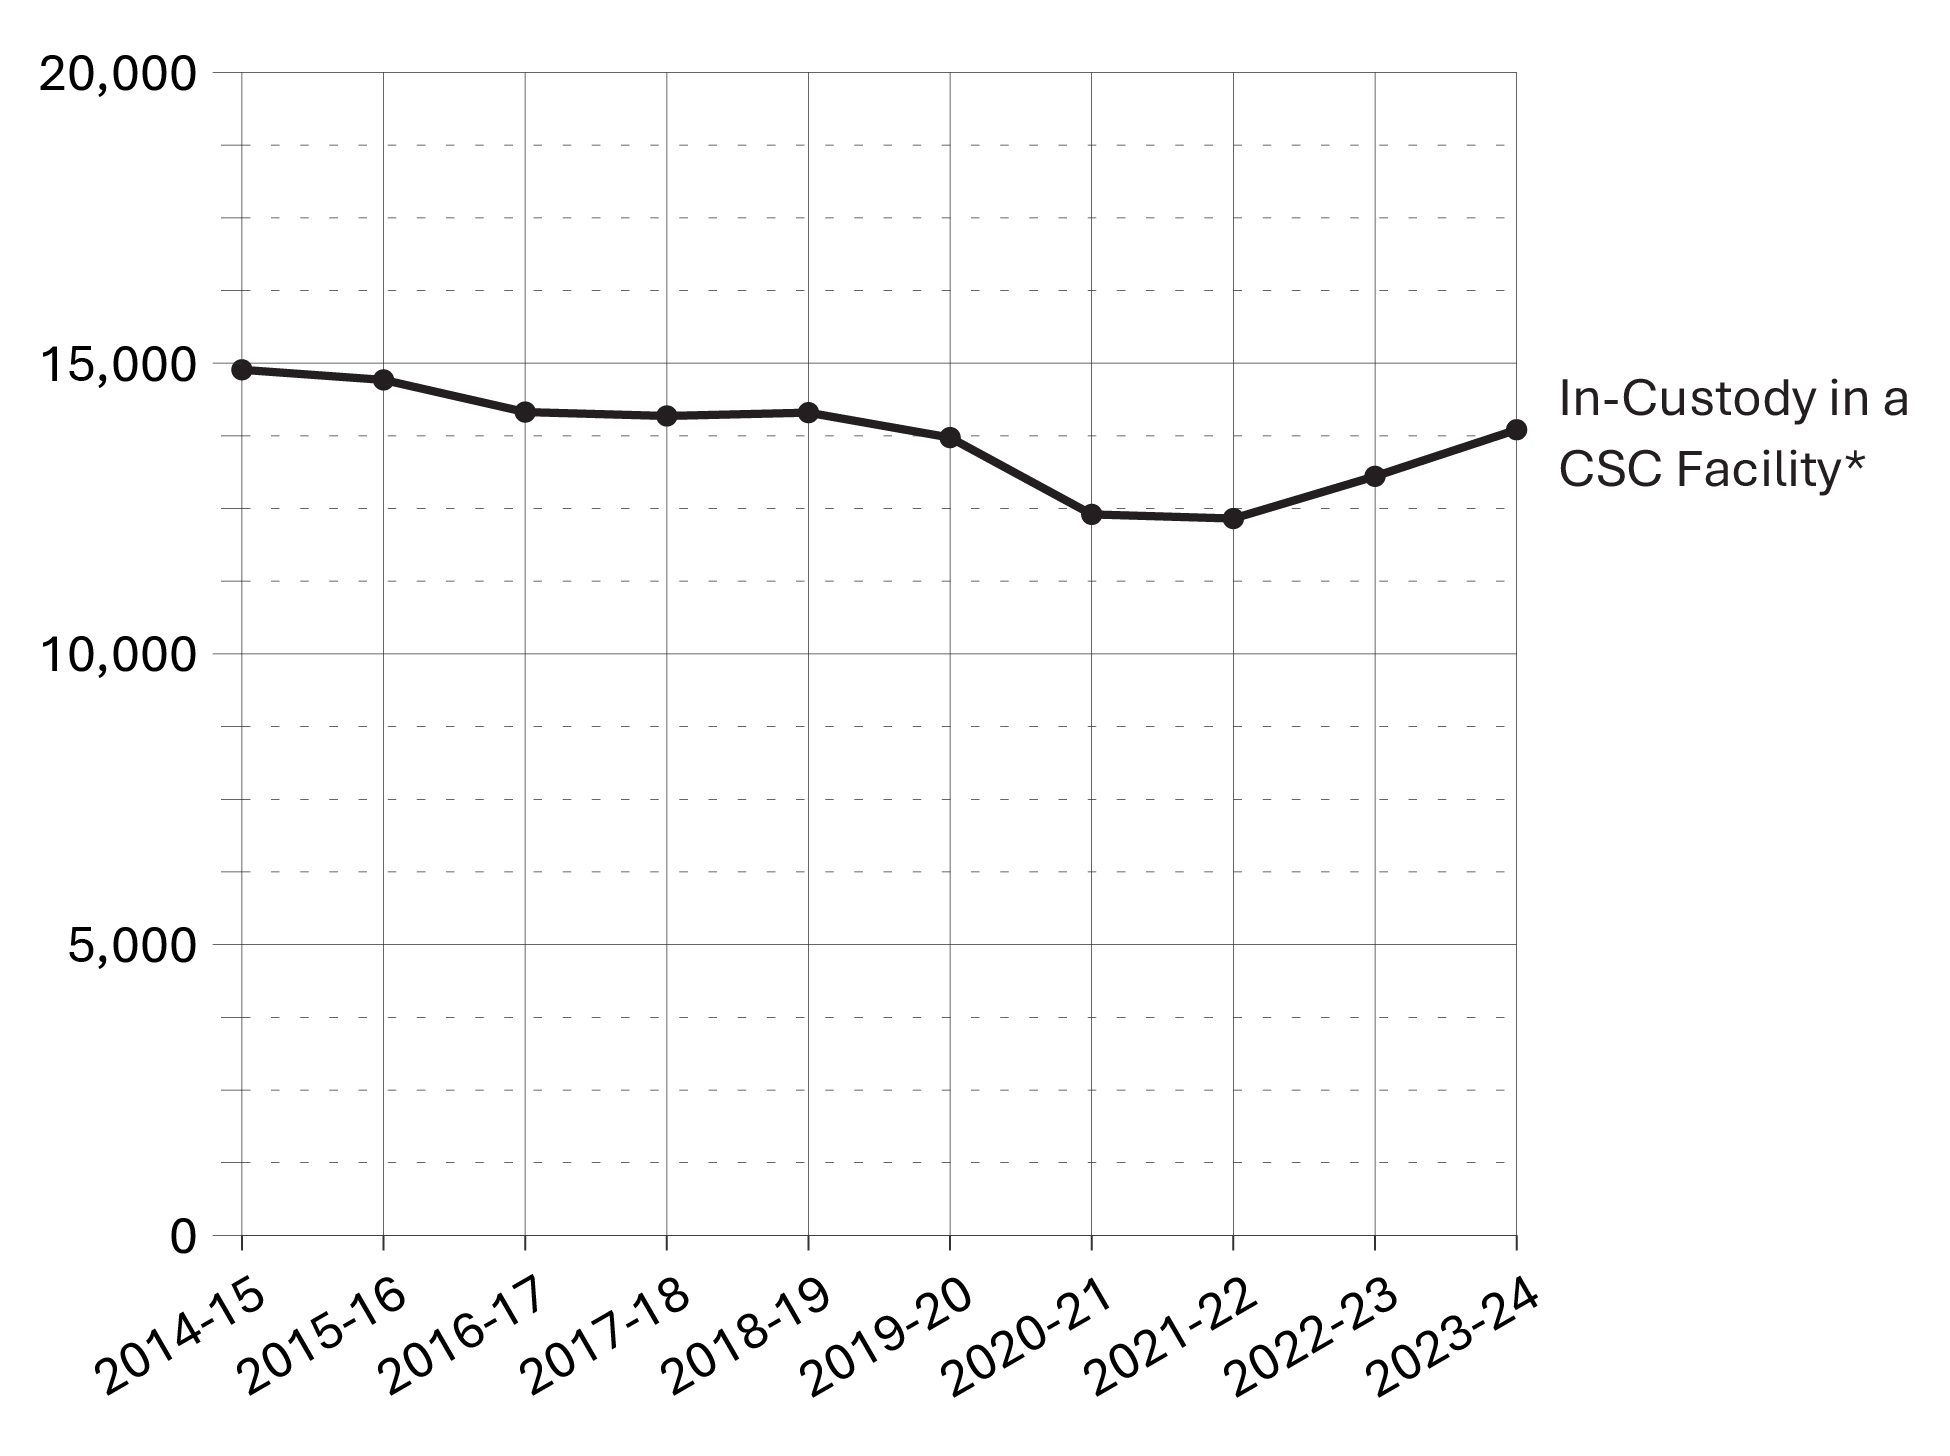
Image description
Line graph showing the number of offenders in-custody in a Correctional Service of Canada facility over a ten year period from fiscal year 2014-15 to 2023-24. The number of in-custody offenders decreased slightly from 2014-15 to 2021-22. After that, the number of in-custody offenders increased, returning to earlier levels. Full data is available in the table below.
Source: Correctional Service of Canada.
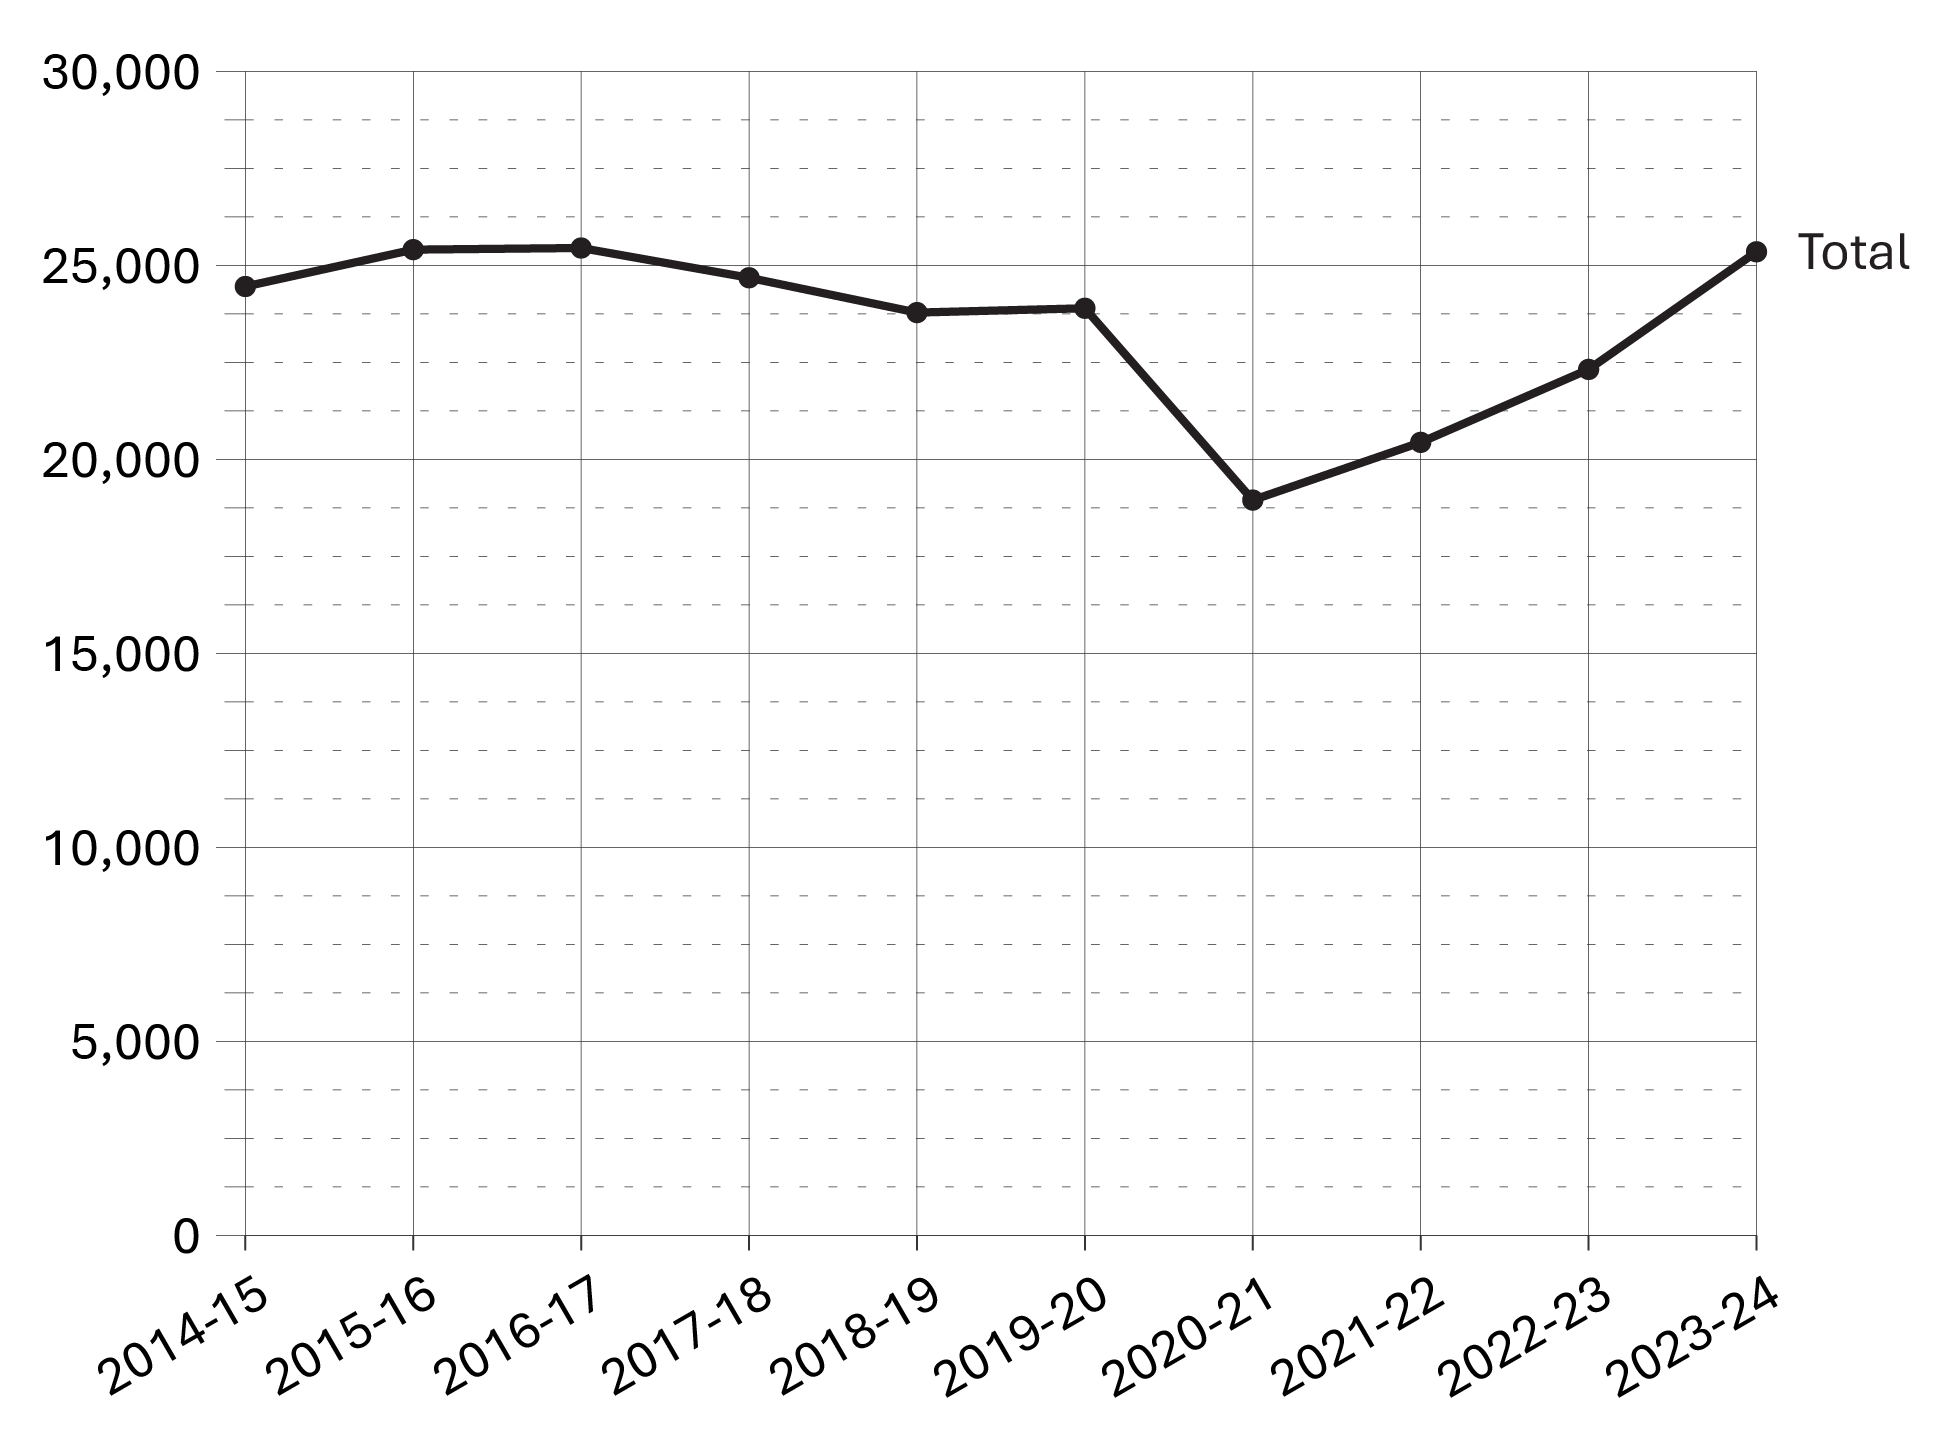
Image description
Line graph showing the number of in-custody offenders in a provincial or territorial facility from fiscal year 2014-15 to 2023-24. Despite fluctuations in the number of in-custody offenders, the number in 2023-24 is similar to 2014-15. Full data are available in the table below.
Source: Statistics Canada. Table 35-10-0154-01, Average counts of adults in provincial and territorial correctional programs.
- After a consistent yearly decrease in the in-custody population in a CSC facility between 2014-15 and 2021-22, the in-custody population has seen a noticeable increase of 6.1% from 13,054 in 2022-23 to 13,855 in 2023-24. Despite this increase, the in-custody population has not returned to pre-COVID-19 pandemic levels.
- The in-custody population in a provincial/territorial facility remained relatively stable from 2014-15 to 2019-20. From 2019-20 to 2020-21, there was a sharp decrease (-20.7%), followed by a sharp but steady increase (+33.8%) from 2020-21 to 2023-24. Over the past year (from 2022-23 to 2023-24), there was a 13.6% increase.
| Fiscal year | In custody in a CSCFootnote 1 facilityFootnote * | Sentenced in a provincial/territorialFootnote 2 facility | On remand in a provincial/territorialFootnote 2 facility | Other/ temporary detention in a provincial/territorialFootnote 2 facility | Total in a provincial/territorialFootnote 2 facility | Total CSCFootnote 1 and provincial/territorialFootnote 2 |
|---|---|---|---|---|---|---|
| 2014-15 | 14,886 | 10,364 | 13,650 | 441 | 24,455 | 39,341 |
| 2015-16 | 14,712 | 10,091 | 14,899 | 415 | 25,405 | 40,117 |
| 2016-17 | 14,159 | 9,710 | 15,417 | 321 | 25,448 | 39,607 |
| 2017-18 | 14,092 | 9,545 | 14,833 | 303 | 24,681 | 38,773 |
| 2018-19 | 14,149 | 8,708 | 14,778 | 297 | 23,783 | 37,932 |
| 2019-20 | 13,720 | 7,947 | 15,505 | 442 | 23,894 | 37,614 |
| 2020-21 | 12,399 | 5,881 | 12,753 | 317 | 18,950 | 31,349 |
| 2021-22 | 12,328 | 5,798 | 14,415 | 226 | 20,439 | 32,767 |
| 2022-23 | 13,054 | 5,916 | 16,194 | 209 | 22,319 | 35,373 |
| 2023-24 | 13,855 | 5,895 | 19,335 | 120 | 25,350 | 39,205 |
Sources:
Table C3 Notes
Number of admissions to CSC facilities by sex
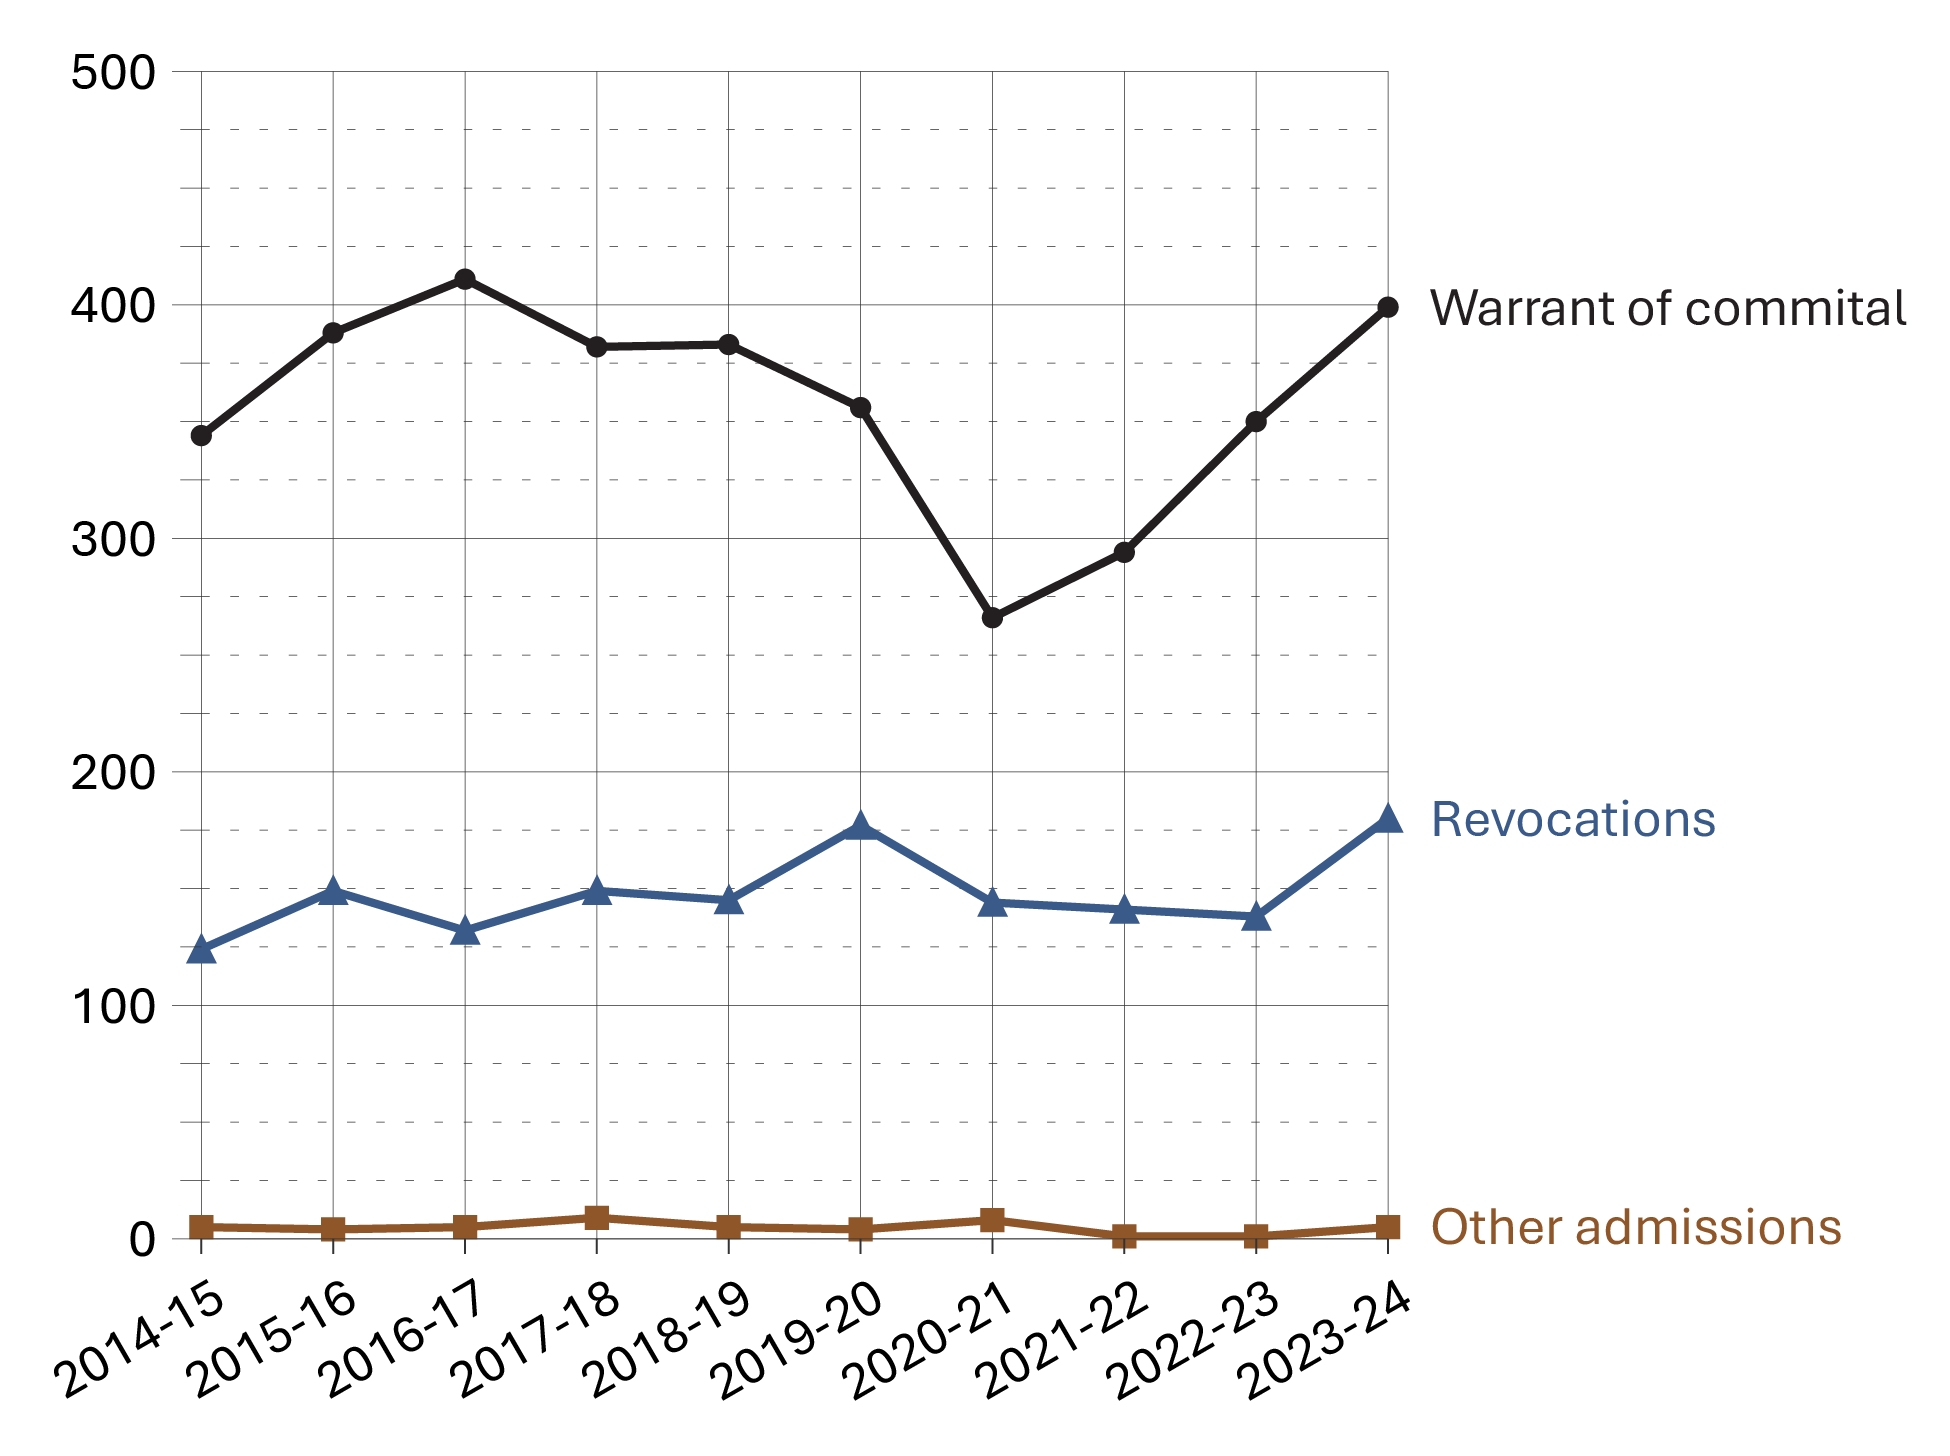
Image description
Line graph showing the number of female admissions to a Correctional Service of Canada facility over a ten year period from fiscal year 2014-15 to 2023-24. The graph displays three separate lines categorized by admissions for warrant of committal, revocations, and other admissions. Most admissions are for warrant of committal, which are highest over the 10-year time period, but experienced a sharp decline in 2020-21, before returning to peak levels in fiscal year 2023-24. Revocations are much lower overall and remain steady over the 10-year time period. There were very few other admissions across the entire 10-year time period. Full data is available in the table below.
Source: Correctional Service of Canada.
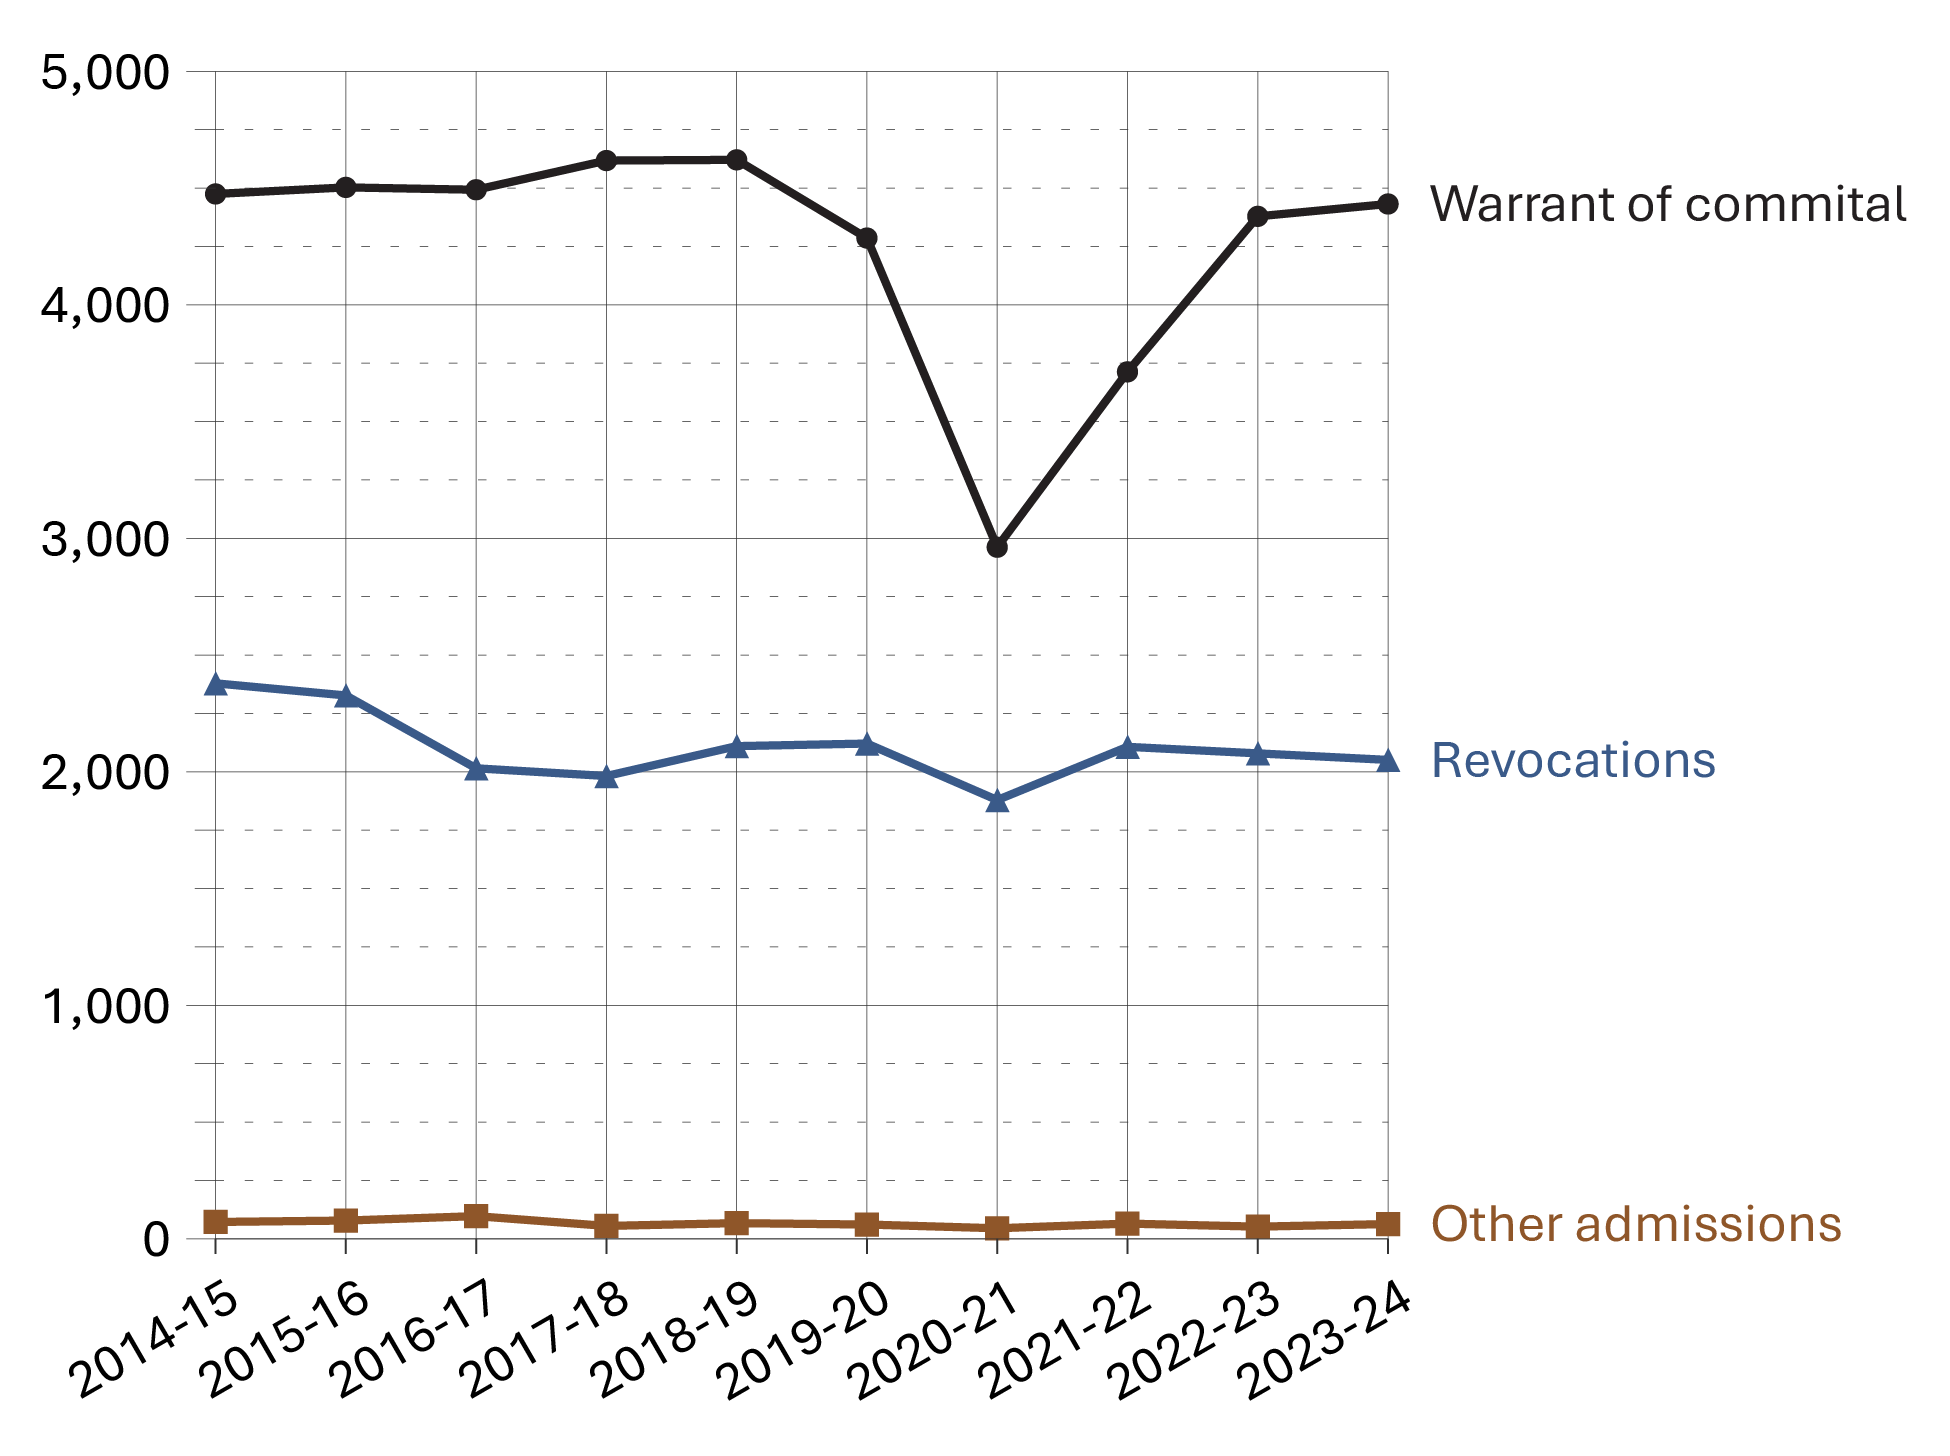
Image description
Line graph showing the number of male admissions to a Correctional Service of Canada facility over a ten year period from fiscal year 2014-15 to 2023-24. The graph displays three separate lines categorized by admissions of warrants of committal, revocations, and other admissions. Most admissions are from warrants of committal, which remain relatively high over time but experienced a sharp decline in 2020-21, before returning to peak levels in fiscal year 2023-24. Revocations are much lower overall and remain relatively steady over the 10-year time period. There were very few other admissions across the entire 10-year time period. Full data is available in the table below.
Source: Correctional Service of Canada.
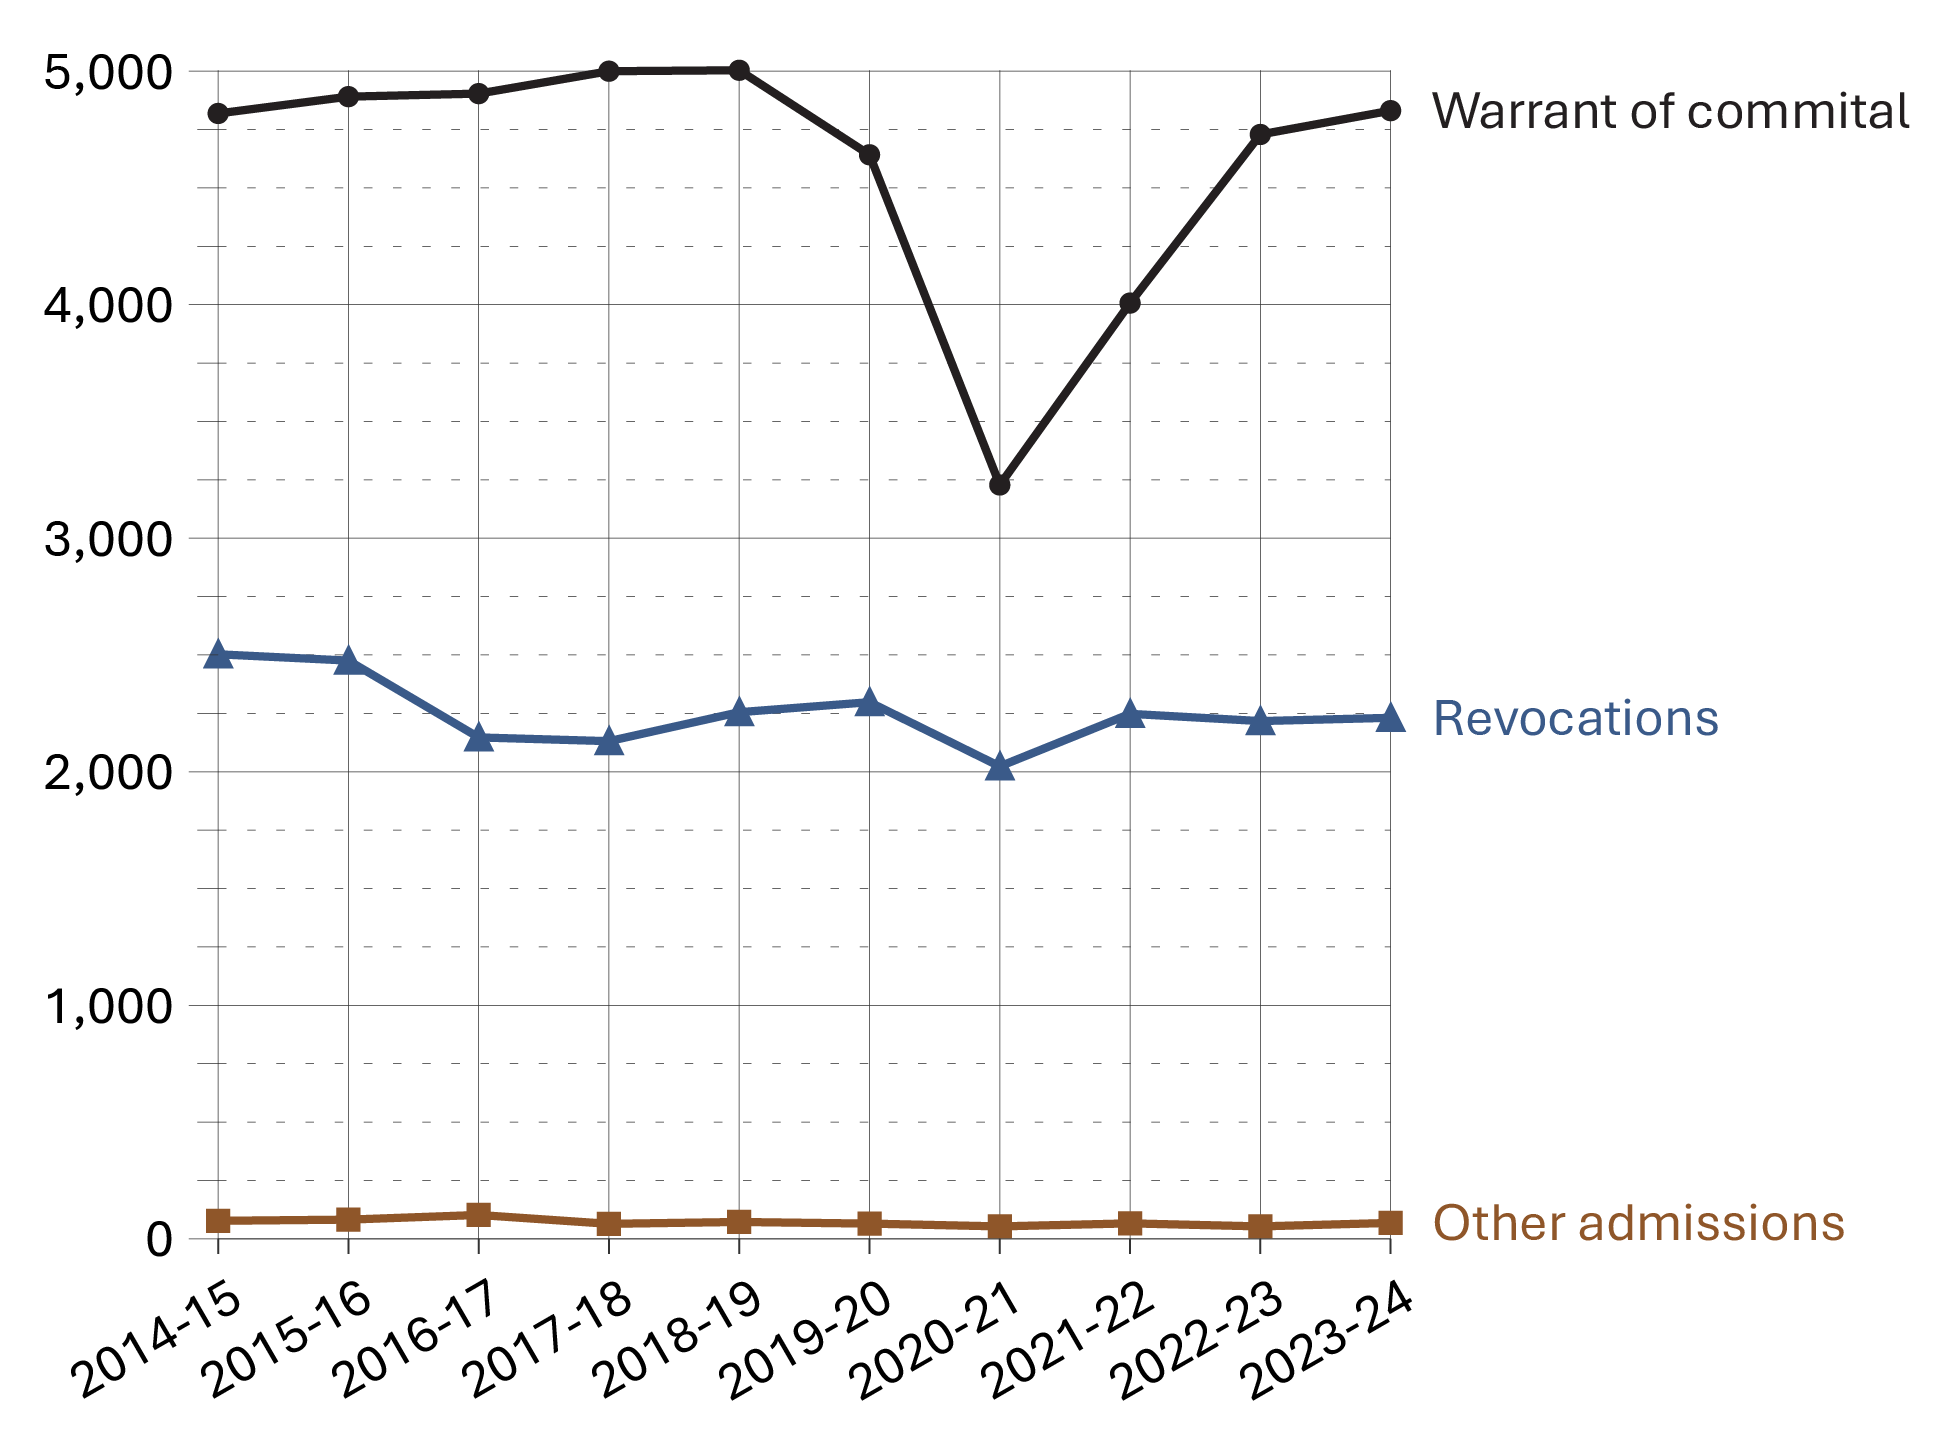
Image description
Line graph illustrating the number of total admissions to a Correctional Service of Canada facility over a ten year period from fiscal year 2014-15 to 2023-24. The graph displays three separate lines categorized by admissions of warrants of committal, revocations, and other admissions. Most admissions are from warrants of committal, which remain relatively high over time but experienced a sharp decline in 2020-21, before returning to peak levels in fiscal year 2023-24. Revocations are much lower overall and remain relatively steady over the 10-year time period. There were very few other admissions across the entire 10-year time period. Full data is available in the table below.
Source: Correctional Service of Canada.
- After peaking at 7,449 in 2015-16, the total number of admissions has decreased by 4.3% to 7,130 in 2023-24.
- The highest number of admissions for female offenders was in 2023-24, with 584 admissions. This is an increase of 23.5% from ten years ago (473 admissions in 2014-2015). Comparatively, between 2014-15 and 2023-24, admissions for male offenders decreased 5.5% (from 6,926 to 6,546 per year).
- The number of warrant of committal admissions has fluctuated over the past 10 fiscal years (from 2014-15 to 2023-24) but has declined by 3.5% when comparing 2023-24 data (4,831 admissions) to the highest point which occurred in fiscal year 2018-19 (5,004 admissions).
- Between 2014-15 and 2023-24, warrant of committal admissions for female offenders increased 16.0% (from 344 to 399 per year) while warrant of committal admissions for male offenders decreased 1.0% over the same timeframe (from 4,475 to 4,432 per year).
- There was a sharp decrease of 30.5% between 2019-20 to 2020-21 in the warrant of committal admissions followed by an increase of 49.7% between 2020-21 and in 2023-24. These results are comparable between both female and male offenders.
| Admission type | 2019-20 | 2020-21 | 2021-22 | 2022-23 | 2023-24 |
|---|---|---|---|---|---|
| Total warrant of committal | 356 | 266 | 294 | 350 | 399 |
1st federal sentence |
324 | 243 | 254 | 300 | 355 |
Subsequent federal sentence |
31 | 23 | 39 | 47 | 44 |
Provincial sentence |
1 | 0 | 1 | 3 | 0 |
| Revocations | 177 | 144 | 141 | 138 | 180 |
| Other | 4 | 8 | 1 | 1 | 5 |
| Total female admissions | 537 | 418 | 436 | 489 | 584 |
Source: Correctional Service of Canada.
| Admission type | 2019-20 | 2020-21 | 2021-22 | 2022-23 | 2023-24 |
|---|---|---|---|---|---|
| Total warrant of committal | 4,286 | 2,962 | 3,713 | 4,379 | 4,432 |
1st federal sentence |
3,165 | 2,154 | 2,775 | 3,322 | 3,382 |
Subsequent federal sentence |
1,107 | 792 | 924 | 1,052 | 1,047 |
Provincial sentence |
14 | 16 | 14 | 5 | 3 |
| Revocations | 2,121 | 1,879 | 2,107 | 2,079 | 2,051 |
| Other | 61 | 45 | 65 | 52 | 63 |
| Total male admissions | 6,468 | 4,886 | 5,885 | 6,510 | 6,546 |
Source: Correctional Service of Canada.
| Admission type | 2019-20 | 2020-21 | 2021-22 | 2022-23 | 2023-24 |
|---|---|---|---|---|---|
| Total warrant of committal | 4,642 | 3,228 | 4,007 | 4,729 | 4,831 |
1st federal sentence |
3,489 | 2,397 | 3,029 | 3,622 | 3,737 |
Subsequent federal sentence |
1,138 | 815 | 963 | 1,099 | 1,091 |
Provincial sentence |
15 | 16 | 15 | 8 | 3 |
| Revocations | 2,298 | 2,023 | 2,248 | 2,217 | 2,231 |
| Other | 65 | 53 | 66 | 53 | 68 |
| Total admissions | 7,005 | 5,304 | 6,321 | 6,999 | 7,130 |
Source: Correctional Service of Canada.
Table C4 Notes
Warrant of Committal is a new admission to federal jurisdiction from the courts.
Revocation is when an offender is admitted to federal custody after conditional release and before reaching warrant expiry.
“Other” includes transfers from other jurisdictions (exchange of services), terminations, transfers from foreign countries, and admissions where a release is interrupted as a consequence of a new conviction.
These numbers refer to the total number of admissions to a federal institution or Healing Lodge during each fiscal year and may be greater than the actual number of offenders admitted, since an individual offender may be admitted more than once in a given year.
There is a lag in the data entry of admissions into CSC's Offender Management System. The admission figures for the most recent year are under-reported by 200-400 admissions at the time of year end data extraction. More accurate figures will be available in the next year's publication. Please use caution when including the most recent year in any trend analysis.
Reported year periods reflect fiscal years. A fiscal year runs from April 1 to March 31 of the following year.
Warrant of committal admissions to CSC facilities by sex: 10-year trend
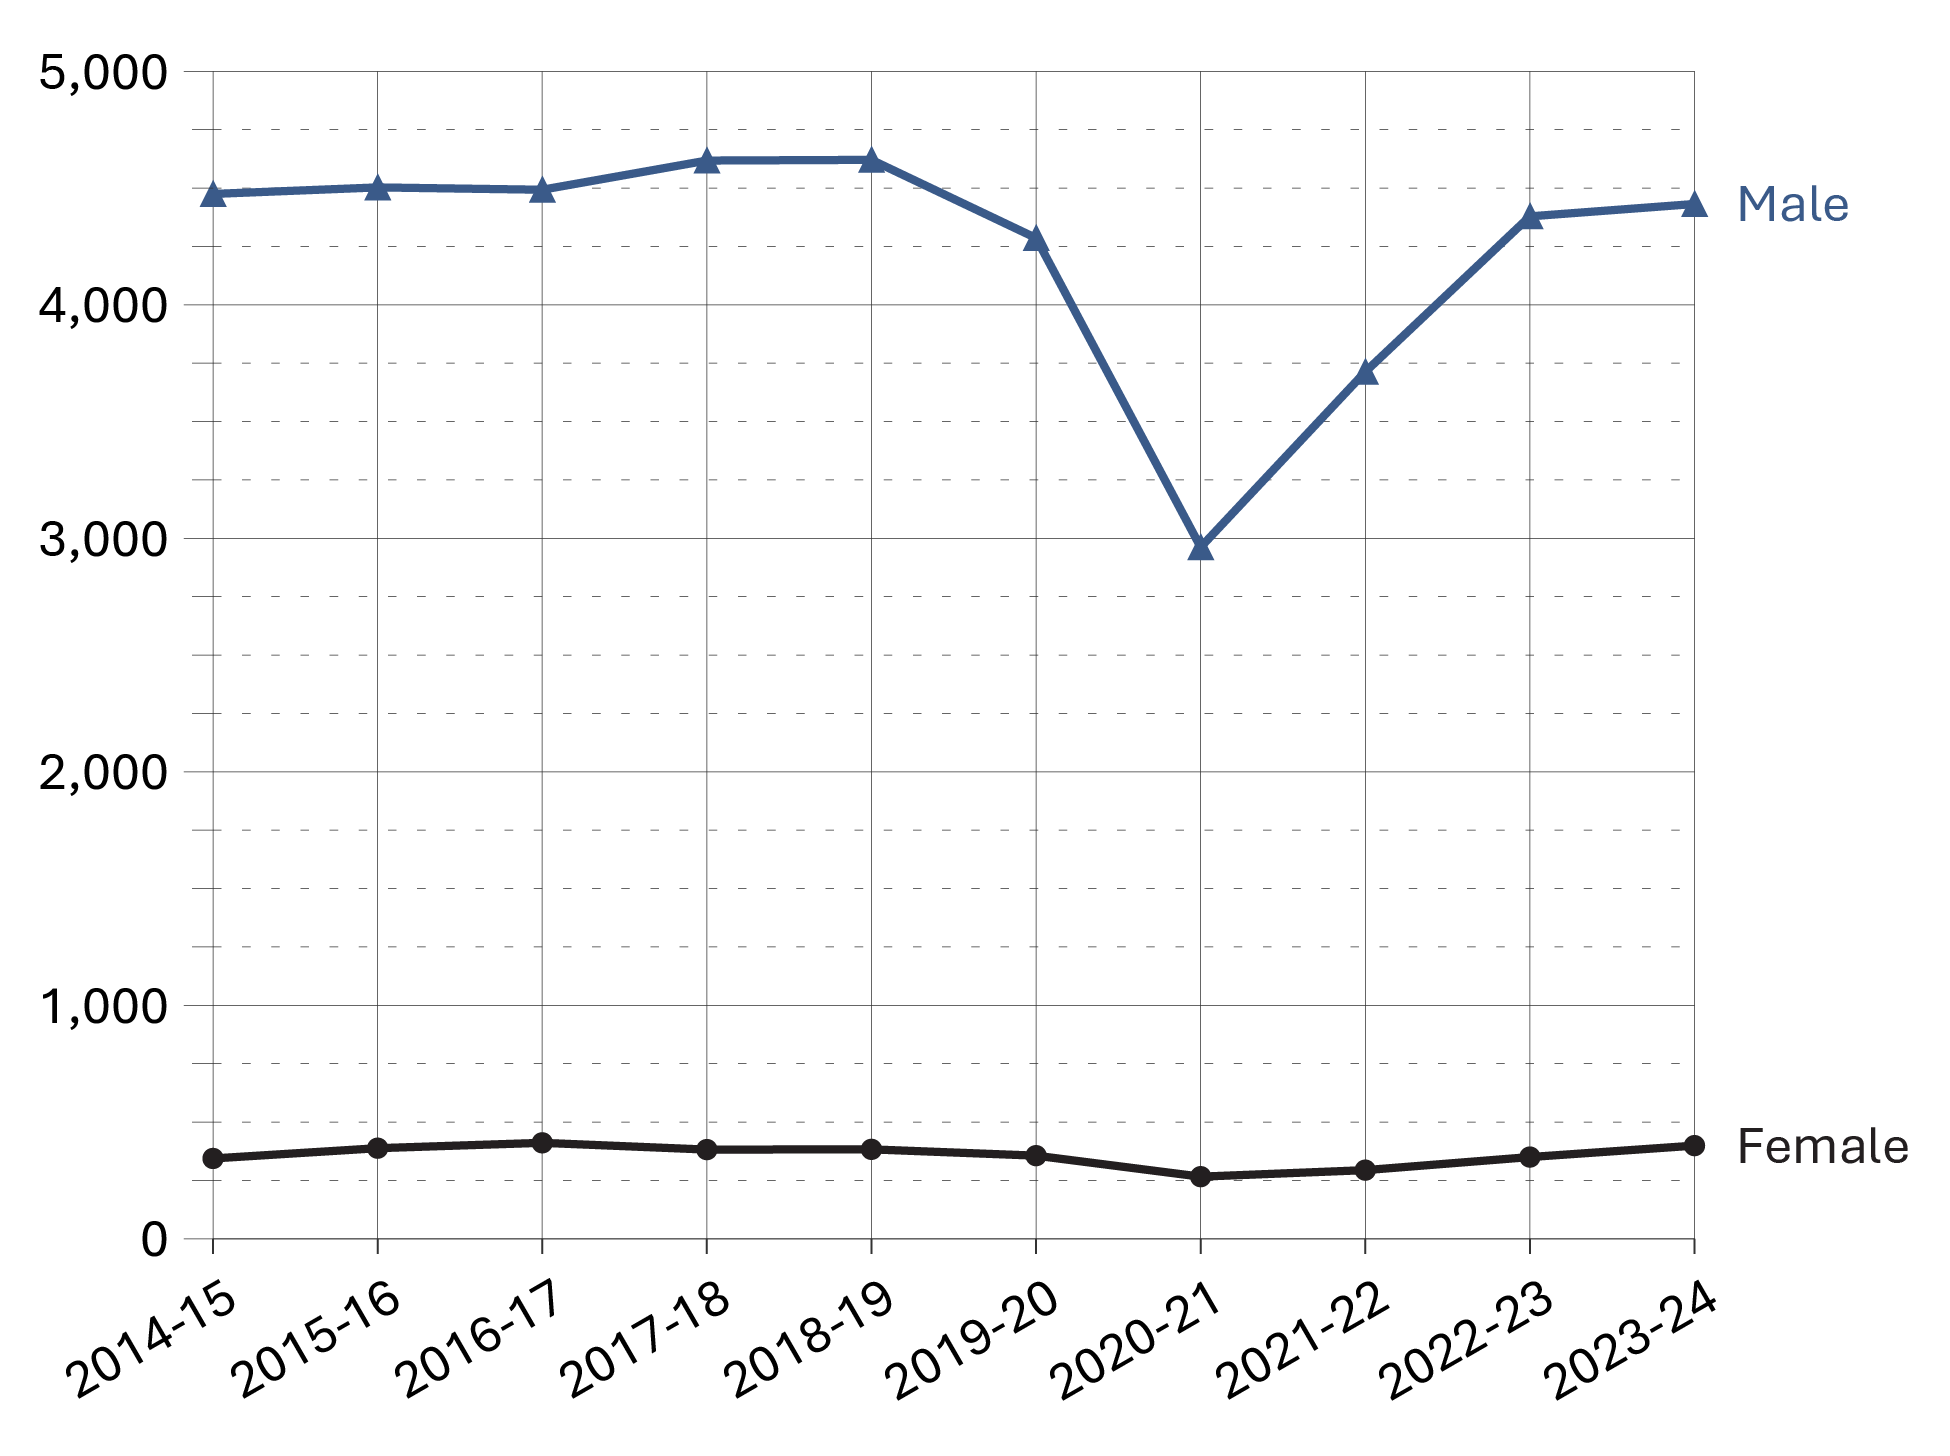
Image description
Line graph illustrating the number of admissions to a Correctional Service Canada facility over a ten year period from fiscal year 2014-15 to 2023-24. The graph displays two separate lines categorized by gender. Males represent a much larger proportion of admissions which are relatively high over time, but reported a sharp decline in 2020-21 before returning to near peak levels in 2022-23. Female admissions were more rare and remained unchanged over time. Full data is available in the table below.
Source: Correctional Service of Canada.
- In the past 5 years, the number of females admitted to CSC facilities on a warrant of committal increased by 12.1% from 356 in 2019-20 to 399 in 2023-24. During the same time period, there was a 3.4% increase in the number of males admitted to CSC facilities on a warrant of committal from 4,286 in 2019-20 to 4,432 in 2023-24.
- Overall, females continue to represent a small proportion of the total number of warrant of committal admissions (i.e., 8.3% in 2023-24).
- At the end of fiscal year 2023-24, there were 736 females and 13,119 males offenders in custody within Correctional Service Canada facilities.
| Fiscal year | Females | % | Males | % | Total |
|---|---|---|---|---|---|
| 2014-15 | 344 | 7.1 | 4,475 | 92.9 | 4,819 |
| 2015-16 | 388 | 7.9 | 4,503 | 92.1 | 4,891 |
| 2016-17 | 411 | 8.4 | 4,493 | 91.6 | 4,904 |
| 2017-18 | 382 | 7.6 | 4,618 | 92.4 | 5,000 |
| 2018-19 | 383 | 7.7 | 4,621 | 92.3 | 5,004 |
| 2019-20 | 356 | 7.7 | 4,286 | 92.3 | 4,642 |
| 2020-21 | 266 | 8.2 | 2,962 | 91.8 | 3,228 |
| 2021-22 | 294 | 7.3 | 3,713 | 92.7 | 4,007 |
| 2022-23 | 350 | 7.4 | 4,379 | 92.6 | 4,729 |
| 2023-24 | 399 | 8.3 | 4,432 | 91.7 | 4,831 |
Source: Correctional Service of Canada.
Table C5 Notes
A warrant of committal is a new admission to federal jurisdiction from the courts.
These numbers refer to the total number of admissions to a federal institution or Healing Lodge during each fiscal year and may be greater than the actual number of offenders admitted, since an individual offender may be admitted more than once in a given year.
There is a lag in the data entry of admissions into CSC's Offender Management System. The admission figures for the most recent year are under-reported by 200-400 admissions at the time of year end data extraction. More accurate figures will be available in the next year's publication. Please use caution when including the most recent year in any trend analysis.
Reported year periods reflect fiscal years. A fiscal year runs from April 1 to March 31 of the following year.
Number of registered victims by gender: 5-year trend
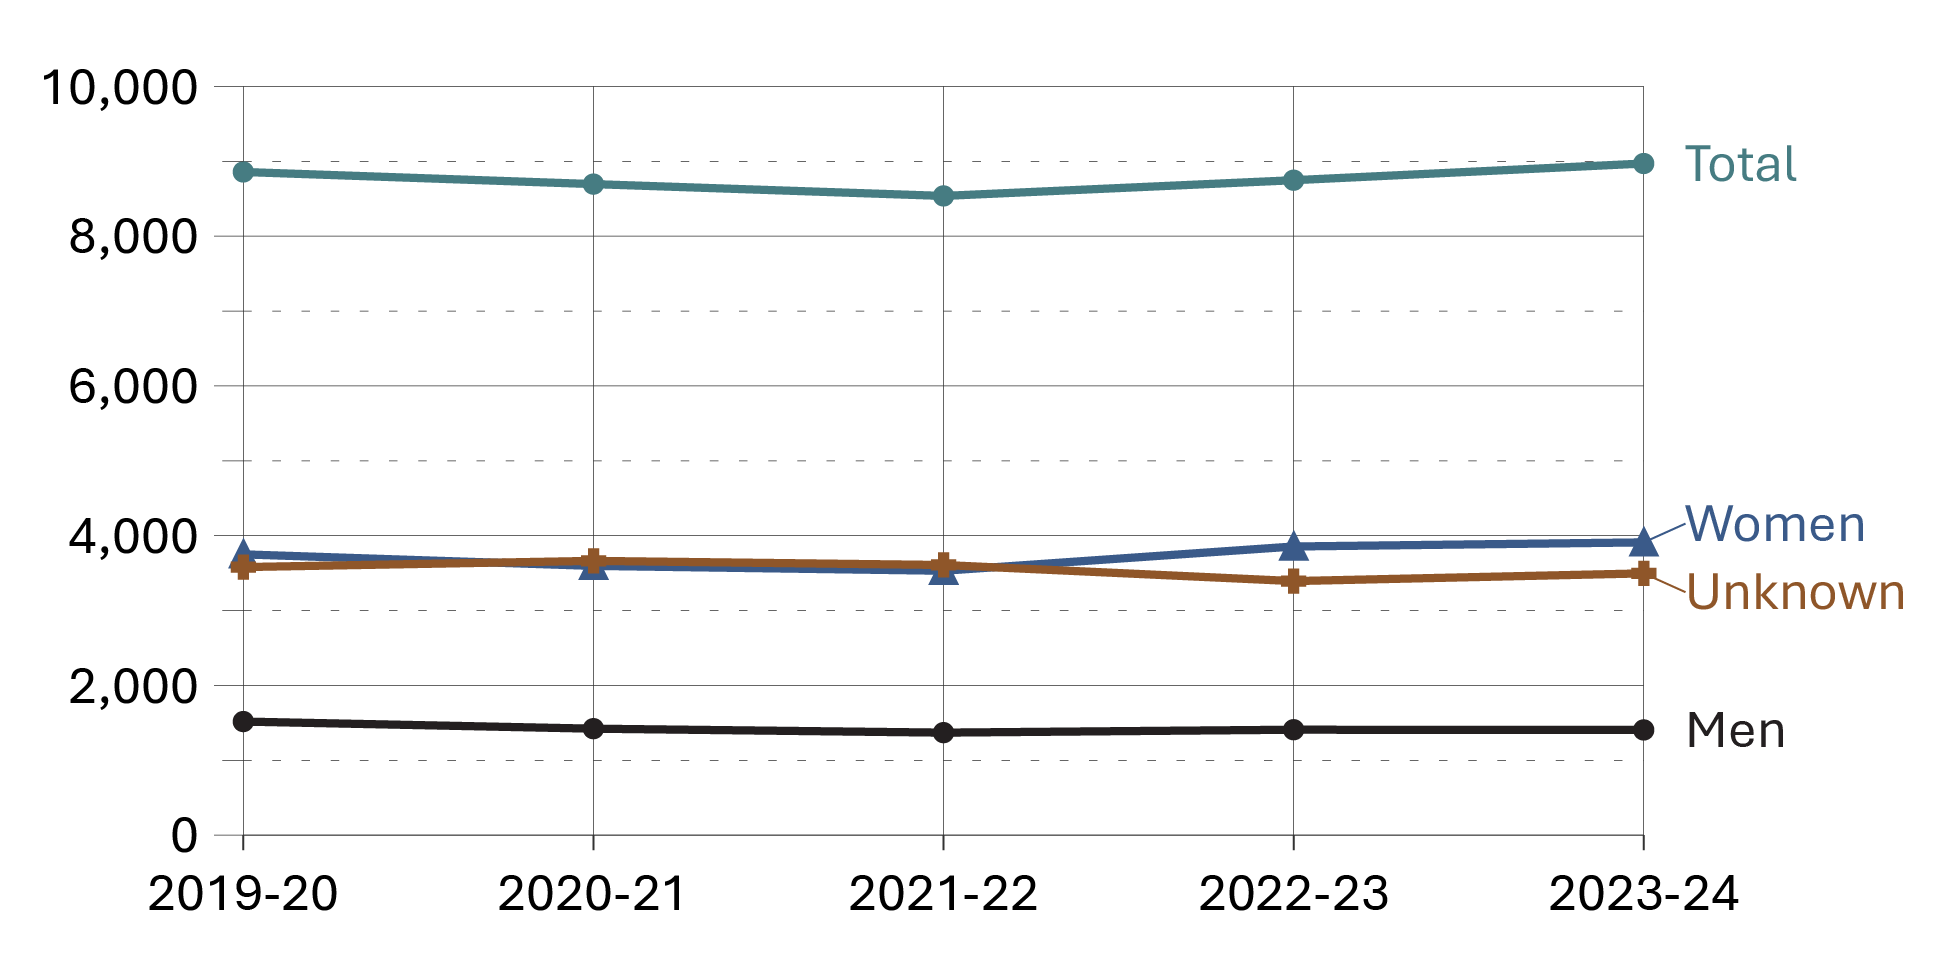
Image description
Line graph showing the number of registered victims categorized by gender, over a five year period from fiscal year 2019-20 to 2023-24. All categories remained stable over the 5-year period. Full data is available in the table below.
Source: Correctional Service of Canada.
- Most registered victims were of unknown gender (39.0%), or identified as women (43.6%).
- Although not displayed, 7 registered victims identified as another genderFootnote ** and 152 registered victims did not want to provide a gender at the end of fiscal year 2023-24.
| Gender | 2019-20 | 2020-21 | 2021-22 | 2022-23 | 2023-24 |
|---|---|---|---|---|---|
| Men | 1,517 | 1,422 | 1,369 | 1,408 | 1,405 |
| Women | 3,750 | 3,596 | 3,531 | 3,855 | 3,910 |
| Another genderFootnote ** | 0 | 0 | 2 | 4 | 7 |
| Does not want to provide | 10 | 14 | 27 | 87 | 152 |
| Unknown | 3,580 | 3,663 | 3,608 | 3,393 | 3,496 |
| Total | 8,857 | 8,695 | 8,537 | 8,747 | 8,970 |
Source: Correctional Service of Canada.
Table C6 Notes
CSC total offender population by sentence length
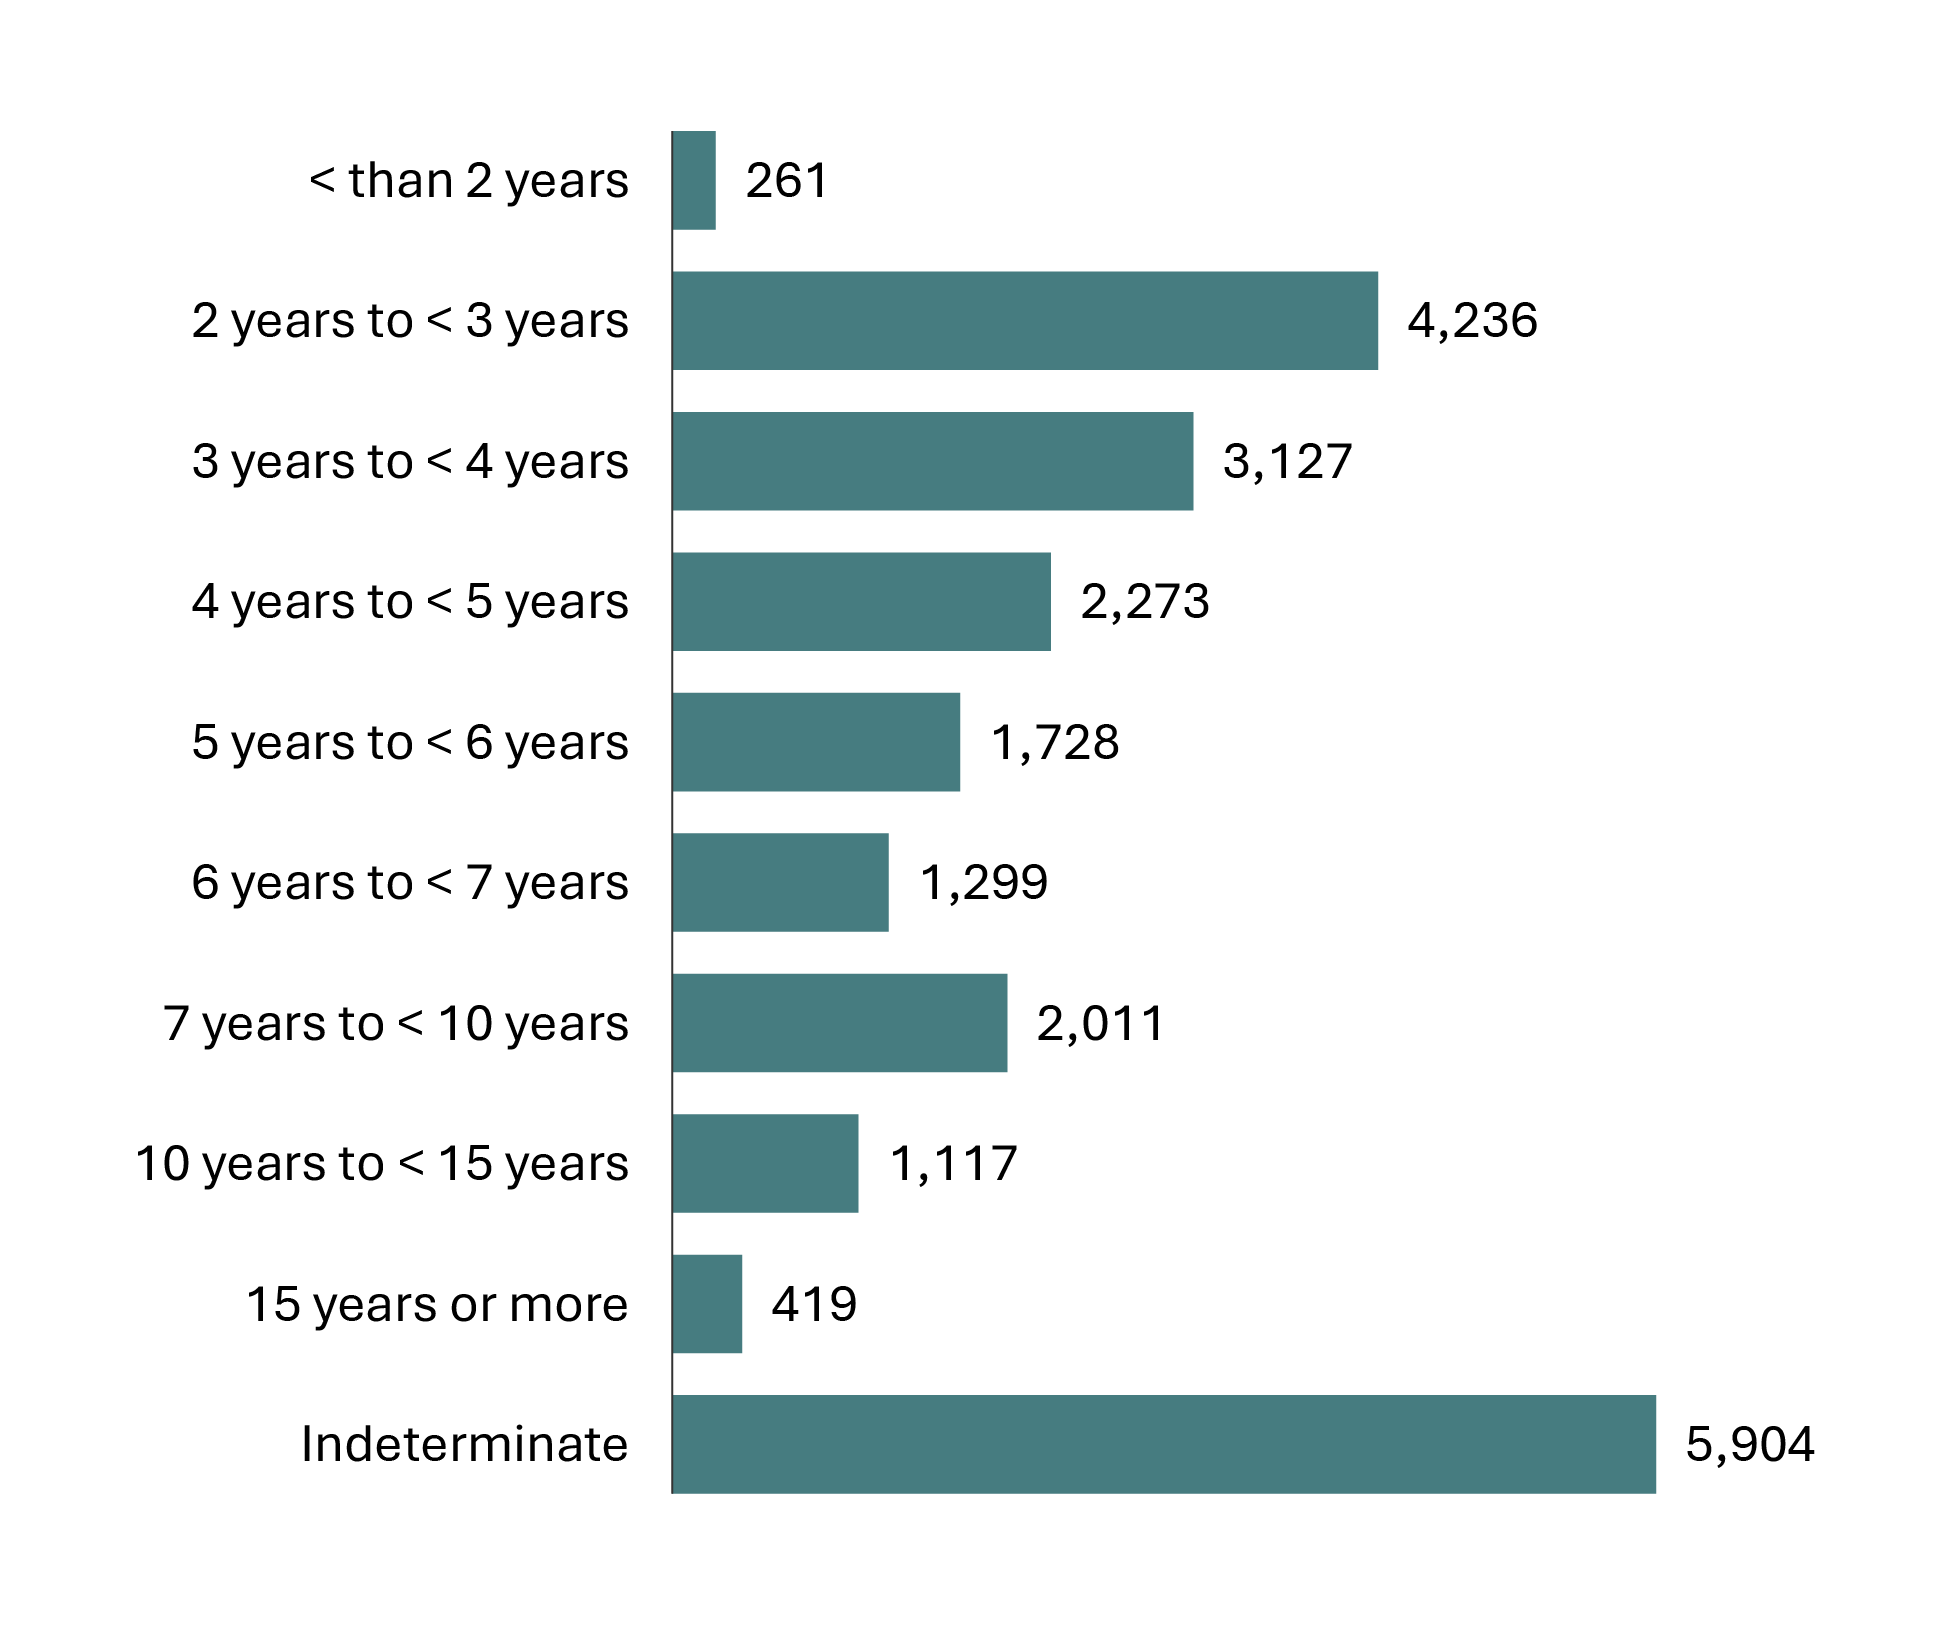
Image description
Bar graph illustrating the sentence length of the total Correctional Service of Canada offender population in fiscal year 2023-24. Sentence lengths include less than 2 years, 2 years to less than 3 years, 3 years to less than 4 years, 4 years to less than 5 years, 5 years to less than 6 years, 6 years to less than 7 years, 7 years to less than 10 years, 10 years to less than 15 years, 15 or more years, and indeterminate sentences. Most offenders have an indeterminate sentence, followed by sentences of 2 years to less than 3 years, and 3 years to less than 4 years, and 7 years to less than 10 years. The sentence lengths with the fewest offender populations were less than 2 years, followed by 15 years or more. Full data is available in the table below.
Source: Correctional Service of Canada.
- In 2023-24, almost half (44.2%) of the total offender population was serving a sentence of less than 5 years with 20.1% serving a sentence less than 3 years.
- 5,904 offenders were serving an indeterminate sentence representing 26.4% of the total offender population. The total number of offenders with indeterminate sentences has increased 2.4% since 2019-20 from 5,764 to 5,904 in 2023-24.
| Sentence length | 2019-20 | % | 2020-21 | % | 2021-22 | % | 2022-23 | % | 2023-24 | % |
|---|---|---|---|---|---|---|---|---|---|---|
| < than 2 years | 307 | 1.3 | 293 | 1.4 | 267 | 1.3 | 253 | 1.2 | 261 | 1.2 |
| 2 years to < 3 years | 5,149 | 22.3 | 4,321 | 20.1 | 3,814 | 18.3 | 4,034 | 18.9 | 4,236 | 18.9 |
| 3 years to < 4 years | 3,389 | 14.7 | 3,060 | 14.2 | 2,917 | 14.0 | 2,886 | 13.5 | 3,127 | 14.0 |
| 4 years to < 5 years | 2,371 | 10.3 | 2,157 | 10.0 | 2,070 | 9.9 | 2,114 | 9.9 | 2,273 | 10.2 |
| 5 years to < 6 years | 1,692 | 7.3 | 1,598 | 7.4 | 1,605 | 7.7 | 1,678 | 7.8 | 1,728 | 7.7 |
| 6 years to < 7 years | 1,153 | 5.0 | 1,130 | 5.3 | 1,152 | 5.5 | 1,216 | 5.7 | 1,299 | 5.8 |
| 7 years to < 10 years | 1,841 | 8.0 | 1,795 | 8.3 | 1,795 | 8.6 | 1,893 | 8.9 | 2,011 | 9.0 |
| 10 years to < 15 years | 1,010 | 4.4 | 999 | 4.6 | 991 | 4.8 | 1,063 | 5.0 | 1,117 | 5.0 |
| 15 years or more | 426 | 1.8 | 404 | 1.9 | 403 | 1.9 | 409 | 1.9 | 419 | 1.9 |
| Indeterminate | 5,764 | 25.0 | 5,755 | 26.8 | 5,792 | 27.8 | 5,838 | 27.3 | 5,904 | 26.4 |
| Total | 23,102 | 100.0 | 21,512 | 100.0 | 20,806Footnote * | 100.0 | 21,384 | 100.0 | 22,375 | 100.0 |
Source: Correctional Service of Canada.
Table C7 Notes
Offences of victimization among registered victims
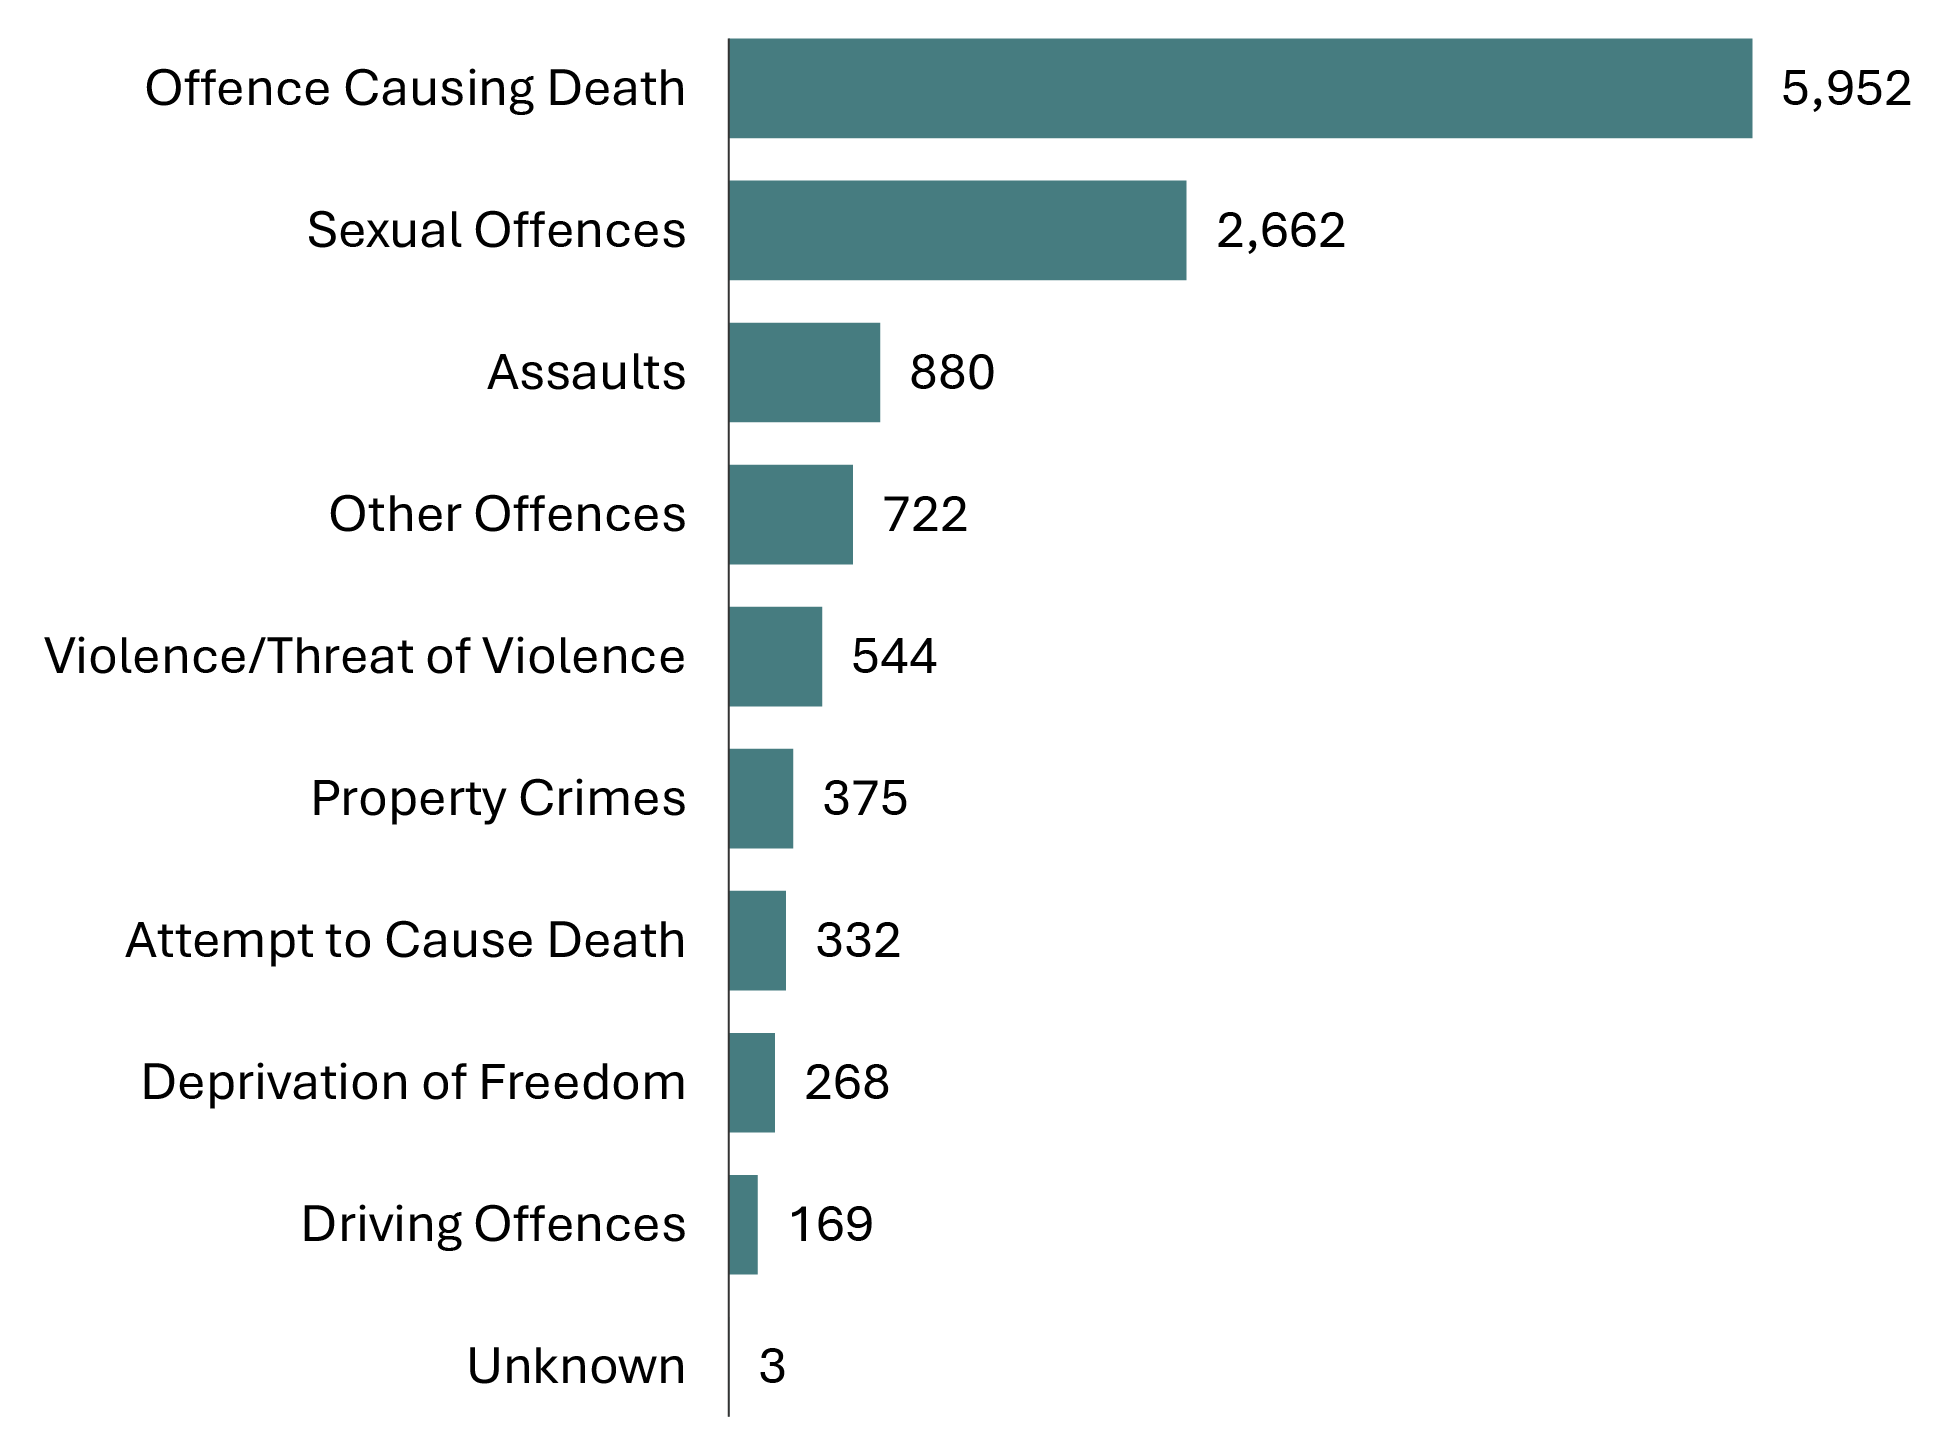
Image description
Bar graph showing a snapshot of offences of victimization among registered victims by offence type in the 2023-24 fiscal year. Offence types included are offence causing death, sexual offences, assaults, other offences, violence/threat of violence, property crimes, attempt to cause death, deprivation of freedom, driving offences, and unknown. Most offences of victimization were those causing death, followed by sexual offences and assaults. Driving offences were reported the least frequently. Full data are available in the table below.
Source: Correctional Service of Canada.
- Offences causing death accounted for half of all offences of victimization (50.0%).
- Sexual offences were the second most common offence of victimization (22.4%).
| Offence type | 2019-20 | % | 2020-21 | % | 2021-22 | % | 2022-23 | % | 2023-24 | % |
|---|---|---|---|---|---|---|---|---|---|---|
| Offence causing death | 5,629 | 47.8 | 5,597 | 48.5 | 5,653 | 49.5 | 5,836 | 50.0 | 5,952 | 50.0 |
| Sexual offences | 2,517 | 21.4 | 2,483 | 21.5 | 2,464 | 21.6 | 2,559 | 21.9 | 2,662 | 22.4 |
| Assaults | 932 | 7.9 | 903 | 7.8 | 828 | 7.3 | 828 | 7.1 | 880 | 7.4 |
| Other offences | 762 | 6.5 | 696 | 6.0 | 689 | 6.0 | 732 | 6.3 | 722 | 6.1 |
| Violence/ Threat of violence | 540 | 4.6 | 555 | 4.8 | 555 | 4.9 | 520 | 4.5 | 544 | 4.6 |
| Property crimes | 540 | 4.6 | 501 | 4.3 | 438 | 3.8 | 394 | 3.4 | 375 | 3.1 |
| Attempt to cause death | 338 | 2.9 | 341 | 3.0 | 325 | 2.8 | 329 | 2.8 | 332 | 2.8 |
| Deprivation of freedom | 279 | 2.4 | 260 | 2.3 | 260 | 2.3 | 257 | 2.2 | 268 | 2.3 |
| Driving offences | 229 | 1.9 | 198 | 1.7 | 204 | 1.8 | 211 | 1.8 | 169 | 1.4 |
| Unknown | 4 | 0.0 | 3 | 0.0 | 2 | 0.0 | 2 | 0.0 | 3 | 0.0 |
| Total number of offences | 11,770 | 100.0 | 11,537 | 100.0 | 11,418 | 100.0 | 11,668 | 100.0 | 11,907 | 100.0 |
Source: Correctional Service of Canada.
Table C8 Notes
The Canadian Victims Bill of Rights defines a victim as an individual who has suffered physical or emotional harm, property damage, or economic loss as the result of the commission or alleged commission of an offence. The CCRA also allows a spouse, a relative or dependant, an individual who is responsible for the care or support of the victim or the care or support of a dependant of the victim, to act on behalf of a victim, if the victim cannot act on their own behalf. Victims include persons harmed as the result of an act of an offender, whether or not the offender was prosecuted or convicted for that act, as long as an official complaint has been made to the police or to the Crown.
Victims do not automatically receive information about the offender who harmed them. If they have been harmed by an offender serving a sentence of two years or more, victims are asked to register with the Correctional Service of Canada (CSC) or the Parole Board of Canada to receive information or access services. The registration process allows CSC to verify that the individual meets the definition of victim, which is required under law before sharing protected offender information.
For more information about victim registration, visit: https://www.canada.ca/en/correctional-service/services/you-csc/victims/register.html
Offences of victimization are acts the offender committed that harmed the victim, and have been confirmed using police reports or judge's comments. The offender may not have been convicted of each act or may be serving a federal sentence for different offences. This could be a result of plea deals, because charges were not pursued by the Crown, or the offence may be from a previous sentence or a provincial sentence. Offences of victimization are limited to victims registered with CSC.
More than 1 offence of victimization may be recorded for each victim.
"Deprivation of freedom" offences are offences such as kidnapping, forcible confinement, hostage taking, or abduction.
Reported year periods reflect fiscal years. A fiscal year runs from April 1 to March 31 of the following year.
Warrant of committal admissions to a CSC facility by age
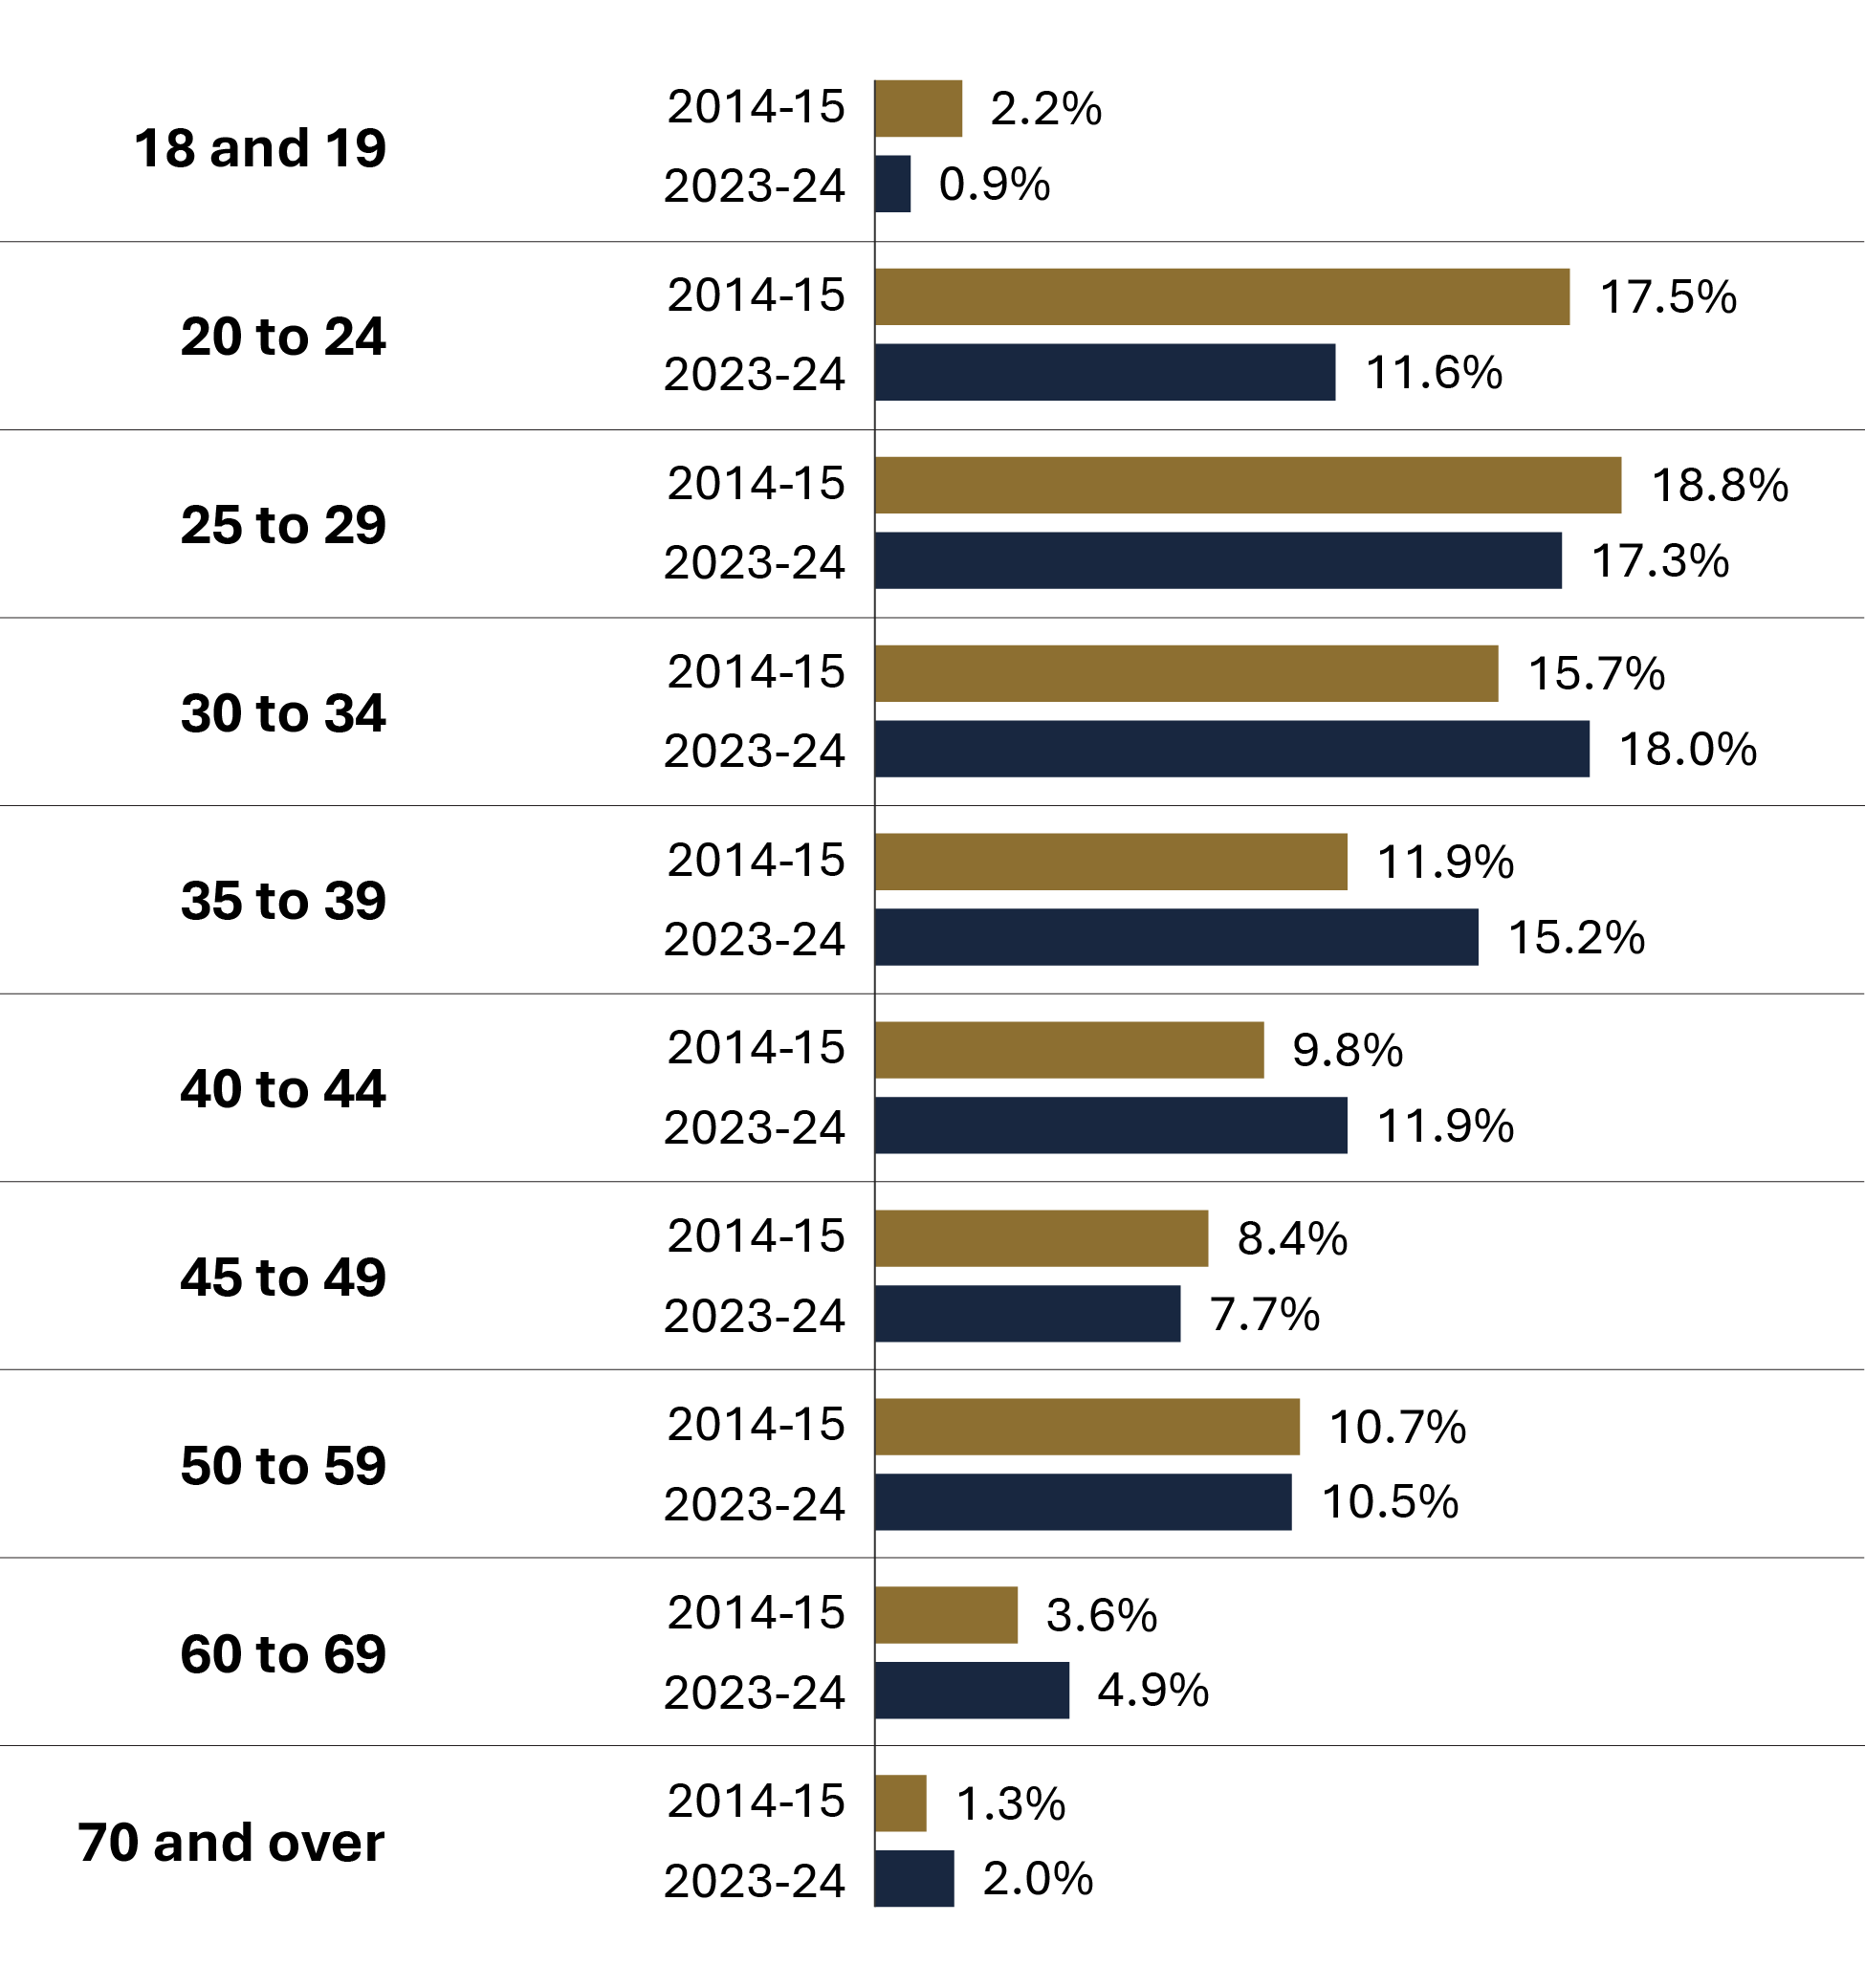
Image description
Bar graph showing the percentage of warrant committal admissions to a Correctional Service of Canada facility by age for fiscal year 2014-15 and for fiscal year 2023-24. The age groups included in the graph are 18 to 19, 20 to 24, 25 to 29, 30 to 34, 35 to 39, 40 to 44, 45 to 49, 50 to 59, 60 to 69, and 70 and over. The largest proportion of admissions for fiscal year 2014-15 was in the 25 to 29 age group. For the 2023-24 fiscal year, the largest proportion was for age group 30 to 34. Full data are available in the table below.
Source: Correctional Service of Canada.
- In 2023-24, 28.9% of offenders admitted on a warrant of committal to CSC facilities were between the ages of 20 and 29, and 33.2% were between 30 and 39 years of age.
- In 2023-24 most warrant of committal admissions were among those aged 30 to 34, while in 2014-15 it was among those aged 25 to 29.
- The median age of the population upon warrant of committal admission in 2023-24 was 35, compared to a median age of 33 in 2014-15.
- The number of offenders between the ages of 18 and 19 at admission decreased from 104 in 2014-15 to 43 in 2023-24, representing a 58.7% decrease.
- The number of offenders between the ages of 40 and 49 at admission increased from 881 in 2014-15 to 947 in 2023-24, representing a 7.5% increase.
- The number of offenders between the ages of 50 and 59 at admission decreased from 518 in 2014-15 to 509 in 2023-24 representing a 1.7% decrease.
- The number of offenders aged 70 and over at admission increased from 65 in 2014-15 to 95 in 2023-24, representing a 46.2% increase.
Table C9. Warrant of committal admissions by age and sex: 10-year comparison
| Age at admission | Females | % | Males | % | Total | % |
|---|---|---|---|---|---|---|
| 18 to 19 | 9 | 2.6 | 95 | 2.1 | 104 | 2.2 |
| 20 to 24 | 53 | 15.4 | 790 | 17.7 | 843 | 17.5 |
| 25 to 29 | 83 | 24.1 | 821 | 18.3 | 904 | 18.8 |
| 30 to 34 | 58 | 16.9 | 698 | 15.6 | 756 | 15.7 |
| 35 to 39 | 34 | 9.9 | 540 | 12.1 | 574 | 11.9 |
| 40 to 44 | 34 | 9.9 | 440 | 9.8 | 474 | 9.8 |
| 45 to 49 | 29 | 8.4 | 378 | 8.4 | 407 | 8.4 |
| 50 to 59 | 37 | 10.8 | 481 | 10.7 | 518 | 10.7 |
| 60 to 69 | 6 | 1.7 | 168 | 3.8 | 174 | 3.6 |
| 70 and over | 1 | 0.3 | 64 | 1.4 | 65 | 1.3 |
| Total | 344 | 100.0 | 4,475 | 100.0 | 4,819 | 100.0 |
| Age at admission | Females | % | Males | % | Total | % |
|---|---|---|---|---|---|---|
| 18 to 19 | 1 | 0.3 | 42 | 0.9 | 43 | 0.9 |
| 20 to 24 | 31 | 7.8 | 529 | 11.9 | 560 | 11.6 |
| 25 to 29 | 71 | 17.8 | 765 | 17.3 | 836 | 17.3 |
| 30 to 34 | 89 | 22.3 | 779 | 17.6 | 868 | 18.0 |
| 35 to 39 | 73 | 18.3 | 663 | 15.0 | 736 | 15.2 |
| 40 to 44 | 61 | 15.3 | 514 | 11.6 | 575 | 11.9 |
| 45 to 49 | 24 | 6.0 | 348 | 7.9 | 372 | 7.7 |
| 50 to 59 | 30 | 7.5 | 479 | 10.8 | 509 | 10.5 |
| 60 to 69 | 16 | 4.0 | 221 | 5.0 | 237 | 4.9 |
| 70 and over | 3 | 0.8 | 92 | 2.1 | 95 | 2.0 |
| Total | 399 | 100.0 | 4,432 | 100.0 | 4,831 | 100.0 |
Source: Correctional Service of Canada.
Table C9 Notes
A warrant of committal is a new admission to federal jurisdiction from the courts.
These numbers refer to the total number of admissions to a federal institution or Healing Lodge during each fiscal year and may be greater than the actual number of offenders admitted, since an individual offender may be admitted more than once in a given year.
There is a lag in the data entry of admissions into CSC's Offender Management System. The admission figures for the most recent year are under-reported by 200-400 admissions at the time of year end data extraction. More accurate figures will be available in the next year's publication. Please use caution when including the most recent year in any trend analysis.
Due to rounding, percentages may not add to 100 percent.
Reported year periods reflect fiscal years. A fiscal year runs from April 1 to March 31 of the following year.
Number of registered victims by age
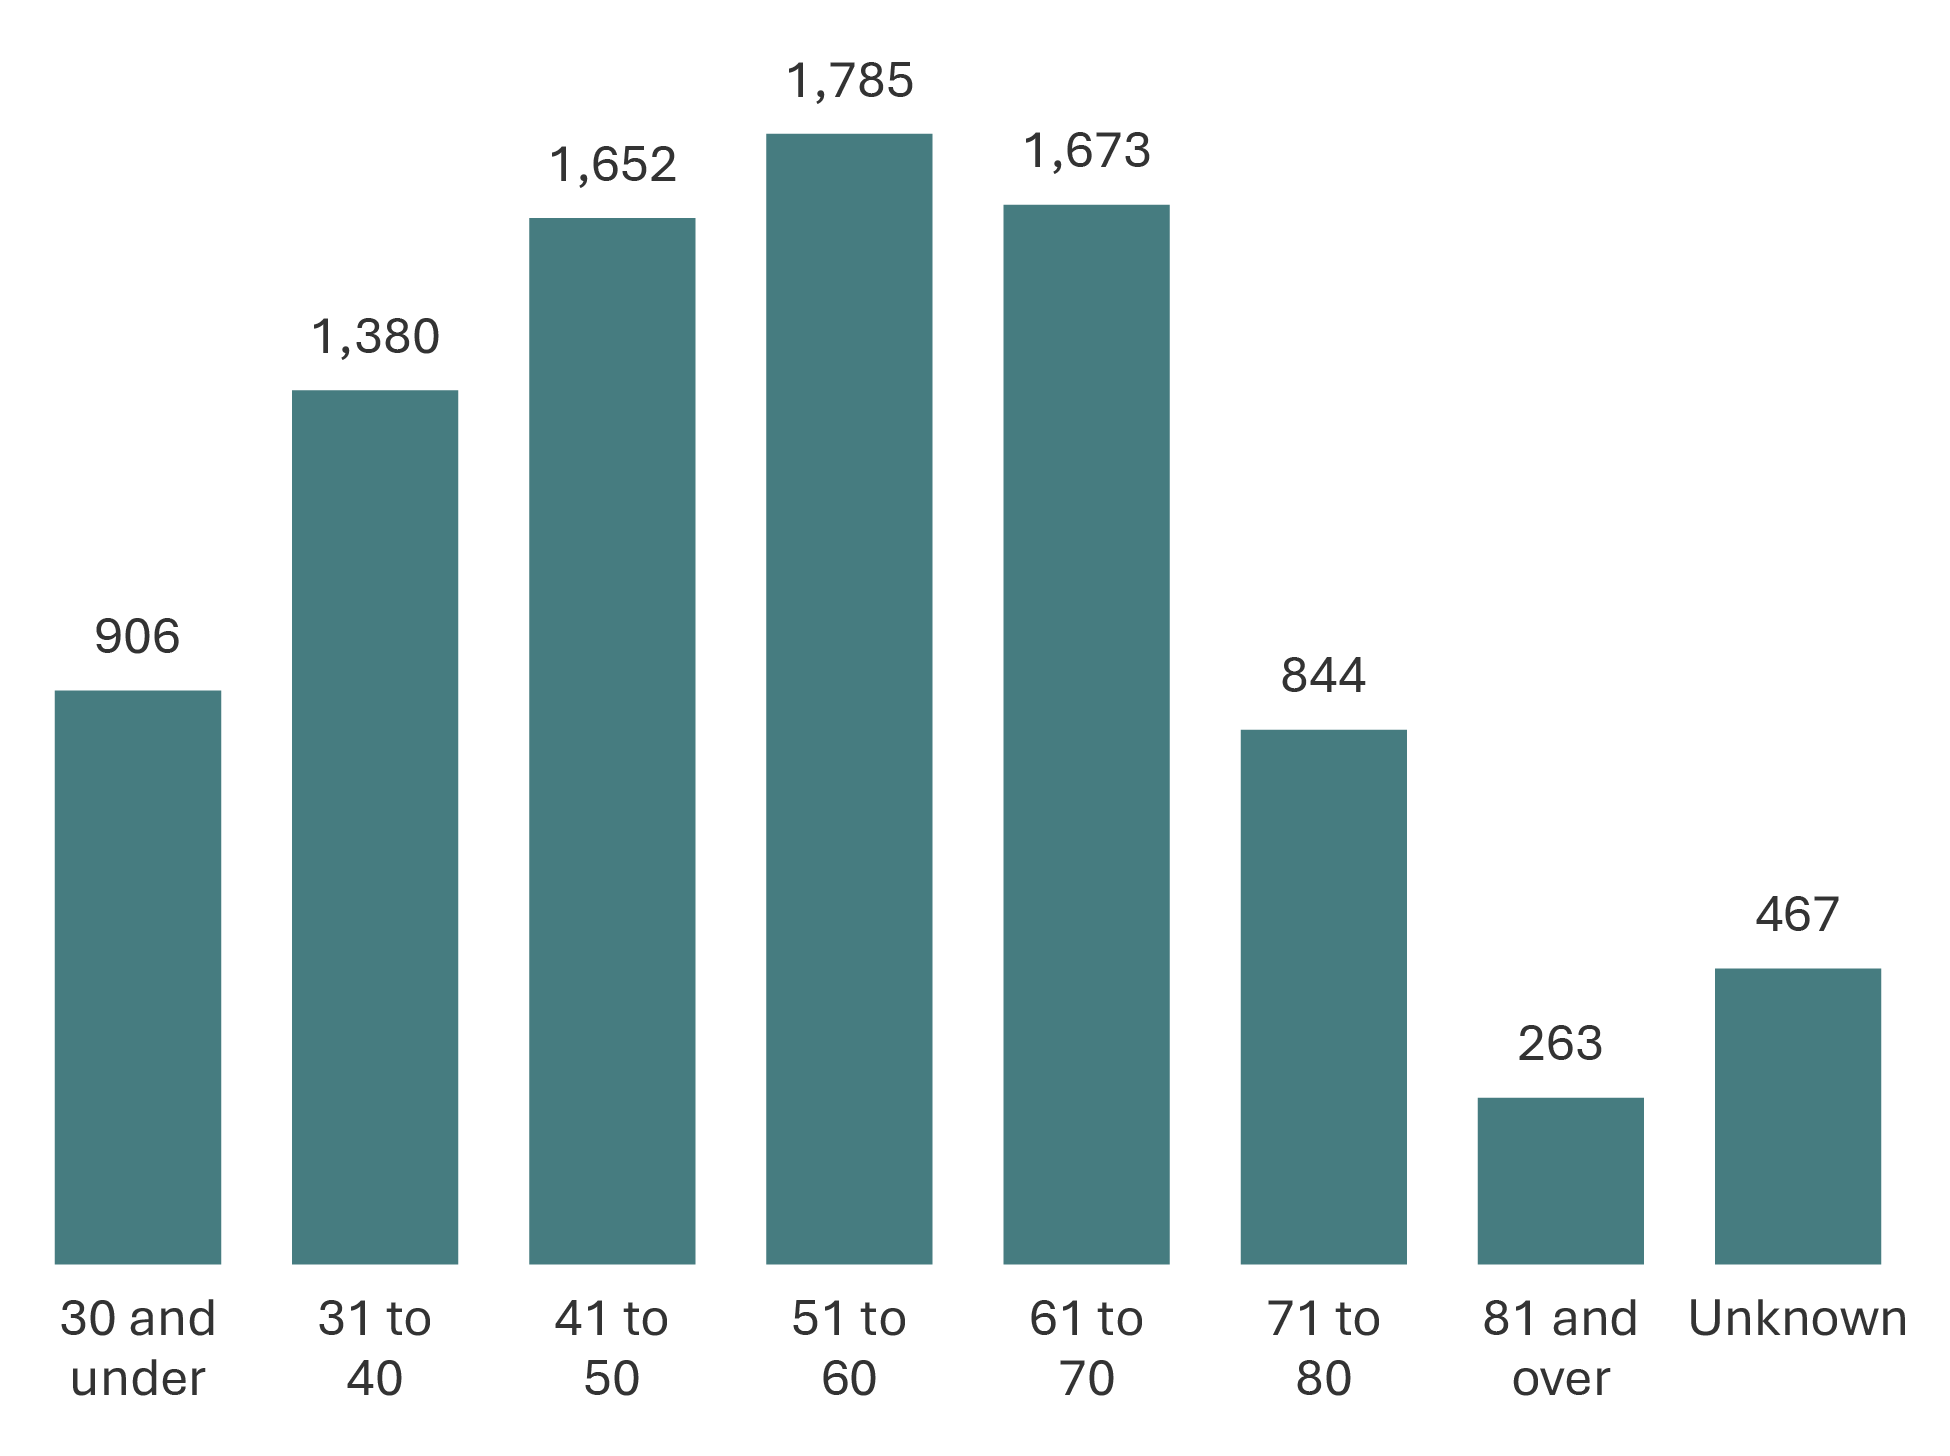
Image description
Bar graph showing the number of registered victims by age in fiscal year 2023-24. The age groups included in the graph are 30 and under, 31 to 40, 41 to 50, 51 to 60, 61 to 70, 71 to 80, 81 and over, and unknown. The largest proportion of registered victims are 51 to 60 years old, followed by age group 61 to 70, and very closely by 41 to 50. Full data are available in the table below.
Source: Correctional Service of Canada.
- In 2023-24, 57.0% of registered victims were aged 41 to 70. The greatest proportion of victims was in the 51-60 age group (19.9%). This pattern has remained consistent over the past 5 fiscal years (from 2019-20 to 2023-24).
| Age group | 2019-20 | % | 2020-21 | % | 2021-22 | % | 2022-23 | % | 2023-24 | % |
|---|---|---|---|---|---|---|---|---|---|---|
| 30 and under | 957 | 10.8 | 881 | 10.1 | 788 | 9.2 | 825 | 9.4 | 906 | 10.1 |
| 31 to 40 | 1,274 | 14.4 | 1,288 | 14.8 | 1,313 | 15.4 | 1,359 | 15.5 | 1,380 | 15.4 |
| 41 to 50 | 1,598 | 18.0 | 1,585 | 18.2 | 1,517 | 17.8 | 1,552 | 17.7 | 1,652 | 18.4 |
| 51 to 60 | 1,928 | 21.8 | 1,852 | 21.3 | 1,808 | 21.2 | 1,805 | 20.6 | 1,785 | 19.9 |
| 61 to 70 | 1,455 | 16.4 | 1,504 | 17.3 | 1,546 | 18.1 | 1,638 | 18.7 | 1,673 | 18.7 |
| 71 to 80 | 715 | 8.1 | 748 | 8.6 | 766 | 9.0 | 799 | 9.1 | 844 | 9.4 |
| 81 and older | 246 | 2.8 | 252 | 2.9 | 258 | 3.0 | 263 | 3.0 | 263 | 2.9 |
| Unknown | 684 | 7.7 | 585 | 6.7 | 541 | 6.3 | 506 | 5.8 | 467 | 5.2 |
| Total | 8,857 | 100.0 | 8,695 | 100.0 | 8,537 | 100.0 | 8,747 | 100.0 | 8,970 | 100.0 |
Source: Correctional Service of Canada.
Table C10 Notes
The Canadian Victims Bill of Rights defines a victim as an individual who has suffered physical or emotional harm, property damage, or economic loss as the result of the commission or alleged commission of an offence. The CCRA also allows a spouse, a relative or dependant, an individual who is responsible for the care or support of the victim or the care or support of a dependant of the victim, to act on behalf of a victim, if the victim cannot act on their own behalf. Victims include persons harmed as the result of an act of an offender, whether or not the offender was prosecuted or convicted for that act, as long as an official complaint has been made to the police or to the Crown.
Victims do not automatically receive information about the offender who harmed them. If they have been harmed by an offender serving a sentence of 2 years or more, victims are asked to register with the Correctional Service of Canada (CSC) or the Parole Board of Canada to receive information or access services. The registration process allows CSC to verify that the individual meets the definition of victim, which is required under law before sharing protected offender information.
For more information about victim registration, visit: https://www.canada.ca/en/correctional-service/services/you-csc/victims/register.html
Representatives acting on behalf of a victim are not included in the count unless they are also registered victims. In all cases, the reported age corresponds to the victim, not the representative.
Reporting rates ranged from 92.3% in 2019-2020 to 94.8% in 2023-2024. The difference between the total number of registered victims and the number of victims who reported their age is the result of victims choosing not to report their age during registration, or their age is unknown to CSC. The information does not represent victims who have not been in contact with CSC or those who choose not to register.
Victim registration fluctuates for a number of reasons beyond organizational control. Contributing factors impacting victim registration data could be due to offenders reaching the end of their sentence or death, victims opting out of notifications for reasons such as personal preferences, death or loss of contact.
Note that all registered victims are 18 years of age or older except for exceptional circumstances (i.e., emancipations).
Due to rounding, percentages may not add to 100 percent.
Reported year periods reflect fiscal years. A fiscal year runs from April 1 to March 31 of the following year.
Warrant of committal admissions to a CSC facility for Indigenous and non-Indigenous offenders by age
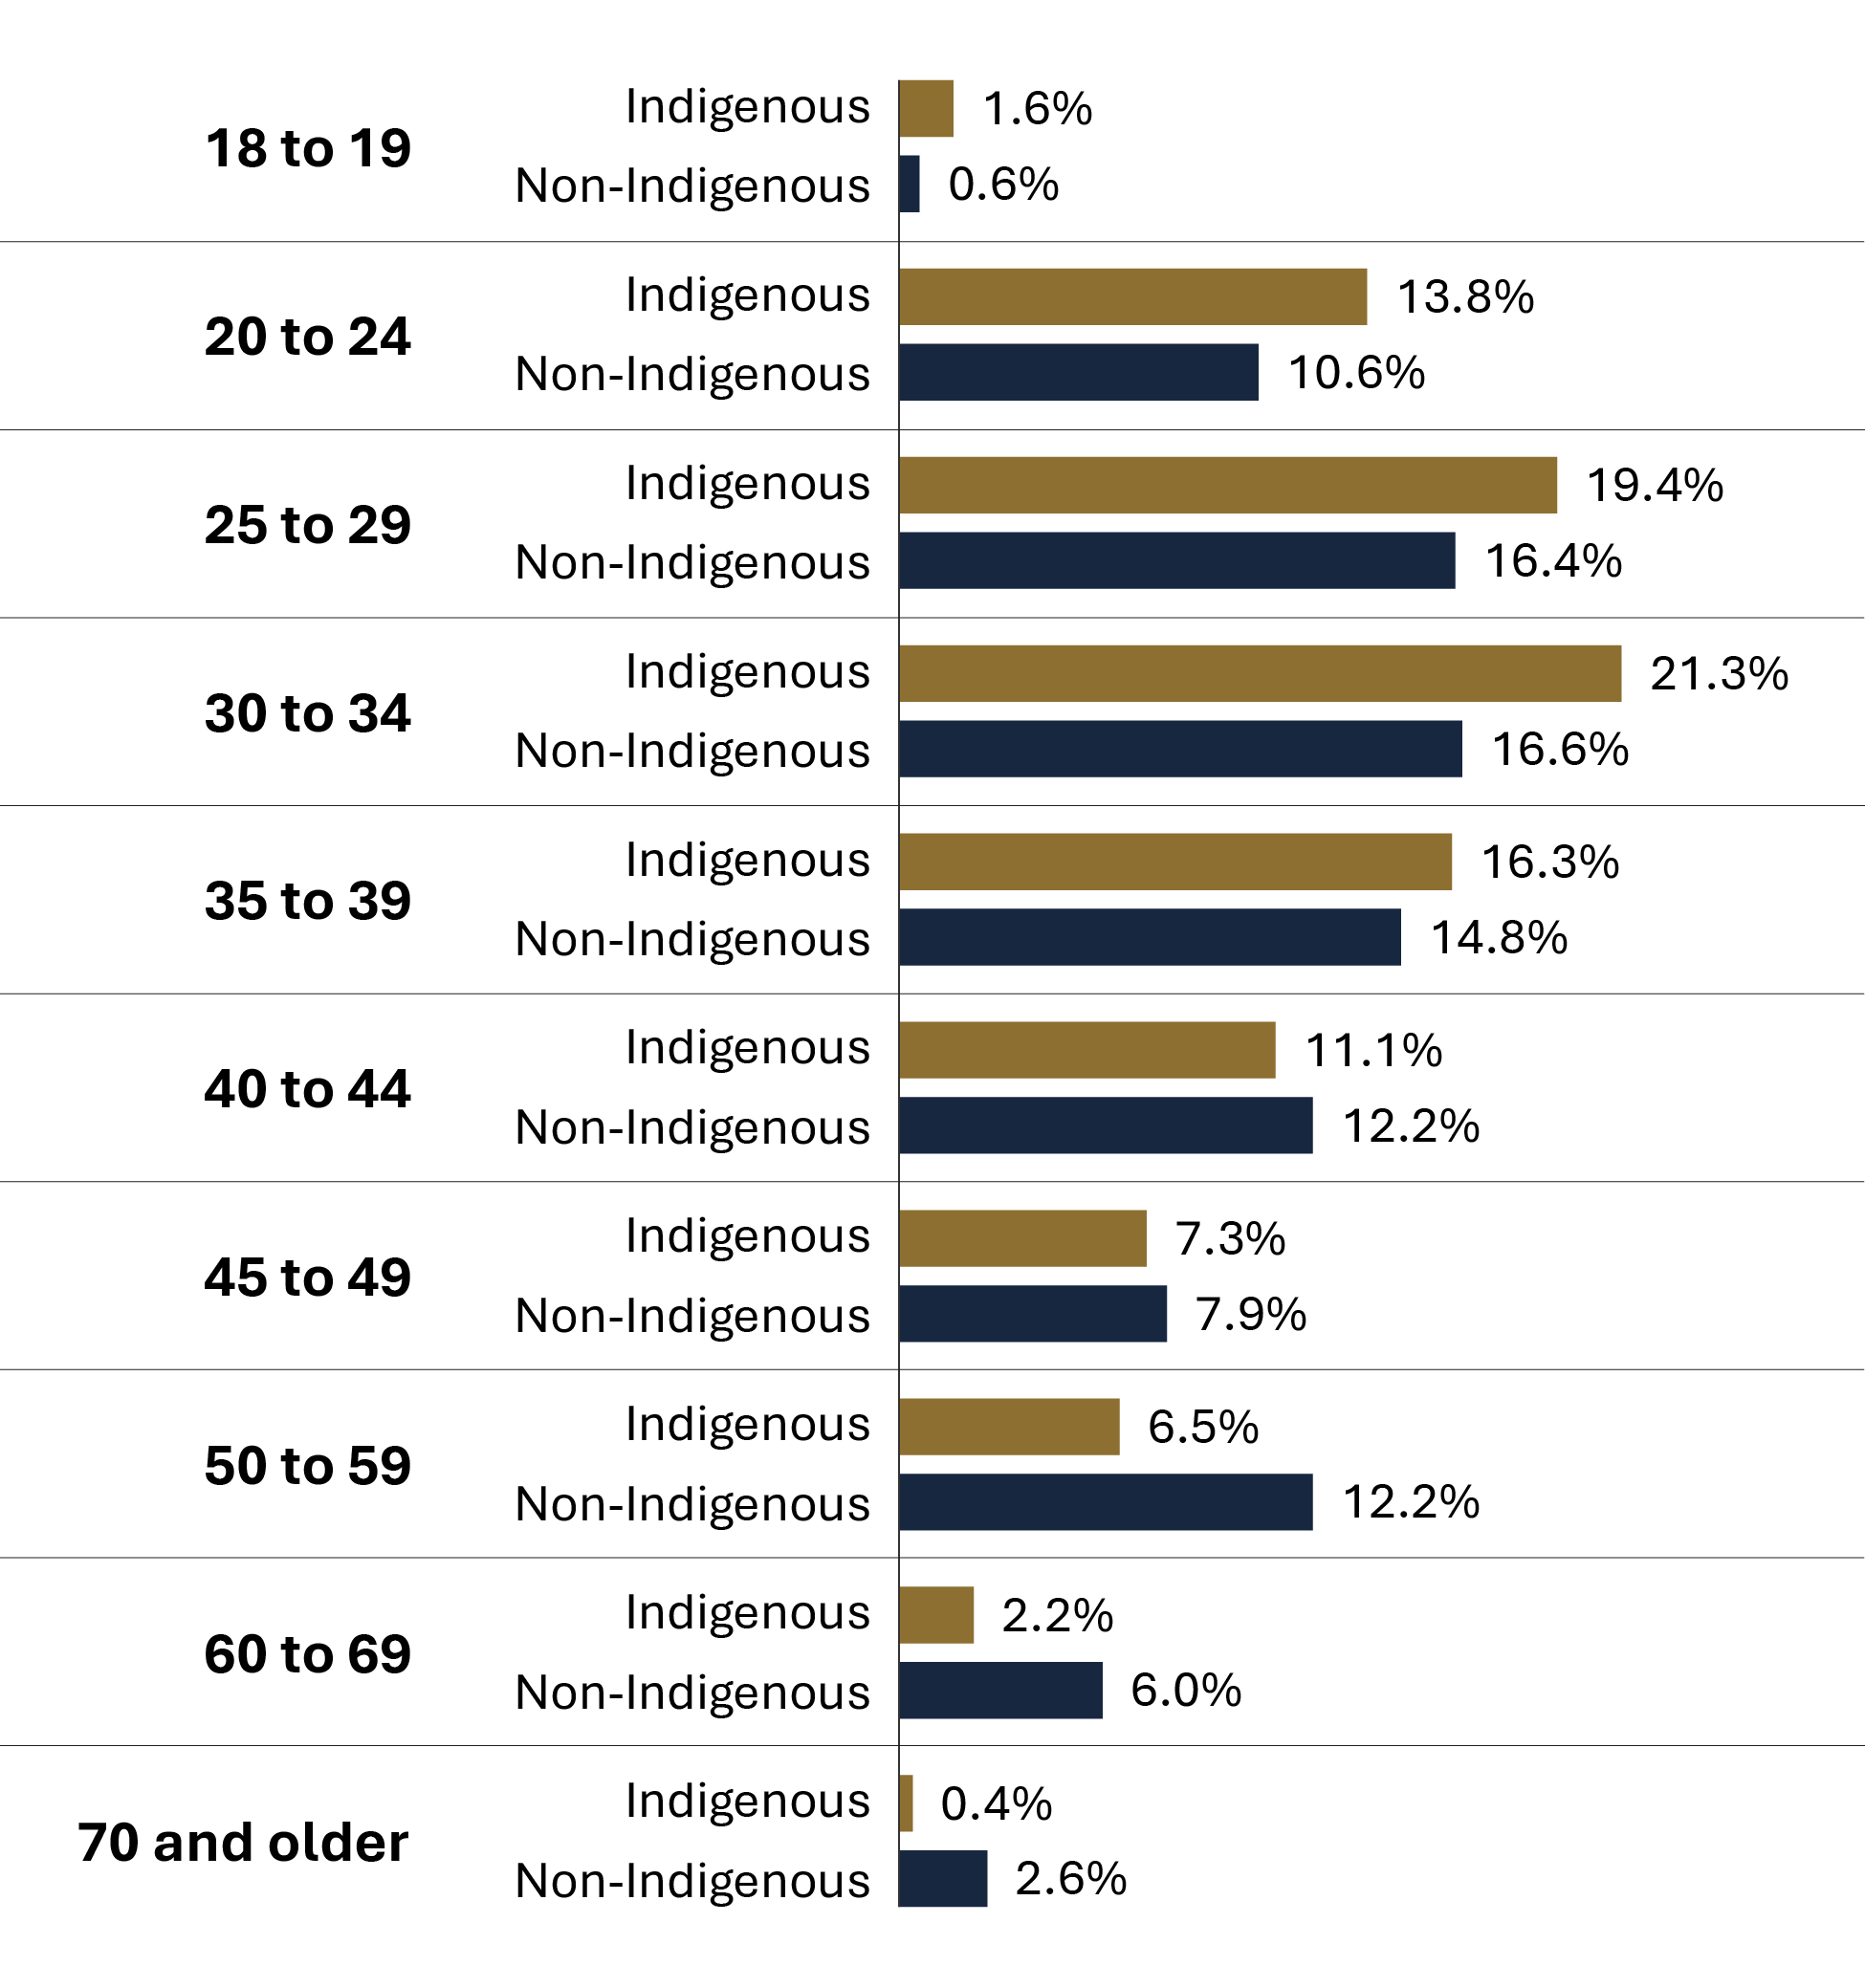
Image description
Bar graph showing the percentage of warrant of committal admissions to a Correctional Service of Canada facility for Indigenous and non-Indigenous offenders by age in fiscal year 2023-24. The age groups included in the graph are 18 to 19, 20 to 24, 25 to 29, 30 to 34, 35 to 39, 40 to 44, 45 to 49, 50 to 59, 60 to 69, and 70 and older. The proportion of Indigenous offenders is greater than non-Indigenous offenders between ages 18 and 39. The proportion of non-Indigenous offenders is greater than Indigenous offenders between ages 40 and above. Full data are available in the table below.
Source: Correctional Service of Canada.
- Of those offenders admitted on a warrant of committal to CSC facilities in 2023-24, 34.8% of Indigenous offenders were under the age of 30, compared to 27.6% of non-Indigenous offenders.
- The number of Indigenous offenders between the ages of 18 and 19 at admission decreased from 40 in 2014-15 to 23 in 2023-24, representing a 42.5% decrease.
- The number of Indigenous offenders aged 70 and over at admission increased from 4 in 2014-15 to 6 in 2023-24, representing a 50.0% increase.
- In fiscal year 2023-24, the median age of Indigenous offenders at admission was 33, compared to a median age of 37 for non-Indigenous offenders.
- In fiscal year 2023-24, the median age of Indigenous female offenders at admission was 32, compared to a median age of 38 for non-Indigenous female offenders.
Table C11. Warrant of committal admissions for Indigenous and non-Indigenous offenders by age
| Age at admission | Indigenous | % | Non-Indigenous | % | Total | % |
|---|---|---|---|---|---|---|
| 18 to 19 | 40 | 3.4 | 64 | 1.8 | 104 | 2.2 |
| 20 to 24 | 255 | 21.8 | 588 | 16.1 | 843 | 17.5 |
| 25 to 29 | 257 | 22.0 | 647 | 17.7 | 904 | 18.8 |
| 30 to 34 | 199 | 17.0 | 557 | 15.3 | 756 | 15.7 |
| 35 to 39 | 114 | 9.8 | 460 | 12.6 | 574 | 11.9 |
| 40 to 44 | 114 | 9.8 | 360 | 9.9 | 474 | 9.8 |
| 45 to 49 | 88 | 7.5 | 319 | 8.7 | 407 | 8.4 |
| 50 to 59 | 79 | 6.8 | 439 | 12.0 | 518 | 10.7 |
| 60 to 69 | 19 | 1.6 | 155 | 4.2 | 174 | 3.6 |
| 70 and older | 4 | 0.3 | 61 | 1.7 | 65 | 1.3 |
| Total | 1,169 | 100.0 | 3,650 | 100.0 | 4,819 | 100.0 |
| Age at admission | Indigenous | % | Non-Indigenous | % | Total | % |
|---|---|---|---|---|---|---|
| 18 to 19 | 23 | 1.6 | 20 | 0.6 | 43 | 0.9 |
| 20 to 24 | 199 | 13.8 | 361 | 10.6 | 560 | 11.6 |
| 25 to 29 | 279 | 19.4 | 557 | 16.4 | 836 | 17.3 |
| 30 to 34 | 306 | 21.3 | 562 | 16.6 | 868 | 18.0 |
| 35 to 39 | 234 | 16.3 | 502 | 14.8 | 736 | 15.2 |
| 40 to 44 | 160 | 11.1 | 415 | 12.2 | 575 | 11.9 |
| 45 to 49 | 105 | 7.3 | 267 | 7.9 | 372 | 7.7 |
| 50 to 59 | 94 | 6.5 | 415 | 12.2 | 509 | 10.5 |
| 60 to 69 | 32 | 2.2 | 205 | 6.0 | 237 | 4.9 |
| 70 and older | 6 | 0.4 | 89 | 2.6 | 95 | 2.0 |
| Total | 1,438 | 100.0 | 3,393 | 100.0 | 4,831 | 100.0 |
Source: Correctional Service of Canada.
Table C11 Notes
A warrant of committal is a new admission to federal jurisdiction from the courts.
These numbers refer to the total number of admissions to a federal institution or Healing Lodge during each fiscal year and may be greater than the actual number of offenders admitted, since an individual offender may be admitted more than once in a given year.
There is a lag in the data entry of admissions into CSC's Offender Management System. The admission figures for the most recent year are under-reported by 200-400 admissions at the time of year end data extraction. More accurate figures will be available in the next year's publication. Please use caution when including the most recent year in any trend analysis.
Due to rounding, percentages may not add to 100 percent.
Reported year periods reflect fiscal years. A fiscal year runs from April 1 to March 31 of the following year.
Age distribution of the CSC offender population
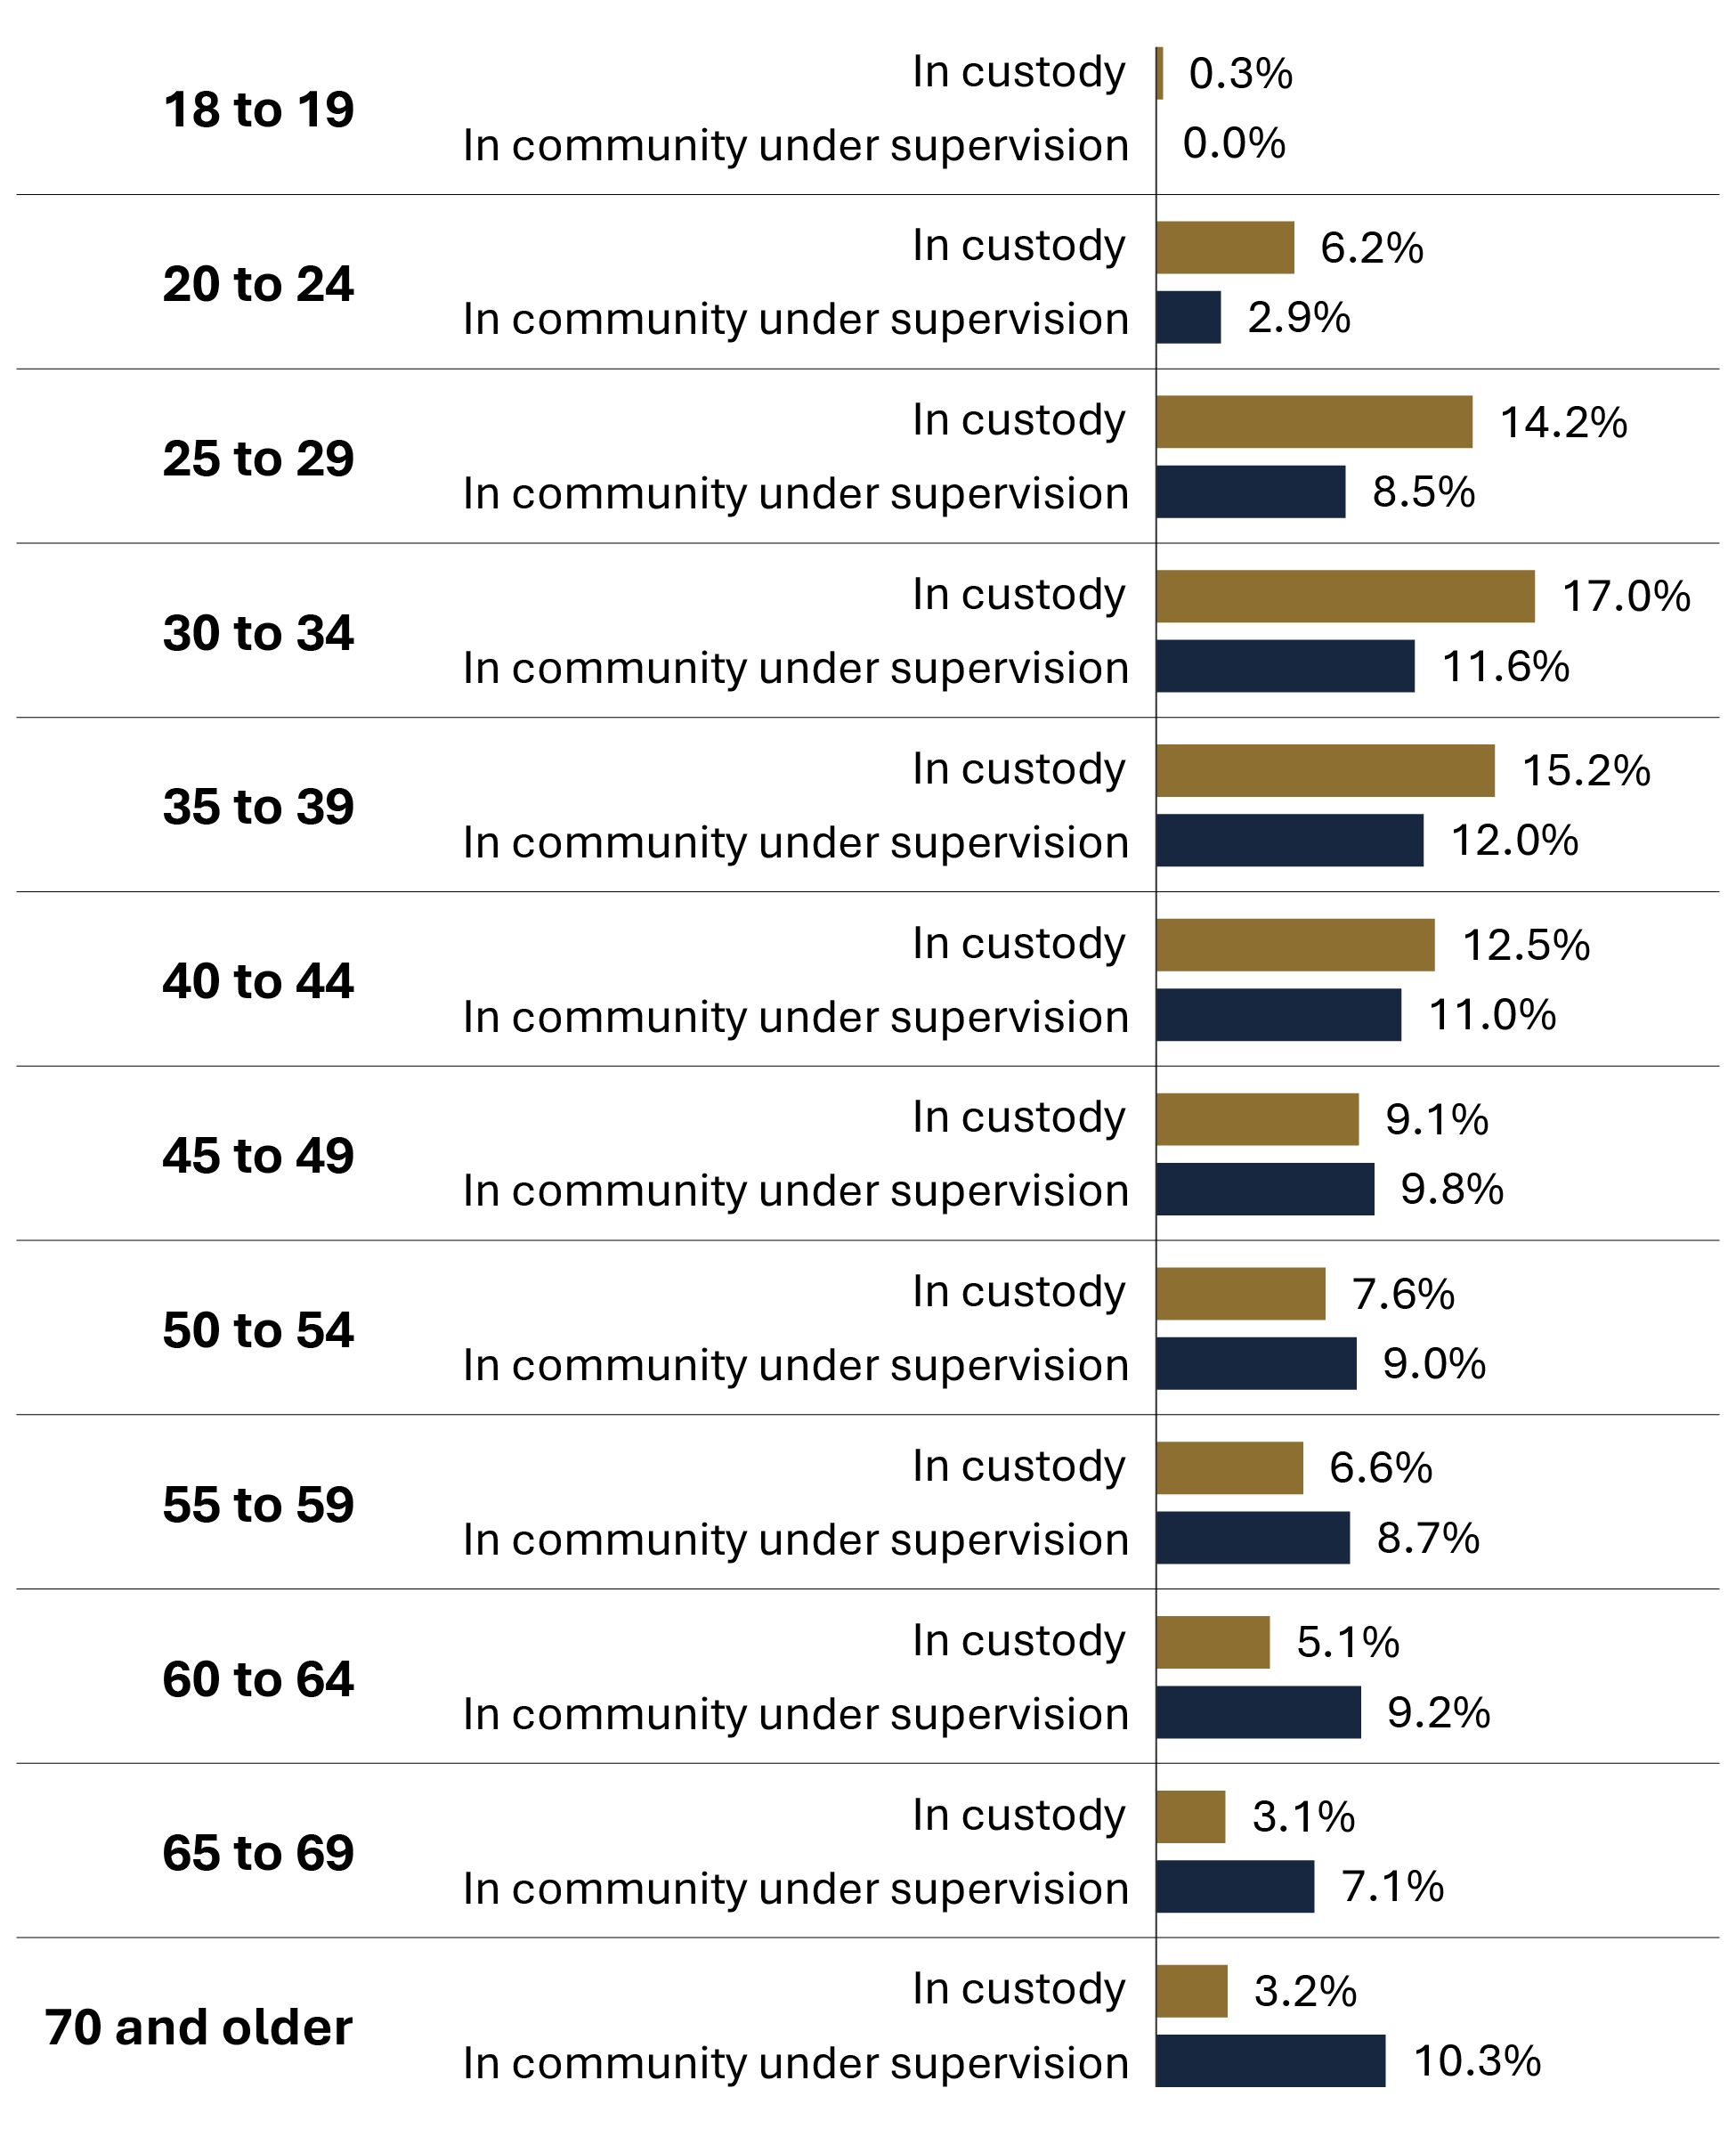
Image description
Bar graph illustrating the age distribution of offenders in Canada categorized by those in-custody and those in the community under supervision in fiscal year 2023-2024. The age groups included in the graph are 18 to 19, 20 to 24, 25 to 29, 30 to 34, 35 to 39, 40 to 44, 45 to 49, 50 to 59, 60 to 69, and 70 and older. The proportion of offenders in custody is greater than offenders in community between ages 18 and 44. The proportion of offenders in community is greater than offenders in custody between ages 45 and above. Full data is available in the table below.
Source: Correctional Service of Canada.
- In 2023-24, 52.9% of in-custody offenders were under the age of 40.
- In 2023-24, 25.5% of in-custody offenders was aged 50 and over.
- In 2023-24, the community offender population was older than the in-custody population; 44.3% of offenders in the community were aged 50 and over, compared to 25.5% of the in-custody offenders in this age group.
- As of 2023-24, 0.04% of the Canadian adult populationFootnote * are in-custody offenders, and 0.03% of the Canadian adult populationFootnote * are offenders in the community under supervision. Taken together, the total federal offender population represents 0.07% of the Canadian adult populationFootnote *.
| Age | In custodyFootnote 1 | %Footnote 1 | In community under supervisionFootnote 1 | %Footnote 1 | TotalFootnote 1 | %Footnote 1 | % of Canadian adult populationFootnote 2 |
|---|---|---|---|---|---|---|---|
| 18 to 19 | 37 | 0.3 | 0 | 0.0 | 37 | 0.2 | 2.8 |
| 20 to 24 | 862 | 6.2 | 246 | 2.9 | 1,108 | 5.0 | 8.0 |
| 25 to 29 | 1,961 | 14.2 | 722 | 8.5 | 2,683 | 12.0 | 8.9 |
| 30 to 34 | 2,361 | 17.0 | 986 | 11.6 | 3,347 | 15.0 | 9.2 |
| 35 to 39 | 2,112 | 15.2 | 1,022 | 12.0 | 3,134 | 14.0 | 8.6 |
| 40 to 44 | 1,731 | 12.5 | 936 | 11.0 | 2,667 | 11.9 | 8.2 |
| 45 to 49 | 1,256 | 9.1 | 837 | 9.8 | 2,093 | 9.4 | 7.5 |
| 50 to 54 | 1,055 | 7.6 | 770 | 9.0 | 1,825 | 8.2 | 7.5 |
| 55 to 59 | 908 | 6.6 | 743 | 8.7 | 1,651 | 7.4 | 7.8 |
| 60 to 64 | 703 | 5.1 | 780 | 9.2 | 1,483 | 6.6 | 8.2 |
| 65 to 69 | 431 | 3.1 | 601 | 7.1 | 1,032 | 4.6 | 7.3 |
| 70 and older | 438 | 3.2 | 877 | 10.3 | 1,315 | 5.9 | 15.9 |
| Total | 13,855 | 100.0 | 8,520 | 100.0 | 22,375 | 100.0 | 100.0 |
Sources:
Table C12 Notes
In-custody population includes all active offenders incarcerated in a CSC facility, offenders on temporary absence from a CSC facility, offenders who are temporarily detained in a CSC facility and offenders on remand in a CSC facility.
In community under supervision includes all active offenders on day parole, full parole, statutory release, or in the community supervised on a long-term supervision order, offenders who are temporarily detained in a non-CSC facility, offenders who are unlawfully at large for less than 90 days, offenders on remand in a non-CSC facility, and offenders supervised and subject to an immigration hold by Canada Border Services Agency.
Due to rounding, percentage may not add to 100 percent.
For offender population data, the reported year period (2023-24) reflects a fiscal year. A fiscal year runs from April 1 to March 31 of the following year.
CSC offender population by self-reported race
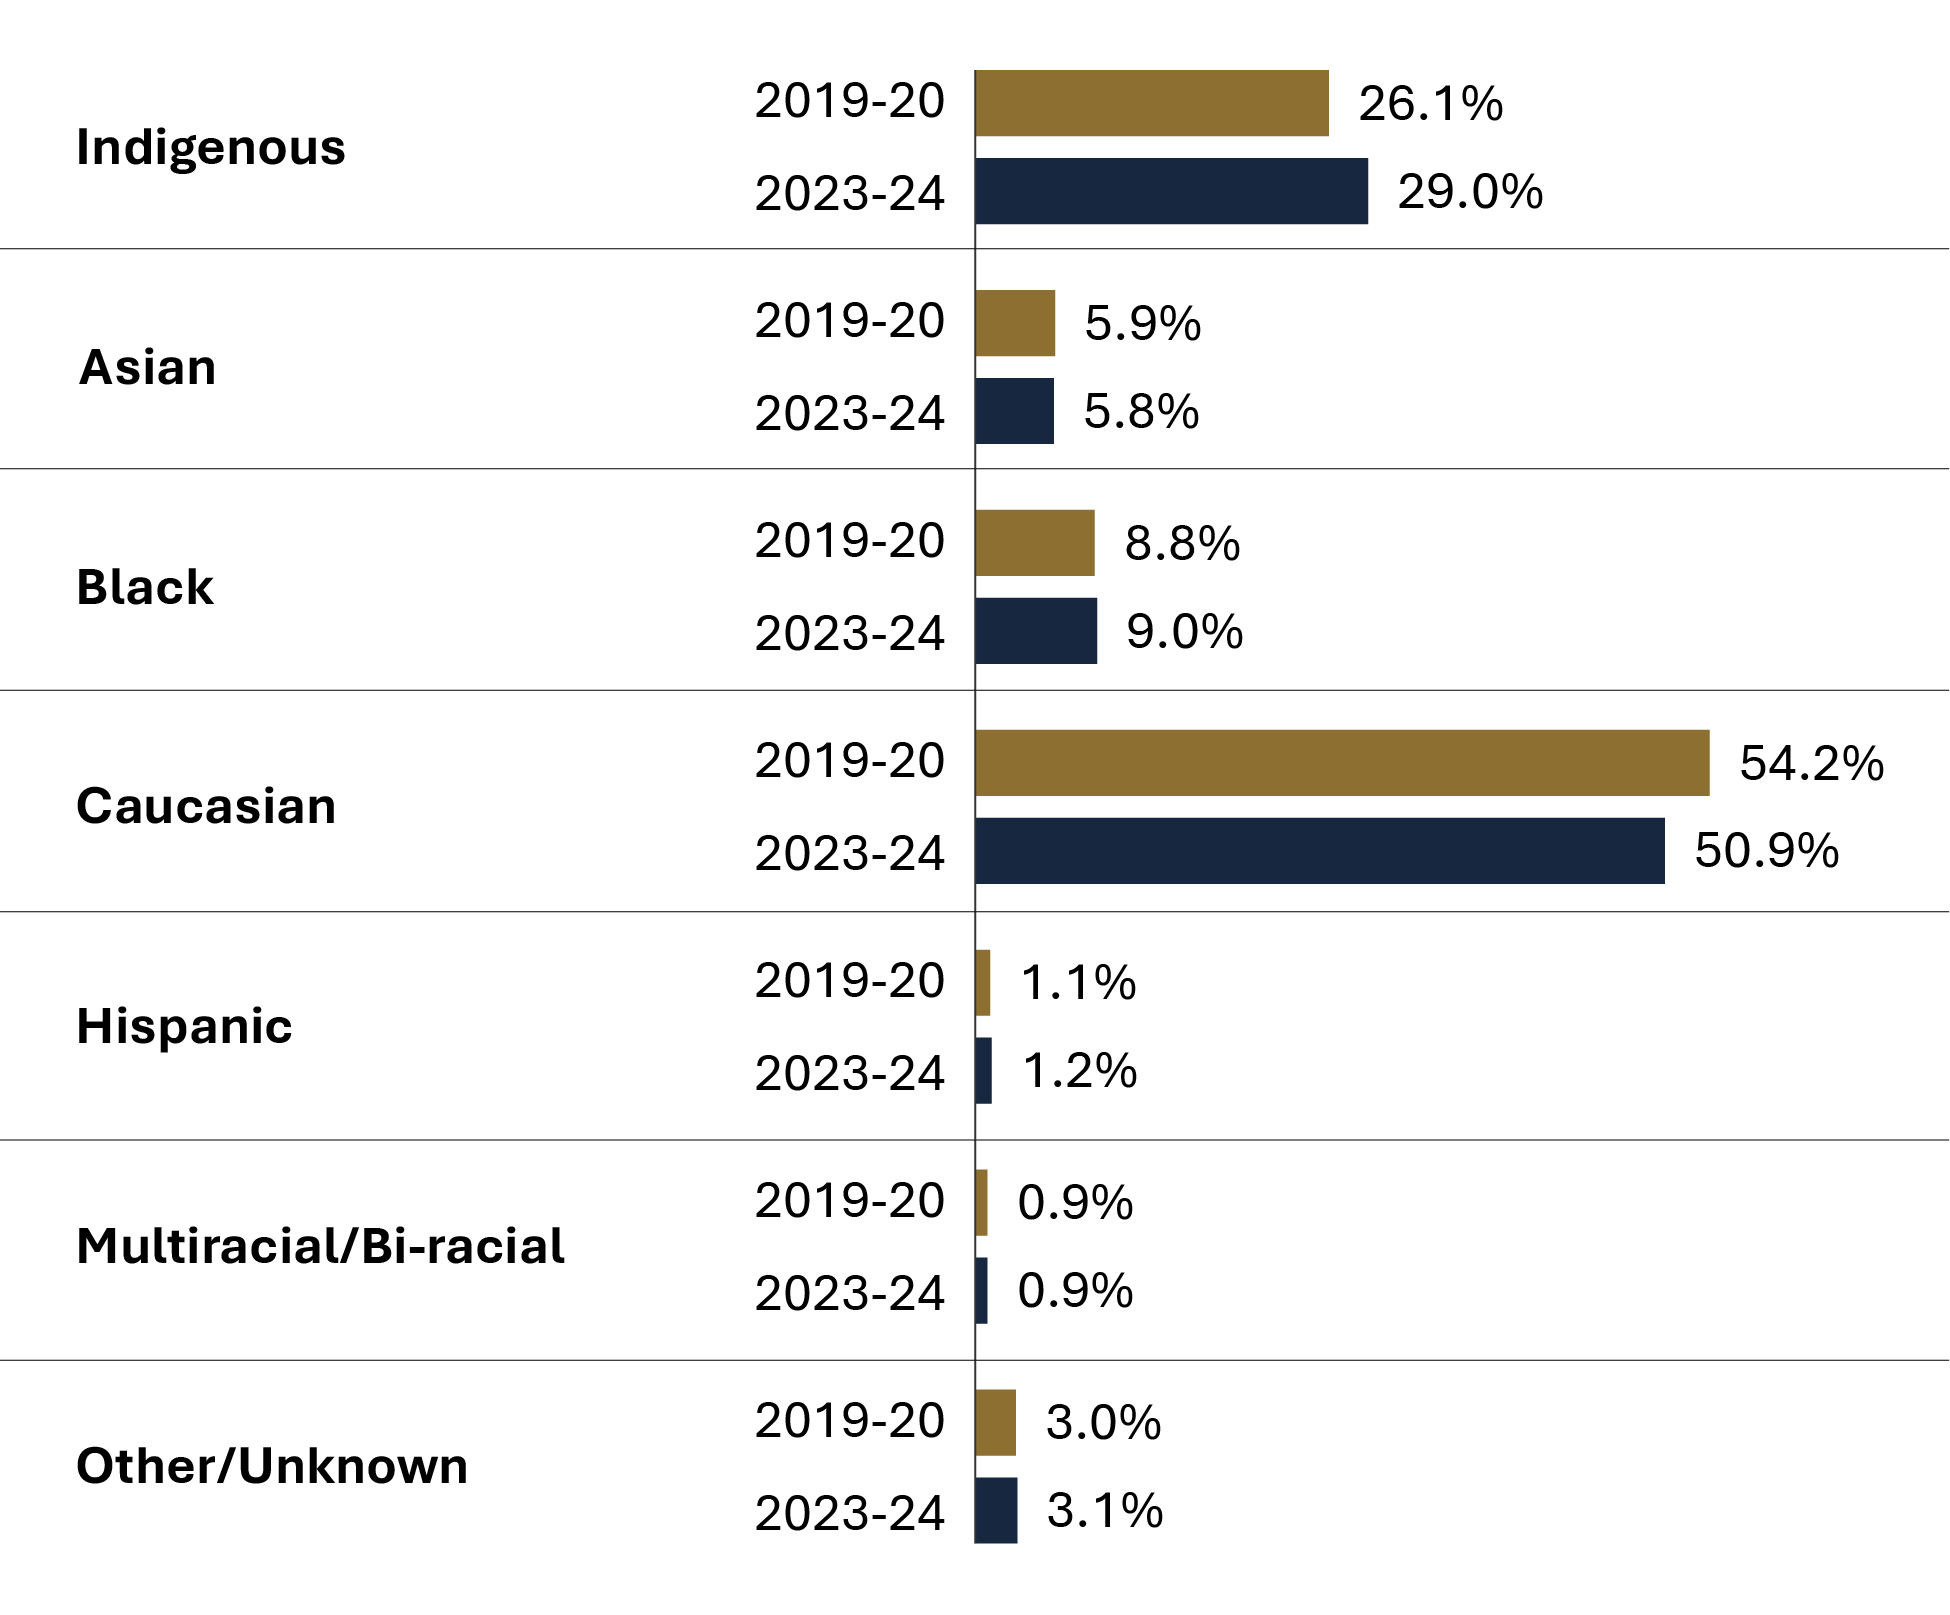
Image description
Bar graph showing the percentage of total Correctional Service of Canada offender population by self-reported race for the fiscal years 2019-20 and 2023-24. The population groups represented in the graph are Indigenous, Asian, Black, White, Hispanic, Multiracial/Bi-racial, and other/unknown. The Caucasian population group represented the largest offender group in both 2019-20 and 2023-24, followed by Indigenous people. Multiracial/Bi-racial and Hispanic population groups were the least self-reported population groups among offenders in both fiscal years. Full data are available in the table below.
Source: Correctional Service of Canada.
- The CSC offender population is becoming more diverse, as evidenced by the decrease in the proportion of Caucasian offenders (down from 54.2% in 2019-20 to 50.9% in 2023-24). In comparison, close to 70% of the Canadian population identified as White (as reported in the 2021 CensusFootnote *).
- Between 2019-20 and 2023-24, the Indigenous offender population increased by 7.6% (from 6,027 to 6,487).
- Indigenous offenders represented 29.0% of the 2023-24 total CSC offender population and 29.8% of 2023-24 warrant of committal admissions to CSC facilities, despite representing only 5.0% of the Canadian population (as reported in the 2021 CensusFootnote **).
| Self-reported raceFootnote * | 2019-20 | % | 2023-24 | % |
|---|---|---|---|---|
| Caucasian total | 12,511 | 54.2 | 11,380 | 50.9 |
| Indigenous total | 6,027 | 26.1 | 6,487 | 29.0 |
First Nations |
4,109 | 17.8 | 4,542 | 20.3 |
Inuit |
197 | 0.9 | 183 | 0.8 |
Métis |
1,721 | 7.4 | 1,762 | 7.9 |
| Black total | 2,026 | 8.8 | 2,022 | 9.0 |
Black |
1,866 | 8.1 | 1,834 | 8.2 |
Caribbean |
102 | 0.4 | 127 | 0.6 |
Sub-Saharan African |
58 | 0.3 | 61 | 0.3 |
| Asian total | 1,371 | 5.9 | 1,305 | 5.8 |
Arab |
195 | 0.8 | 241 | 1.1 |
Arab/West Asian |
185 | 0.8 | 142 | 0.6 |
Asiatic |
431 | 1.9 | 410 | 1.8 |
Chinese |
105 | 0.5 | 85 | 0.4 |
East Indian |
14 | 0.1 | 14 | 0.1 |
Filipino |
83 | 0.4 | 73 | 0.3 |
Japanese |
8 | 0.0 | 6 | 0.0 |
Korean |
14 | 0.1 | 16 | 0.1 |
Southeast Asian |
180 | 0.8 | 157 | 0.7 |
South Asian |
156 | 0.7 | 161 | 0.7 |
| Hispanic total | 258 | 1.1 | 276 | 1.2 |
Hispanic |
7 | 0.0 | 5 | 0.0 |
Latin American |
251 | 1.1 | 271 | 1.2 |
| Multiracial/Bi-Racial total | 209 | 0.9 | 206 | 0.9 |
| Other/Unknown total | 700 | 3.0 | 699 | 3.1 |
| Total | 23,102 | 100.0 | 22,375 | 100.0 |
Source: Correctional Service of Canada.
Table C13 Notes
Number of registered victims by self-reported race
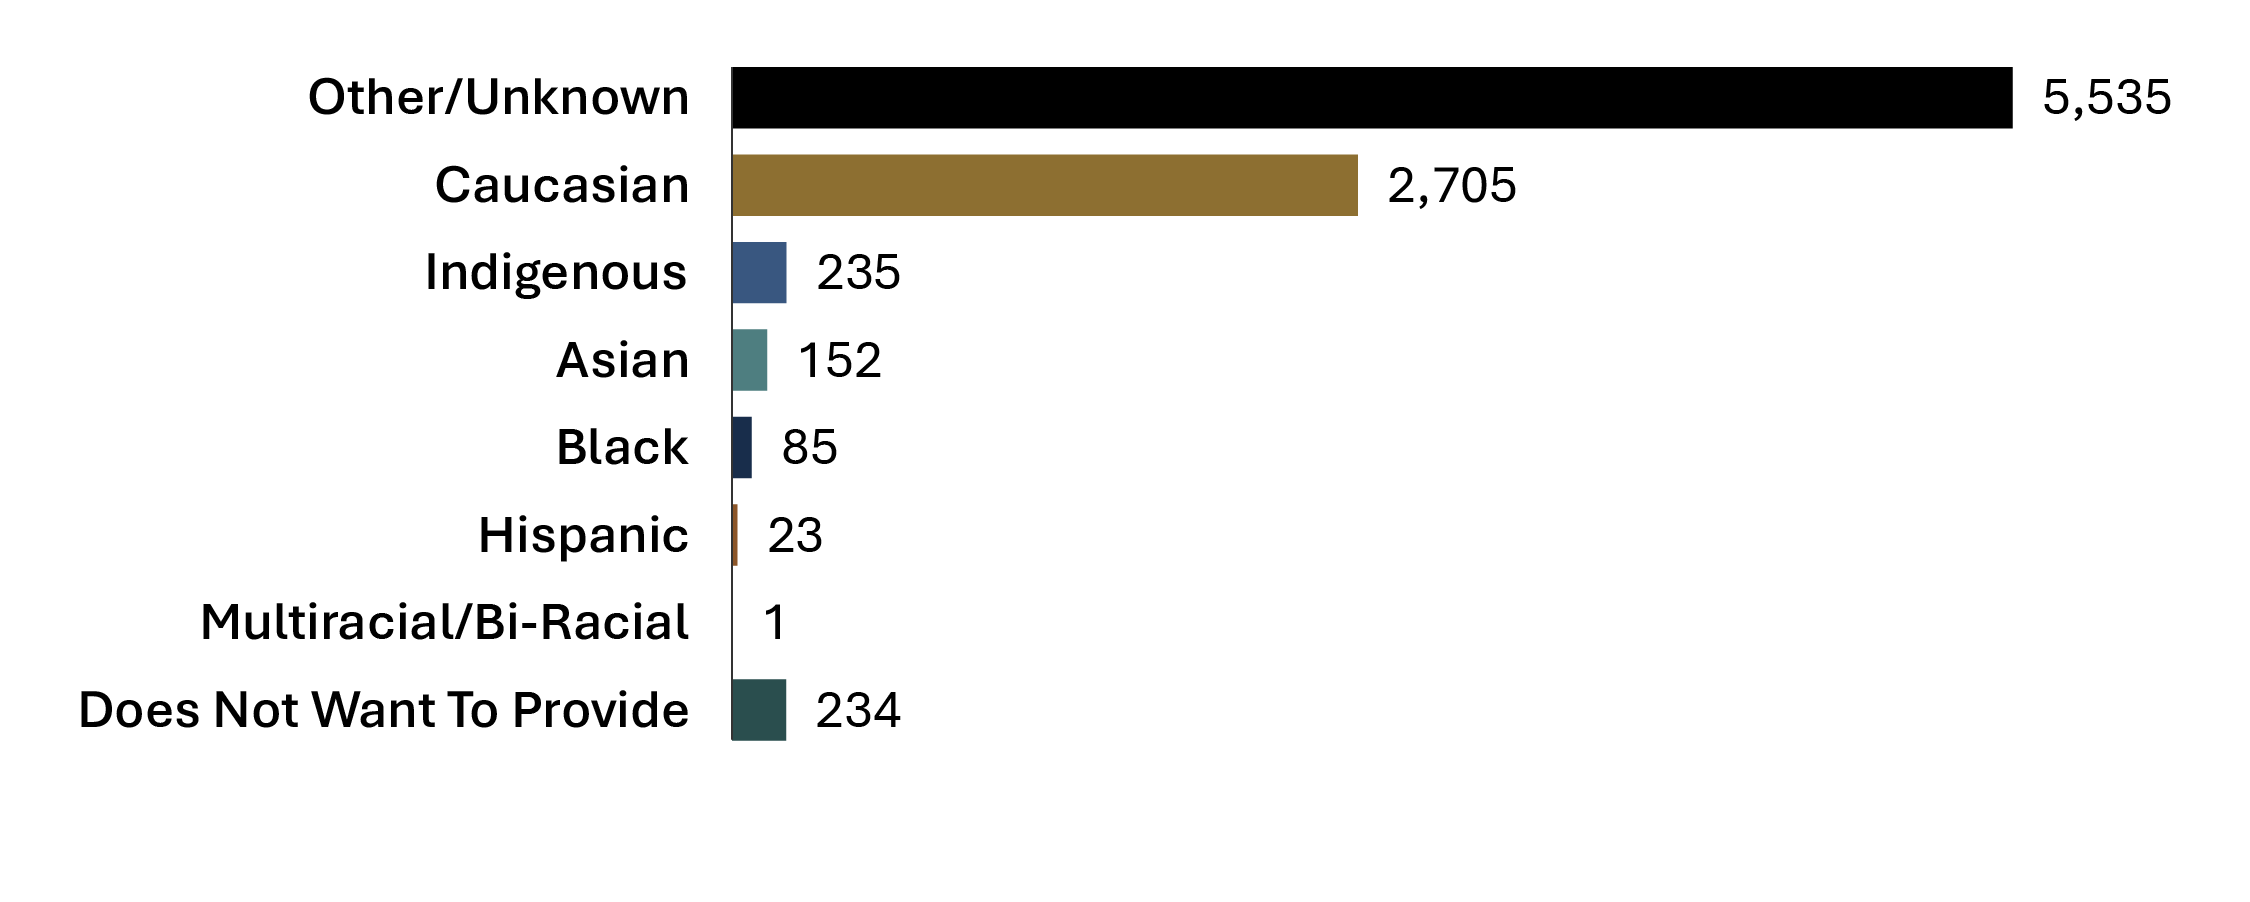
Image description
Bar graph showing a snapshot of the number of registered victims by self-reported race for fiscal year 2023-24. The population groups represented in the graph are Caucasian, Indigenous, Asian, Black, Hispanic, Multiracial/Bi-racial, Other/Unknown, and Does not want to provide. More than half of registered victims self-reported as Other/Unknown, followed by the Caucasian population group. Multiracial/Bi-racial and Hispanic population groups were the least self-reported registered victim groups. Full data are available in the table below.
Source: Correctional Service of Canada.
- Most registered victims (61.7%) were of unknown race. More than a quarter of registered victims (30.2%) identified as Caucasian.
| Race | 2019-20 | % | 2020-21 | % | 2021-22 | % | 2022-23 | % | 2023-24 | % |
|---|---|---|---|---|---|---|---|---|---|---|
| Caucasian total | 2,382 | 26.9 | 2,241 | 25.8 | 2,255 | 26.4 | 2,569 | 29.4 | 2,705 | 30.2 |
| Indigenous total | 181 | 2.0 | 180 | 2.1 | 187 | 2.2 | 238 | 2.7 | 235 | 2.6 |
First Nations |
122 | 1.4 | 115 | 1.3 | 118 | 1.4 | 153 | 1.7 | 141 | 1.6 |
Inuit |
25 | 0.3 | 27 | 0.3 | 26 | 0.3 | 23 | 0.3 | 22 | 0.2 |
Métis |
34 | 0.4 | 38 | 0.4 | 43 | 0.5 | 62 | 0.7 | 72 | 0.8 |
| Black total | 77 | 0.9 | 72 | 0.8 | 67 | 0.8 | 79 | 0.9 | 85 | 0.9 |
Black |
77 | 0.9 | 72 | 0.8 | 67 | 0.8 | 77 | 0.9 | 83 | 0.9 |
Caribbean |
0 | 0.0 | 0 | 0.0 | 0 | 0.0 | 1 | 0.0 | 2 | 0.0 |
Sub-Saharan African |
0 | 0.0 | 0 | 0.0 | 0 | 0.0 | 1 | 0.0 | 0 | 0.0 |
| Asian total | 107 | 1.2 | 110 | 1.3 | 119 | 1.4 | 136 | 1.6% | 152 | 1.7 |
Arab |
0 | 0.0 | 0 | 0.0 | 0 | 0.0 | 2 | 0.0 | 2 | 0.0 |
Asiatic |
66 | 0.7 | 67 | 0.8 | 74 | 0.9 | 83 | 0.9 | 96 | 1.1 |
Chinese |
34 | 0.4 | 35 | 0.4 | 36 | 0.4 | 36 | 0.4 | 36 | 0.4 |
Filipino |
5 | 0.1 | 4 | 0.0 | 4 | 0.0 | 8 | 0.1 | 10 | 0.1 |
Japanese |
1 | 0.0 | 3 | 0.0 | 4 | 0.0 | 4 | 0.0 | 4 | 0.0 |
Korean |
1 | 0.0 | 1 | 0.0 | 1 | 0.0 | 3 | 0.0 | 4 | 0.0 |
| Hispanic total | 14 | 0.2 | 14 | 0.2 | 12 | 0.1 | 18 | 0.2 | 23 | 0.3 |
| Does not want to provide | 45 | 0.5 | 51 | 0.6 | 102 | 1.2 | 176 | 2.0 | 234 | 2.6 |
| Other/Unknown total | 6,051 | 68.3 | 6,027 | 69.3 | 5,795 | 67.9 | 5,531 | 63.2 | 5,535 | 61.7 |
| Total | 8,857 | 100.0 | 8,695 | 100.0 | 8,537 | 100.0 | 8,747 | 100.0 | 8,970 | 100.0 |
Source: Correctional Service of Canada.
Table C14 Notes
The Canadian Victims Bill of Rights defines a victim as an individual who has suffered physical or emotional harm, property damage, or economic loss as the result of the commission or alleged commission of an offence. The CCRA also allows a spouse, a relative or dependant, an individual who is responsible for the care or support of the victim or the care or support of a dependant of the victim, to act on behalf of a victim, if the victim cannot act on their own behalf. Victims include persons harmed as the result of an act of an offender, whether or not the offender was prosecuted or convicted for that act, as long as an official complaint has been made to the police or to the Crown.
Victims do not automatically receive information about the offender who harmed them. If they have been harmed by an offender serving a sentence of two years or more, victims are asked to register with the Correctional Service of Canada (CSC) or the Parole Board of Canada to receive information or access services. The registration process allows CSC to verify that the individual meets the definition of victim, which is required under law before sharing protected offender information.
For more information about victim registration, visit: https://www.canada.ca/en/correctional-service/services/you-csc/victims/register.html
Demographic information is voluntarily self-reported by victims who have registered with CSC to receive information about the offender who harmed them. The information does not represent victims who have not been in contact with CSC or those who choose not to register.
Victim registration fluctuates for a number of reasons beyond organizational control. Contributing factors impacting victim registration data could be due to offenders reaching the end of their sentence or death, victims opting out of notifications for reasons such as personal preferences, death or loss of contact.
The difference between the total number of registered victims and the number of victims who voluntarily self-reported their race is the result of victims choosing not to report their race or their race is unknown to CSC (due to victims choosing not to share information).
The response rate for victim race has remained stable for the past 3 fiscal years.
The total number of victims for whom CSC has reported race data for 2023-24 is 3,526 whereby it is 5,444 for unknown, which means CSC has self-reported race data for approximately 39% of registered victims. Therefore, these statistics do not accurately provide self-reported race disaggregation for the entirety of registered victims.
Reported year periods reflect fiscal years. A fiscal year runs from April 1 to March 31 of the following year.
CSC offender population by religion
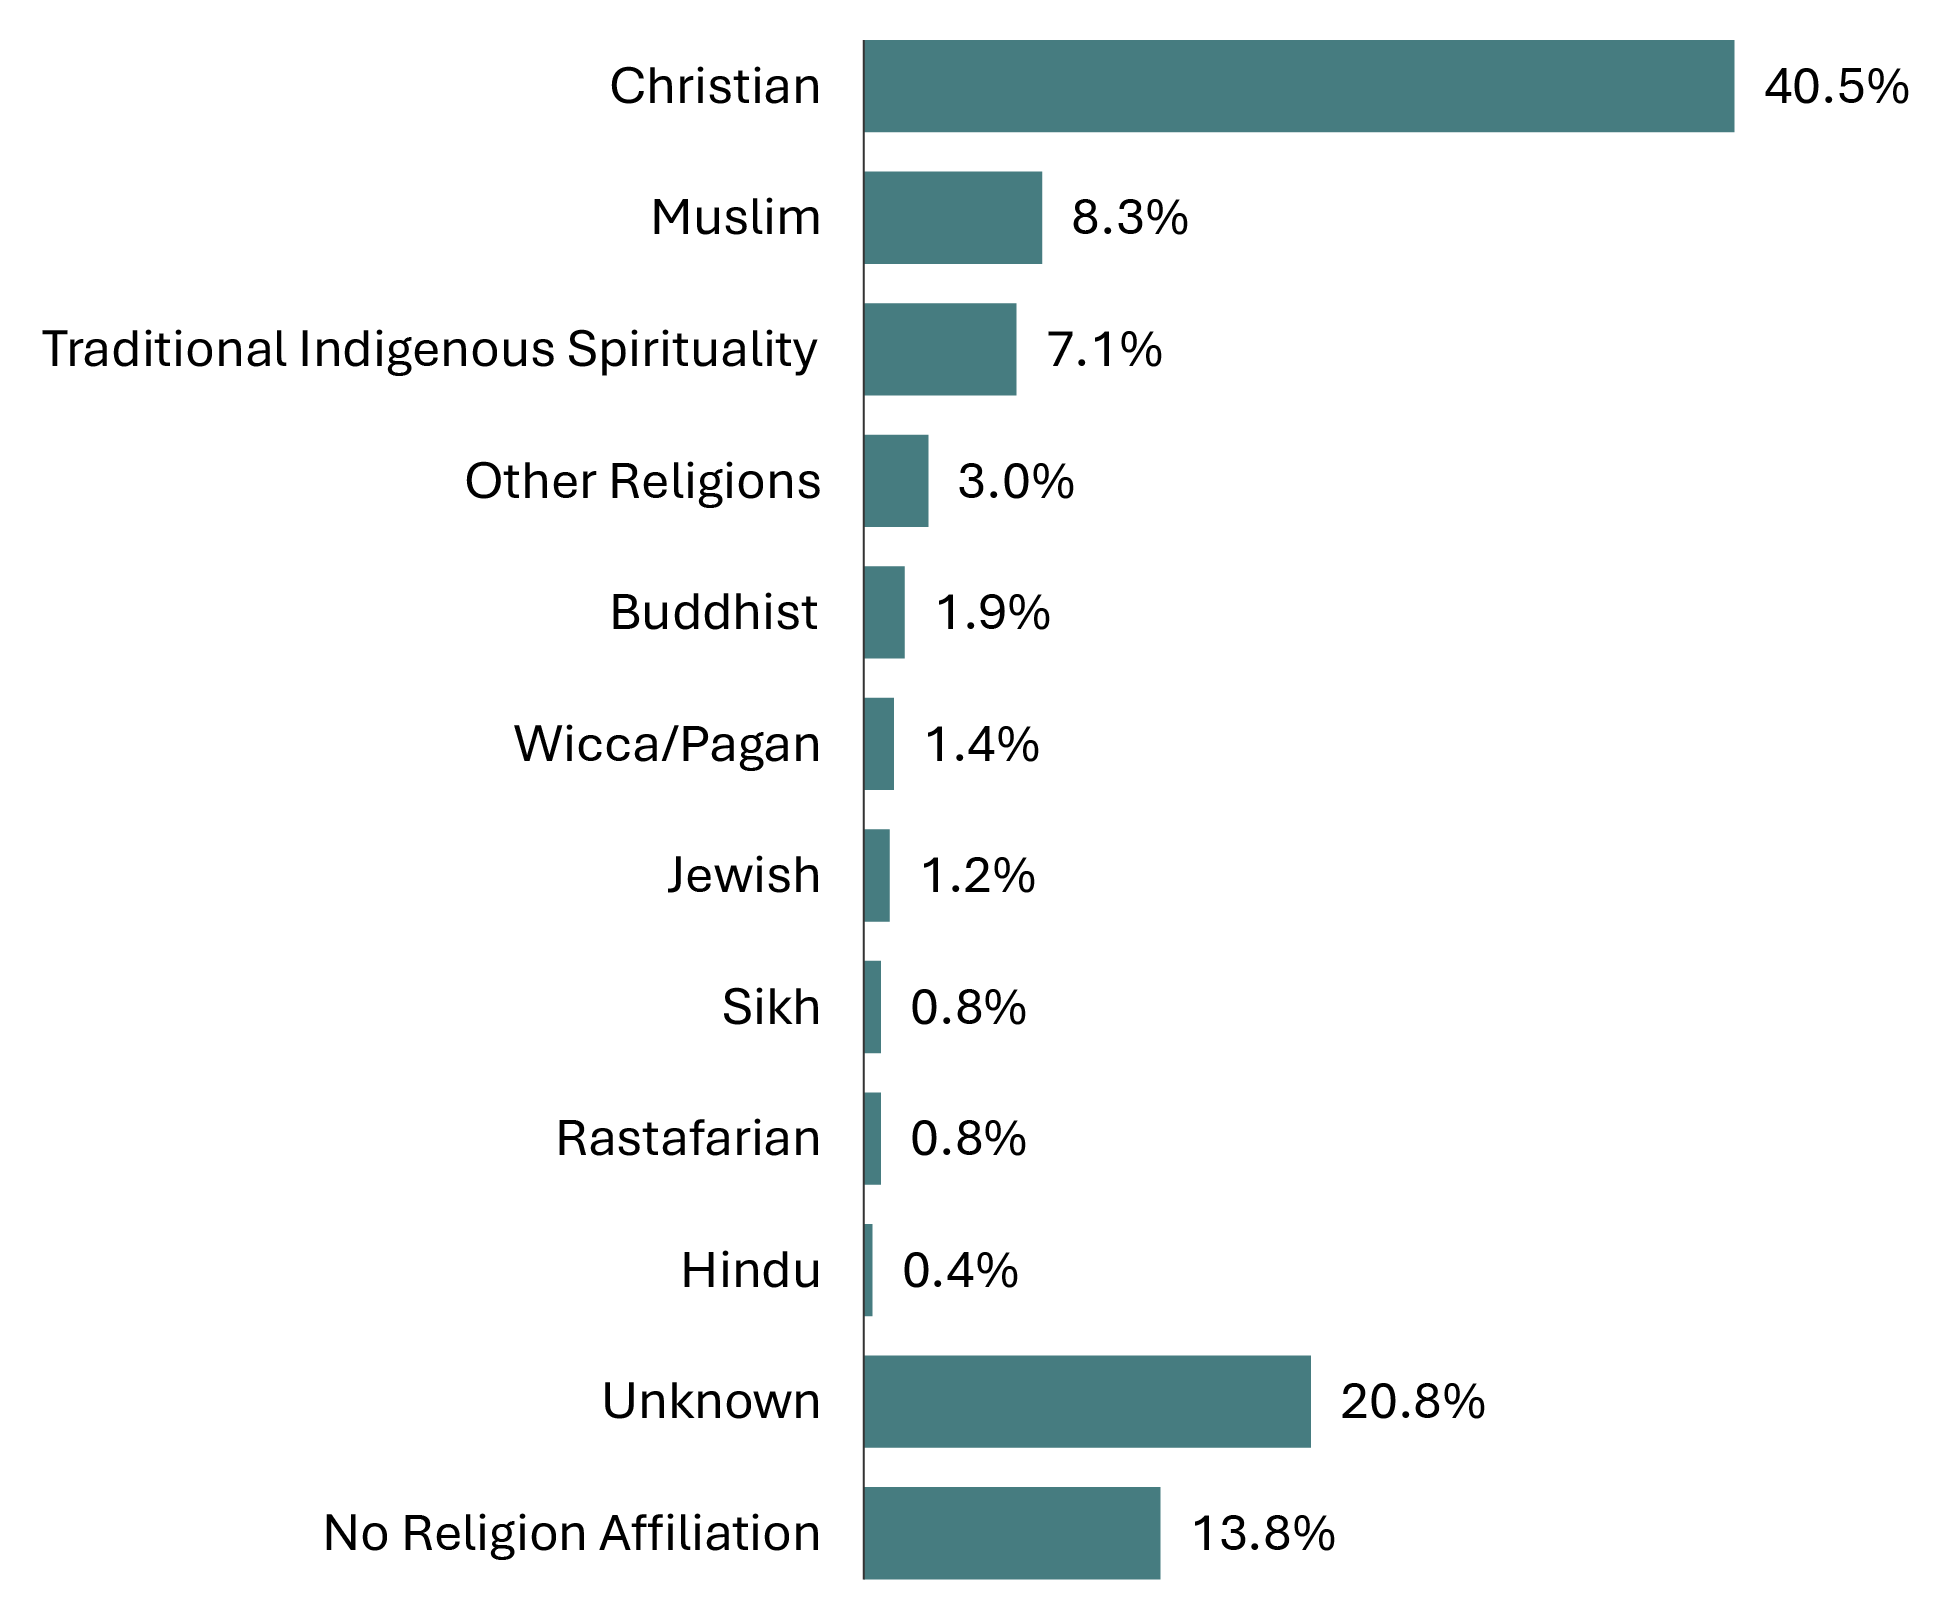
Image description
Bar graph showing a snapshot of the Correctional Service of Canada offender population by religious identification for fiscal year 2023-24. The religious identifications represented in the graph are Christian, Muslim, Traditional Indigenous Spirituality, Buddhist, Jewish, Sikh, Rastafarian, Hindu, Wicca/Pagan, Other Religions, Unknown, and No religious affiliation. The largest proportion of offenders reported Christian religious identification, followed by unknown religious affiliation, and No religion affiliation. Full data are available in the table below.
Source: Correctional Service of Canada.
- The religious identification of the CSC offender population is diverse. While those identifying as Christian continue to represent the largest group, their proportions decreased from 45.0% in 2019-20 to 40.5% in 2023-24.
- Religious identification was unknown for 20.8% of offenders, whereas 13.8% stated they had no religion affiliation.
| Religious identification | 2019-20 | % | 2023-24 | % |
|---|---|---|---|---|
| Buddhist | 478 | 2.1 | 419 | 1.9 |
| Christian | 10,406 | 45.0 | 9,063 | 40.5 |
| Hindu | 74 | 0.3 | 81 | 0.4 |
| Jewish | 257 | 1.1 | 277 | 1.2 |
| Muslim | 1,736 | 7.5 | 1,863 | 8.3 |
| Rastafarian | 175 | 0.8 | 177 | 0.8 |
| Sikh | 196 | 0.8 | 182 | 0.8 |
| Traditional Aboriginal spirituality | 1,646 | 7.1 | 1,586 | 7.1 |
| Wicca/Pagan | 350 | 1.5 | 317 | 1.4 |
| Other religions | 555 | 2.4 | 664 | 3.0 |
| No religion affiliation | 3,540 | 15.3 | 3,083 | 13.8 |
| Unknown | 3,689 | 16.0 | 4,663 | 20.8 |
| Total | 23,102 | 100.0 | 22,375 | 100.0 |
Source: Correctional Service of Canada.
Table C15 Notes
Religious identification is self-reported by offenders while they are incarcerated, and the categories are not comprehensive; therefore, the reader should interpret these data with caution.
Buddhist includes offenders who belong to the following group: Buddhist, Mahayana Buddhist, Theravadan Buddhist and Vajrayana Buddhist.
Christian includes offenders who belong to the following group: Amish, Anglican (Episcopal Church of England), Antiochian Orthodox, Apostolic Christian Church, Armenian Orthodox/Apostolic, Associated Gospel, Assyrian Chaldean Catholic, Baptist, Brethren In Christ, Bulgarian Orthodox, Canadian Reformed Church, Catholic- Greek, Catholic-Roman, Catholic-Ukrainian, Catholic Non-Specific, Churches of Christ/Christian Churches, Charismatic, Christadelphian, Christian & Missionary Alliance, Christian Congregational, Christian Non Specific, Christian Or Plymouth Brethren, Christian Orthodox, Christian Reformed, Christian Reformed Church, Christian Science, Church of Christ Scientist, Church of God, Church of Jesus Christ of Latter-Day Saint, Community of Christ, Coptic Orthodox, Doukhobor, Dutch Reformed Church, Ethiopian Orthodox, Evangelical, Evangelical Free Church , Evangelical Missionary Church, Free Methodist, Free Reformed Church, Grace Communion International, Greek Orthodox, Hutterite, Iglesia Ni Cristo, Jehovah's Witnesses, Lutheran, Macedonian Orthodox, Maronite, Melkite, Mennonite, Messianic Jew, Methodist Christian, Metropolitan Community Church, Mission de l'Esprit Saint, Moravian, Mormon (Latter Day Saints), Nazarene Christian, Netherlands Reformed, New Apostolic, Pentecostal (4-Square), Pentecostal Assembly of God, Pentecôtiste, Philadelphia Church of God, Presbyterian, Protestant Non-Specific, Quaker (Society of Friends), Reformed Christian, Romanian Orthodox, Russian Orthodox, Salvation Army, Serbian Orthodox, Seventh Day Adventist, Shaker, Swedenborgian (New Church), Syrian/Syriac Orthodox, Ukrainian Catholic, Ukrainian Orthodox, United Church, United Reformed Church, Vineyard Christian Fellowship, Wesleyan Christian and Worldwide Church of God.
Hindu includes offenders who belong to the following group: Hindu and Siddha Yoga.
Jewish includes offenders who belong to the following group: Jewish Orthodox, Jewish Reformed and Judaism.
Muslim includes offenders who belong to the following group: Muslim and Sufism.
Rastafarian includes offenders who belong to the following group: Rastafarian.
Sikh includes offenders who belong to the following group: Sikh.
Traditional Indigenous Spirituality includes offenders who belong to the following group: Indigenous Spirituality Catholic, Traditional Indigenous Protestant, Traditional Indigenous Catholic, Native Spirituality, Catholic - Native Spirituality, Native Spirituality Protestant and Indigenous Spirituality.
Wiccan/Pagan includes offenders who belong to the following group: Asatru Paganism, Druidry Paganism, Pagan and Wicca.
Other Religion includes offenders who belong to the following group: Baha'i, Eckankar, Independent Spirituality, Jain, Krishna, New Age, New Thought-Unity-Religious Science, Other, Pantheist, Rosicrucian, Satanist, Scientology, Shintoïste, Spiritualist, Taoism, Transcendental Meditation, Unification Church, Unitarian, Visnabha and Zoroastrian.
No religion Affiliation includes offenders who belong to the following group: Agnostic, Atheist, Gnostic, Humanist and offenders who have no religion affiliation.
Unknown includes offenders who belong to the following group: Unknown, not stated as well as those offenders who have no religion specified.
The data reflect all active offenders, who are incarcerated in a CSC facility, offenders on temporary absence from a CSC facility, offenders who are temporarily detained, offenders who are actively supervised, and offenders who are unlawfully at large for less than 90 days.
The data reflect the number of offenders active at the end of each fiscal year.
A fiscal year runs from April 1 to March 31 of the following year.
Due to rounding, percentages may not add to 100 percent.
CSC offenders by Indigenous and non-Indigenous self-identification
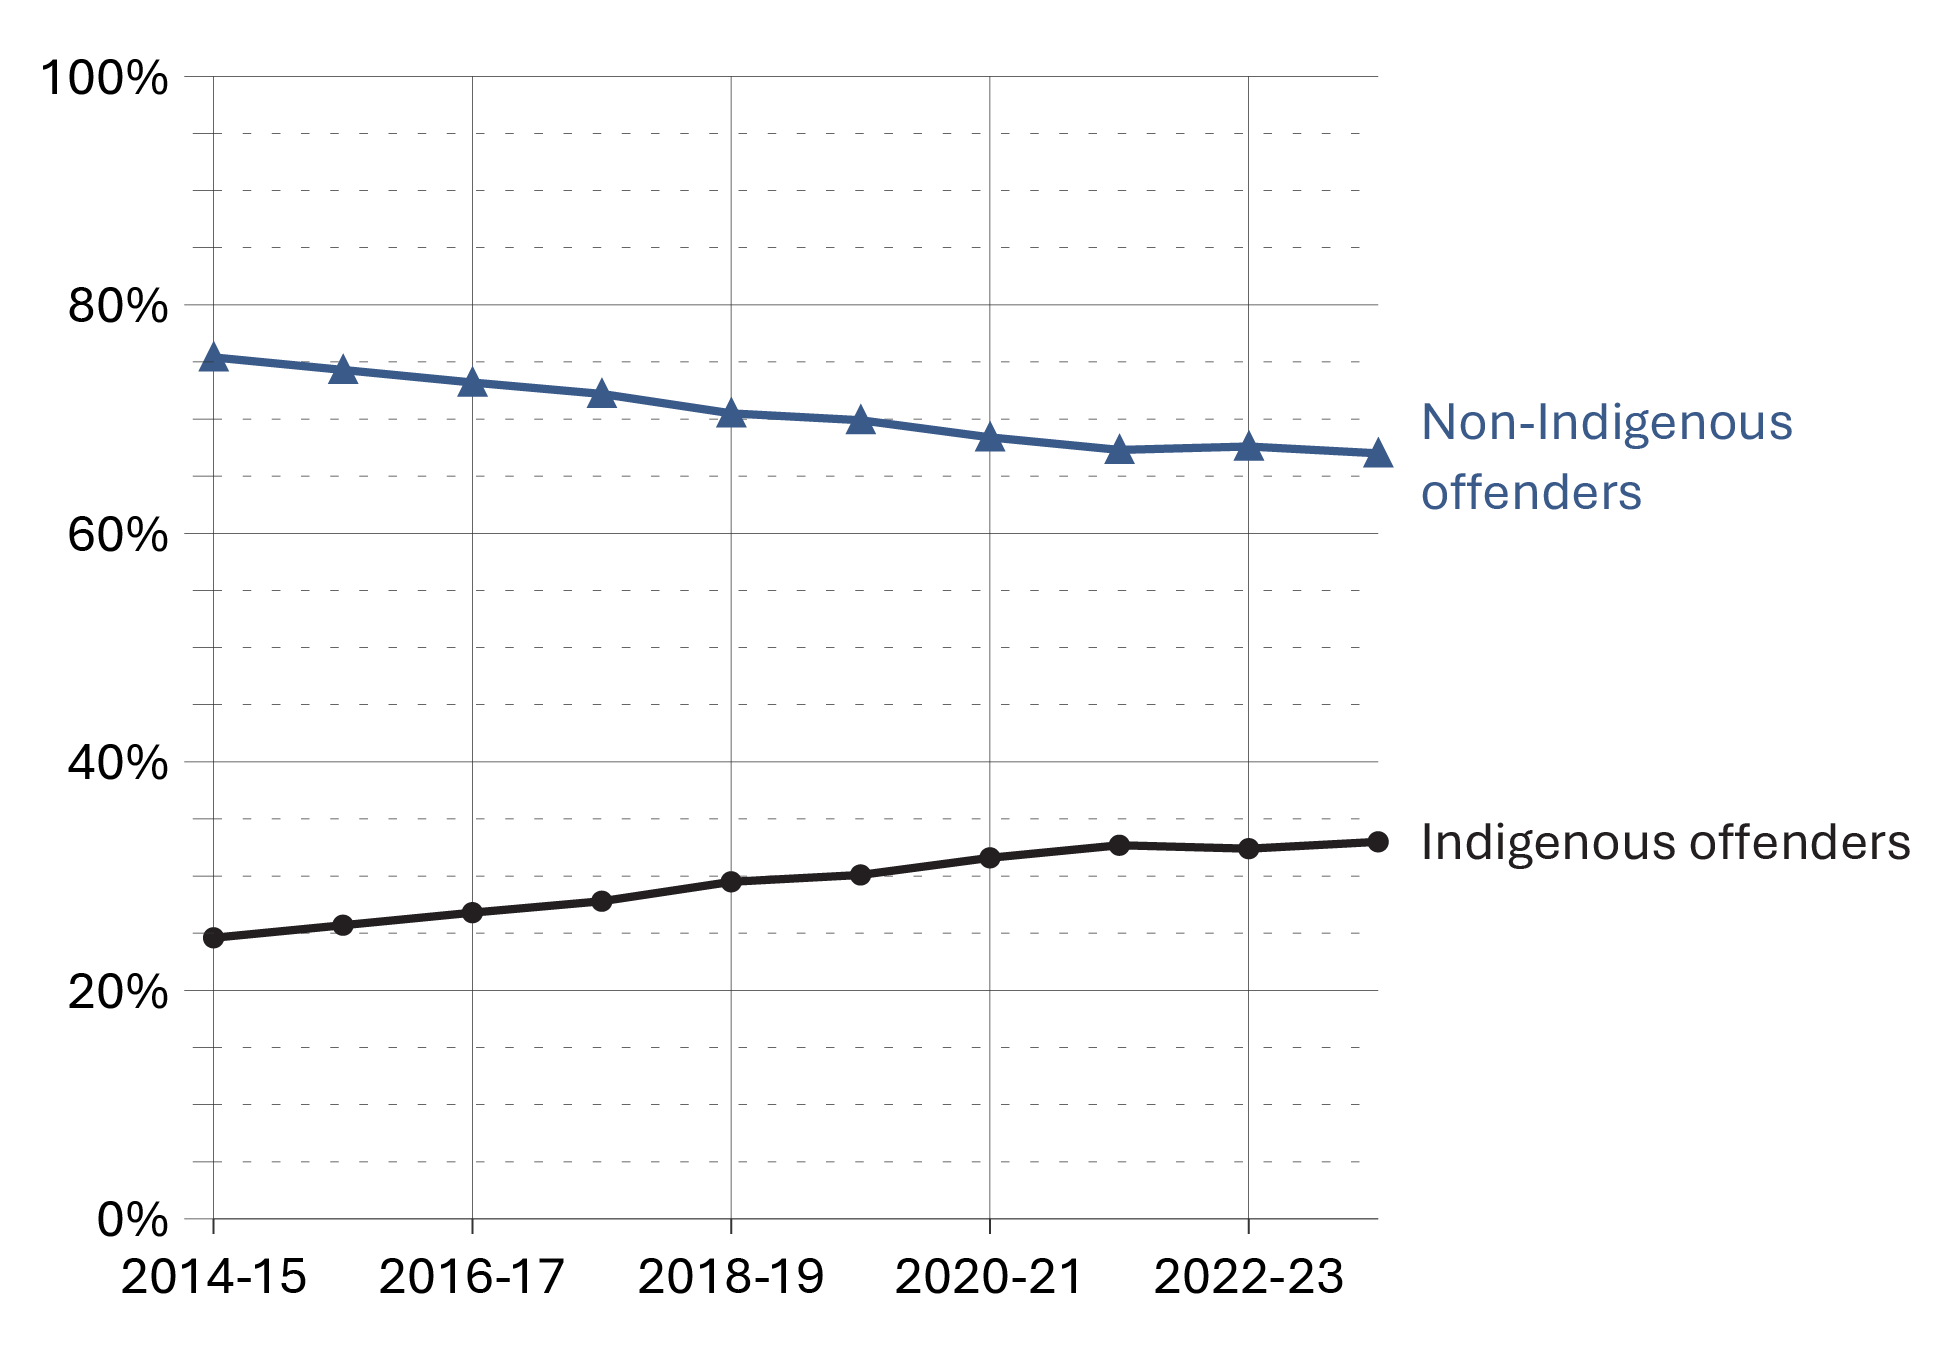
Image description
Line graph showing the percentage of self-identified Indigenous and non-Indigenous people in custody from fiscal year 2014-15 to 2023-24. The majority of offenders reported a non-Indigenous identity, though their representation has decreased slightly over time. Indigenous people represent a smaller proportion of offenders in-custody, although their representation has slightly increased over time. Full data is available in the table below.
Source: Correctional Service of Canada.
- At the end of fiscal year 2023-24, the proportion of offenders in custody was 12.2% greater for Indigenous offenders (70.6%) than for non-Indigenous offenders (58.4%).
- At the end of fiscal year 2023-24, Indigenous females in custody represented 49.3% of all in-custody females while Indigenous males who were in custody represented 32.1% of all males in custody.
- At the end of fiscal year 2023-24, Indigenous offenders represented 29.0% of the total offender population.
- Indigenous offenders accounted for 33.0% of the in-custody population and 22.4% of the community population in 2023-24, despite representing only 5.0% of the Canadian population (as reported in the 2021 CensusFootnote *).
Table C16. Indigenous and non-Indigenous offenders in custody vs. in the community under supervision
| In-custody | % | In community under supervision | % | Total | |
|---|---|---|---|---|---|
| Female total | 685 | 48.4 | 731 | 51.6 | 1,416 |
Indigenous |
279 | 57.3 | 208 | 42.7 | 487 |
Non-Indigenous |
406 | 43.7 | 523 | 56.3 | 929 |
| Male total | 13,032 | 60.1 | 8,650 | 39.9 | 21,682 |
Indigenous |
3,855 | 69.6 | 1,684 | 30.4 | 5,539 |
Non-Indigenous |
9,177 | 56.8 | 6,966 | 43.2 | 16,143 |
| Intersex total | 3 | 75.0 | 1 | 25.0 | 4 |
Indigenous |
1 | 100.0 | 0 | 0.0 | 1 |
Non-Indigenous |
2 | 66.7 | 1 | 33.3 | 3 |
| In-custody | % | In community under supervision | % | Total | |
|---|---|---|---|---|---|
| Female total | 618 | 46.3 | 717 | 53.7 | 1,335 |
Indigenous |
267 | 55.2 | 217 | 44.8 | 484 |
Non-Indigenous |
351 | 41.2 | 500 | 58.8 | 851 |
| Male total | 11,778 | 58.4 | 8,396 | 41.6 | 20,174 |
Indigenous |
3,646 | 68.5 | 1,678 | 31.5 | 5,324 |
Non-Indigenous |
8,132 | 54.8 | 6,718 | 45.2 | 14,850 |
| Intersex total | 3 | 100.0 | 0 | 0.0 | 3 |
Indigenous |
1 | 100.0 | 0 | 0.0 | 1 |
Non-Indigenous |
2 | 100.0 | 0 | 0.0 | 2 |
| In-custody | % | In community under supervision | % | Total | |
|---|---|---|---|---|---|
| Female total | 588 | 47.8 | 643 | 52.2 | 1,231 |
Indigenous |
291 | 59.4 | 199 | 40.6 | 490 |
Non-Indigenous |
297 | 40.1 | 444 | 59.9 | 741 |
| Male total | 11,740 | 60.0 | 7,836 | 40.0 | 19,576 |
Indigenous |
3,737 | 69.9 | 1,613 | 30.1 | 5,350 |
Non-Indigenous |
8,003 | 56.3 | 6,223 | 43.7 | 14,226 |
| Intersex total | 0 | 0.0 | 0 | 0.0 | 0 |
Indigenous |
0 | 0.0 | 0 | 0.0 | 0 |
Non-Indigenous |
0 | 0.0 | 0 | 0.0 | 0 |
| In-custody | % | In community under supervision | % | Total | |
|---|---|---|---|---|---|
| Female total | 645 | 49.5 | 659 | 50.5 | 1,304 |
Indigenous |
309 | 55.8 | 245 | 44.2 | 554 |
Non-Indigenous |
336 | 44.8 | 414 | 55.2 | 750 |
| Male total | 12,407 | 61.8 | 7,671 | 38.2 | 20,078 |
Indigenous |
3,914 | 70.3 | 1,652 | 29.7 | 5,566 |
Non-Indigenous |
8,493 | 58.5 | 6,019 | 41.5 | 14,512 |
| Intersex total | 2 | 100.0 | 0 | 0.0 | 2 |
Indigenous |
0 | 0.0 | 0 | 0.0 | 0 |
Non-Indigenous |
2 | 100.0 | 0 | 0.0 | 2 |
| In-custody | % | In community under supervision | % | Total | |
|---|---|---|---|---|---|
| Female total | 736 | 51.7 | 687 | 48.3 | 1,423 |
Indigenous |
363 | 59.9 | 243 | 40.1 | 606 |
Non-Indigenous |
373 | 45.7 | 444 | 54.3 | 817 |
| Male total | 13,119 | 62.6 | 7,833 | 37.4 | 20,952 |
Indigenous |
4,216 | 71.7 | 1,665 | 28.3 | 5,881 |
Non-Indigenous |
8,903 | 59.1 | 6,168 | 40.9 | 15,071 |
| Intersex total | 0 | 0.0 | 0 | 0.0 | 0 |
Indigenous |
0 | 0.0 | 0 | 0.0 | 0 |
Non-Indigenous |
0 | 0.0 | 0 | 0.0 | 0 |
Source: Correctional Service of Canada.
Table C16 Notes
Total Offender Population includes all active offenders who are incarcerated in a CSC facility, offenders on temporary absence from a CSC facility, offenders who are temporarily detained, offenders who are actively supervised, and offenders who are unlawfully at large for less than 90 days.
In Custody includes all active offenders incarcerated in a CSC facility, offenders on temporary absence from a CSC facility, offenders who are temporarily detained in a CSC facility, and offenders on remand in a CSC facility.
In Community Under Supervision includes all active offenders on day parole, full parole, statutory release, in the community supervised on a long-term supervision order, offenders who are temporarily detained in a non-CSC facility, offenders who are unlawfully at large for less than 90 days, offenders on remand in a non-CSC facility, and offenders supervised and subject to an immigration hold by Canada Border Services Agency.
Indigenous identity is self-reported. Non-indigenous offenders includes offenders who do not identify as Indigenous. See Table C9 for the ethnic diversity of CSC's offender population.
The data reflect the number of offenders active at the end of each fiscal year. A fiscal year runs from April 1 to March 31 of the following year.
Offenders in custody at a CSC facility by security risk classification
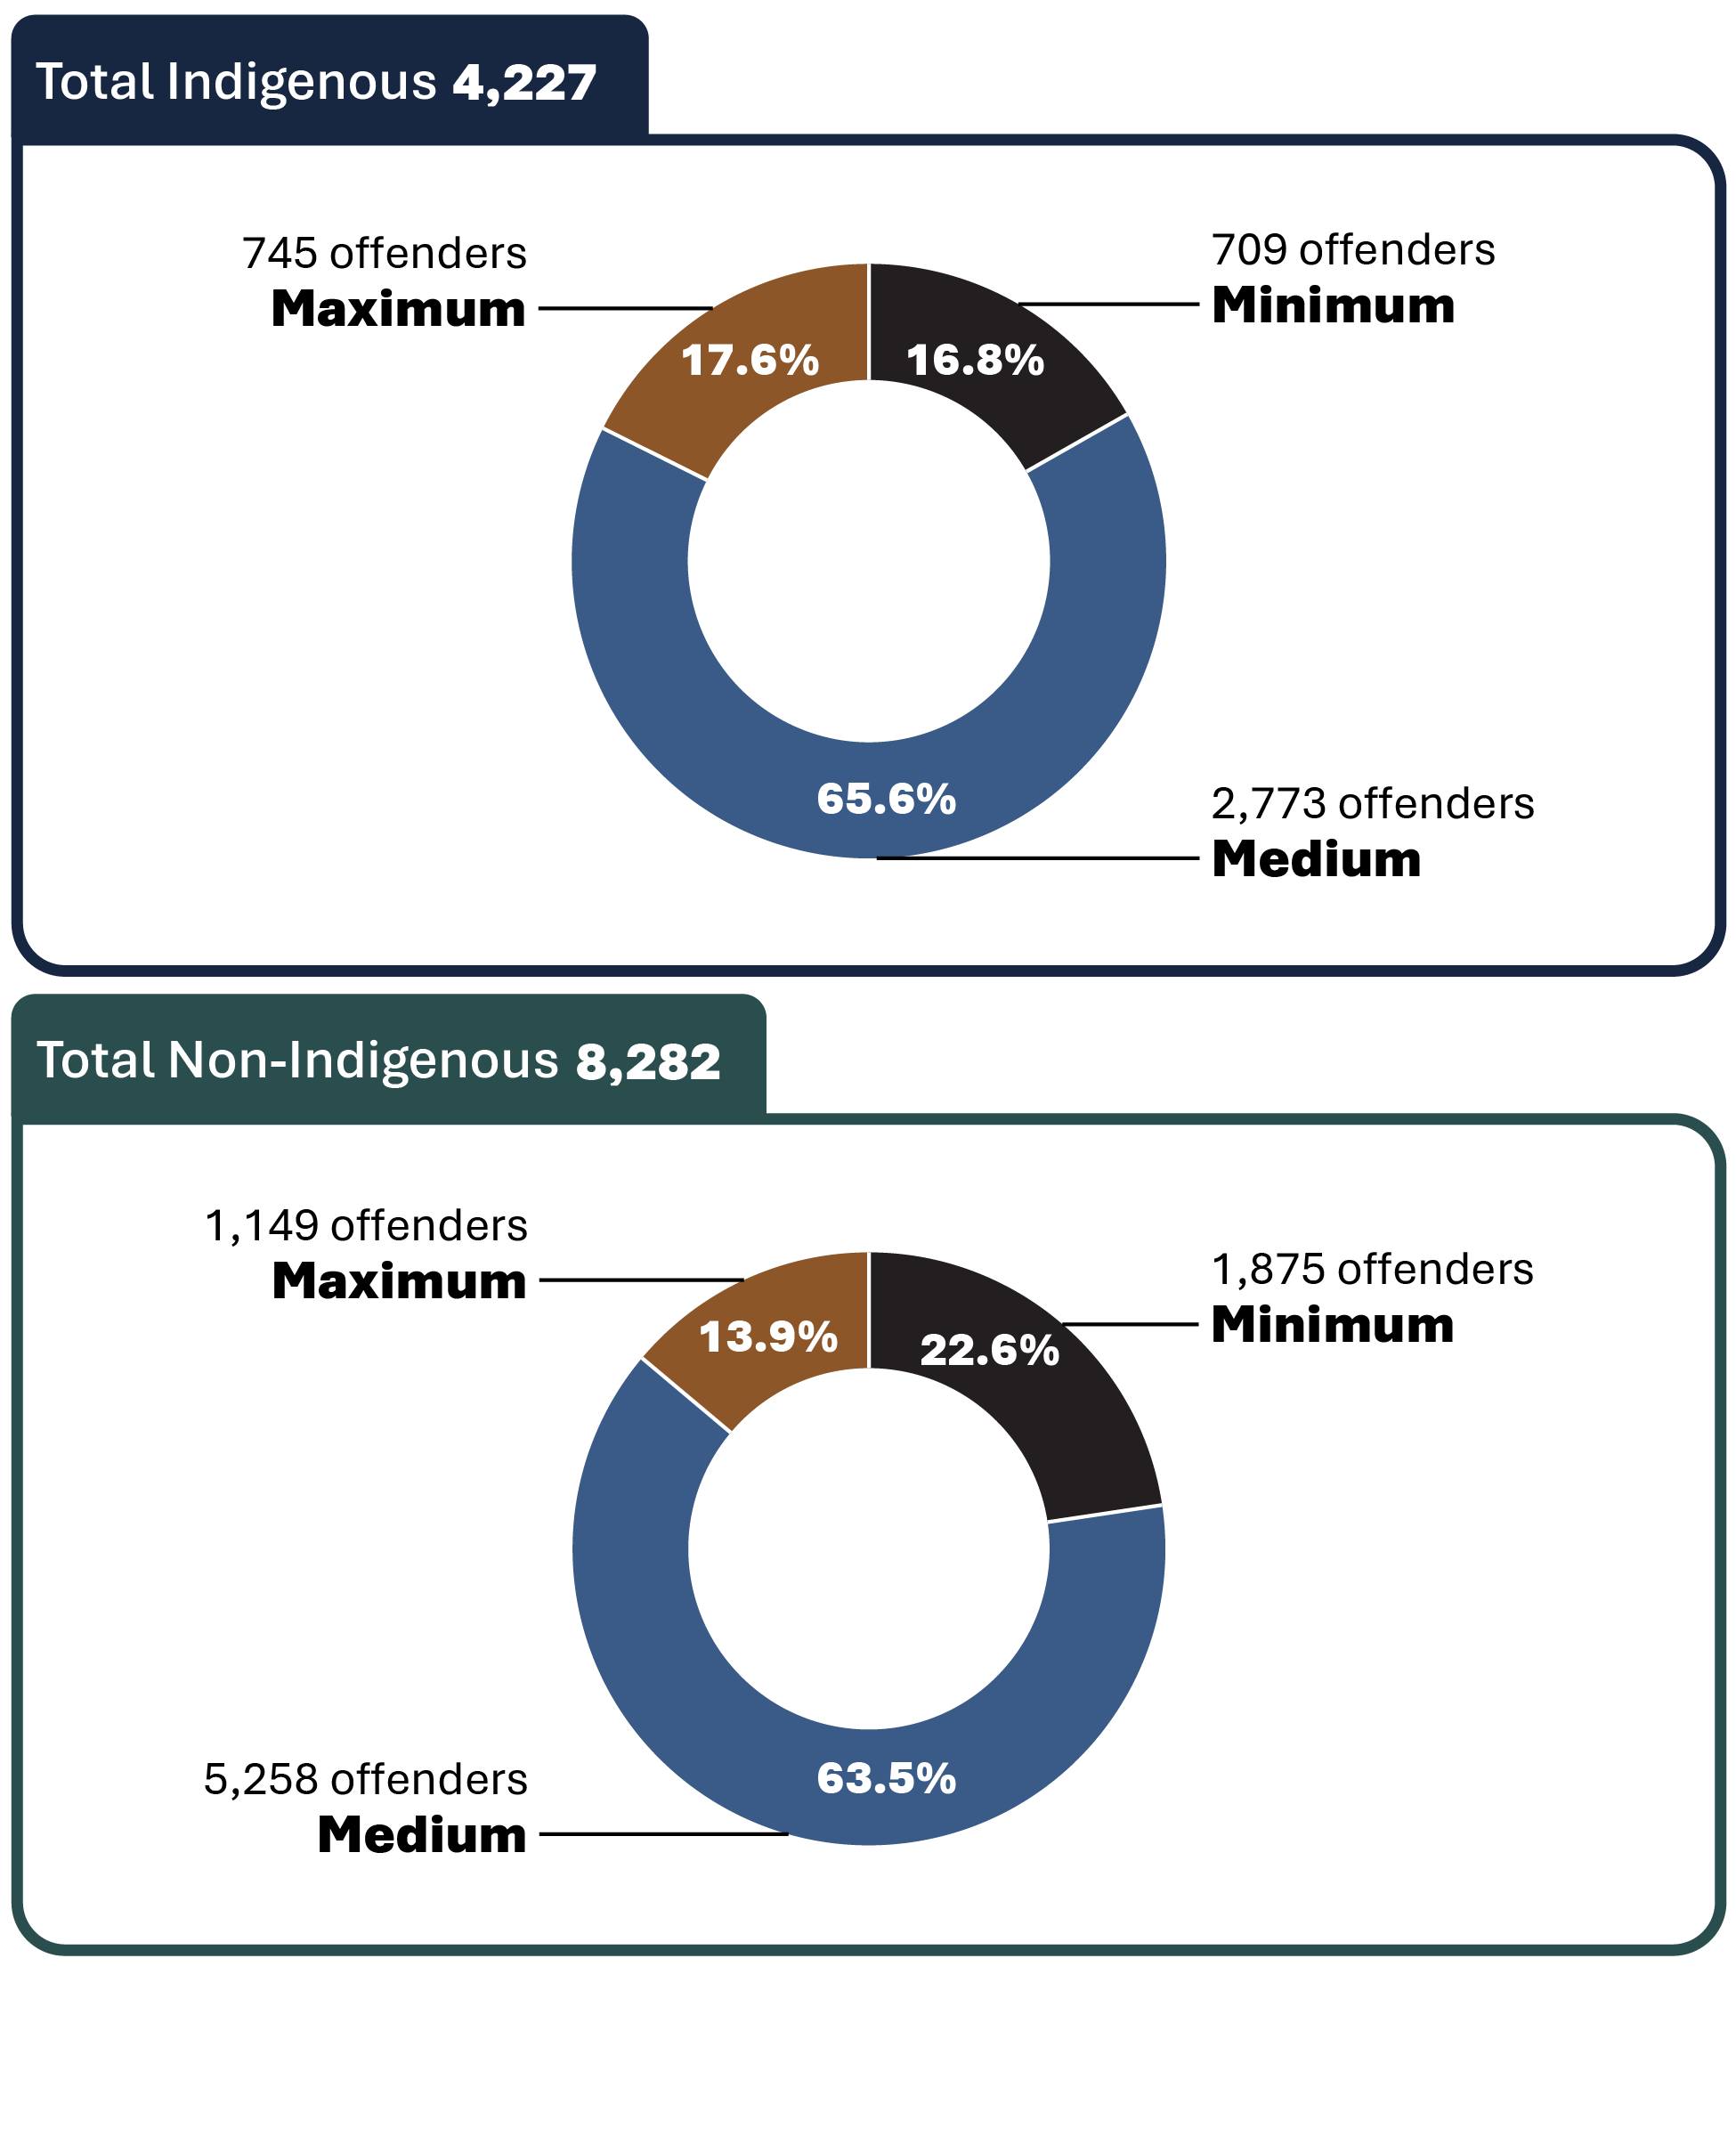
Image description
Figure showing two donut charts illustrating the percentage of classified in-custody offenders by Indigenous self-identification in fiscal year 2023-24. Both charts are divided into three sections categorized by security risk classification. In both charts, the majority of offenders are in medium security. Full data is available in the table below.
Source: Correctional Service of Canada.
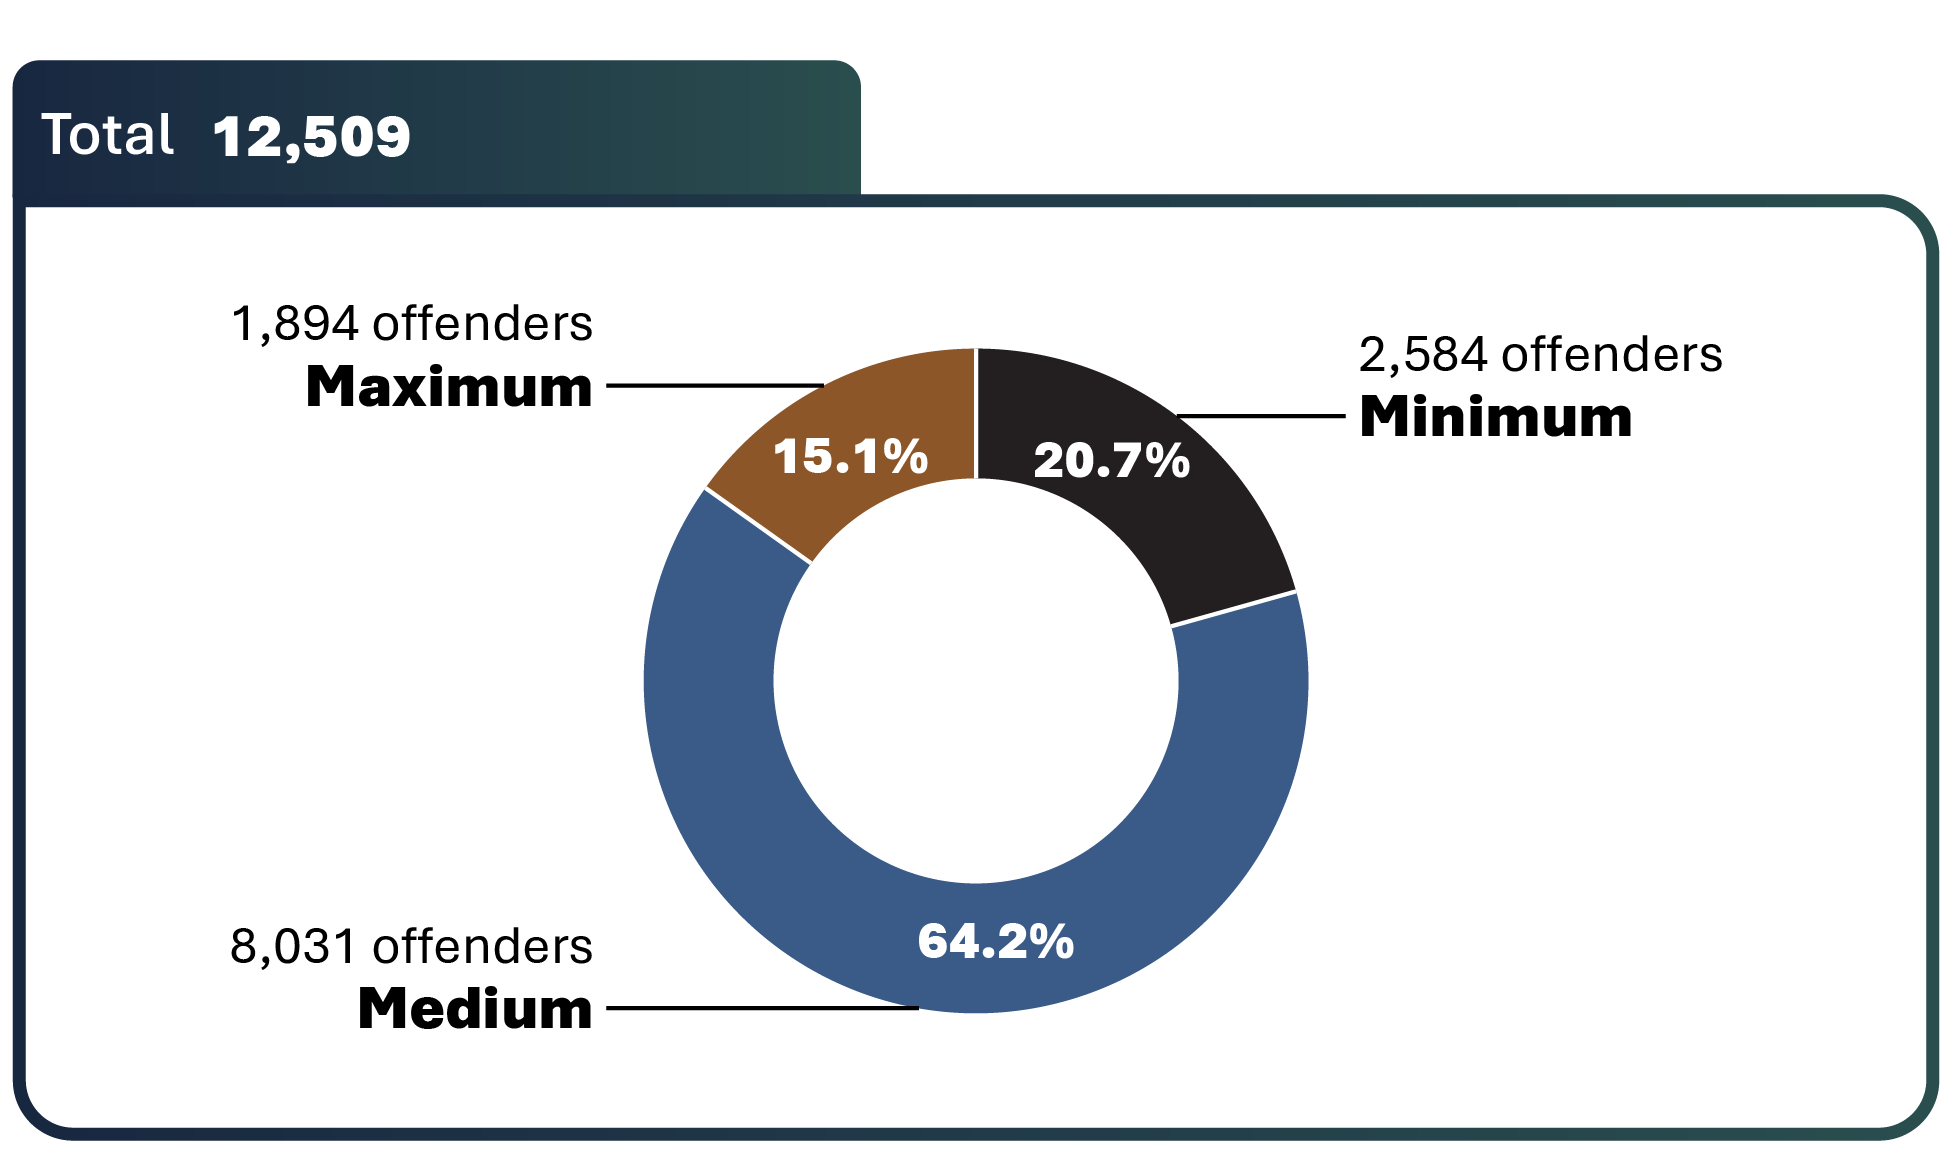
Image description
Donut chart illustrating the total percentage of classified in custody offenders in fiscal year 2023-24. The chart is divided into three sections categorized by security risk classification. The majority of offenders in-custody are in medium security. Full data is available in the table below.
Source: Correctional Service of Canada.
- In 2023-24, approximately two-thirds (64.2%) of offenders were classified as medium security risk. Indigenous offenders were more likely to be classified to a medium or maximum security risk compared to non-Indigenous offenders.
- Compared to non-Indigenous offenders, a lower percentage of Indigenous offenders were classified as minimum security risk (16.8% vs. 22.6%) and a higher percentage were classified as medium (65.6% vs. 63.5%) and maximum (17.6% vs. 13.9%) security risk.
| Security risk level | Indigenous | % | Non-Indigenous | % | Total | % |
|---|---|---|---|---|---|---|
| Total security level | 4,227 | 100.0 | 8,282 | 100.0 | 12,509 | 100.0 |
Minimum |
709 | 16.8 | 1,875 | 22.6 | 2,584 | 20.7 |
Medium |
2,773 | 65.6 | 5,258 | 63.5 | 8,031 | 64.2 |
Maximum |
745 | 17.6 | 1,149 | 13.9 | 1,894 | 15.1 |
| Not yet determined | 352 | 100.0 | 994 | 100.0 | 1,346 | 100.0 |
| Total | 4,579 | 100.0 | 9,276 | 100.0 | 13,855 | 100.0 |
Source: Correctional Service of Canada.
Table C17 Notes
The "Not yet determined" category includes offenders who have not yet been classified.
In-Custody includes all active offenders incarcerated in a CSC facility, offenders on temporary absence from a CSC facility, offenders who are temporarily detained in a CSC facility and offenders on remand in a CSC facility.
The data represent the offender security level decision at the end of fiscal year 2023-24. A fiscal year runs from April 1 to March 31 of the following year.
Admissions to federal jurisdiction with a life and/or indeterminate sentenceFootnote * by sex and Indigenous self-identification: 10-year trend
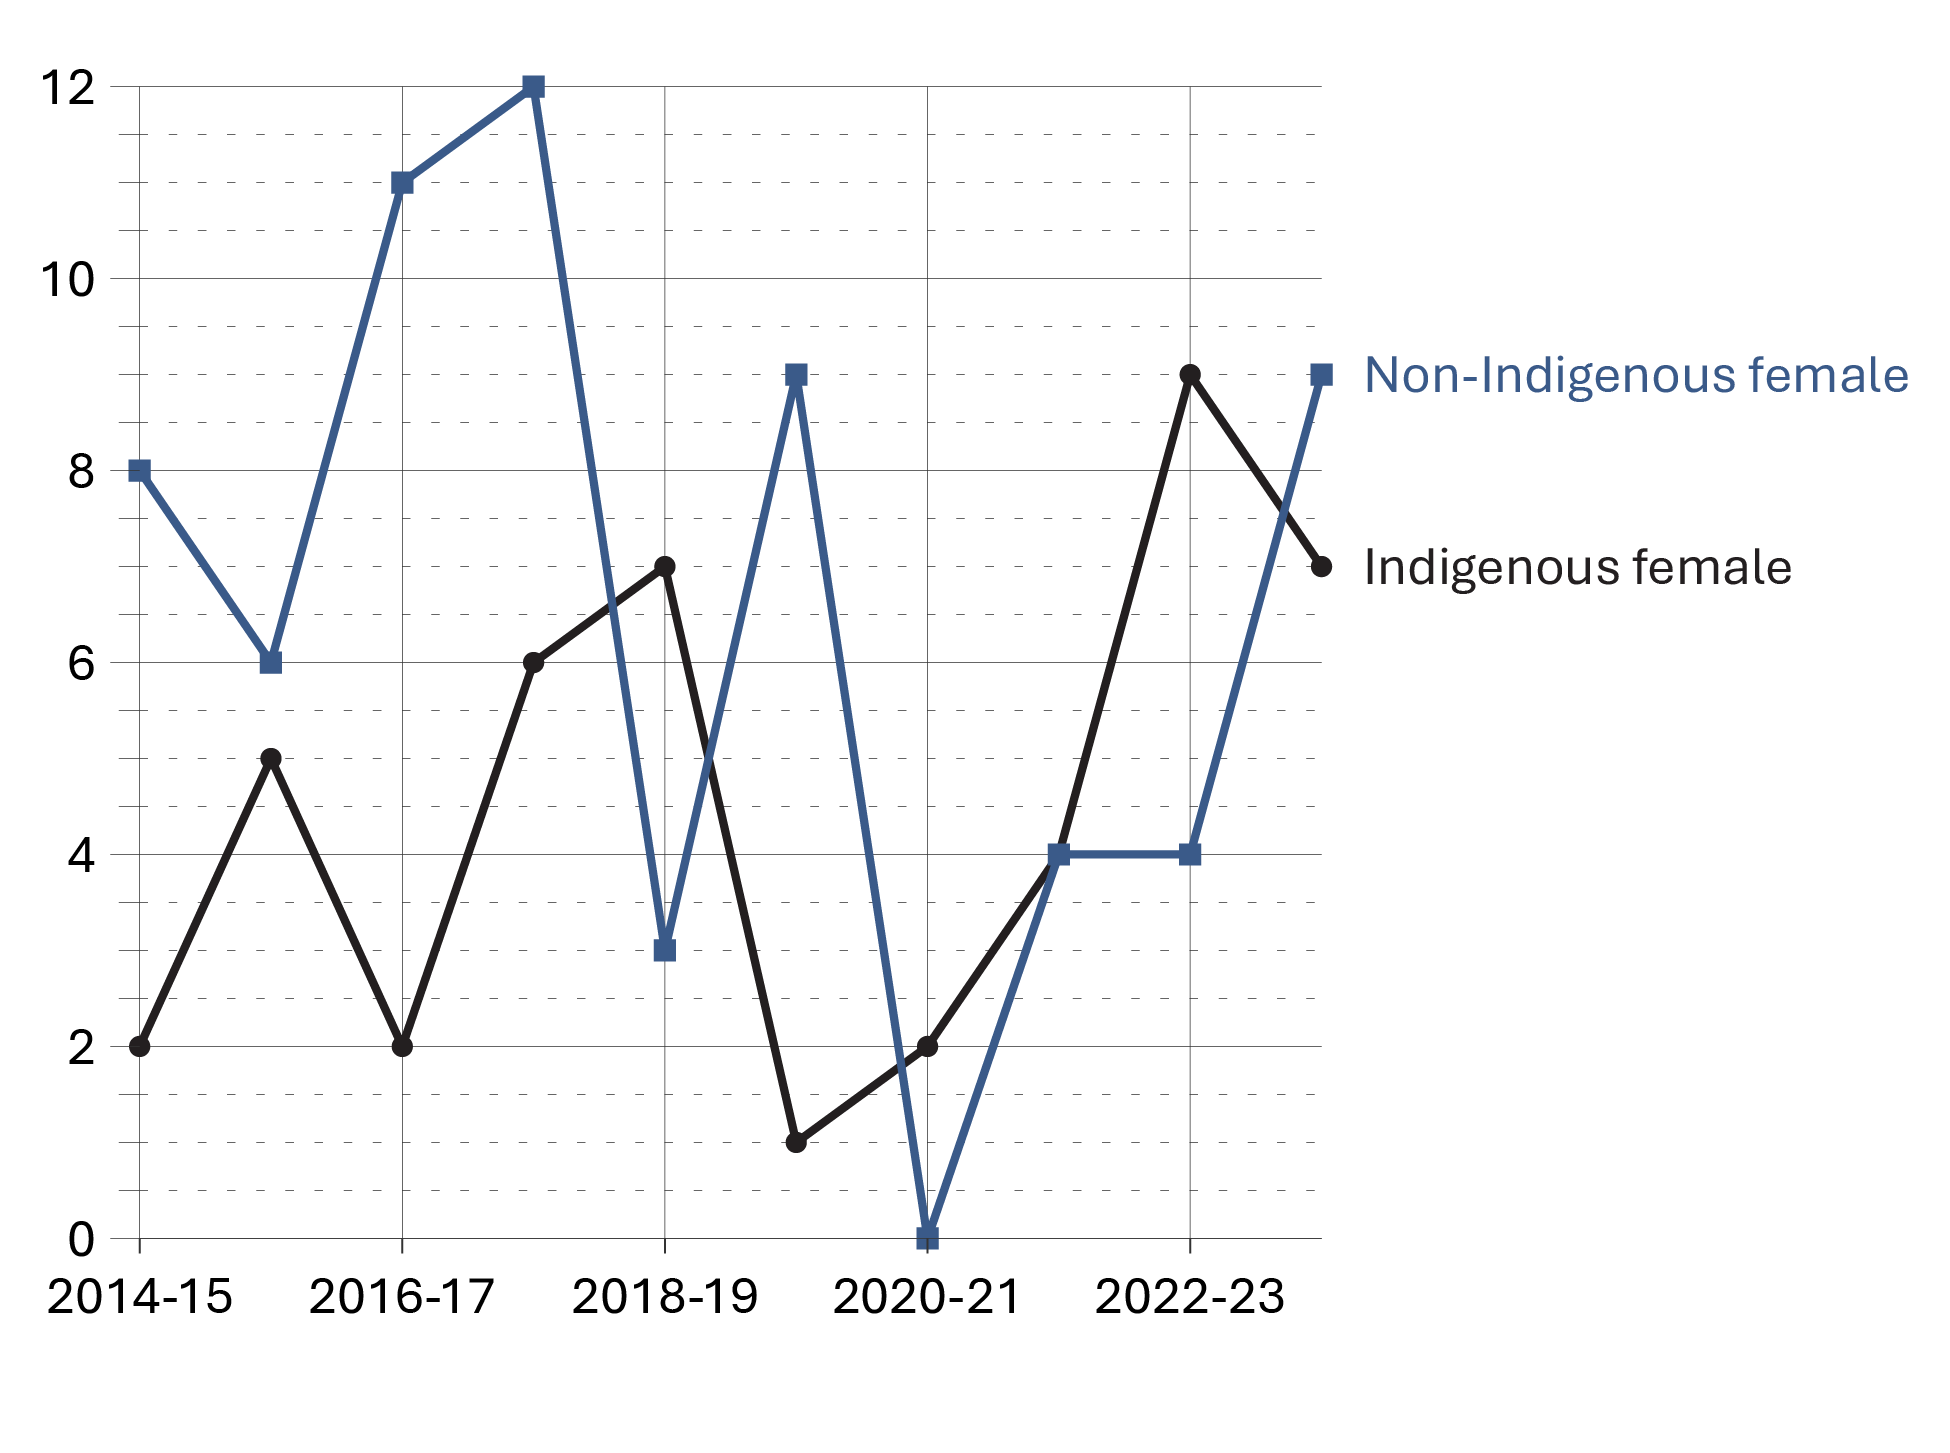
Image description
Line graph showing the number of warrant of committal admissions for life and/or indeterminate sentences among Indigenous and non-Indigenous female offenders over a ten year period from fiscal year 2014-15 to 2023-24. Rates have fluctuated over time, however in 2021-22 the number of warrant of committal admissions were equal among Indigenous and non-Indigenous females, however by 2023-24, non-Indigenous females had a greater number of warrant committal admissions than Indigenous females. Full data is available in the table below.
Source: Correctional Service of Canada.
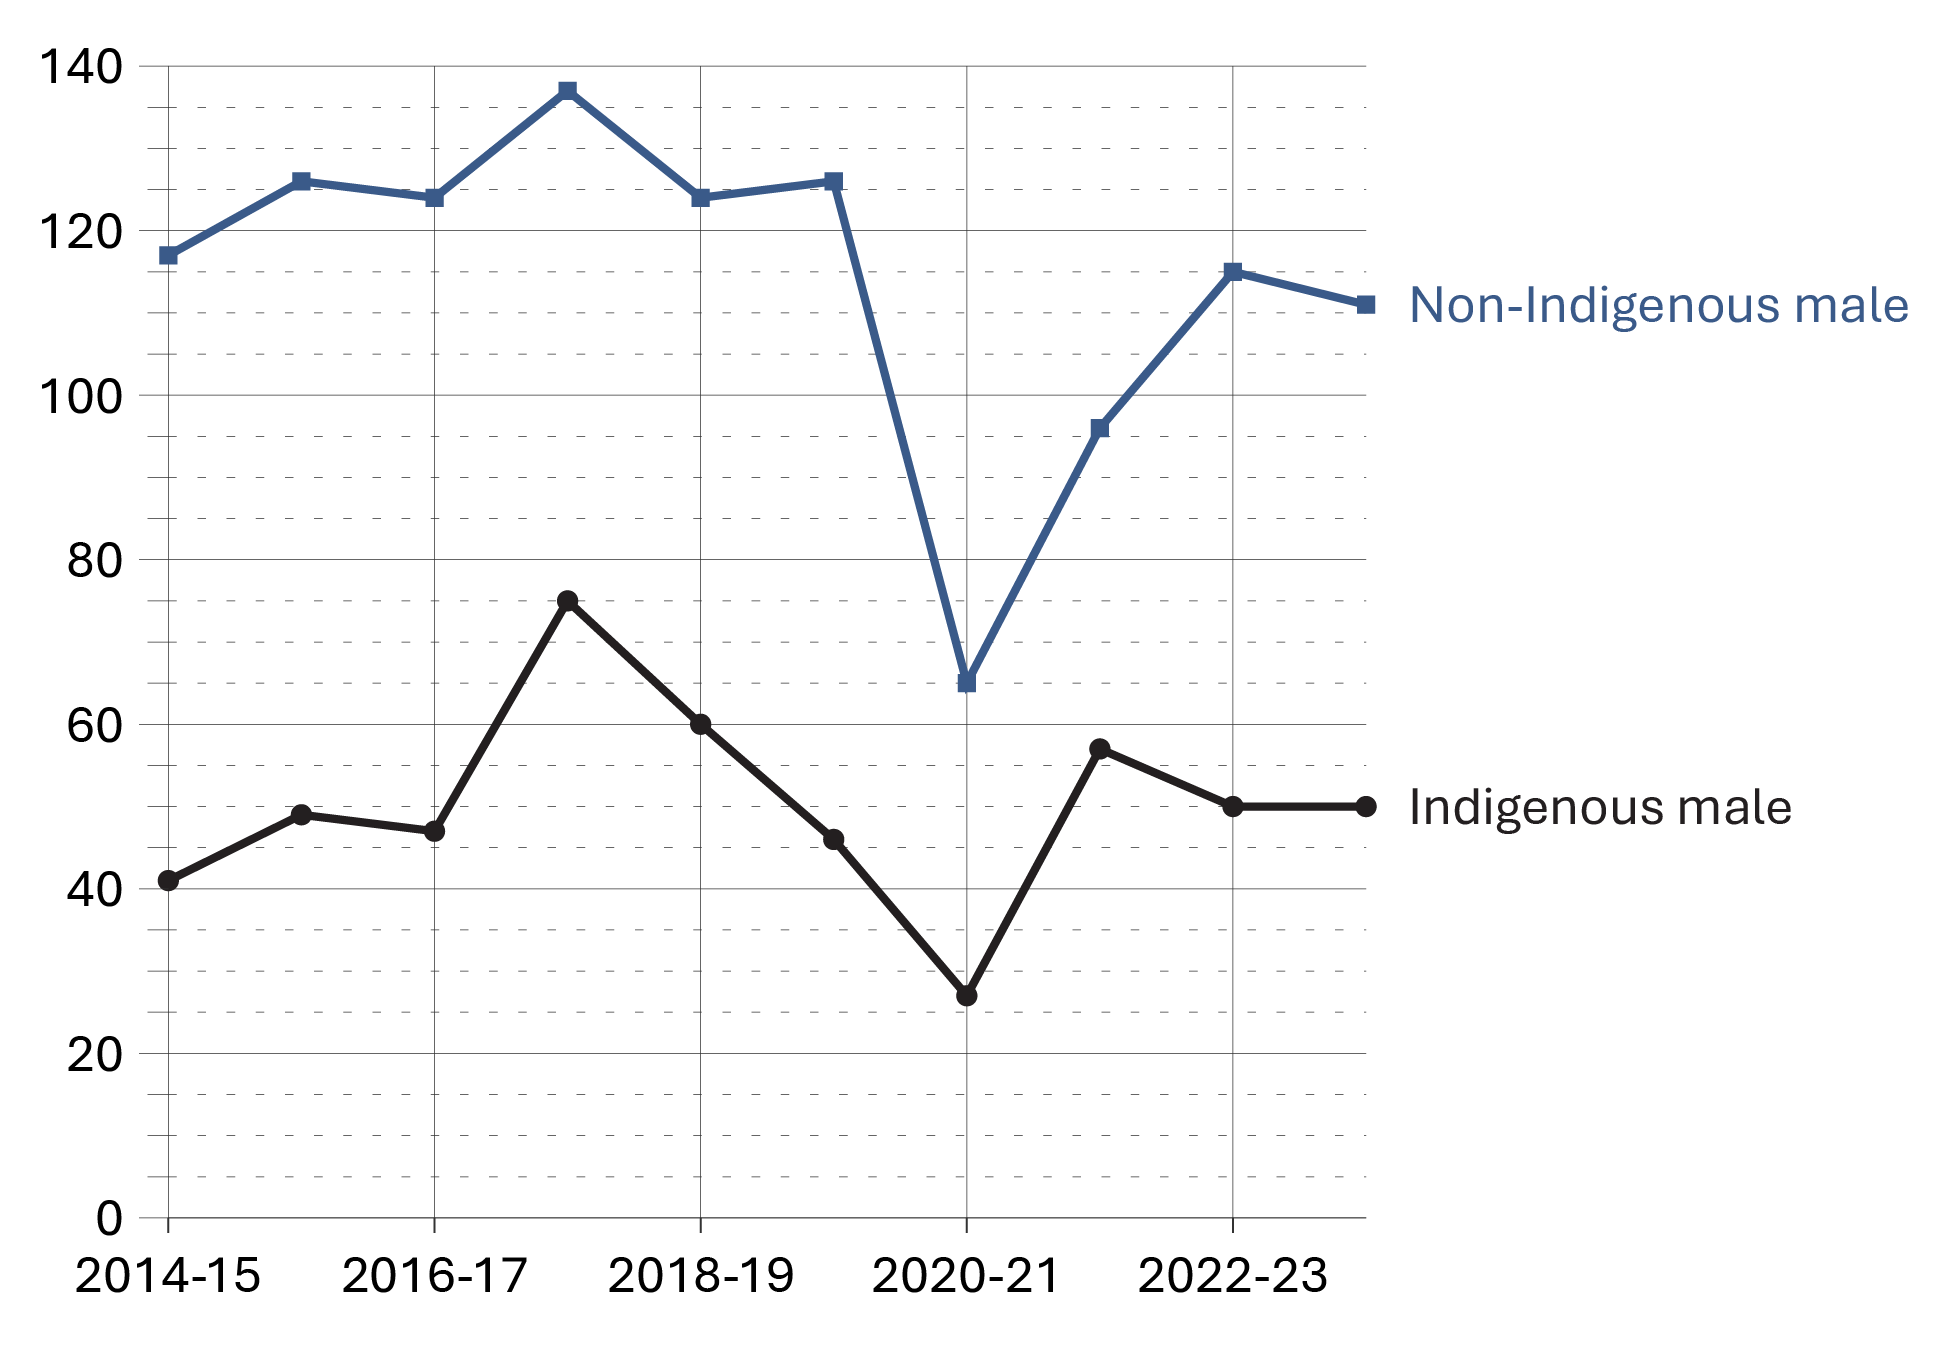
Image description
Line graph showing the number of warrant of committal admissions for life and/or indeterminate sentences among Indigenous and non-Indigenous male offenders over a ten year period from fiscal year 2014-15 to 2023-24. Despite fluctuations over the 10-year period, similar trends were observed for both non-Indigenous and Indigenous males, however the number of warrant of committal admissions remained consistently greater among non-Indigenous males. Full data is available in the table below.
Source: Correctional Service of Canada.
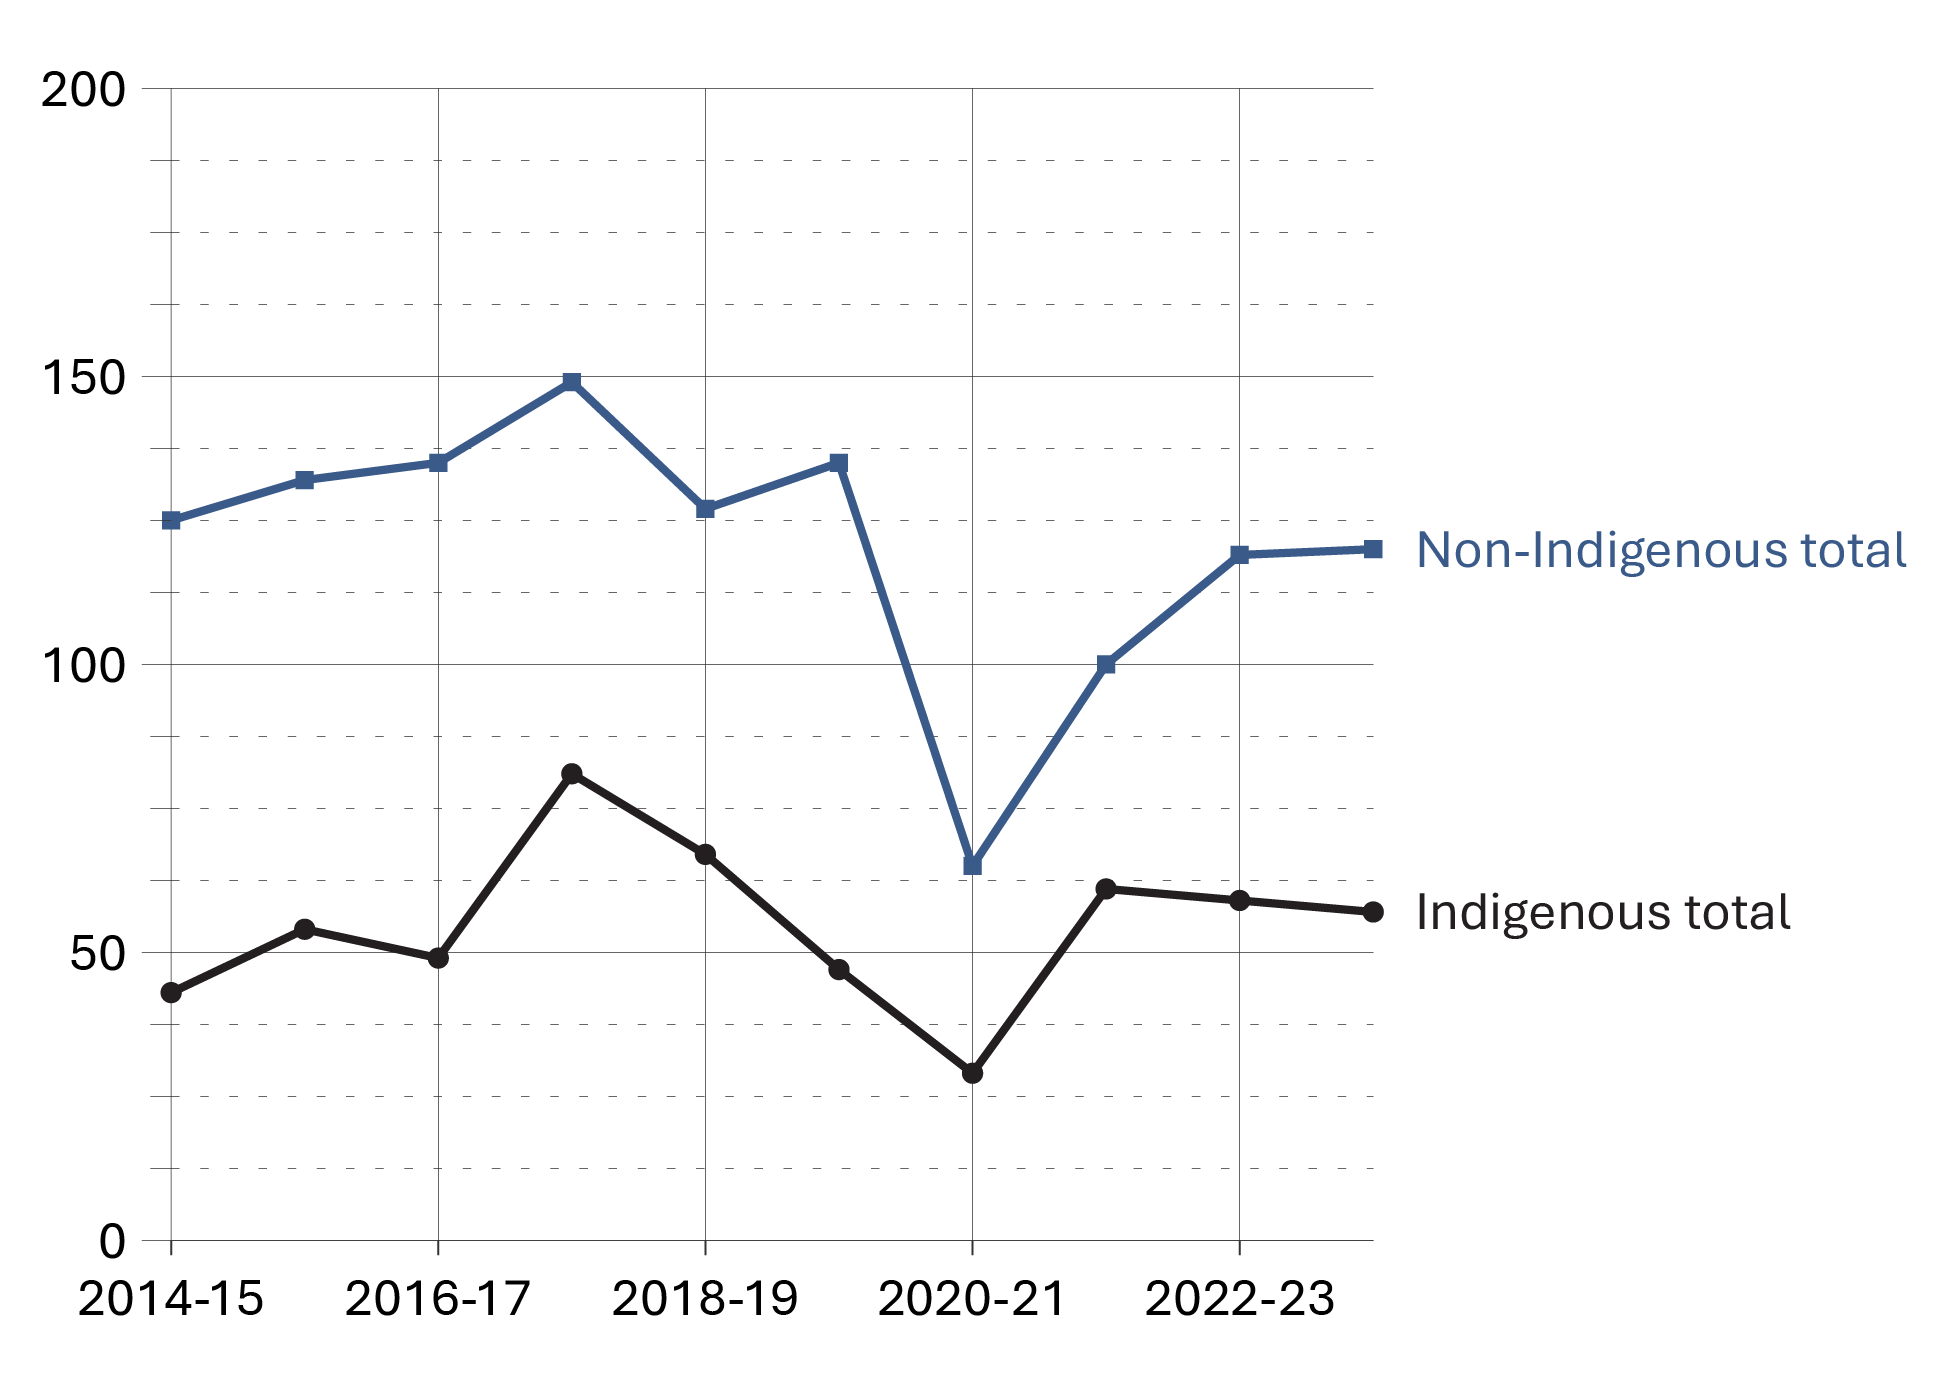
Image description
Line graph showing offenders serving life or indeterminate sentences over ten years, from fiscal year 2014-15 to 2023-24. It compares Indigenous and non-Indigenous offenders. Despite fluctuations over the 10-year period, similar trends were observed for both non-Indigenous and Indigenous offenders, however the number of warrant of committal admissions remained consistently greater among non-Indigenous offenders. Full data is available in the table below.
Source: Correctional Service of Canada.
- From 2014-15 to 2023-24, there was an increase of 5.4% in the number of warrant of committal admissions to CSC facilities with a life and/or indeterminateFootnote * sentence from 168 to 177.
- At the end of fiscal year 2023-24, there were a total of 3,610 offenders in custody with a life and/or indeterminate sentence. Of these, 3,468 (96.1%) were male, 142 (3.9%) were female; 1,103 (30.6%) were Indigenous and 2,507 (69.4%) were non-Indigenous.
- At the end of fiscal year 2023-24, 26.4% of the total population was serving a life and/or indeterminate sentence. Of these offenders, 61.1% were in custody and 38.9% were in the community under supervision.
| Fiscal year | Indigenous females | Indigenous males | Indigenous total |
|---|---|---|---|
| 2014-15 | 2 | 41 | 43 |
| 2015-16 | 5 | 49 | 54 |
| 2016-17 | 2 | 47 | 49 |
| 2017-18 | 6 | 75 | 81 |
| 2018-19 | 7 | 60 | 67 |
| 2019-20 | 1 | 46 | 47 |
| 2020-21 | 2 | 27 | 29 |
| 2021-22 | 4 | 57 | 61 |
| 2022-23 | 9 | 50 | 59 |
| 2023-24 | 7 | 50 | 57 |
Source: Correctional Service of Canada.
| Fiscal year | Non-Indigenous females | Non-Indigenous males | Non-Indigenous total |
|---|---|---|---|
| 2014-15 | 8 | 117 | 125 |
| 2015-16 | 6 | 126 | 132 |
| 2016-17 | 11 | 124 | 135 |
| 2017-18 | 12 | 137 | 149 |
| 2018-19 | 3 | 124 | 127 |
| 2019-20 | 9 | 126 | 135 |
| 2020-21 | 0 | 65 | 65 |
| 2021-22 | 4 | 96 | 100 |
| 2022-23 | 4 | 115 | 119 |
| 2023-24 | 9 | 111 | 120 |
Source: Correctional Service of Canada.
| Fiscal year | Females | Males | Total |
|---|---|---|---|
| 2014-15 | 10 | 158 | 168 |
| 2015-16 | 11 | 175 | 186 |
| 2016-17 | 13 | 171 | 184 |
| 2017-18 | 18 | 212 | 230 |
| 2018-19 | 10 | 184 | 194 |
| 2019-20 | 10 | 172 | 182 |
| 2020-21 | 2 | 92 | 94 |
| 2021-22 | 8 | 153 | 161 |
| 2022-23 | 13 | 165 | 178 |
| 2023-24 | 16 | 161 | 177 |
Source: Correctional Service of Canada.
Table C18 Notes
Proportion of offenders with life and/or indeterminate sentences
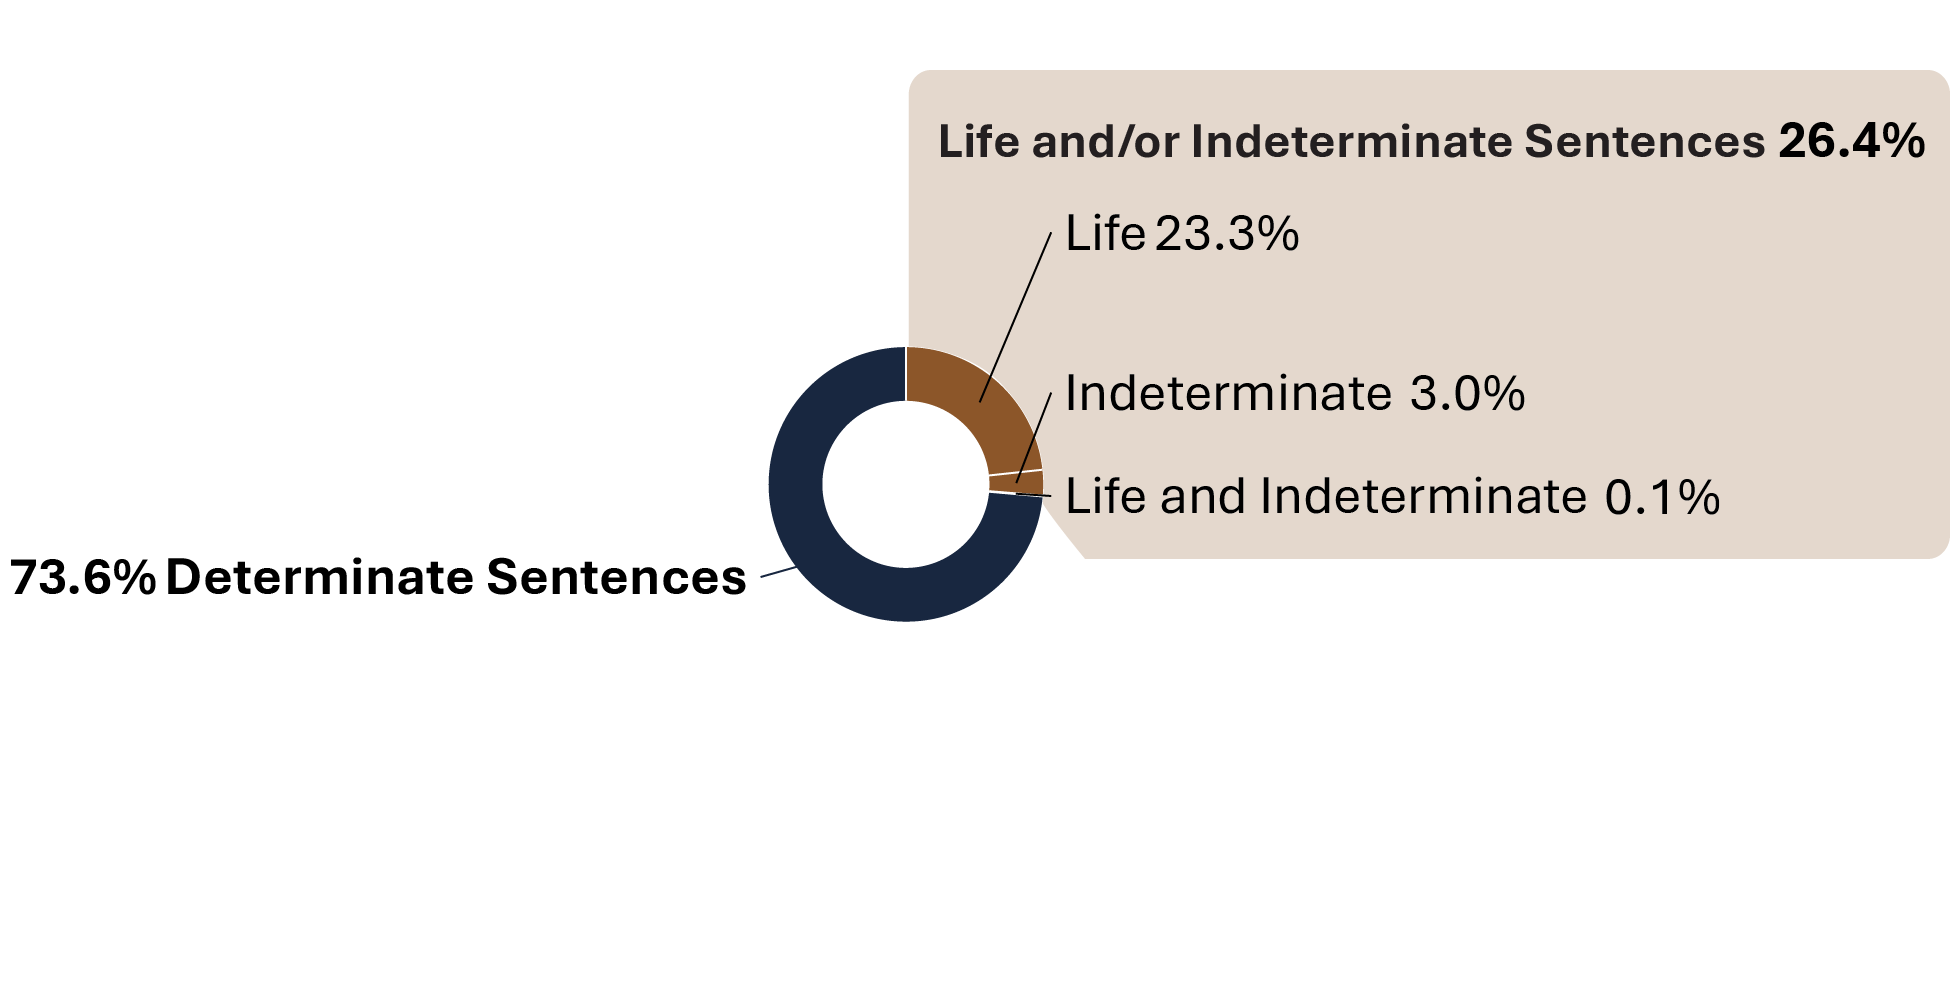
Image description
Donut chart comparing the proportion of life and/or indeterminate sentences, and determinant sentences imposed in fiscal year 2023-24. The majority of sentences were determinate. Out of the life and/or indeterminate sentences, most sentences were imposed for life. Full data is available in the table below.
Source: Correctional Service of Canada.
- At the end of fiscal year 2023-24, there were 5,904 offenders serving a life sentence and/or an indeterminate sentence. This represents 26.4% of the total offender population. The majority (61.1%) of these offenders were in custody. Of the 2,294 offenders serving a life and/or an indeterminate sentence who were in the community under supervision, the majority (78.8%) were serving a life sentence for 2nd degree murder.
- There were 20 offenders who were serving both a life sentence and an indeterminate sentenceFootnote *.
- There were 666 offenders who were serving an indeterminate sentence as a result of a special designation. The remaining 5,218 offenders did not receive a special designation, but were serving a life sentence.
- 93.0% of the 660 Dangerous Offenders with indeterminate sentences were in custody and 7.0% were in the community under supervision.
- In contrast, 33.3% of the 6 Dangerous Sexual Offenders were in custody.
- One offender with an Habitual Offender designation was included in the Designation and Life grouping and this offender was in the community under supervision (see Table C19a).
| Offender population | In custody in a CSC facility: Incarcerated | In community under supervision: Day parole | In community under supervision: Full parole | In community under supervision: OtherFootnote **** |
|---|---|---|---|---|
| Total offenders with a life and/or indeterminate sentence | 3,610 | 367 | 1,927 | 0 |
Total offenders with a life sentence |
2,977 | 350 | 1,891 | 0 |
1st degree murder |
979 | 79 | 276 | 0 |
2nd degree murder |
1,886 | 262 | 1,546 | 0 |
Other offencesFootnote * |
112 | 9 | 69 | 0 |
Total offenders with indeterminate sentences resulting from the special designation of: |
616 | 17 | 33 | 0 |
Dangerous Offender |
614 | 16Footnote ***** | 30Footnote ***** | 0 |
Dangerous Sexual Offender |
2 | 1Footnote ***** | 3Footnote ***** | 0 |
Habitual Offender |
0 | 0 | 0 | 0 |
Offenders serving an indeterminate sentence (due to a special designation) and a life sentence (due to an offence)Footnote ** |
17 | 0 | 3Footnote ***** | 0 |
| Offenders serving determinate sentencesFootnote *** | 10,245 | 1,229 | 2,208 | 2,789 |
| Total | 13,855 | 1,596 | 4,135 | 2,789 |
Source: Correctional Service of Canada.
| Offender population | Total population | % |
|---|---|---|
| Total offenders with a life and/or indeterminate sentence | 5,904 | 26.4 |
Total offenders with a life sentence |
5,218 | 23.3 |
1st degree murder |
1,334 | 6.0 |
2nd degree murder |
3,694 | 16.5 |
Other offencesFootnote * |
190 | 0.8 |
Total offenders with indeterminate sentences resulting from the special designation of: |
666 | 3.0 |
Dangerous Offender |
660 | 2.9 |
Dangerous Sexual Offender |
6 | 0.0 |
Habitual Offender |
0 | 0.0 |
Offenders serving an indeterminate sentence (due to a special designation) and a life sentence (due to an offence)Footnote ** |
20 | 0.1 |
| Offenders serving determinate sentencesFootnote *** | 16,471 | 73.6 |
| Total | 22,375 | 100.0 |
Source: Correctional Service of Canada.
Table C19 Notes
Percentage of total offender population serving a sentence for a violent offence
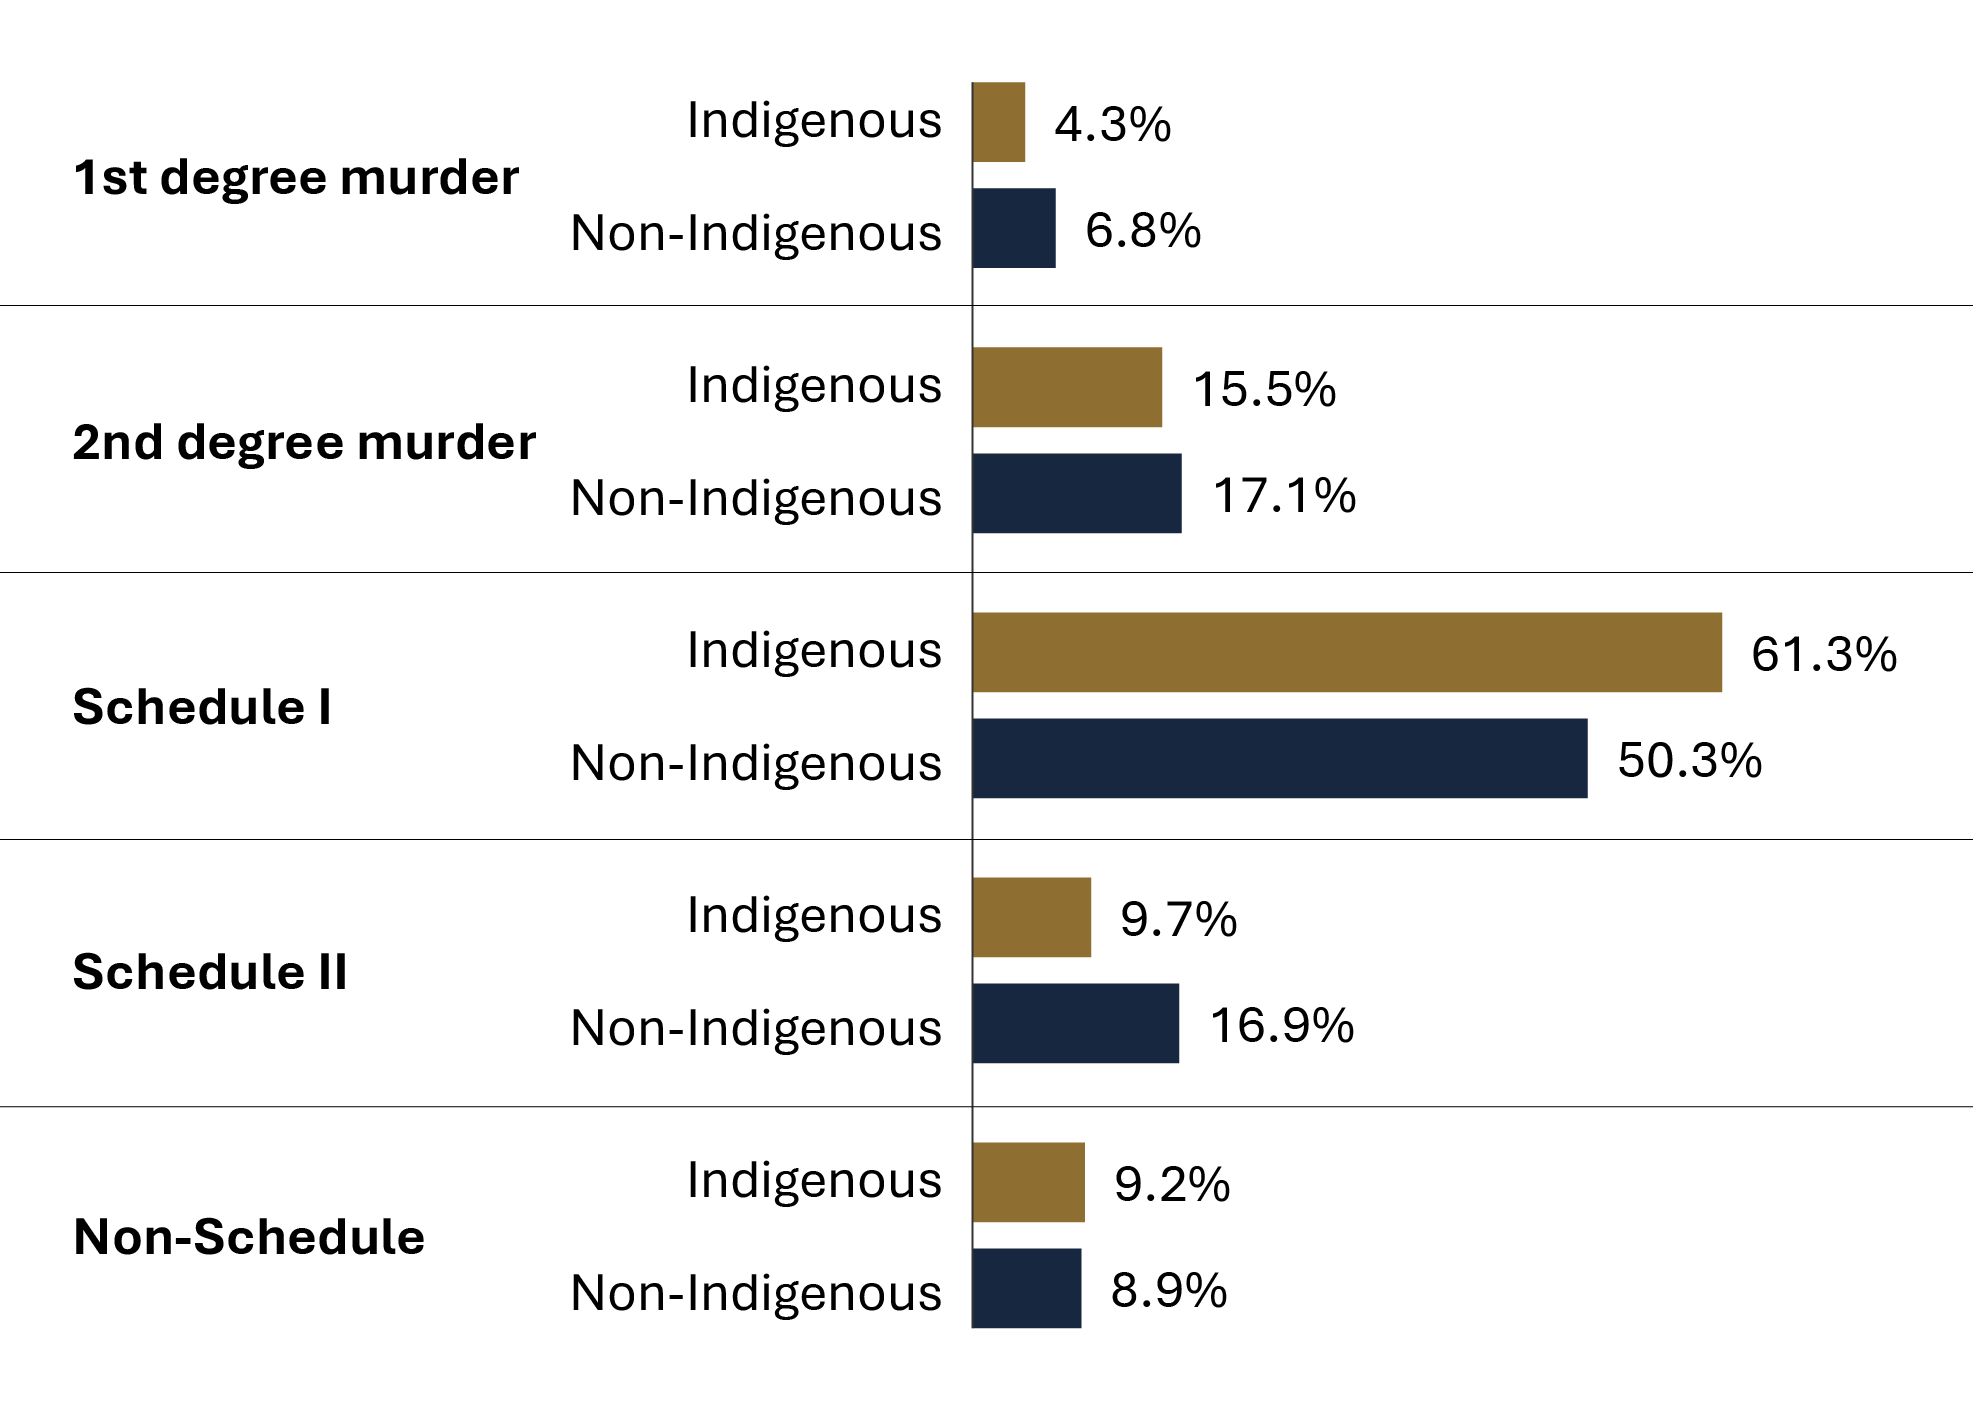
Image description
Bar graph showing the proportion of the total offender population serving a sentence for a violent offence by Indigenous and non-Indigenous identity in fiscal year 2023-24. Violent offences included in the graph are first-degree murder, second-degree murder, schedule I, schedule II, and non-schedule offences. Most sentences were for schedule I offences among both population groups. Full data are available in the table below.
Source: Correctional Service of Canada.
- At the end of fiscal year 2023-24, Indigenous offenders were more likely to be serving a sentence for a violent offence (81.0% for Indigenous versus 74.2% for non-Indigenous).
- 71.6% of Indigenous female offenders were serving a sentence for a violent offence compared to 52.9% of non-Indigenous female offenders.
- Of the total number of offenders serving a sentence for murder (i.e., 1st degree or 2nd degree), 5.1% were female and 25.3% were Indigenous.
- A greater proportion of Indigenous offenders than non-Indigenous offenders were serving a sentence for a Schedule I offence (61.3% versus 50.3%, respectively).
- 9.7% of Indigenous offenders were serving a sentence for a Schedule II offence compared to 16.9% of non-Indigenous offenders.
- 25.9% of female offenders were serving a sentence for a Schedule II offence compared to 14.1% for male offenders.
| Offence category | Indigenous Female | % | Indigenous Male | % | Indigenous Total |
|---|---|---|---|---|---|
| 1st degree murder | 14 | 2.3 | 263 | 4.5 | 277 |
| 2nd degree murder | 86 | 14.2 | 919 | 15.6 | 1,005 |
| Schedule I | 334 | 55.1 | 3,640 | 61.9 | 3,974 |
| Schedule II | 109 | 18.0 | 522 | 8.9 | 631 |
| Non-schedule | 63 | 10.4 | 537 | 9.1 | 600 |
| Total | 606 | 100.0 | 5,881 | 100.0 | 6,487 |
Source: Correctional Service of Canada.
| Offence category | Non-Indigenous Female | % | Non-Indigenous Male | % | Non-Indigenous Total |
|---|---|---|---|---|---|
| 1st degree murder | 43 | 5.3 | 1,030 | 6.8 | 1,073 |
| 2nd degree murder | 117 | 14.3 | 2,597 | 17.2 | 2,714 |
| Schedule I | 272 | 33.3 | 7,726 | 51.3 | 7,998 |
| Schedule II | 260 | 31.8 | 2,430 | 16.1 | 2,690 |
| Non-schedule | 125 | 15.3 | 1,288 | 8.5 | 1,413 |
| Total | 817 | 100.0 | 15,071 | 100.0 | 15,888 |
Source: Correctional Service of Canada.
| Offence category | Female | % | Male | % | Total |
|---|---|---|---|---|---|
| 1st degree murder | 57 | 4.0 | 1,293 | 6.2 | 1,350 |
| 2nd degree murder | 203 | 14.3 | 3,516 | 16.8 | 3,719 |
| Schedule I | 606 | 42.6 | 11,366 | 54.2 | 11,972 |
| Schedule II | 369 | 25.9 | 2,952 | 14.1 | 3,321 |
| Non-schedule | 188 | 13.2 | 1,825 | 8.7 | 2,013 |
| Total | 1,423 | 100.0 | 20,952 | 100.0 | 22,375 |
Source: Correctional Service of Canada.
Table C20 Notes
Indigenous offenders under the responsibility of CSC
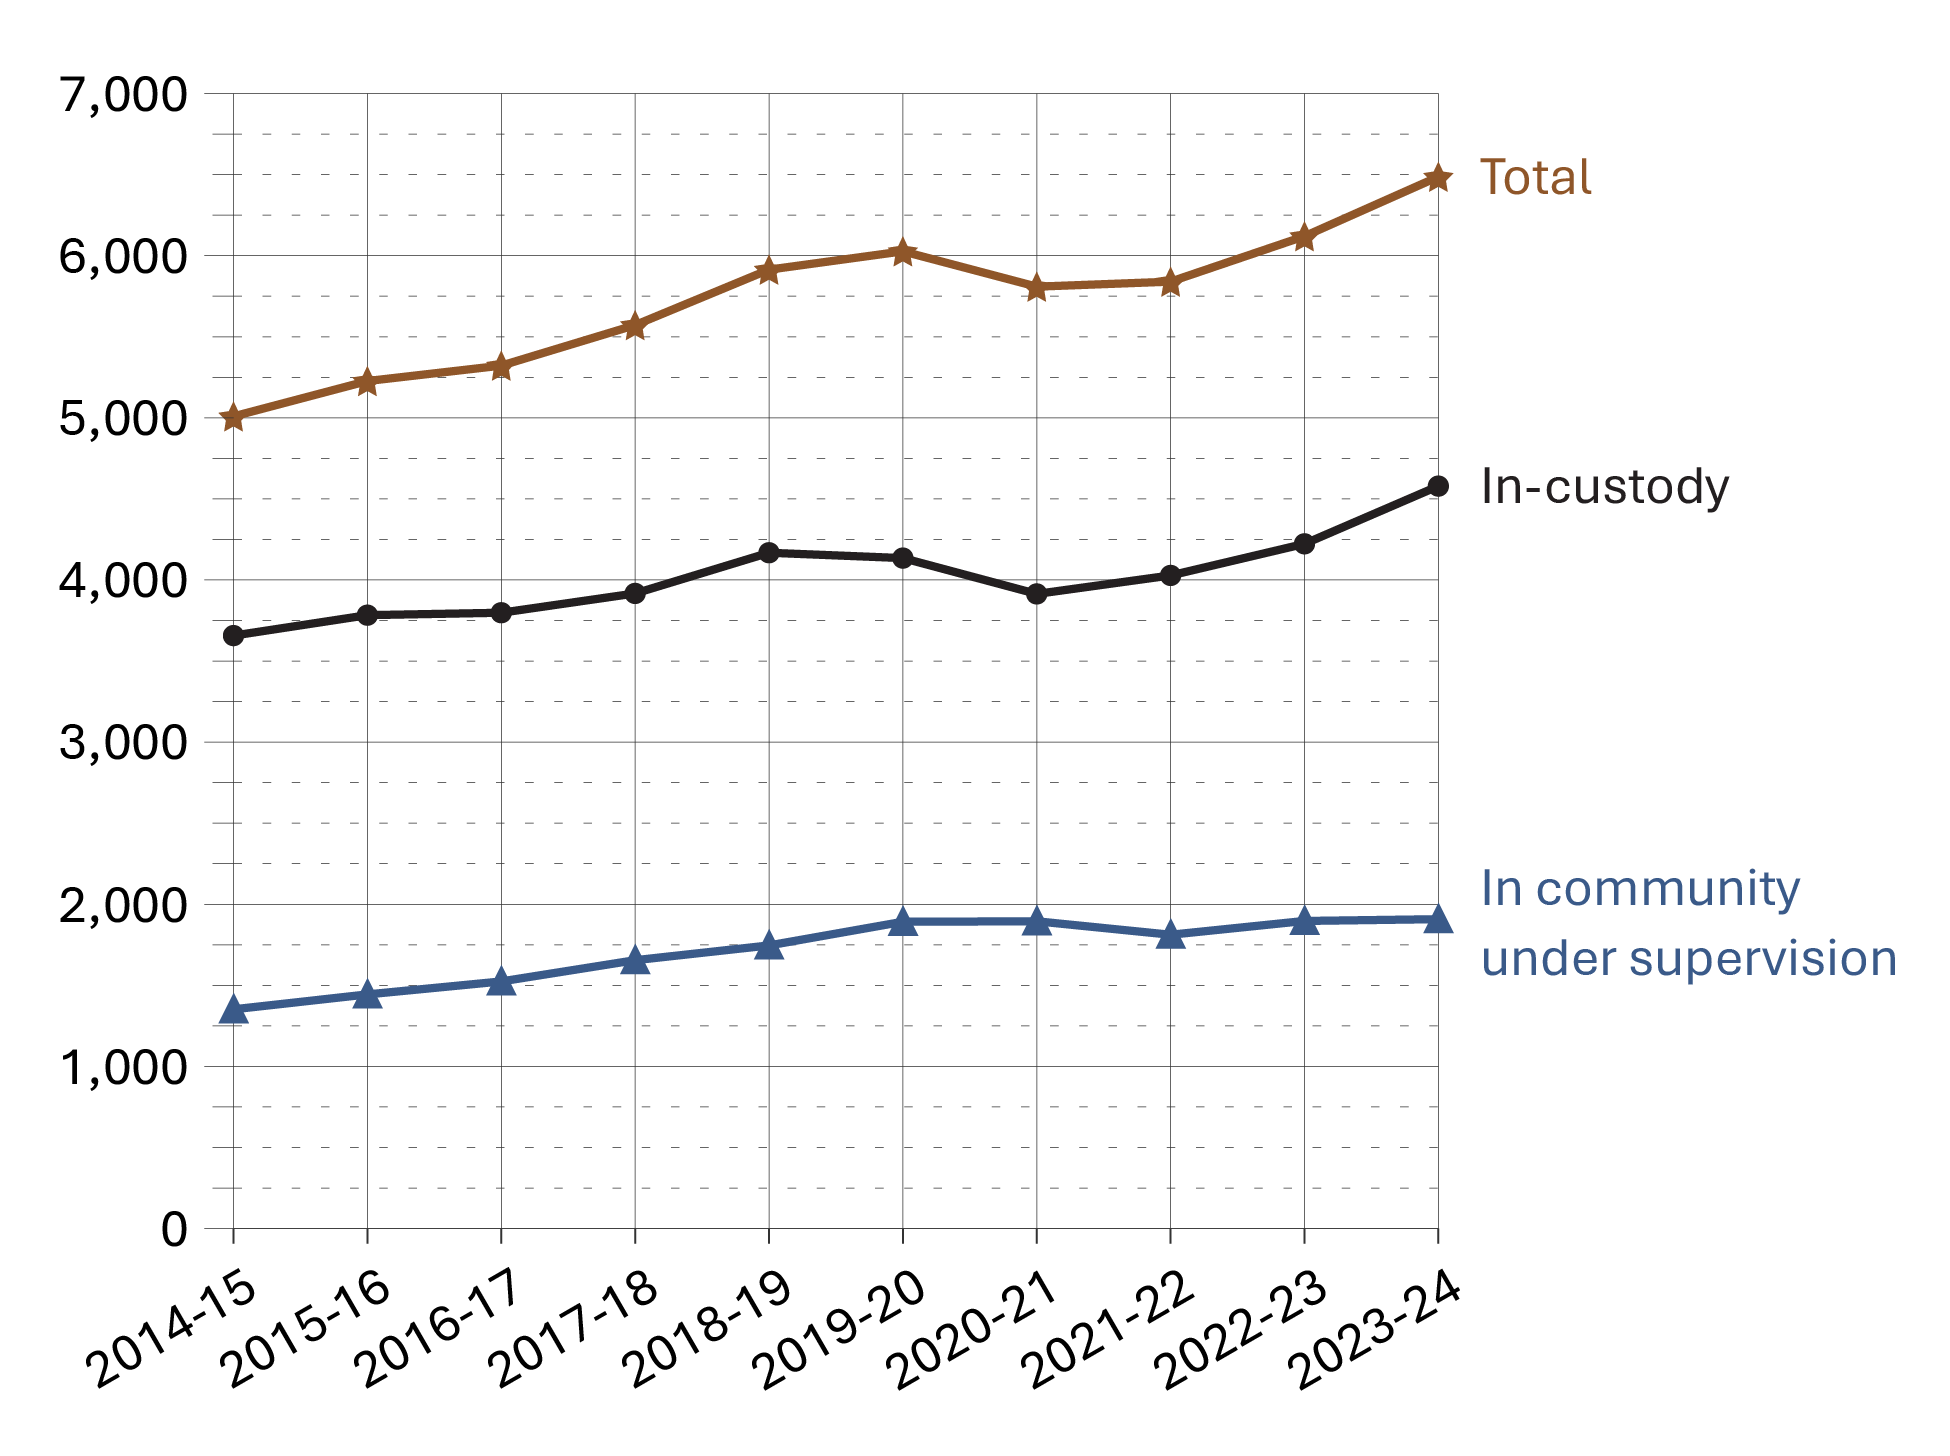
Image description
Line graph showing the Indigenous offender population under the responsibility of Correctional Service of Canada over a ten year period from fiscal year 2014-15 to 2023-24. The graph includes the total offender population, the in-custody population, and the in community under supervision population. The majority of Indigenous offenders were in custody. Both the in-custody group and the community supervision group have increased slightly over time. Full data are available in the table below.
Source: Correctional Service of Canada.
- From 2014-15 to 2023-24, the in-custody Indigenous offender population increased by 25.2%, while the total Indigenous offender population increased 29.5% over the same period of time.
- The number of in-custody Indigenous female offenders increased steadily from 240 in 2014-15 to 363 in 2023-24, representing an increase of 51.3%. The increase for in-custody Indigenous male offenders was 23.4% for the same period, increasing from 3,417 to 4,216.
- From 2014-2015 to 2023-24, the number of Indigenous offenders on community supervision increased 41.1%, from 1,352 to 1,908. The Indigenous community population accounted for 22.4% of the total community population in 2023-24.
| Region | 2019-20 | 2020-21 | 2021-22 | 2022-23 | 2023-24 |
|---|---|---|---|---|---|
| Atlantic region total | 252 | 236 | 227 | 231 | 267 |
Female |
18 | 25 | 19 | 20 | 25 |
Male |
234 | 211 | 208 | 211 | 242 |
Intersex |
0 | 0 | 0 | 0 | 0 |
| Quebec region total | 383 | 366 | 408 | 437 | 506 |
Female |
13 | 14 | 19 | 15 | 19 |
Male |
370 | 352 | 389 | 422 | 487 |
Intersex |
0 | 0 | 0 | 0 | 0 |
| Ontario region total | 661 | 581 | 666 | 759 | 777 |
Female |
49 | 53 | 60 | 62 | 74 |
Male |
612 | 528 | 606 | 697 | 703 |
Intersex |
0 | 0 | 0 | 0 | 0 |
| Prairie region total | 2,120 | 2,052 | 2,099 | 2,139 | 2,360 |
Female |
152 | 127 | 156 | 167 | 196 |
Male |
1,968 | 1,925 | 1,943 | 1,972 | 2,164 |
Intersex |
0 | 0 | 0 | 0 | 0 |
| Pacific region total | 719 | 679 | 628 | 657 | 669 |
Female |
47 | 48 | 37 | 45 | 49 |
Male |
671 | 630 | 591 | 612 | 620 |
Intersex |
1 | 1 | 0 | 0 | 0 |
| National total | 4,135 | 3,914 | 4,028 | 4,223 | 4,579 |
Female total |
279 | 267 | 291 | 309 | 363 |
Male total |
3,855 | 3,646 | 3,737 | 3,914 | 4,216 |
Intersex total |
1 | 1 | 0 | 0 | 0 |
Source: Correctional Service of Canada.
| Region | 2019-20 | 2020-21 | 2021-22 | 2022-23 | 2023-24 |
|---|---|---|---|---|---|
| Atlantic region total | 119 | 110 | 109 | 120 | 120 |
Female |
13 | 13 | 10 | 15 | 20 |
Male |
106 | 97 | 99 | 105 | 100 |
Intersex |
0 | 0 | 0 | 0 | 0 |
| Quebec region total | 190 | 191 | 156 | 187 | 204 |
Female |
8 | 9 | 6 | 8 | 6 |
Male |
182 | 182 | 150 | 179 | 198 |
Intersex |
0 | 0 | 0 | 0 | 0 |
| Ontario region total | 305 | 325 | 343 | 354 | 385 |
Female |
28 | 34 | 39 | 52 | 54 |
Male |
277 | 291 | 304 | 302 | 331 |
Intersex |
0 | 0 | 0 | 0 | 0 |
| Prairie region total | 869 | 879 | 790 | 845 | 808 |
Female |
119 | 123 | 103 | 132 | 123 |
Male |
750 | 756 | 687 | 713 | 685 |
Intersex |
0 | 0 | 0 | 0 | 0 |
| Pacific region total | 409 | 390 | 414 | 391 | 391 |
Female |
40 | 38 | 41 | 38 | 40 |
Male |
369 | 352 | 373 | 353 | 351 |
Intersex |
0 | 0 | 0 | 0 | 0 |
| National total | 1,892 | 1,895 | 1,812 | 1,897 | 1,908 |
Female total |
208 | 217 | 199 | 245 | 243 |
Male total |
1,684 | 1,678 | 1,613 | 1,652 | 1,665 |
Intersex total |
0 | 0 | 0 | 0 | 0 |
Source: Correctional Service of Canada.
Table C21 Notes
Total Offender Population includes all active offenders who are incarcerated in a CSC facility, offenders on temporary absence from a CSC facility, offenders who are temporarily detained, offenders who are actively supervised, and offenders who are unlawfully at large for less than 90 days.
In Custody includes all active offenders incarcerated in a CSC facility, offenders on temporary absence from a CSC facility, offenders who are temporarily detained in a CSC facility, and offenders on remand in a CSC facility.
In Community Under Supervision includes all active offenders on day parole, full parole, statutory release, or in the community supervised on a long-term supervision order, offenders who are temporarily detained in a non-CSC facility, offenders who are unlawfully at large for less than 90 days, offenders on remand in a non-CSC facility, and offenders supervised and subject to an immigration hold by Canada Border Services Agency.
Regional statistics for the Correctional Service of Canada account for data relating to the northern territories in the following manner: data for Nunavut are reported in the Ontario Region, data for the Northwest Territories are reported in the Prairies Region, and data for Yukon under the Pacific Region.
Reported year periods reflect fiscal years. A fiscal year runs from April 1 to March 31 of the following year.
Number of authorizations for transfer to Structured Intervention Units in federal institutions: 5-year trend
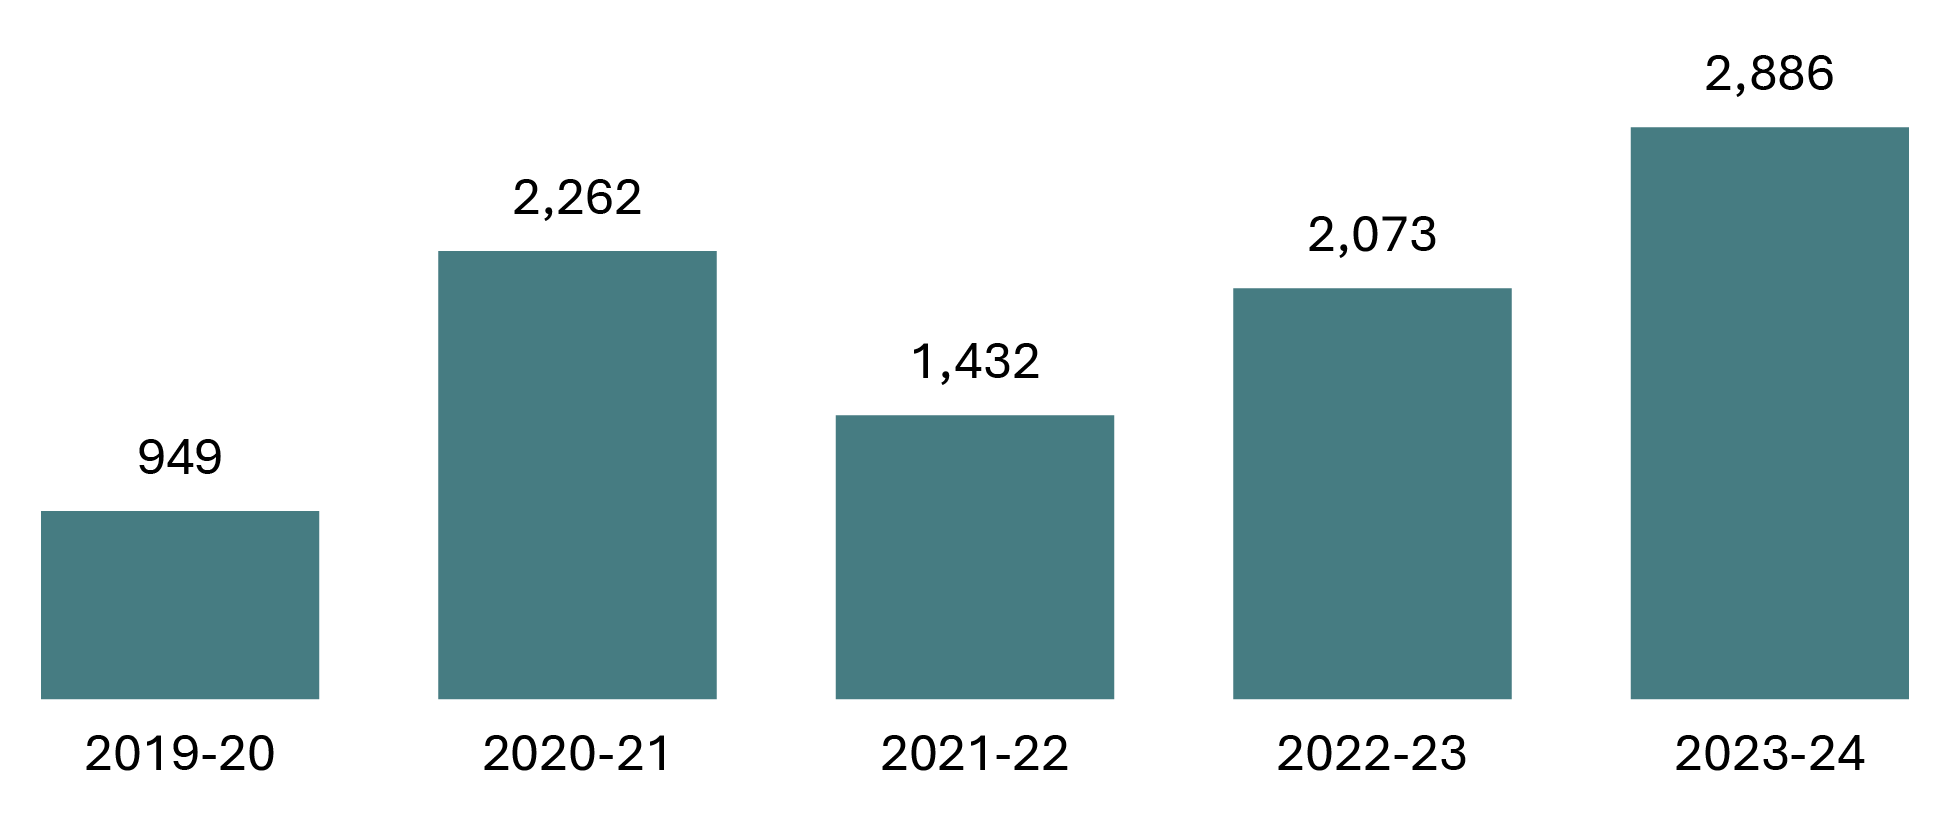
Image description
Bar graph showing the number of authorizations for transfer to Structured Intervention Units in federal institutions over a five year period from fiscal year 2019-20 to 2023-24. The number of transfers to Structured Intervention Units are greatest in fiscal years 2020-21 and 2023-24. The fewest number of transfers occurred in fiscal year 2019-20. Full data are available in the table below.
Source: Correctional Service of Canada.
- The number of authorizations for transfer to Structured Intervention Units in federal institutions has fluctuated over the past 5 fiscal years.
- In fiscal year 2023-24, there were 2,886 authorizations for transfer to a Structured Intervention Unit, which is a 39.2% increase (from 2,073 to 2,886) compared to the previous fiscal year.
| Fiscal year | Total |
|---|---|
| 2019-20 | 949 |
| 2020-21 | 2,262 |
| 2021-22 | 1,432 |
| 2022-23 | 2,073 |
| 2023-24 | 2,886 |
Source: Correctional Service of Canada.
Table C22 Notes
Structured Intervention Units (SIUs) are used when inmates cannot be managed safely within a mainstream inmate population. In SIUs, inmates receive targeted interventions, programs and healthcare with the goal of returning to a mainstream inmate population as soon as possible.
The result represents authorizations for transfer to a Structured Intervention Unit (SIU) where the start date was between the implementation on November 30, 2019 and March 31, 2024.
Authorizations for transfer to an SIU include all inmates who were transferred in, even if attempts to transfer them out were unsuccessful. A single transfer into an SIU may involve multiple subsequent attempts to transfer out.
The decision to transfer an inmate to an SIU is a decision made by CSC staff, not a request initiated by the offender. A designated staff member may authorize such a transfer only if criteria outlined in CCRA section 29.01(1) and section 34(1) is met. As per CCRA 34(2), CSC maintains a record of every instance in which an inmate is authorized to be transferred into an SIU.
Reported year periods reflect fiscal years. A fiscal year runs from April 1 to March 31 of the following year.
Percentage of successful transfers out of Structured Intervention Units in federal institutions
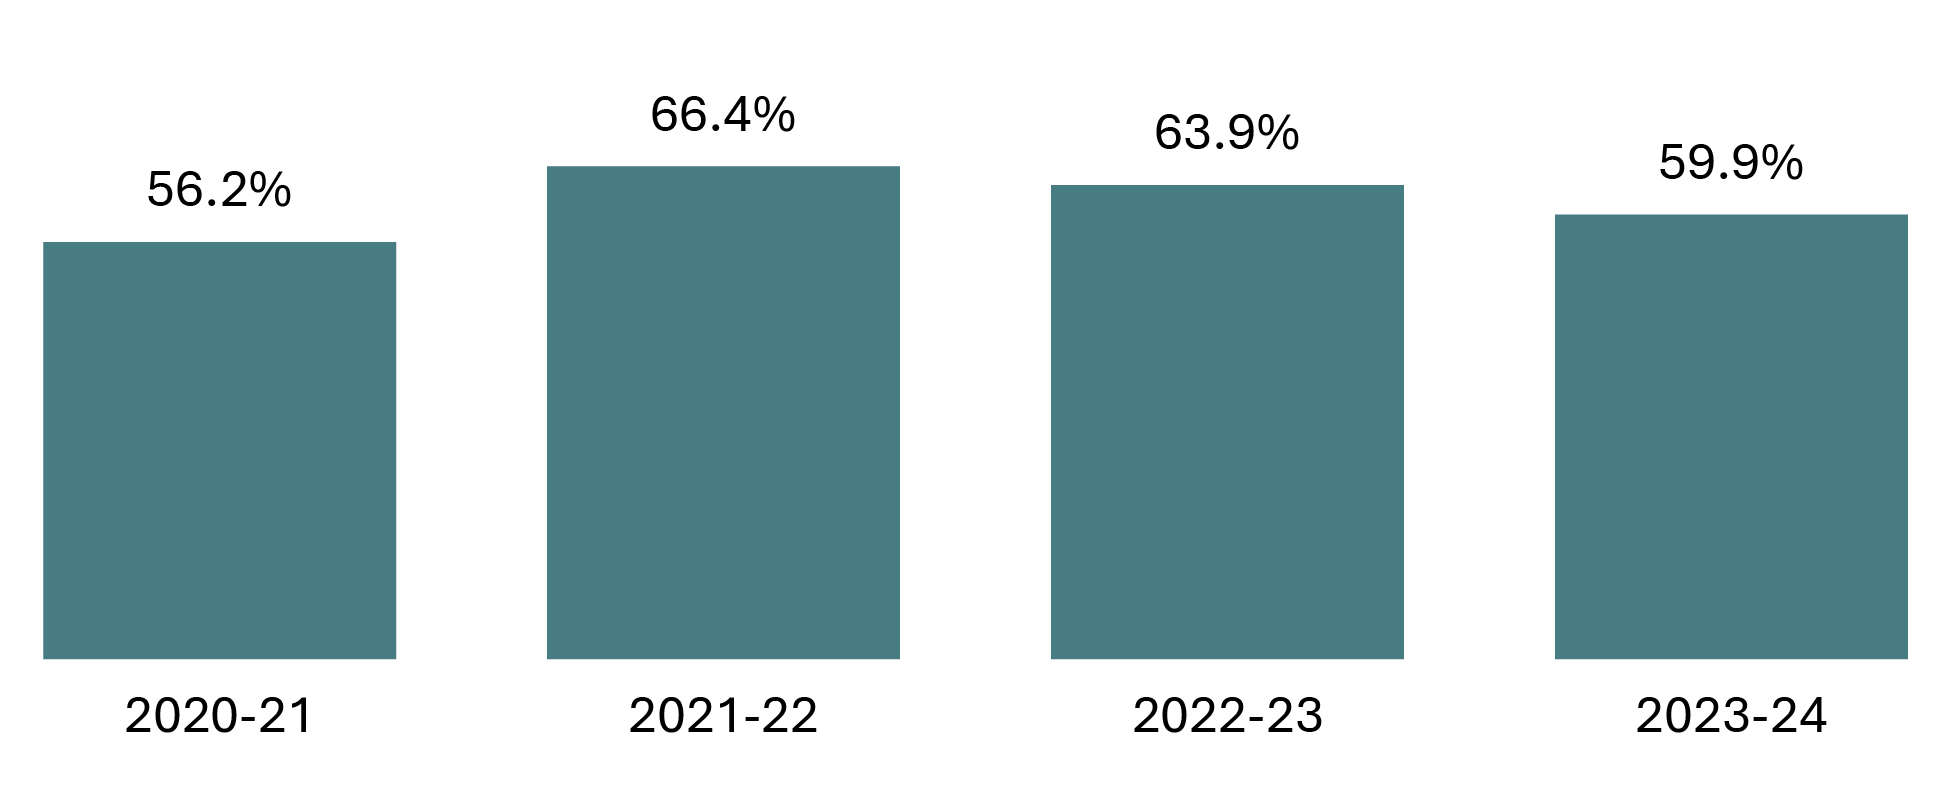
Image description
Bar graph showing the percentage of successful transfers out of Structured Intervention Units over a four year period from fiscal year 2020-21 to 2023-24. The percentage of successful transfers remained relatively stable over the four-year period. Full data are available in the table below.
Source: Correctional Service of Canada.
- Of the 2,704 transfers out of a Structured Intervention Unit in 2023-24, 59.9% were successful.
| Fiscal year | Successful transfer count | % | Unsuccessful transfer count | % | Total transfer count | % |
|---|---|---|---|---|---|---|
| 2020-21 | 1,286 | 56.2 | 1,004 | 43.8 | 2,290 | 100.0 |
| 2021-22 | 1,150 | 66.4 | 582 | 33.6 | 1,732 | 100.0 |
| 2022-23 | 1,088 | 63.9 | 615 | 36.1 | 1,703 | 100.0 |
| 2023-24 | 1,620 | 59.9 | 1,084 | 40.1 | 2,704 | 100.0 |
Source: Correctional Service of Canada.
Table C23 Notes
Structured Intervention Units (SIUs) are used when inmates cannot be managed safely within a mainstream inmate population. In SIUs, inmates receive targeted interventions, programs and healthcare with the goal of returning to a mainstream inmate population as soon as possible.
A transfer out of Structured Intervention Units is successful if the inmate remains in mainstream population for a period of 120 days.
Reported year periods reflect a fiscal year. A fiscal year runs from April 1 to March 31 of the following year.
Structured Intervention Units: Time Outside of Cell
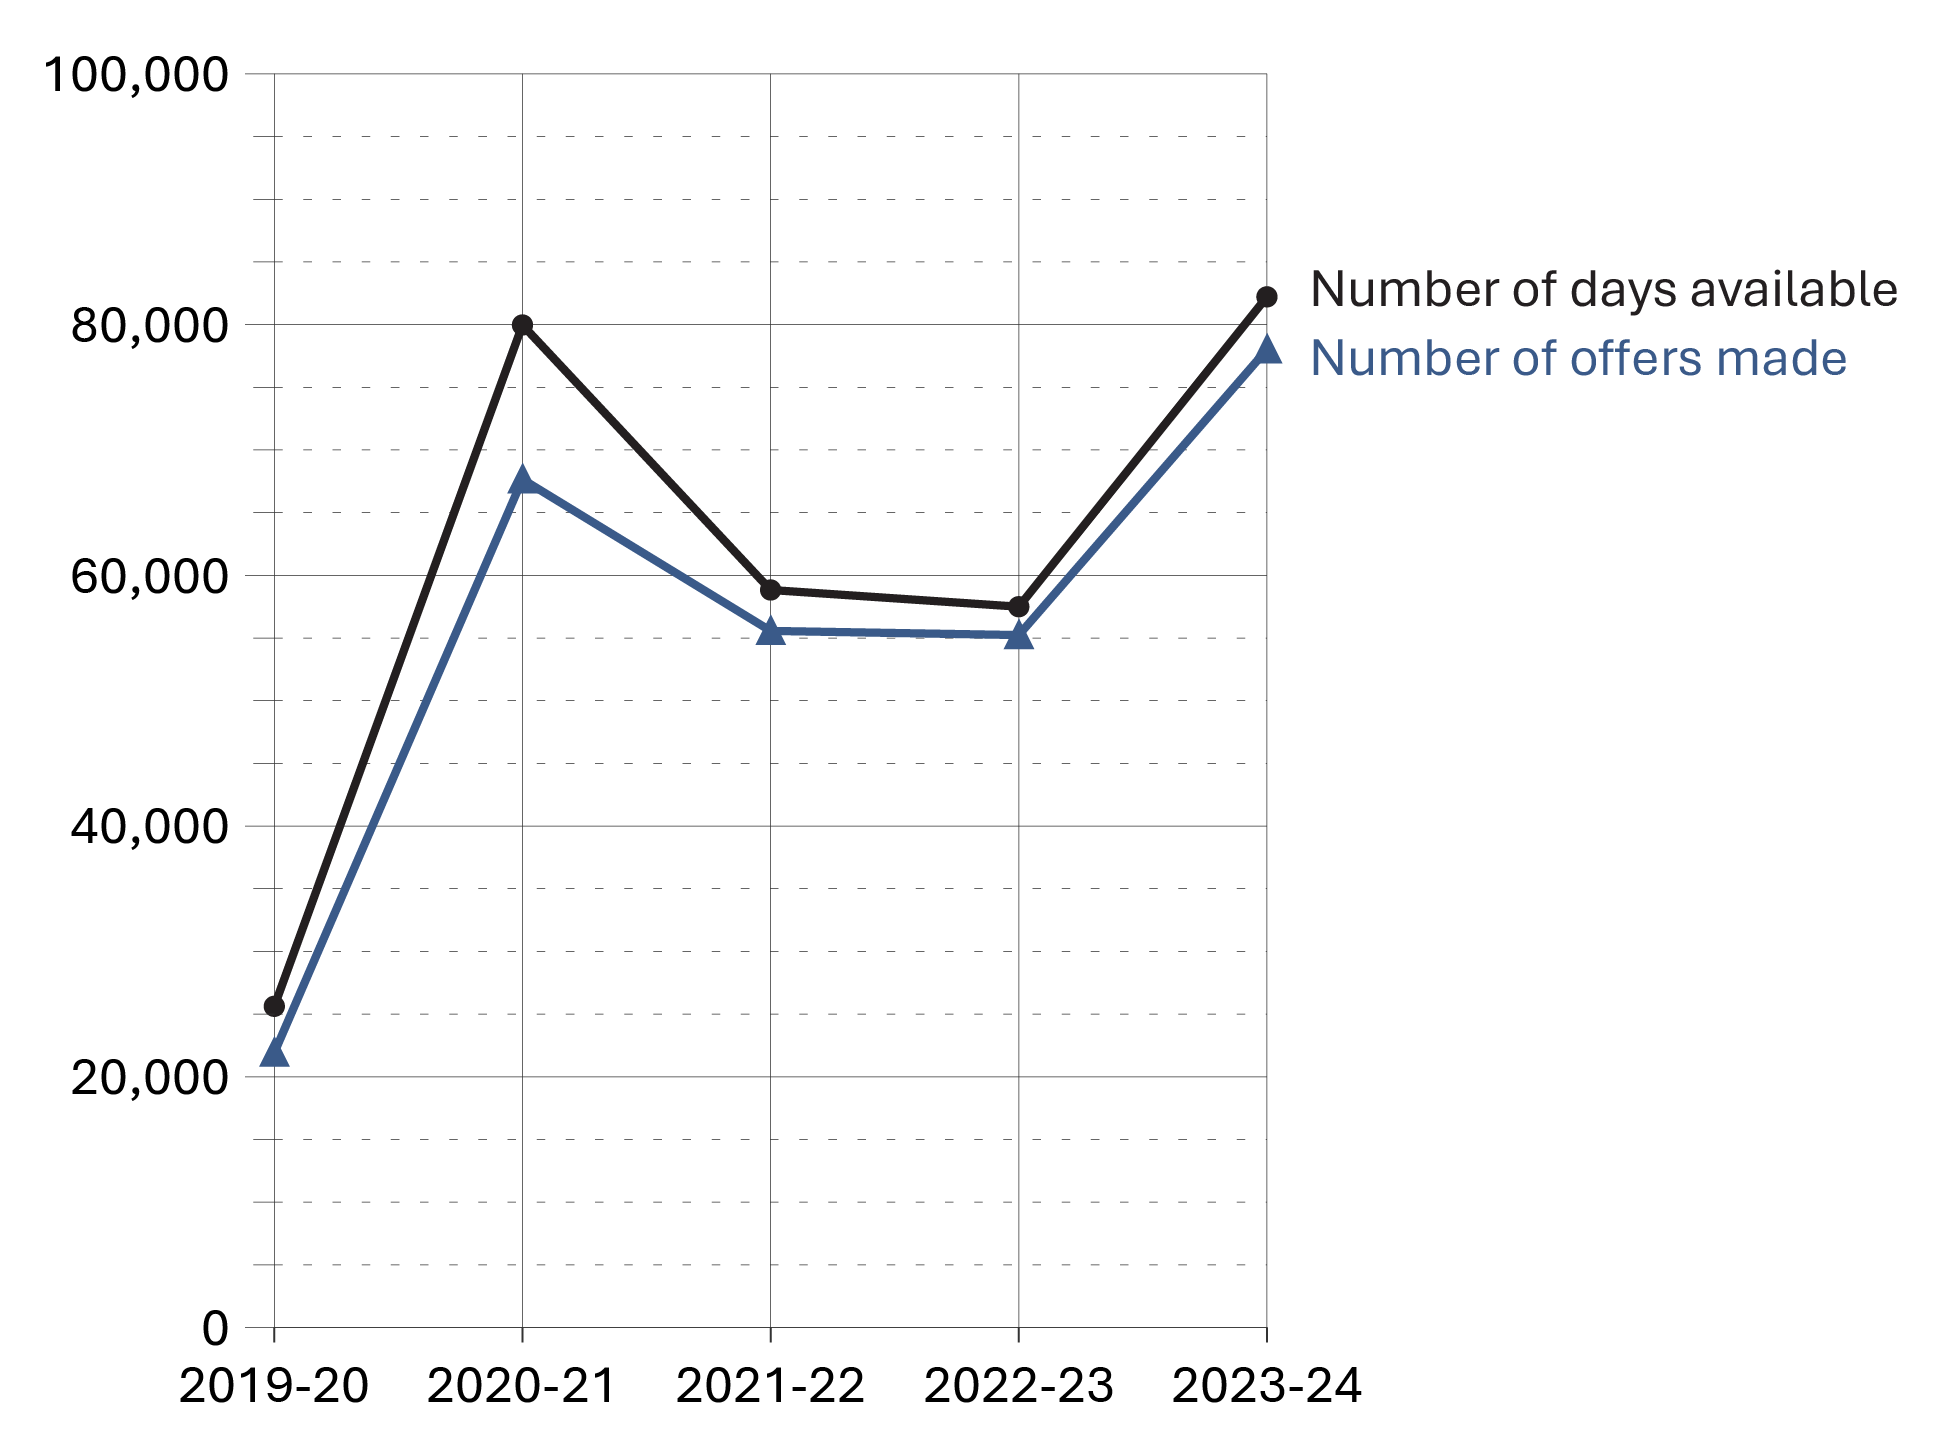
Image description
The line graph illustrates trends over a five-year period (fiscal years 2019–20 to 2023–24) in the number of days offenders housed in Structured Intervention Units were offered time out of their cells. It shows both the total number of days this opportunity was available and the number of offers made. There were peaks in both the number of days available and number of offers made in fiscal years 2020-21 and 2023-24. Full data are available in the table below.
Source: Correctional Service of Canada.
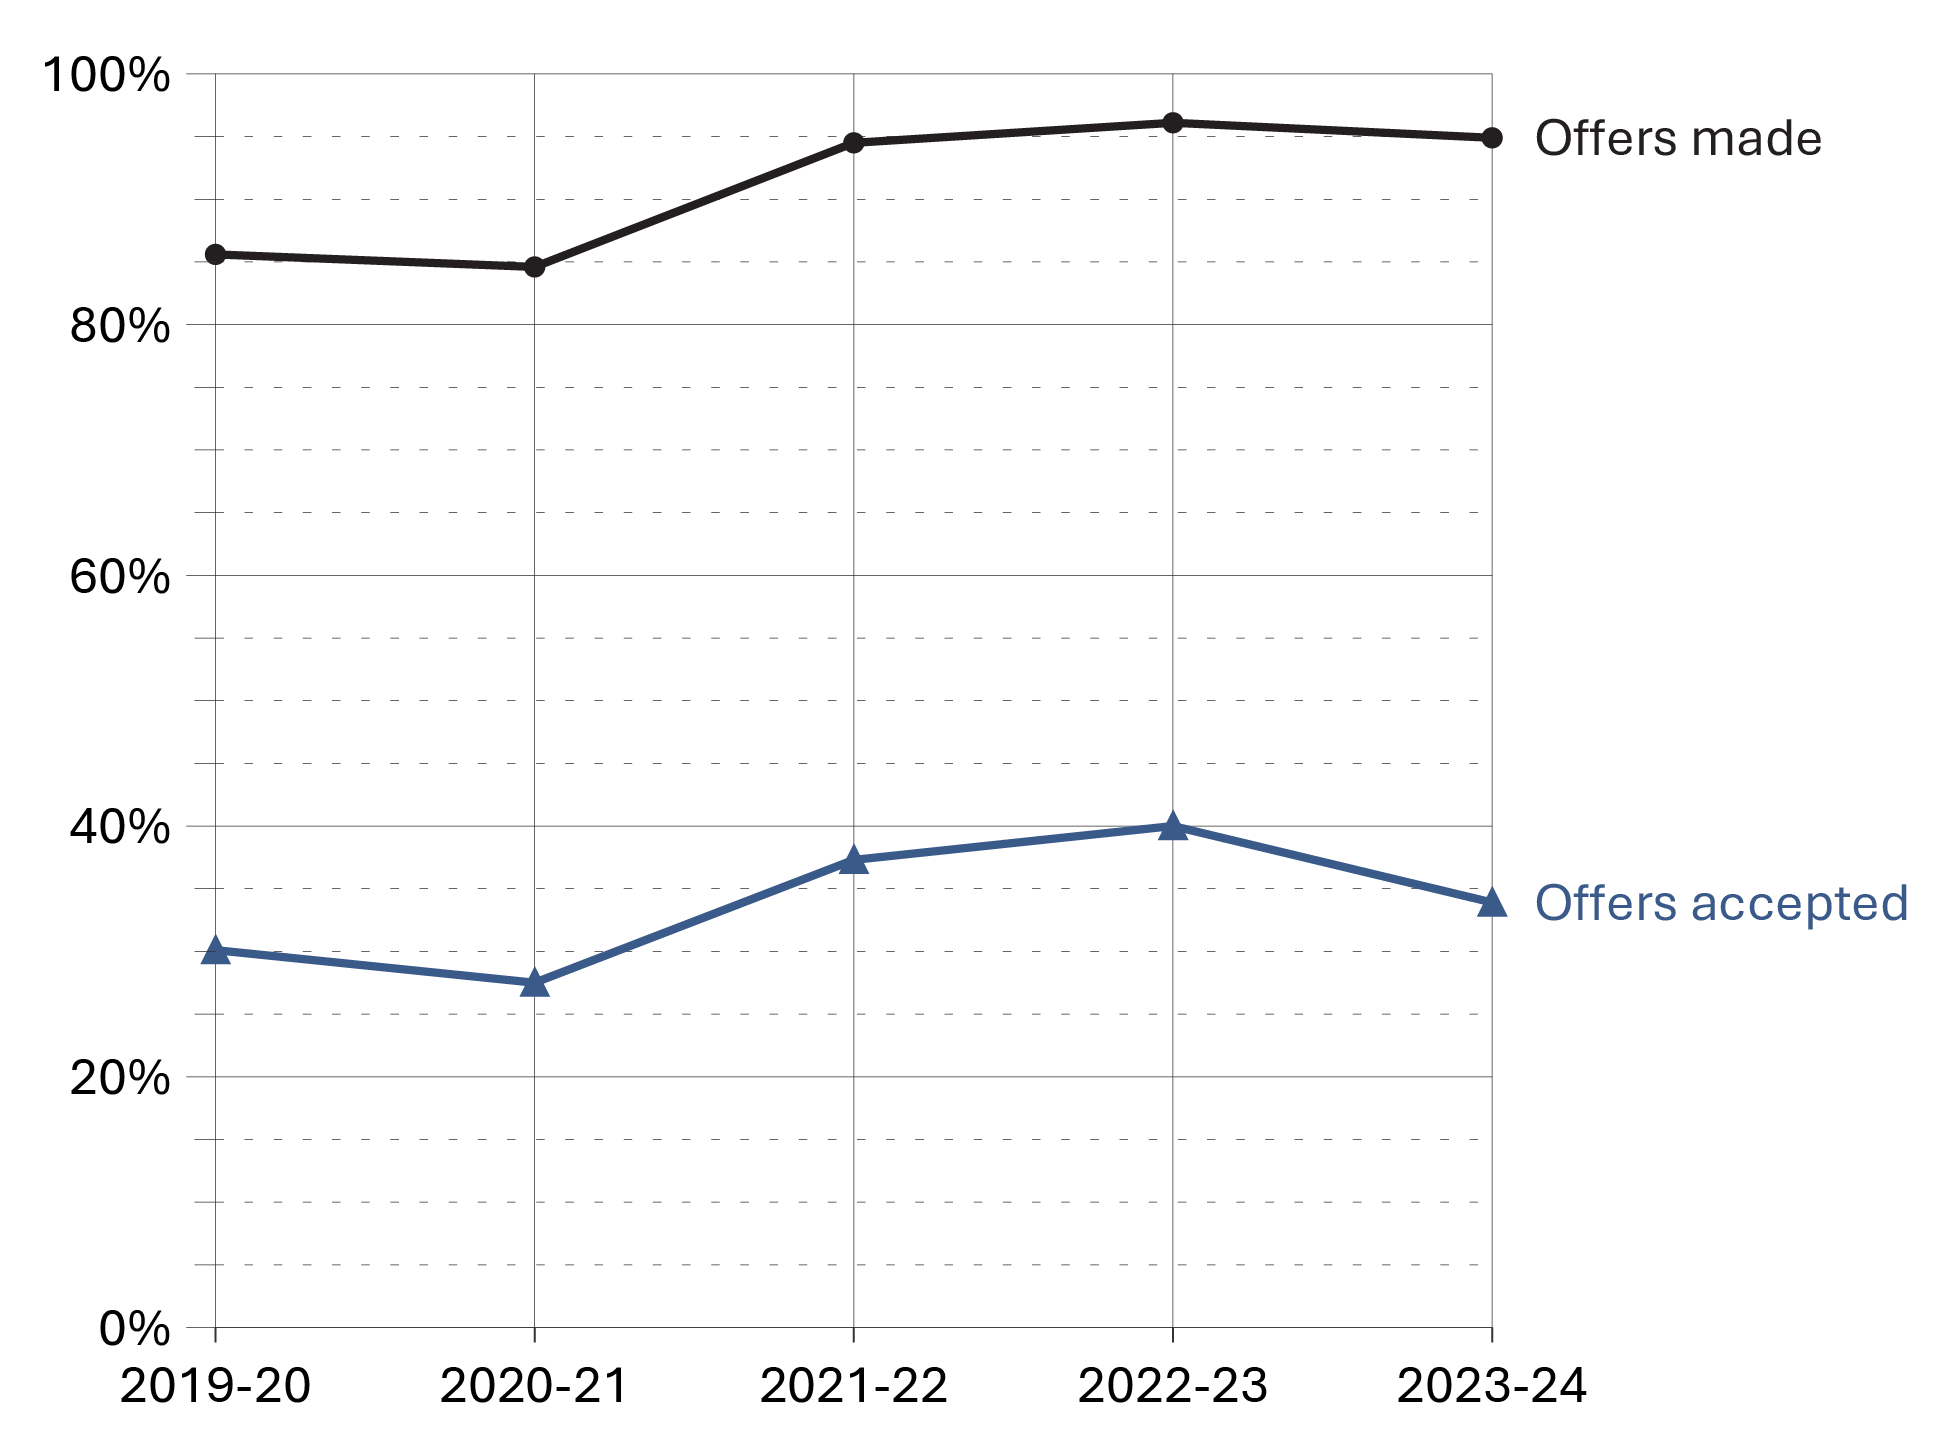
Image description
Line graph showing the proportion of offers accepted by offenders housed in Structured Intervention Units for time out of their cell. Between fiscal year 2019-20 to 2023-24, more offenders were offered time out of their cell than were accepted. Full data are available in the table below.
Source: Correctional Service of Canada.
- In 2023-24, the offenders were offered time out of their cell 94.9% of days where they were available in SIU; 33.9% of those offers were accepted.
| Fiscal Year | Days Available | Offers Made | % | Offers Accepted | % |
|---|---|---|---|---|---|
| 2019-20 | 25,619 | 21,919 | 85.6 | 6,588 | 30.1 |
| 2020-21 | 79,970 | 67,661 | 84.6 | 18,609 | 27.5 |
| 2021-22 | 58,831 | 55,566 | 94.5 | 20,742 | 37.3 |
| 2022-23 | 57,496 | 55,234 | 96.1 | 22,094 | 40.0 |
| 2023-24 | 82,215 | 78,019 | 94.9 | 26,411 | 33.9 |
Source: Correctional Service of Canada.
Table C24 Notes
Structured Intervention Units (SIUs) are used when inmates cannot be managed safely within a mainstream inmate population. In SIUs, inmates receive targeted interventions, programs and healthcare with the goal of returning to a mainstream inmate population as soon as possible.
The results represent the total number of days offenders housed in Structured Intervention Units were out of their cell per the total number of days offenders were available to be out of their cell (based on four hours out of cell per day).
The data is constrained to days where offenders were present in the Structured Intervention Unit for a minimum of four hours, with offers and accepted offers limited to those that occurred between 7am and 10pm.
Reported year periods reflect fiscal years. A fiscal year runs from April 1 to March 31 of the following year.
Structured Intervention Units: Duration of Stay
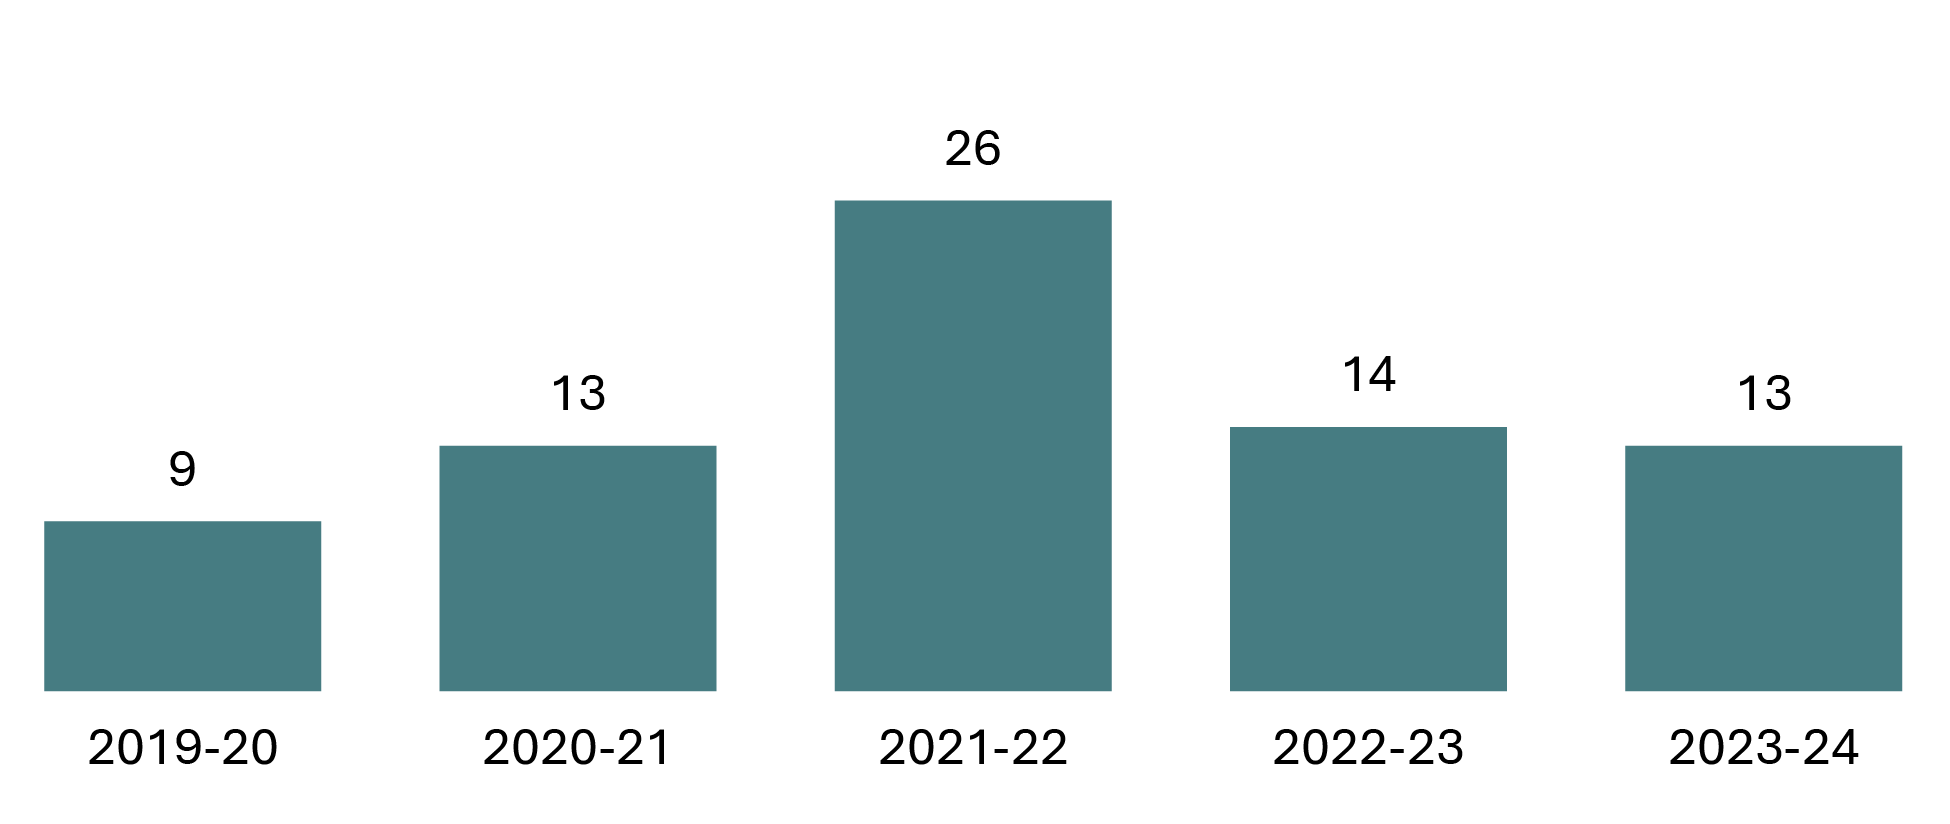
Image description
Bar graph showing the median number of days offenders spent in Structured Intervention Units over a five year period from fiscal year 2019-20 to 2023-24. The greatest number of days spent in Structured Intervention Units was in the 2021-22 fiscal year. Full data are available in the table below.
Source: Correctional Service of Canada.
- In 2023-24, the median number of days an offender spent in a Structured Intervention Unit per transfer was 13 days.
| Fiscal year | Median number of days |
|---|---|
| 2019-20 | 9 |
| 2020-21 | 13 |
| 2021-22 | 26 |
| 2022-23 | 14 |
| 2023-24 | 13 |
Source: Correctional Service of Canada.
Table C25 Notes
Structured Intervention Units (SIUs) are used when inmates cannot be managed safely within a mainstream inmate population. In SIUs, inmates receive targeted interventions, programs and healthcare with the goal of returning to a mainstream inmate population as soon as possible.
The result represents the median duration in days of the SIU stays that ended in each fiscal year, between the implementation on November 30, 2019 and March 31, 2024.
Reported year periods reflect fiscal years. A fiscal year runs from April 1 to March 31 of the following year.
Characteristics of Offenders in Structured Intervention Unit Cells by Indigenous and non-Indigenous
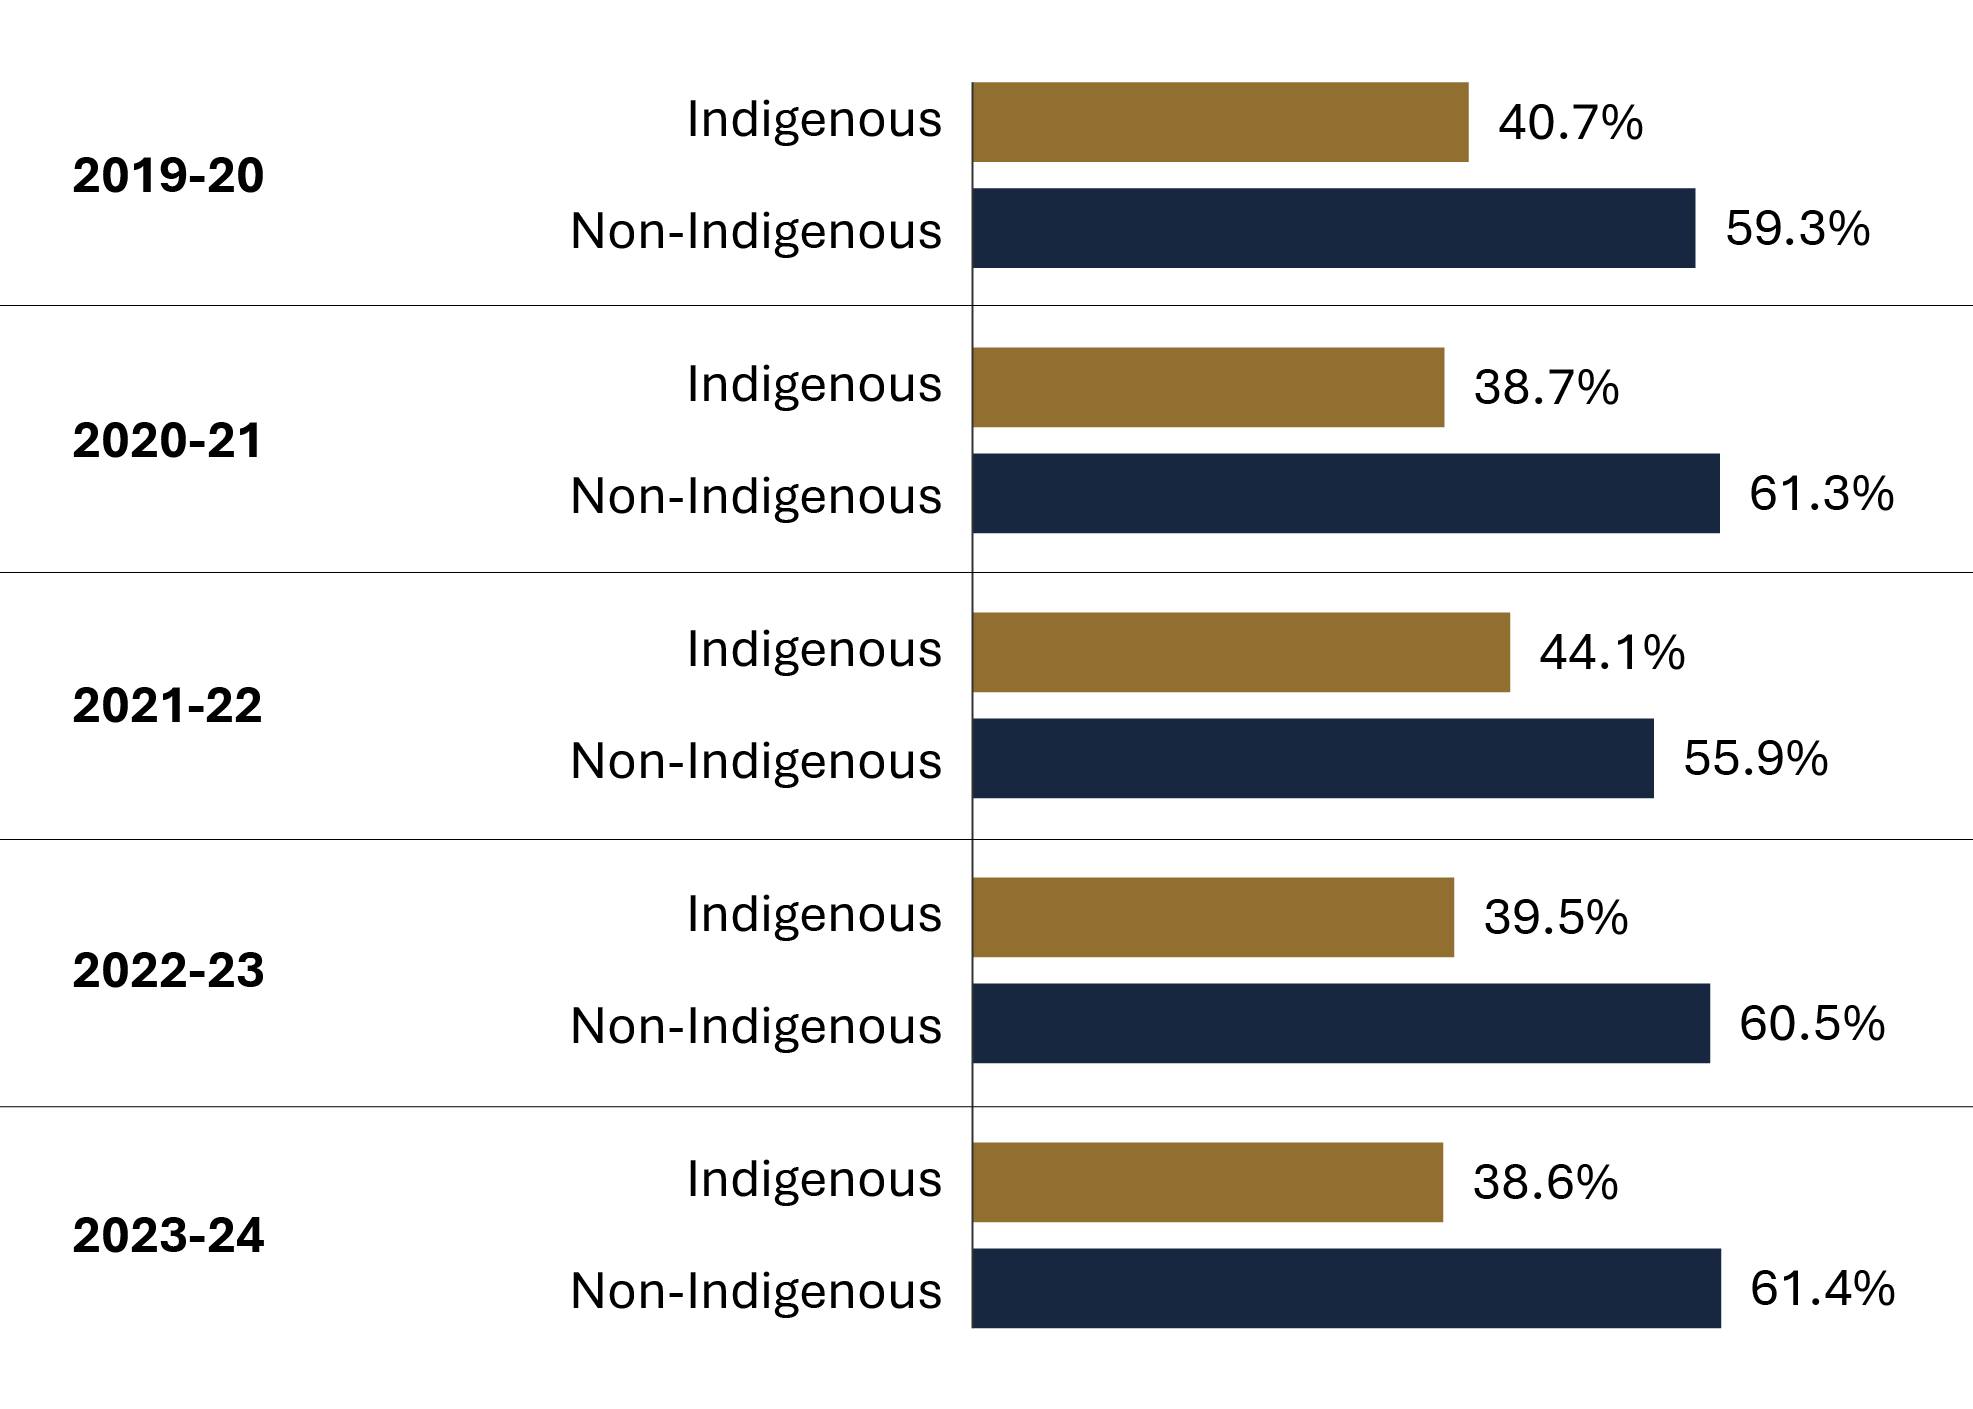
Image description
Bar graph showing the proportion of Indigenous and non-Indigenous offenders in Structured Intervention Unit cells over a five year period from fiscal year 2019-20 to 2023-24. A higher proportion of non-Indigenous offenders were housed in Structured Intervention Unit cells in each of the five fiscal years. Full data are available in the table below.
Source: Correctional Service of Canada.
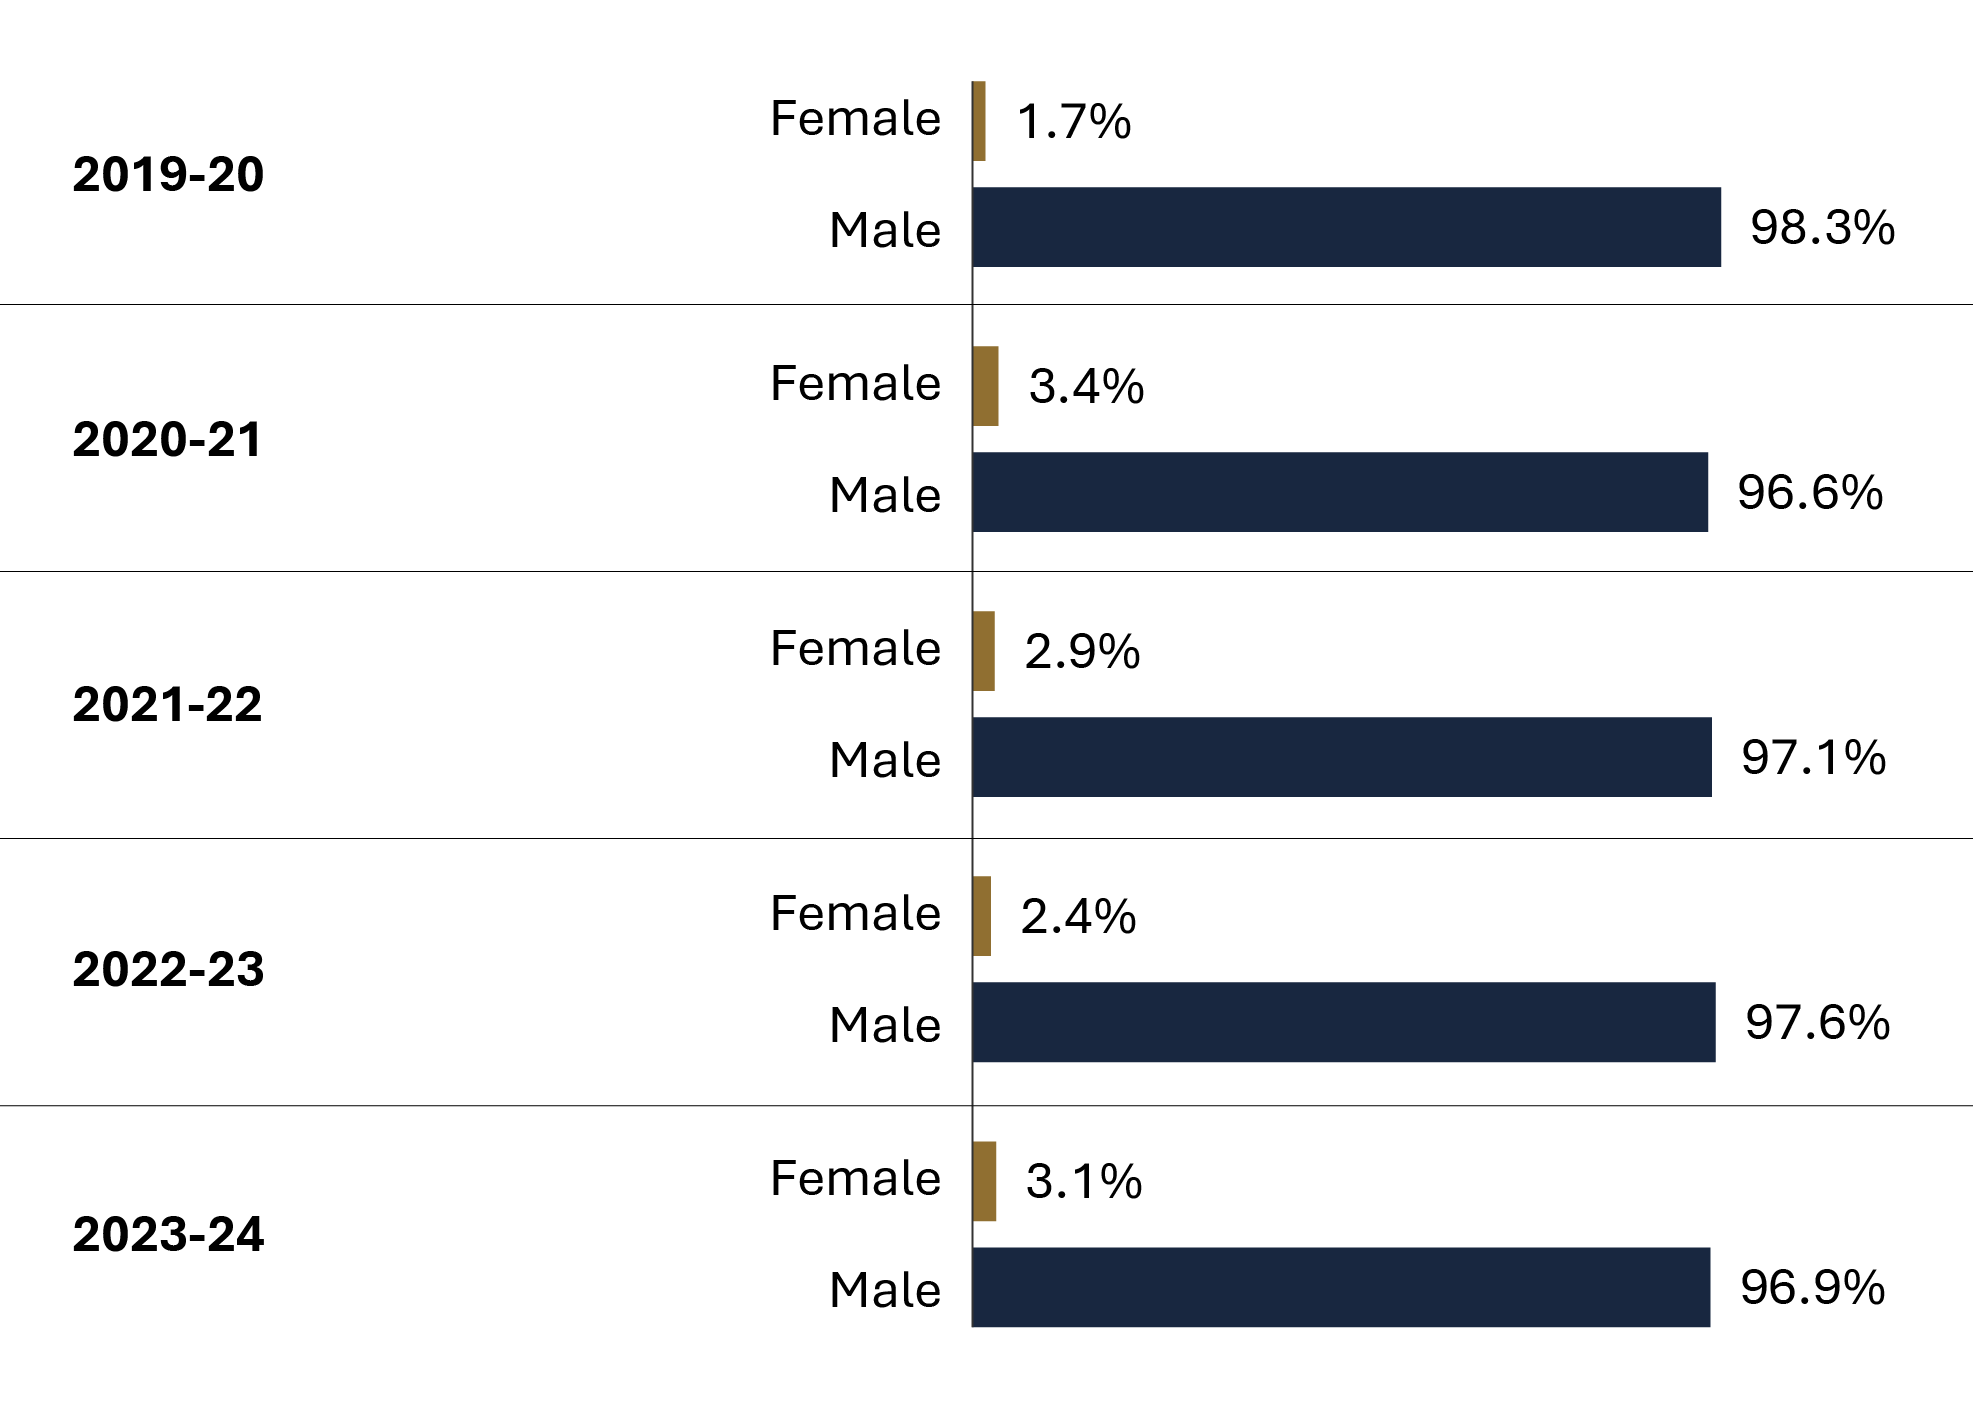
Image description
Bar graph showing the percentage of offenders in Structured Intervention Unit cells over the five year period from fiscal year 2019-20 to 2023-24, categorized by sex. The vast majority of offenders in Structured Intervention Units across all five fiscal years were male. Full data are available in the table below.
Source: Correctional Service of Canada.
- In 2023-24, 38.6% of the population in SIU were Indigenous. The majority of the population (96.9%) in 2023-24 was male.
| Fiscal year | Indigenous females | Indigenous males | Indigenous total | Non- Indigenous females | Non- Indigenous males | Non- Indigenous total |
|---|---|---|---|---|---|---|
| 2019-20 | 14 | 372 | 386 | 2 | 561 | 563 |
| 2020-21 | 58 | 817 | 875 | 18 | 1,369 | 1,387 |
| 2021-22 | 31 | 600 | 631 | 11 | 790 | 801 |
| 2022-23 | 45 | 774 | 819 | 5 | 1,249 | 1,254 |
| 2023-24 | 74 | 1,039 | 1,113 | 15 | 1,758 | 1,773 |
Source: Correctional Service of Canada.
| Fiscal year | Females | Males | Total |
|---|---|---|---|
| 2019-20 | 16 | 933 | 949 |
| 2020-21 | 76 | 2,186 | 2,262 |
| 2021-22 | 42 | 1,390 | 1,432 |
| 2022-23 | 50 | 2,023 | 2,073 |
| 2023-24 | 89 | 2,797 | 2,886 |
Source: Correctional Service of Canada.
Table C26 Notes
Structured Intervention Units (SIUs) are used when inmates cannot be managed safely within a mainstream inmate population. In SIUs, inmates receive targeted interventions, programs and healthcare with the goal of returning to a mainstream inmate population as soon as possible.
The result represents authorizations for transfer to a Structured Intervention Unit (SIU) where the start date was between the implementation on November 30, 2019 and March 31, 2024.
Note that the offenders themselves identify to which race they belong.
The sex corresponds to the biological sex of the offender entered in the Offender Management System at the date of extraction.
Reported year periods reflect fiscal years. A fiscal year runs from April 1 to March 31 of the following year.
Reasons for Transfer to Structured Intervention Units
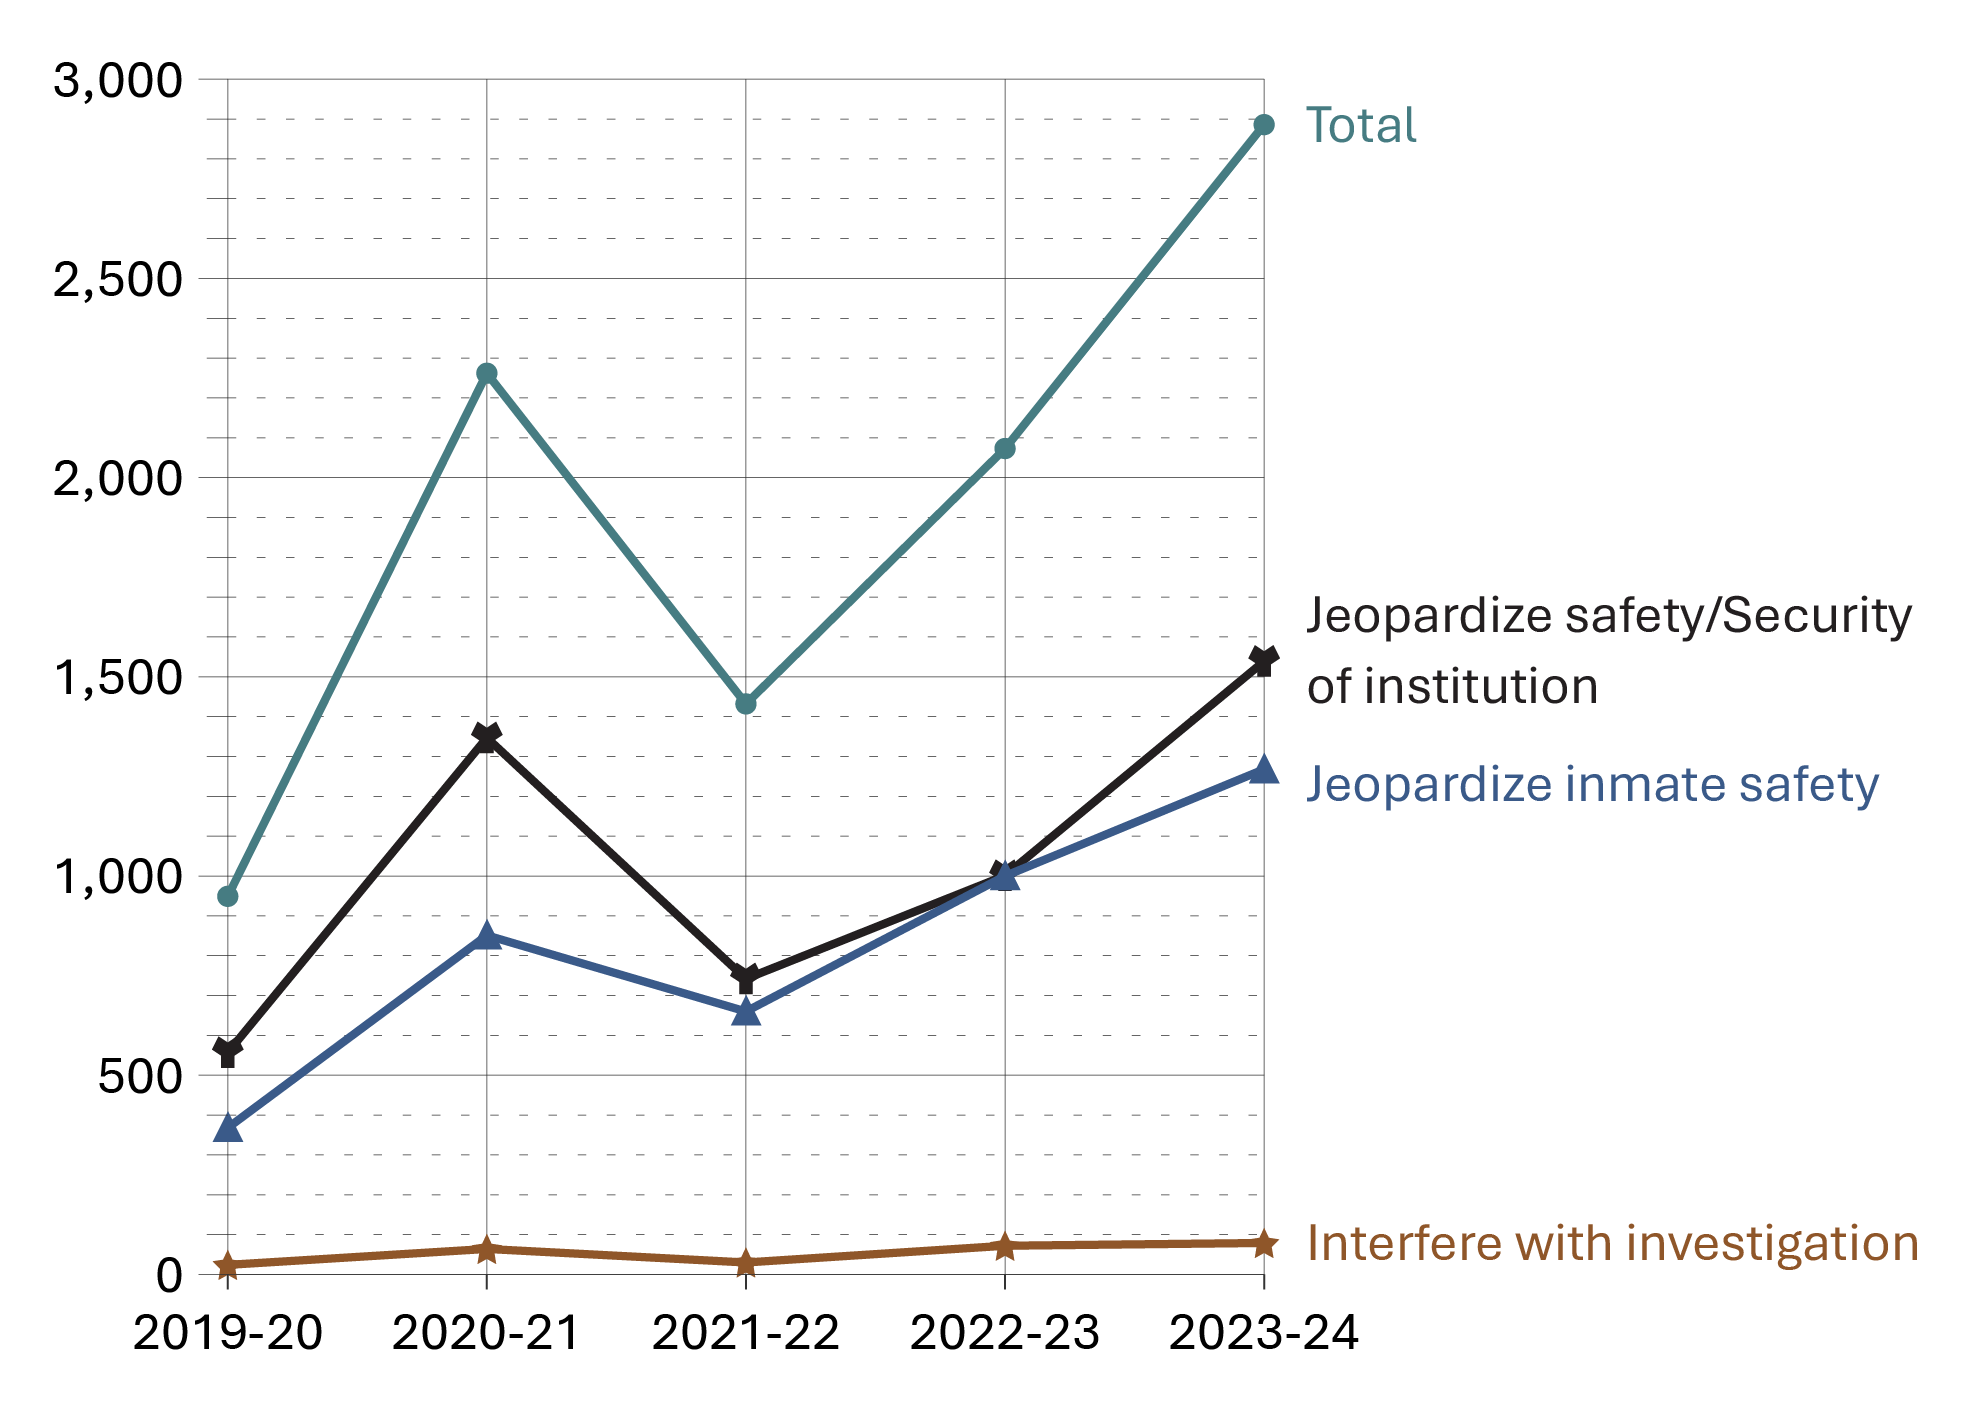
Image description
Line graph showing the reasons for transfers to Structured Intervention Units over a five year period from fiscal year 2019-20 to 2023-24. Reasons included are jeopardize safety/security of institution, jeopardize inmate safety, and interfere with an investigation. The total number of reasons is also shown. Since 2021-22, all reasons for transfers have steadily increased except interference with investigation. Full data are available in the table below.
Source: Correctional Service of Canada.
- In 2023-24, from the 2,886 transfers to SIU, 1,268 were completed under the reason of jeopardizing inmate safety (CCRA 34.1B), 1,539 under the reason of jeopardizing the safety/security of institution (CCRA 34.1A) and 79 under the reason of interfering with an investigation (CCRA 34.1C).
- Variations in SIU transfer authorizations during and after the COVID‑19 period may reflect broader impacts on the federal criminal justice system, as well as internal operational factors. For example, pandemic-related restrictions reduced inmate interactions in CSC institutions, with increases in SIU transfer authorizations observed as operations gradually returned to more typical activity levels. These explanations are provided as general context only and are not evidence‑based findings.
| Reasons for transfer | 2019-20 | 2020-21 | 2021-22 | 2022-23 | 2023-24 |
|---|---|---|---|---|---|
| CCRA 34.1A Jeopardize safety/security of institution | 557 | 1,347 | 742 | 1,001 | 1,539 |
| CCRA 34.1B Jeopardize inmate safety | 368 | 851 | 660 | 1,000 | 1,268 |
| CCRA 34.1C Interfere with an investigation | 24 | 64 | 30 | 72 | 79 |
| Total | 949 | 2,262 | 1,432 | 2,073 | 2,886 |
Source: Correctional Service of Canada.
Table C27 Notes
Structured Intervention Units (SIUs) are used when inmates cannot be managed safely within a mainstream inmate population. In SIUs, inmates receive targeted interventions, programs and healthcare with the goal of returning to a mainstream inmate population as soon as possible.
The result represents authorizations for transfer to a Structured Intervention Unit (SIU) where the start date was between the implementation on November 30, 2019 and March 31, 2024. The information is broken down to transfer presented in the Corrections and Conditional Release Act (CCRA).
CCRA 34.1A Jeopardize Safety/Security of Institution: the inmate has acted, has attempted to act or intends to act in a manner that jeopardizes the safety of any person or the security of a penitentiary and allowing the inmate to be in the mainstream inmate population would jeopardize the safety of any person or the security of the penitentiary.
CCRA 34.1B Jeopardize Inmate Safety: allowing the inmate to be in the mainstream inmate population would jeopardize the inmate's safety.
CCRA 34.1C Interfere with an Investigation: allowing the inmate to be in the mainstream inmate population would interfere with an investigation that could lead to a criminal charge or a charge under subsection 41(2) of a serious disciplinary offence.
Figures in this table represent SIU Authorizations to Transfer. They do not reflect the subsequent decision to approve or not approve an SIU transfer.
The 2019-20 data reflect only a five-month period at the inception of SIUs.
Reported year periods reflect fiscal years. A fiscal year runs from April 1 to March 31 of the following year.
Number of offender deaths while in custody: 10-year trend
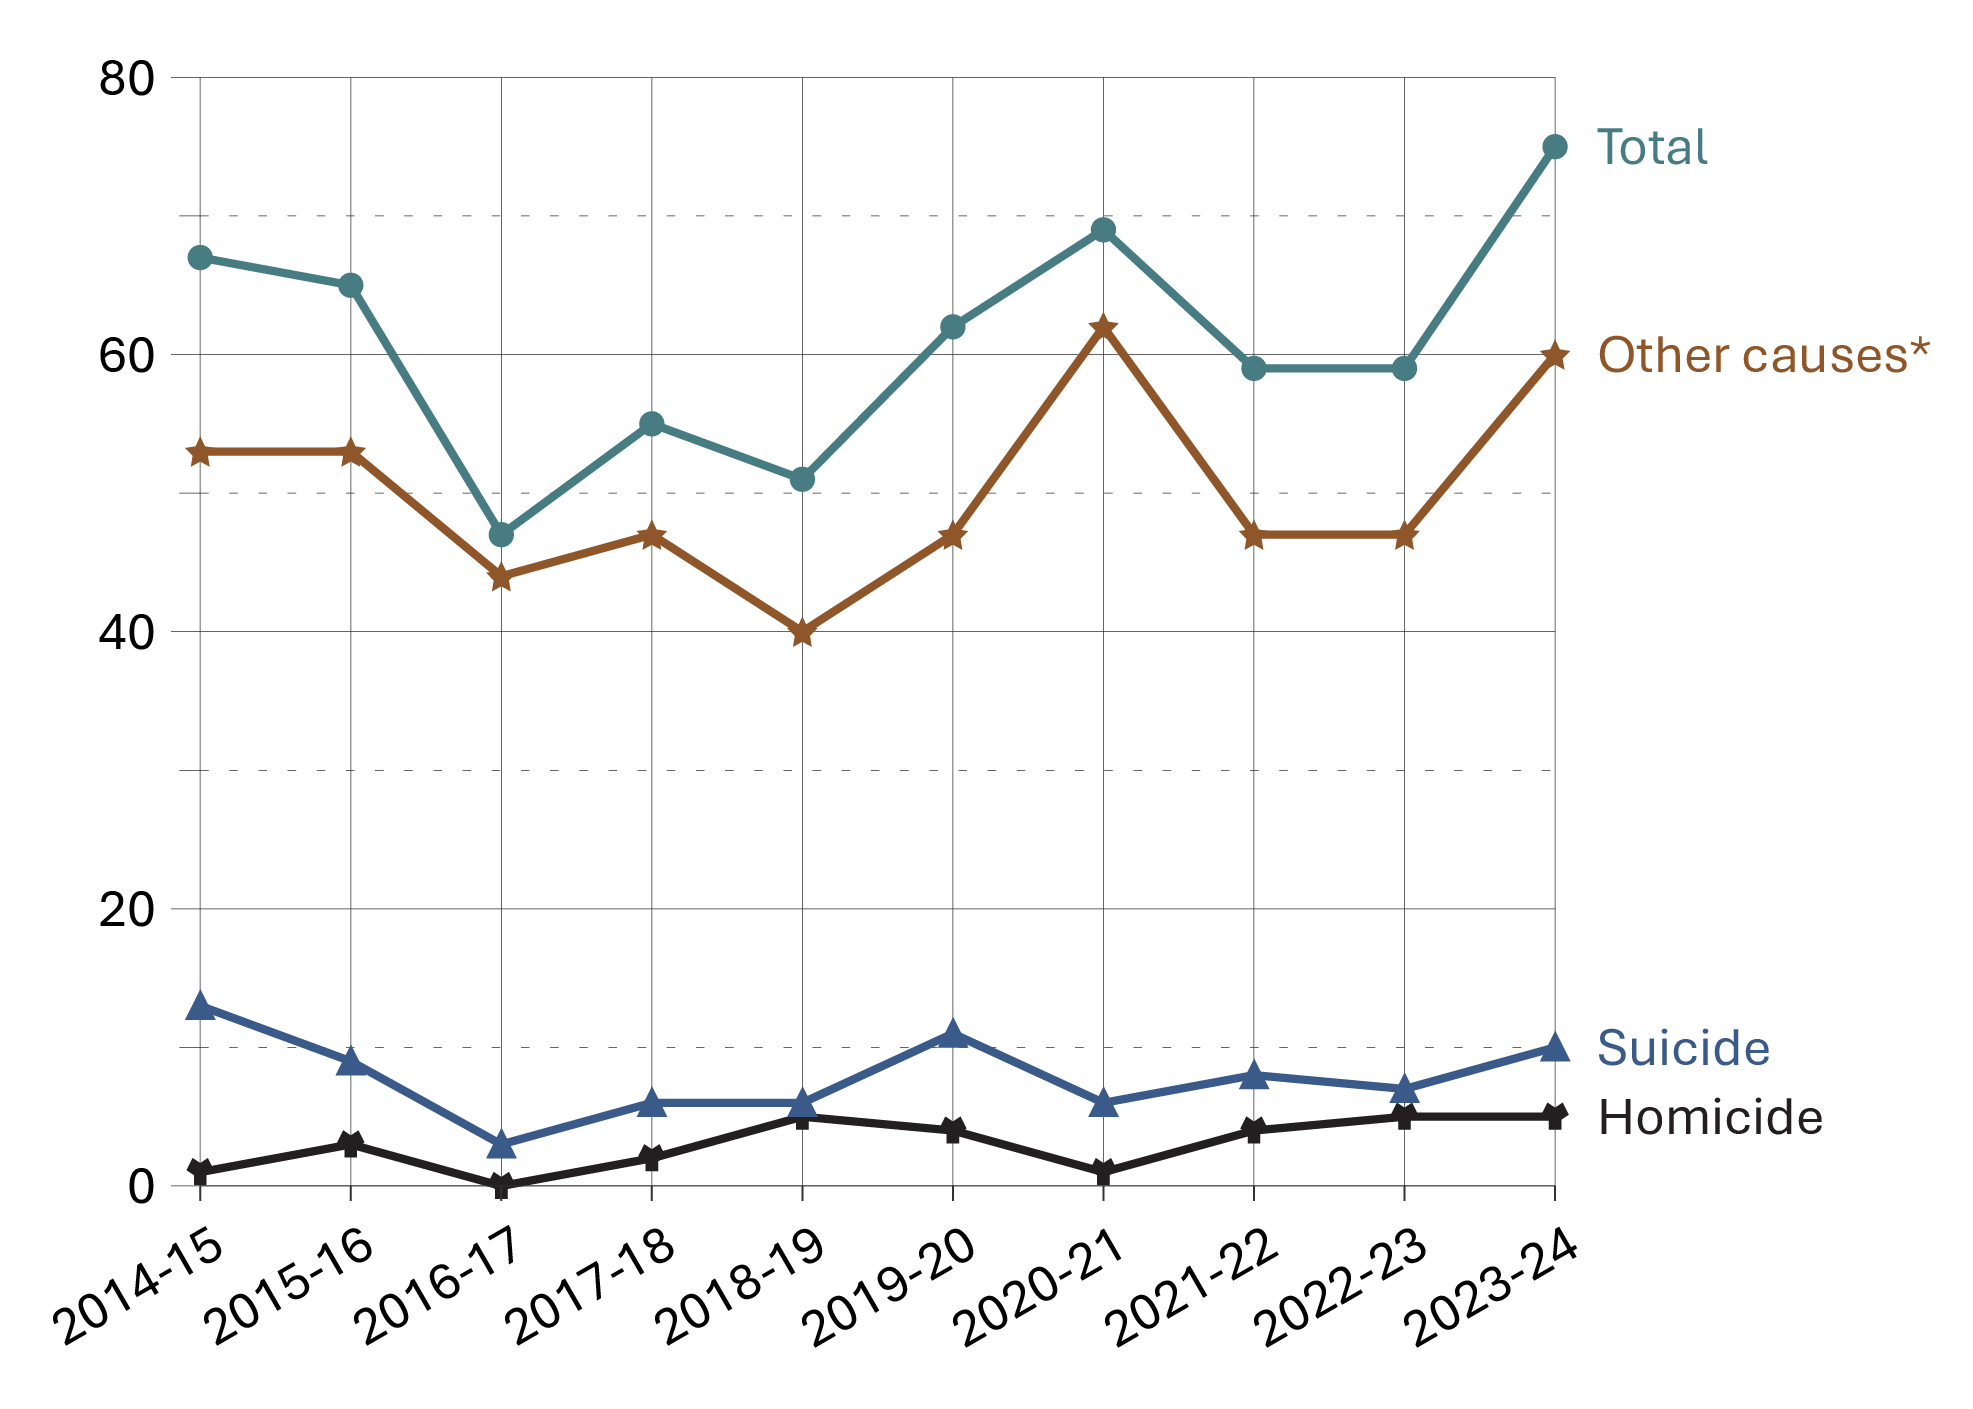
Image description
Line graph showing the number of offender deaths in federal custody by cause of death over a ten year period from fiscal year 2014-15 to 2023-24. The causes of death shown are suicide, homicide, and other causes. The total number of deaths is also shown. Across all fiscal years, homicide was the least common cause of death in federal custody, followed by suicide. Other causes of death, including death from natural causes, accidental deaths, death as a result of legal intervention, unknown cause of death, and other causes were most frequent in federal custody. Full data are available in the table below.
Source: Statistics Canada, Canadian Centre for Justice and Community Safety Statistics, Adult Correctional Services Survey.
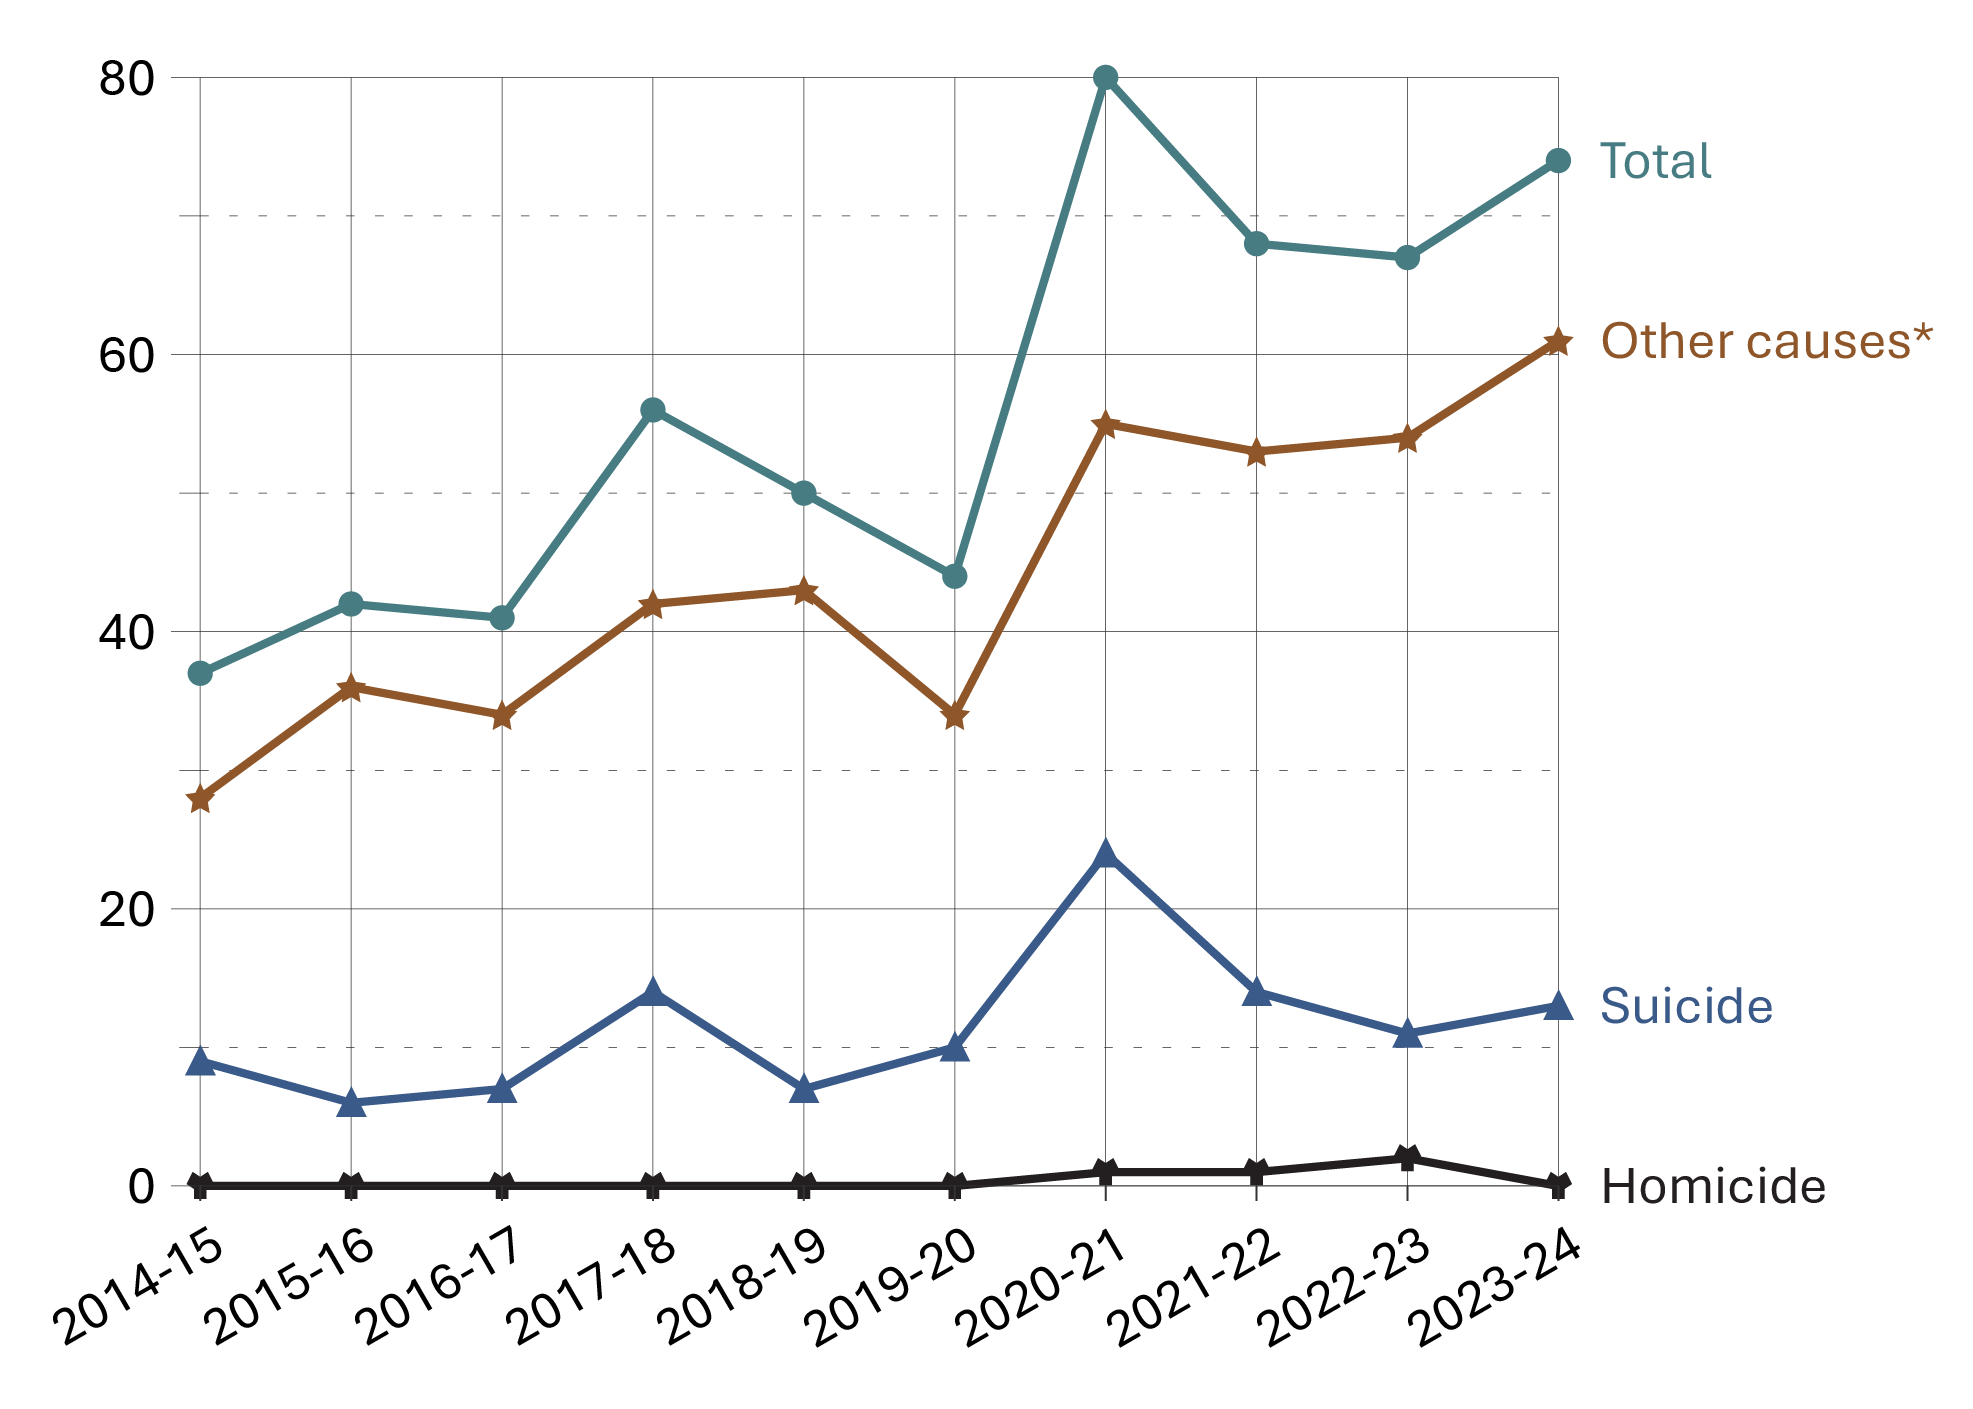
Image description
Line graph showing the number of offender deaths in provincial or territorial custody by cause of death over a ten year period from fiscal year 2014-15 to 2023-24. The causes of death shown are suicide, homicide, and other causes. The total number of deaths is also shown. Across all years, homicide is the least common cause of death in provincial or territorial custody. Other causes of death, including death from natural causes, accidental deaths, death as a result of legal intervention, unknown cause of death, and other causes were most frequent in provincial/territorial custody. Full data are available in the table below.
Source: Statistics Canada, Canadian Centre for Justice and Community Safety Statistics, Adult Correctional Services Survey.
- In the 10-year period from 2014-15 to 2023-24, a total of 609 federal offenders and 559 provincial/territorial offenders died while in custody. During this time period, suicides accounted for 13.0% of federal offender deaths and 20.6% of provincial offender deaths. The suicide rate was approximately 58 per 100,000 for incarcerated federal offenders, and approximately 49 per 100,000 for incarcerated provincial offenders.
- Between 2014-15 and 2023-24, 4.9% of federal offender deaths and 0.7% of provincial offender deaths were due to homicide. The homicide rate for incarcerated federal offenders was approximately 22 per 100,000 and 2 per 100,000 for incarcerated provincial offenders.
Figure C28 Notes
*Other causes of death includes death from natural causes, accidental deaths, death as a result of legal intervention, unknown cause of death, and other.
| Fiscal year | Homicide | % | Suicide | % | Other causesFootnote * | % | Total |
|---|---|---|---|---|---|---|---|
| Federal total | 30 | 4.9 | 79 | 13.0 | 500 | 82.1 | 609 |
| 2014-15 | 1 | 1.5 | 13 | 19.4 | 53 | 79.1 | 67 |
| 2015-16 | 3 | 4.6 | 9 | 13.8 | 53 | 81.5 | 65 |
| 2016-17 | 0 | 0.0 | 3 | 6.4 | 44 | 93.6 | 47 |
| 2017-18 | 2 | 3.6 | 6 | 10.9 | 47 | 85.5 | 55 |
| 2018-19 | 5 | 9.8 | 6 | 11.8 | 40 | 78.4 | 51 |
| 2019-20 | 4 | 6.5 | 11 | 17.7 | 47 | 75.8 | 62 |
| 2020-21 | 1 | 1.4 | 6 | 8.7 | 62 | 89.9 | 69 |
| 2021-22 | 4 | 6.8 | 8 | 13.6 | 47 | 79.7 | 59 |
| 2022-23 | 5 | 8.5 | 7 | 11.9 | 47 | 79.7 | 59 |
| 2023-24 | 5 | 6.7 | 10 | 13.3 | 60 | 80.0 | 75 |
| Provincial/territorial total | 4 | 0.7 | 115 | 20.6 | 440 | 78.7 | 559 |
| 2014-15 | 0 | 0.0 | 9 | 24.3 | 28 | 75.7 | 37 |
| 2015-16 | 0 | 0.0 | 6 | 14.3 | 36 | 85.7 | 42 |
| 2016-17 | 0 | 0.0 | 7 | 17.1 | 34 | 82.9 | 41 |
| 2017-18 | 0 | 0.0 | 14 | 25.0 | 42 | 75.0 | 56 |
| 2018-19 | 0 | 0.0 | 7 | 14.0 | 43 | 86.0 | 50 |
| 2019-20 | 0 | 0.0 | 10 | 22.7 | 34 | 77.3 | 44 |
| 2020-21 | 1 | 1.3 | 24 | 30.0 | 55 | 68.8 | 80 |
| 2021-22 | 1 | 1.5 | 14 | 20.6 | 53 | 77.9 | 68 |
| 2022-23 | 2 | 3.0 | 11 | 16.4 | 54 | 80.6 | 67 |
| 2023-24 | 0 | 0.0 | 13 | 17.6 | 61 | 82.4 | 74 |
| Total federal and provincial/ territorial offender deaths | 34 | 2.9 | 194 | 16.6 | 940 | 80.5 | 1,168 |
Source: Statistics Canada, Canadian Centre for Justice and Community Safety Statistics, Adult Correctional Services Survey.
Table C28 Notes
Number of escapees and escape incidents from federal institutions or Healing Lodges: 10-year trend
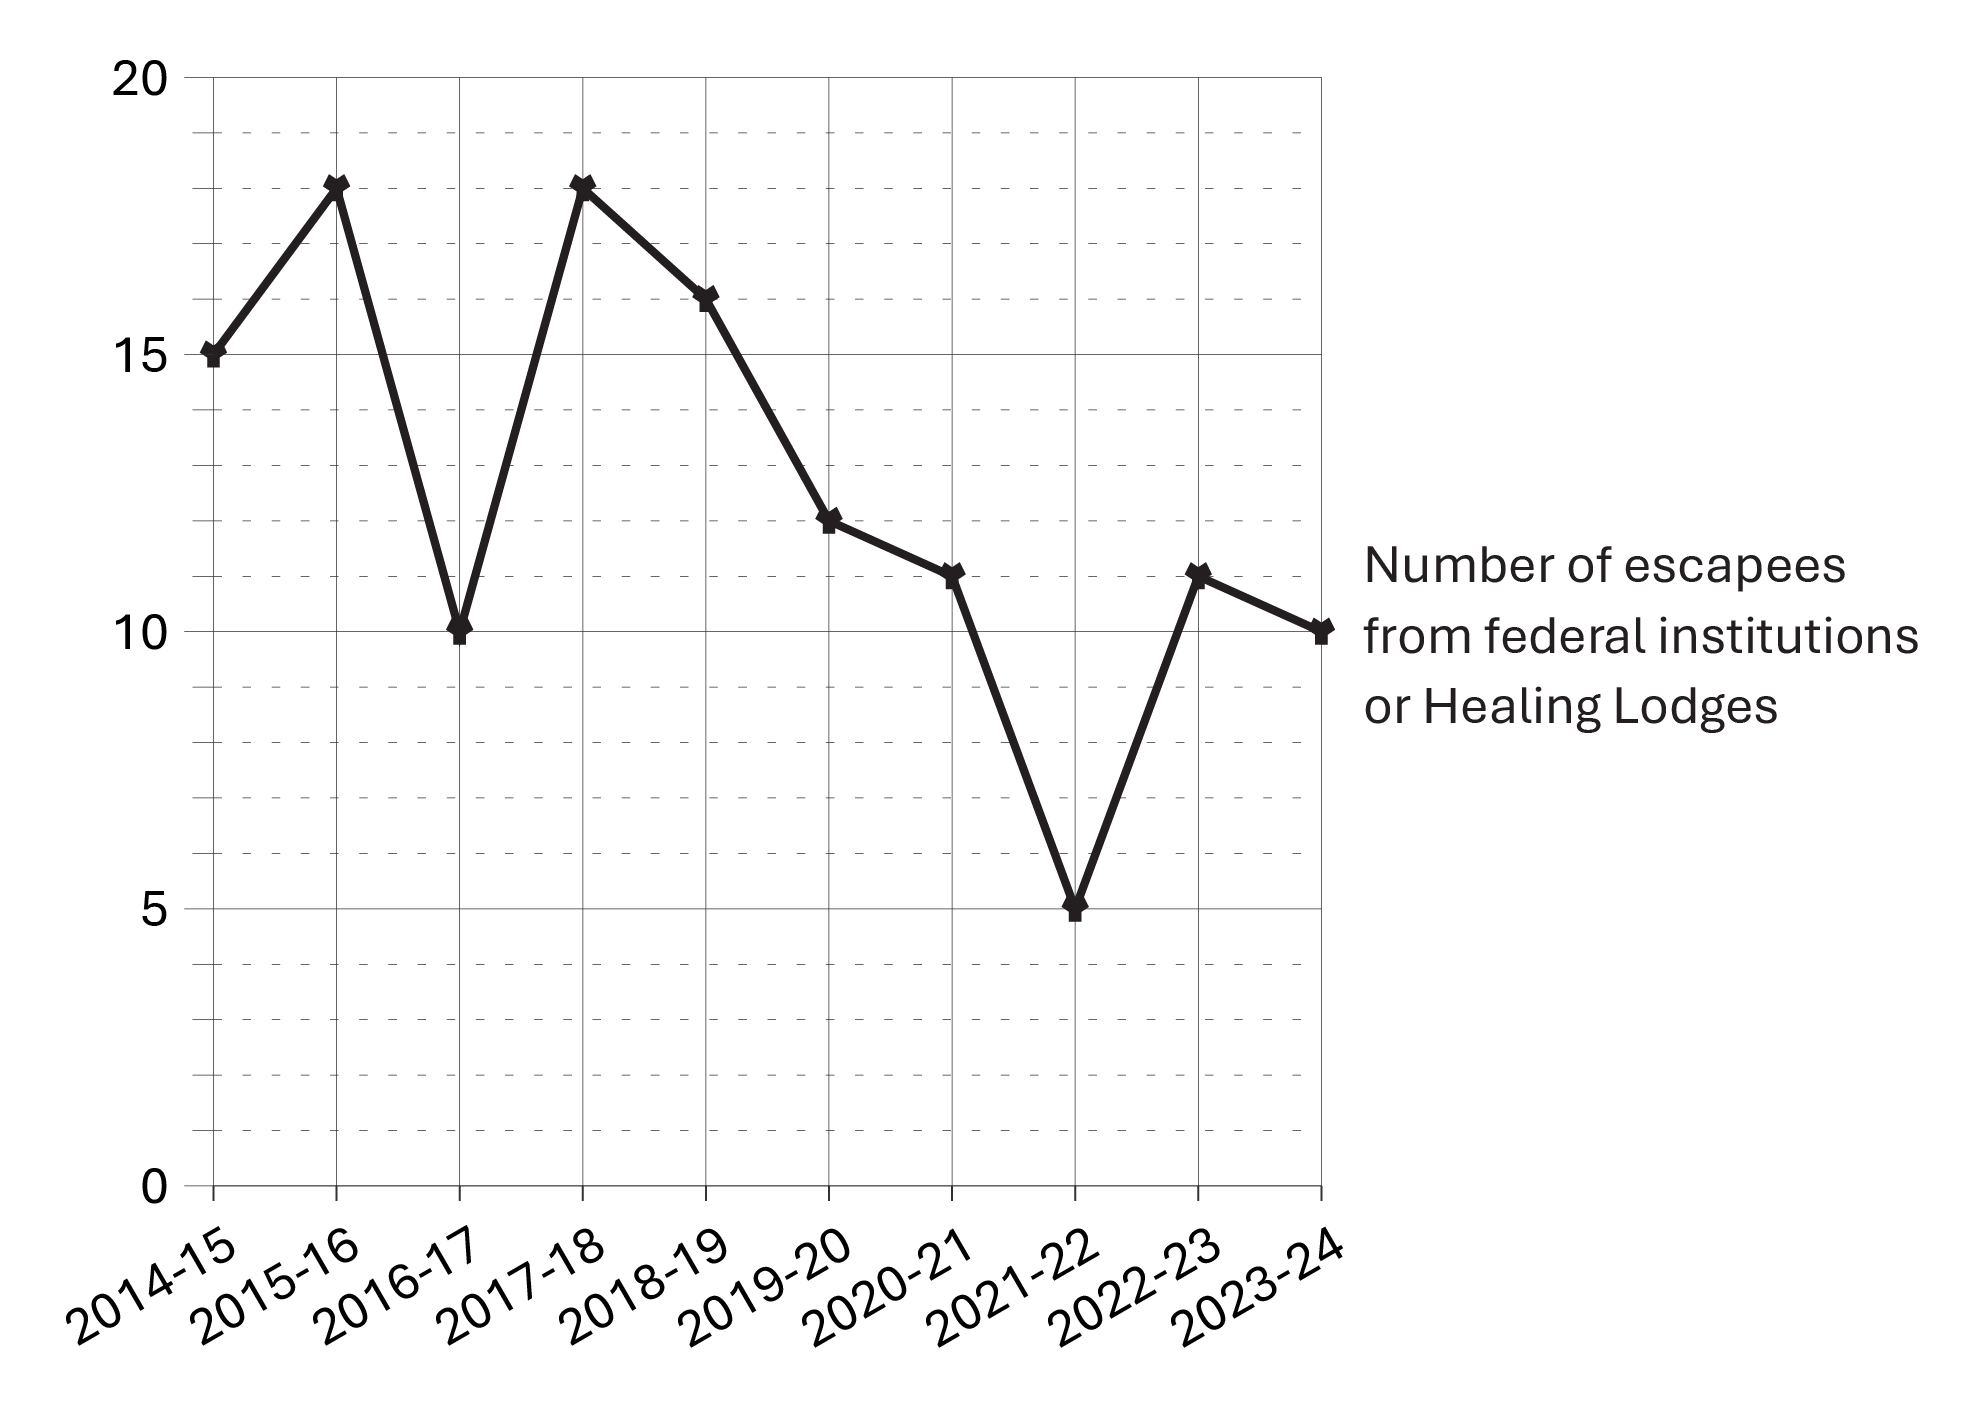
Image description
Line graph showing the number of escapees from federal institutions or healing lodges over a ten year period from 2014-15 to 2023-24. The number of escapees sharply declined between 2017-18 and 2021-22. While the number of escapees has increased between 2021-22 and 2023-24, levels have not returned to the peak seen in 2015-16. Full data are available in the table below.
Source: Correctional Service of Canada.
- In 2023-24, there were 9 escape incidents involving a total of 10 offenders. 8 of the 10 offenders were recaptured at the time of the extraction while 2 remained at large.
- Offenders who escaped from federal institutions or healing lodges in 2023-24 represented 0.07% of the in-custody population.
- Over the past 10 years, the number of escapees from federal institutions decreased 33.3% from 15 in 2014-15 to 10 in 2023-24.
| Fiscal year | Total number of escape incidents | Total number of escapees |
|---|---|---|
| 2014-15 | 14 | 15 |
| 2015-16 | 15 | 18 |
| 2016-17 | 10 | 10 |
| 2017-18 | 13 | 18 |
| 2018-19 | 15 | 16 |
| 2019-20 | 10 | 12 |
| 2020-21 | 11 | 11 |
| 2021-22 | 5 | 5 |
| 2022-23 | 10 | 11 |
| 2023-24 | 9 | 10 |
| Total | 112 | 126 |
Source: Correctional Service of Canada.
Table C29 Notes
An escape incident refers to any act or attempted act to breach (break) prison, escape from lawful custody, or without lawful excuse be at large before the expiration of a term of imprisonment to which that person has been sentenced.
The data represent the number of escape incidents from federal facilities or Healing Lodges during each fiscal year. An escape can involve more than 1 offender.
These numbers are subject to change further to new information becoming available.
Reported year periods reflect fiscal years. A fiscal year runs from April 1 to March 31 of the following year.
CSC offenders in community under supervision by sex: 10-year trend
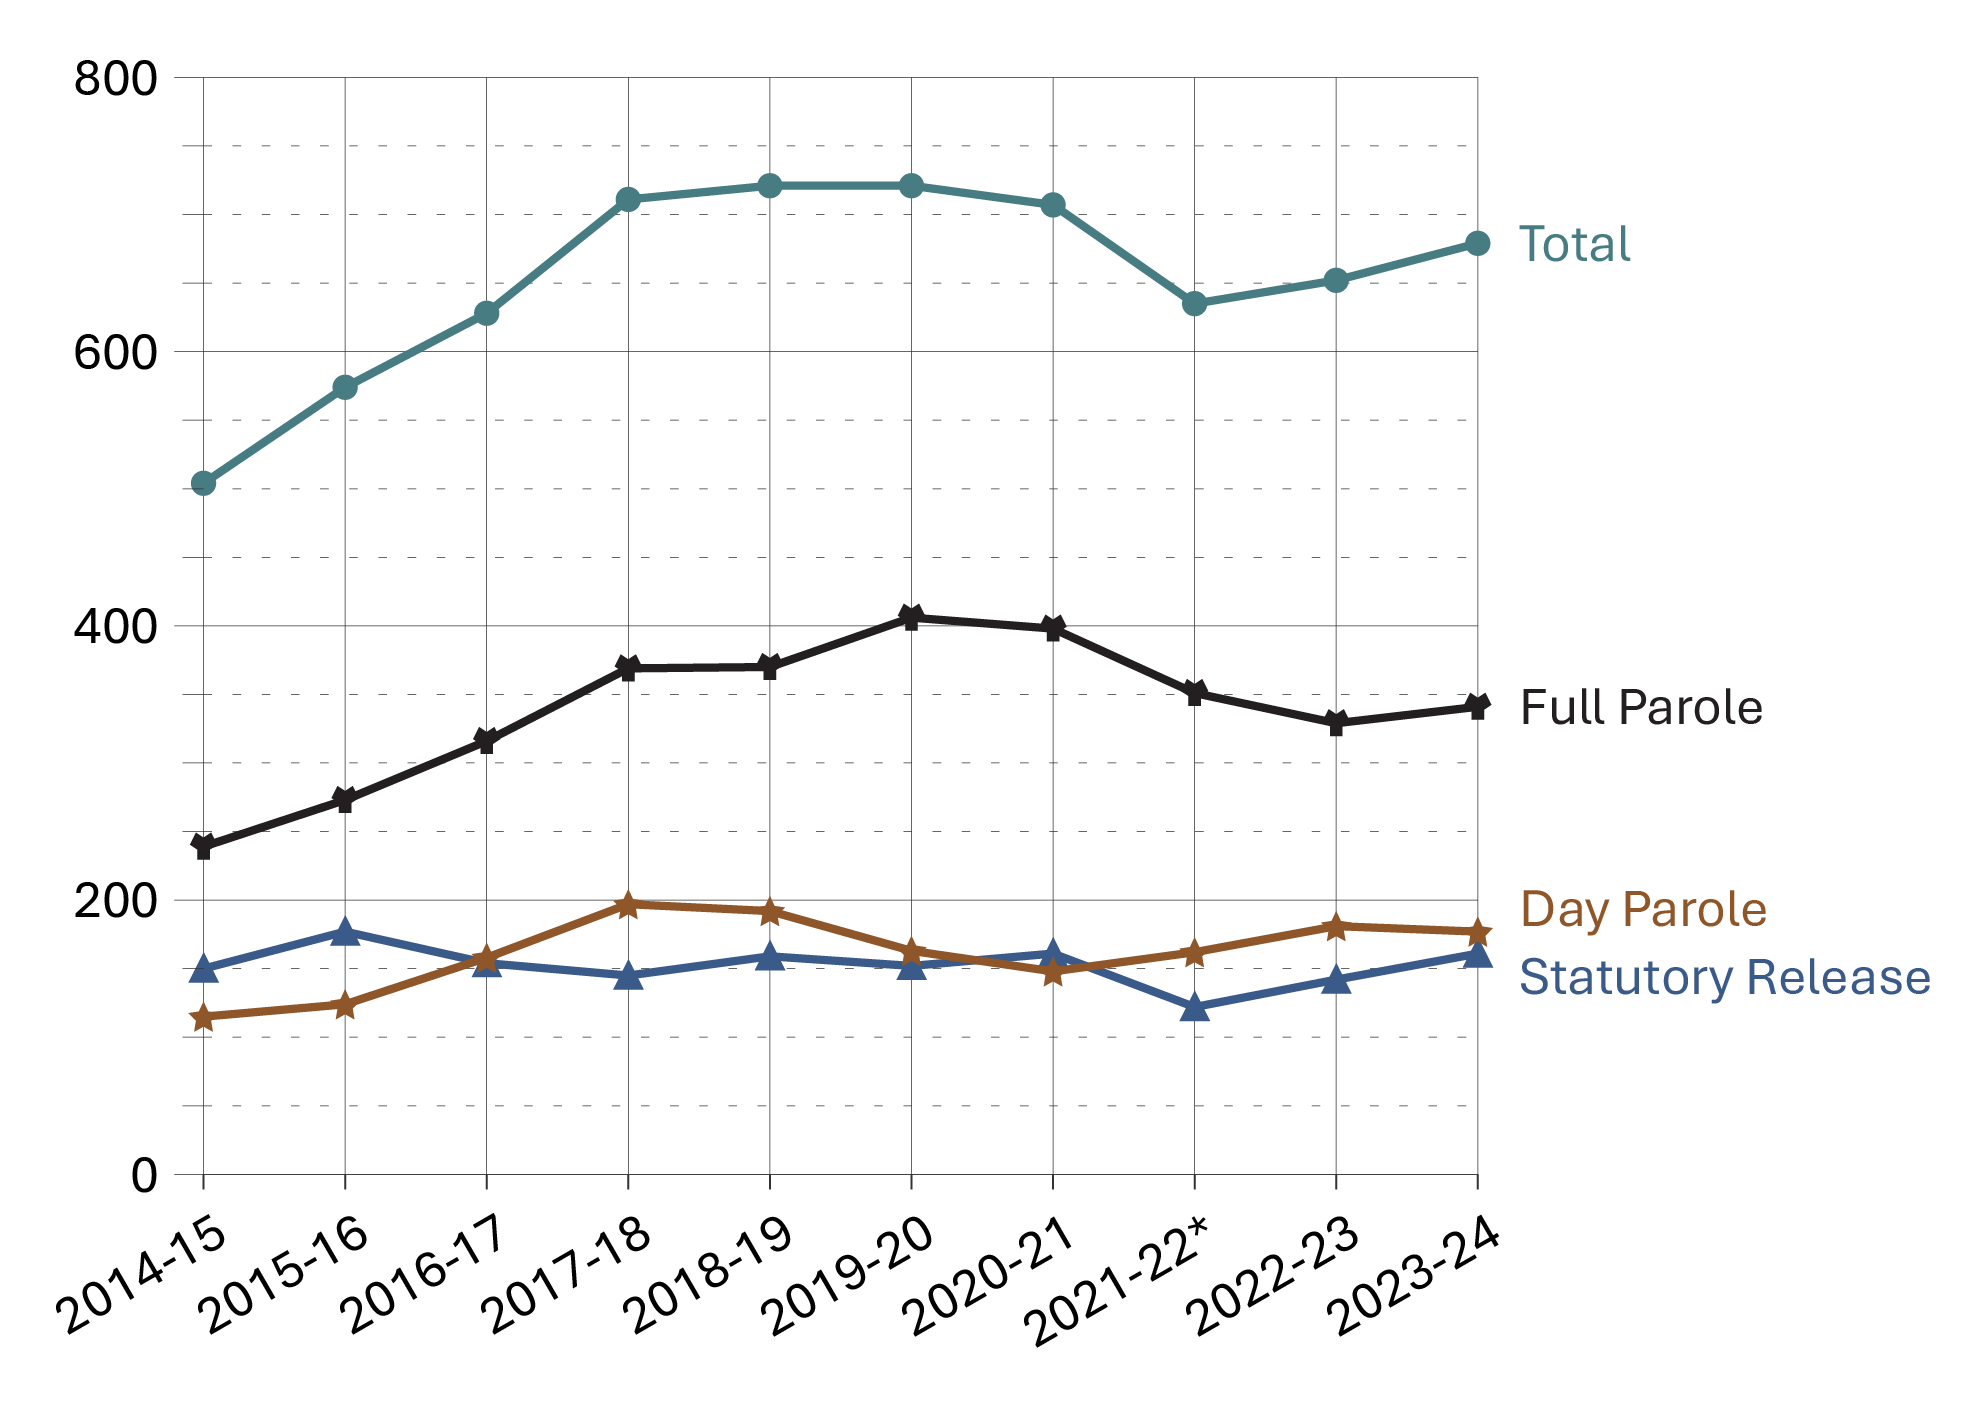
Image description
Line graph showing the number of female offenders in community under supervision over a ten year period from fiscal year 2014-15 to 2023-24. The graph includes the total female offender population, the female population on full parole, the female population on statutory release, and the female population on day parole. Across all years, most female offenders are on full parole, while fewer are on day parole and statutory release. Full data are available in the table below.
Source: Correctional Service of Canada.
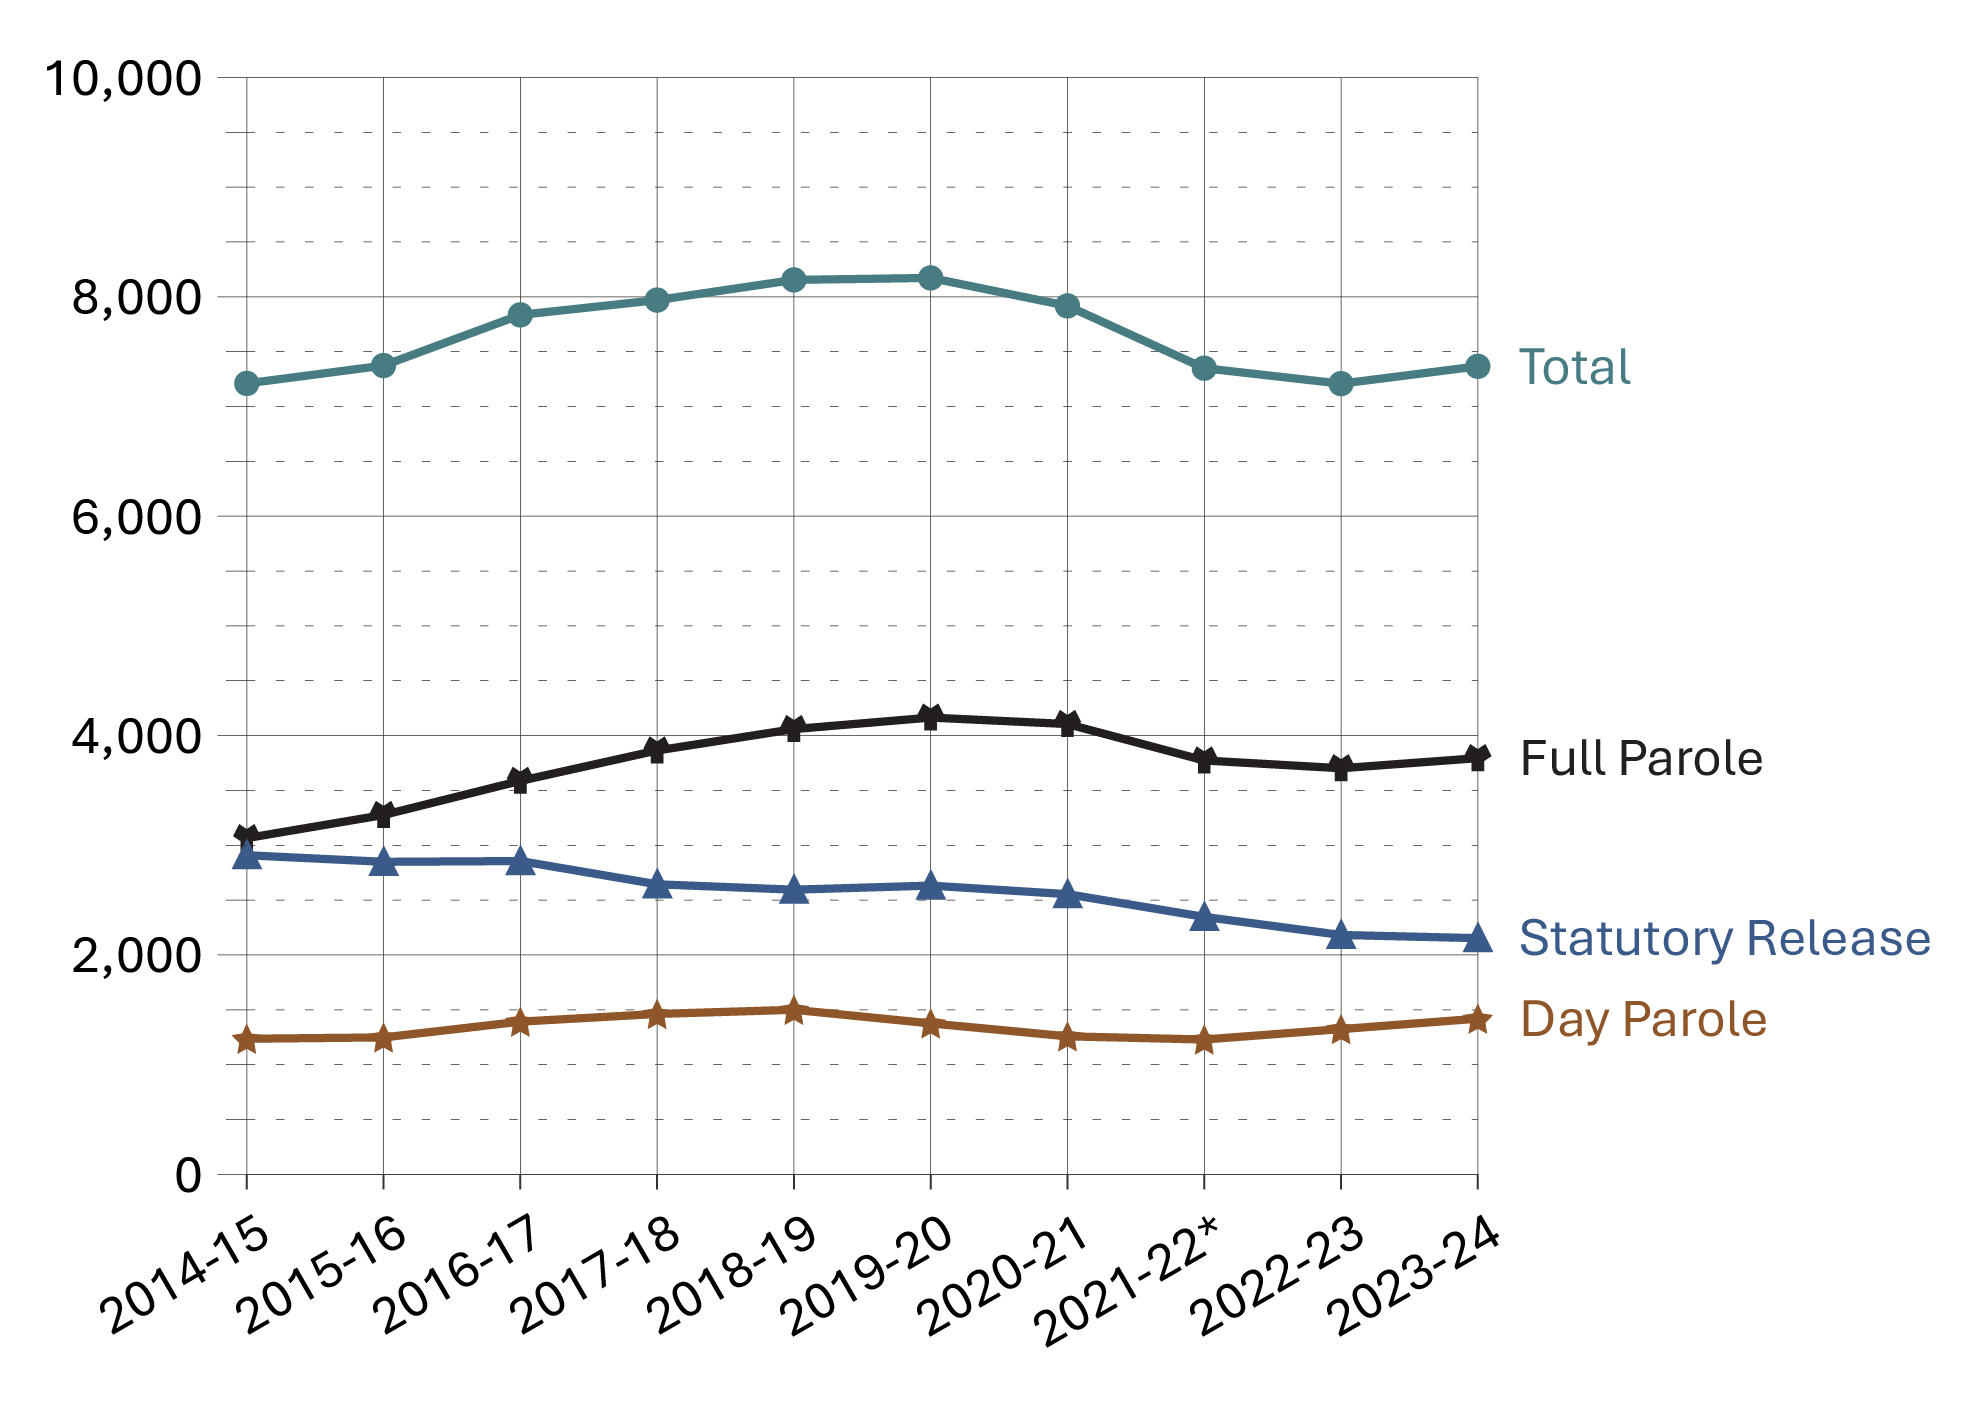
Image description
Line graph showing the number of male offenders in community under supervision over a ten year period from fiscal year 2014-15 to 2023-24. The graph includes the total male offender population, the male population on full parole, the male population on statutory release, and the male population on day parole. Across all years, most male offenders are on full parole, while fewer were on statutory release and day parole. Full data are available in the table below.
Source: Correctional Service of Canada.
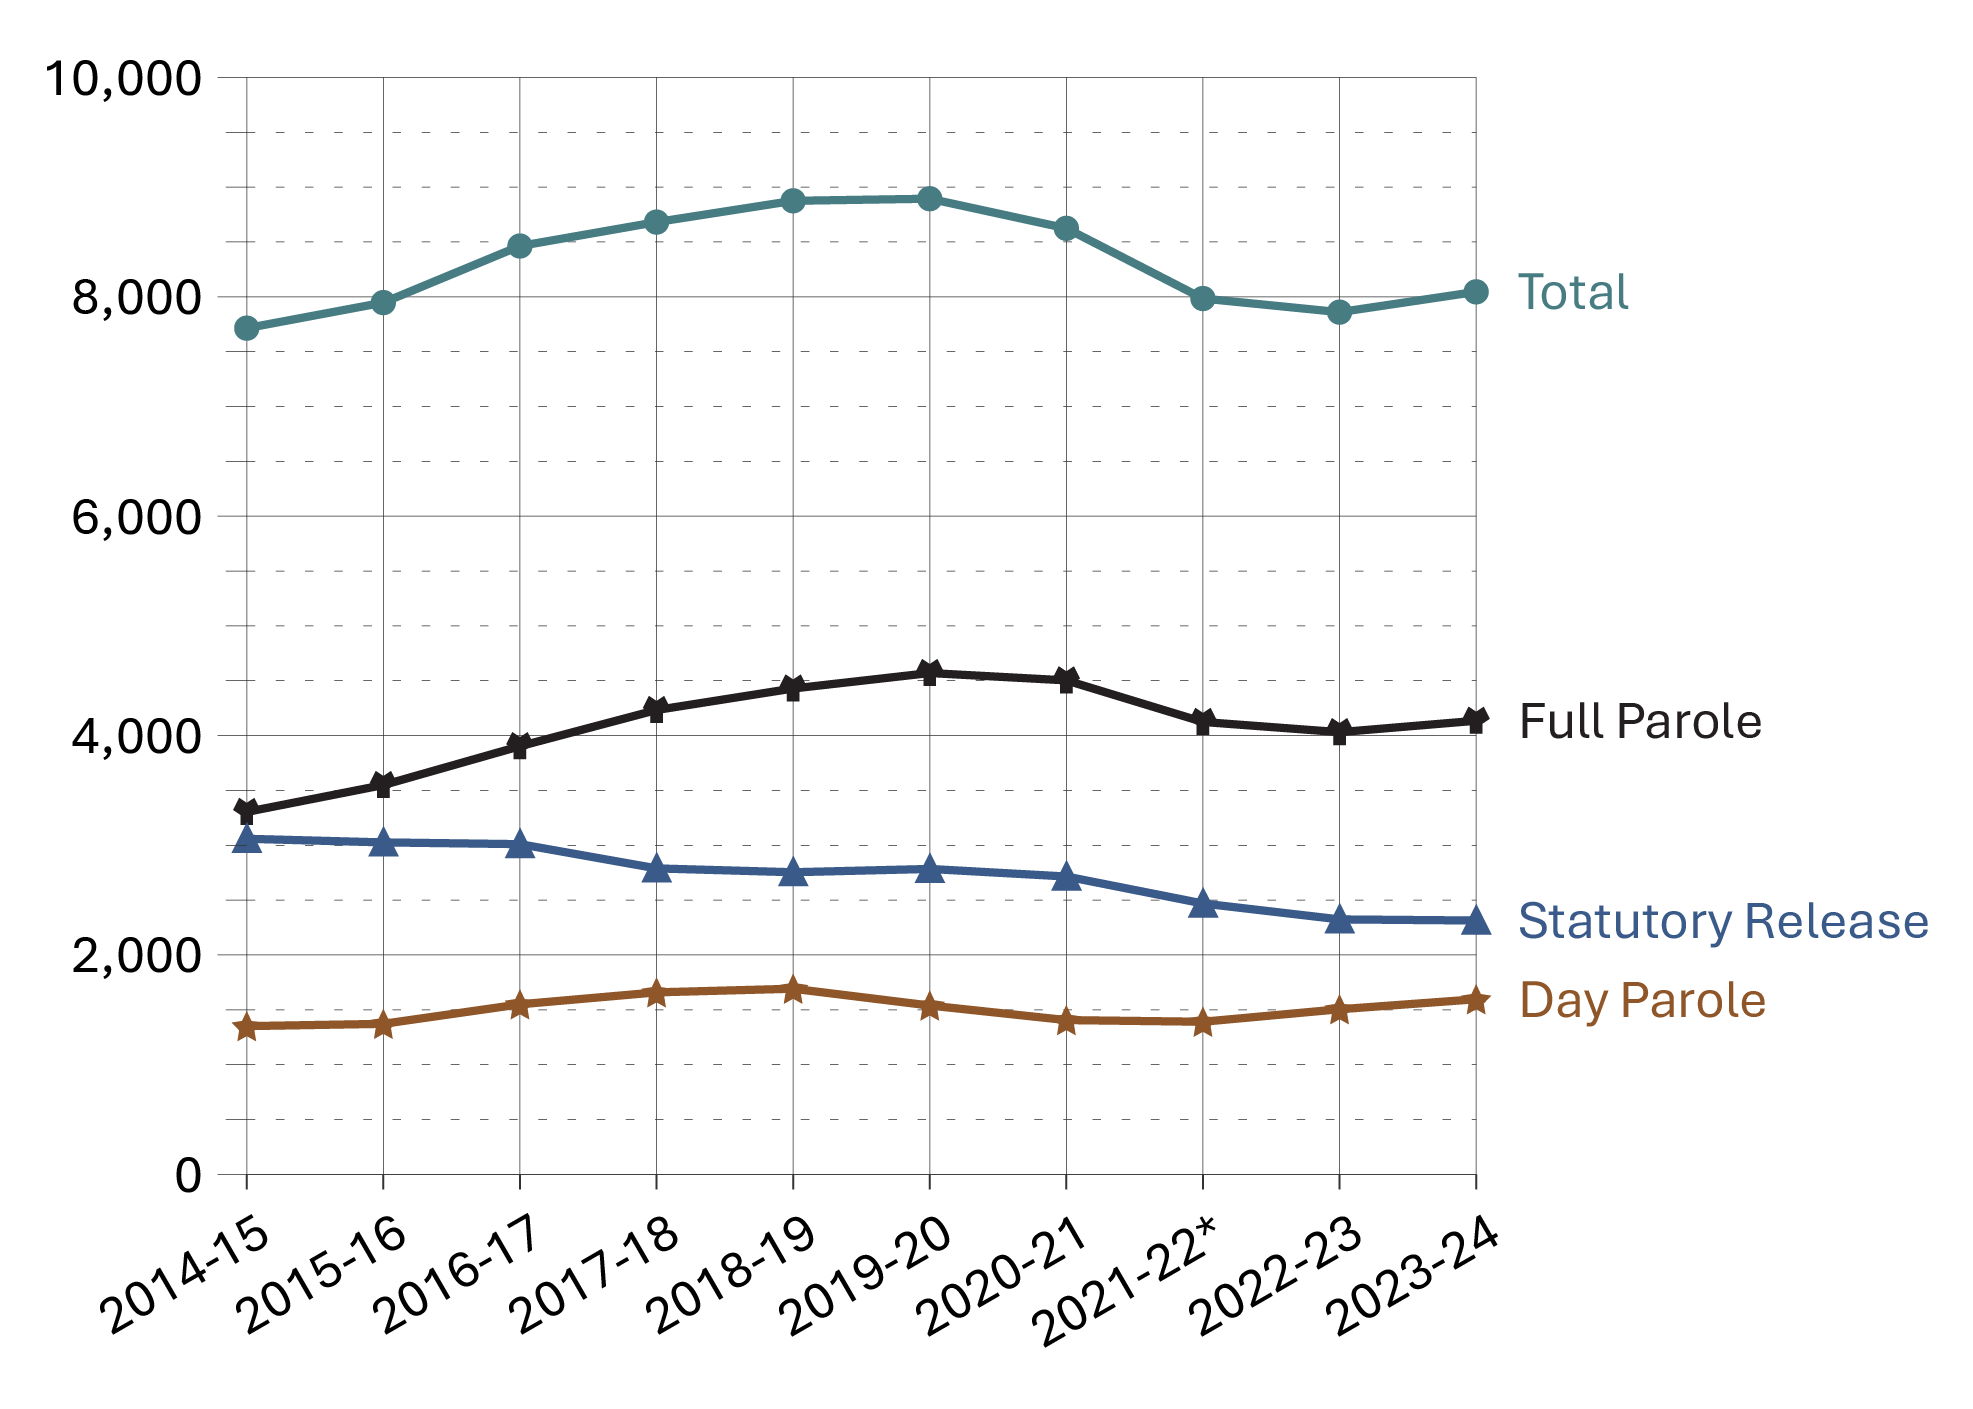
Image description
Line graph showing the total number of Correctional Service of Canada offenders in community under supervision over a ten year period from fiscal year 2014-15 to 2023-24. The graph includes the total offender population, the population on full parole, the population on statutory release, and the population on day parole. Across all years, most offenders are on full parole, while fewer were on statutory release and day parole. Full data are available in the table below.
Source: Correctional Service of Canada.
- Over the past 5 fiscal years (from 2019-20 to 2023-24), the total offender population supervised in the community decreased by 9.5%. For the same period, the total number of offenders on full parole decreased by 9.5% while the proportion of offenders on statutory release decreased by 16.9%. At the end of fiscal year 2023-24, there were 7,366 males and 679 females on active community supervision.
- Over the past 10 fiscal years (from 2014-15 to 2023-24), the total offender population supervised in the community increased by 4.3%. For the same period, the total number of offenders on full parole increased by 25.2% and the proportion of offenders on statutory release decreased by 24.4%.
| Supervision type | 2014-15 | 2015-16 | 2016-17 | 2017-18 | 2018-19 | 2019-20 | 2020-21 | 2021-22Footnote * | 2022-23 | 2023-24 |
|---|---|---|---|---|---|---|---|---|---|---|
| Day parole total | 1,351 | 1,372 | 1,550 | 1,659 | 1,692 | 1,539 | 1,406 | 1,391 | 1,505 | 1,596 |
Females |
115 | 124 | 158 | 197 | 192 | 163 | 148 | 162 | 181 | 177 |
Males |
1,236 | 1,248 | 1,392 | 1,462 | 1,500 | 1,376 | 1,258 | 1,229 | 1,324 | 1,419 |
Intersex |
NR | NR | NR | NR | NR | 0 | 0 | 0 | 0 | 0 |
| Full parole total | 3,304 | 3,549 | 3,903 | 4,233 | 4,429 | 4,571 | 4,503 | 4,124 | 4,031 | 4,135 |
Females |
239 | 273 | 316 | 369 | 370 | 406 | 398 | 351 | 329 | 341 |
Males |
3,065 | 3,276 | 3,587 | 3,864 | 4,059 | 4,164 | 4,105 | 3,773 | 3,702 | 3,794 |
Intersex |
NR | NR | NR | NR | NR | 1 | 0 | 0 | 0 | 0 |
| Statutory release total | 3,059 | 3,026 | 3,010 | 2,789 | 2,754 | 2,784 | 2,715 | 2,469 | 2,324 | 2,314 |
Females |
150 | 177 | 154 | 145 | 159 | 152 | 161 | 122 | 142 | 161 |
Males |
2,909 | 2,849 | 2,856 | 2,644 | 2,595 | 2,632 | 2,554 | 2,347 | 2,182 | 2,153 |
Intersex |
NR | NR | NR | NR | NR | 0 | 0 | 0 | 0 | 0 |
| Total | 7,714 | 7,947 | 8,463 | 8,681 | 8,875 | 8,894 | 8,624 | 7,984 | 7,860 | 8,045 |
Females total |
504 | 574 | 628 | 711 | 721 | 721 | 707 | 635 | 652 | 679 |
Males total |
7,210 | 7,373 | 7,835 | 7,970 | 8,154 | 8,172 | 7,917 | 7,349 | 7,208 | 7,366 |
Intersex total |
NR | NR | NR | NR | NR | 1 | 0 | 0 | 0 | 0 |
Source: Correctional Service of Canada.
Table C30 Notes
Offenders under provincial/territorial supervision on probation or conditional sentence: 10-year trend
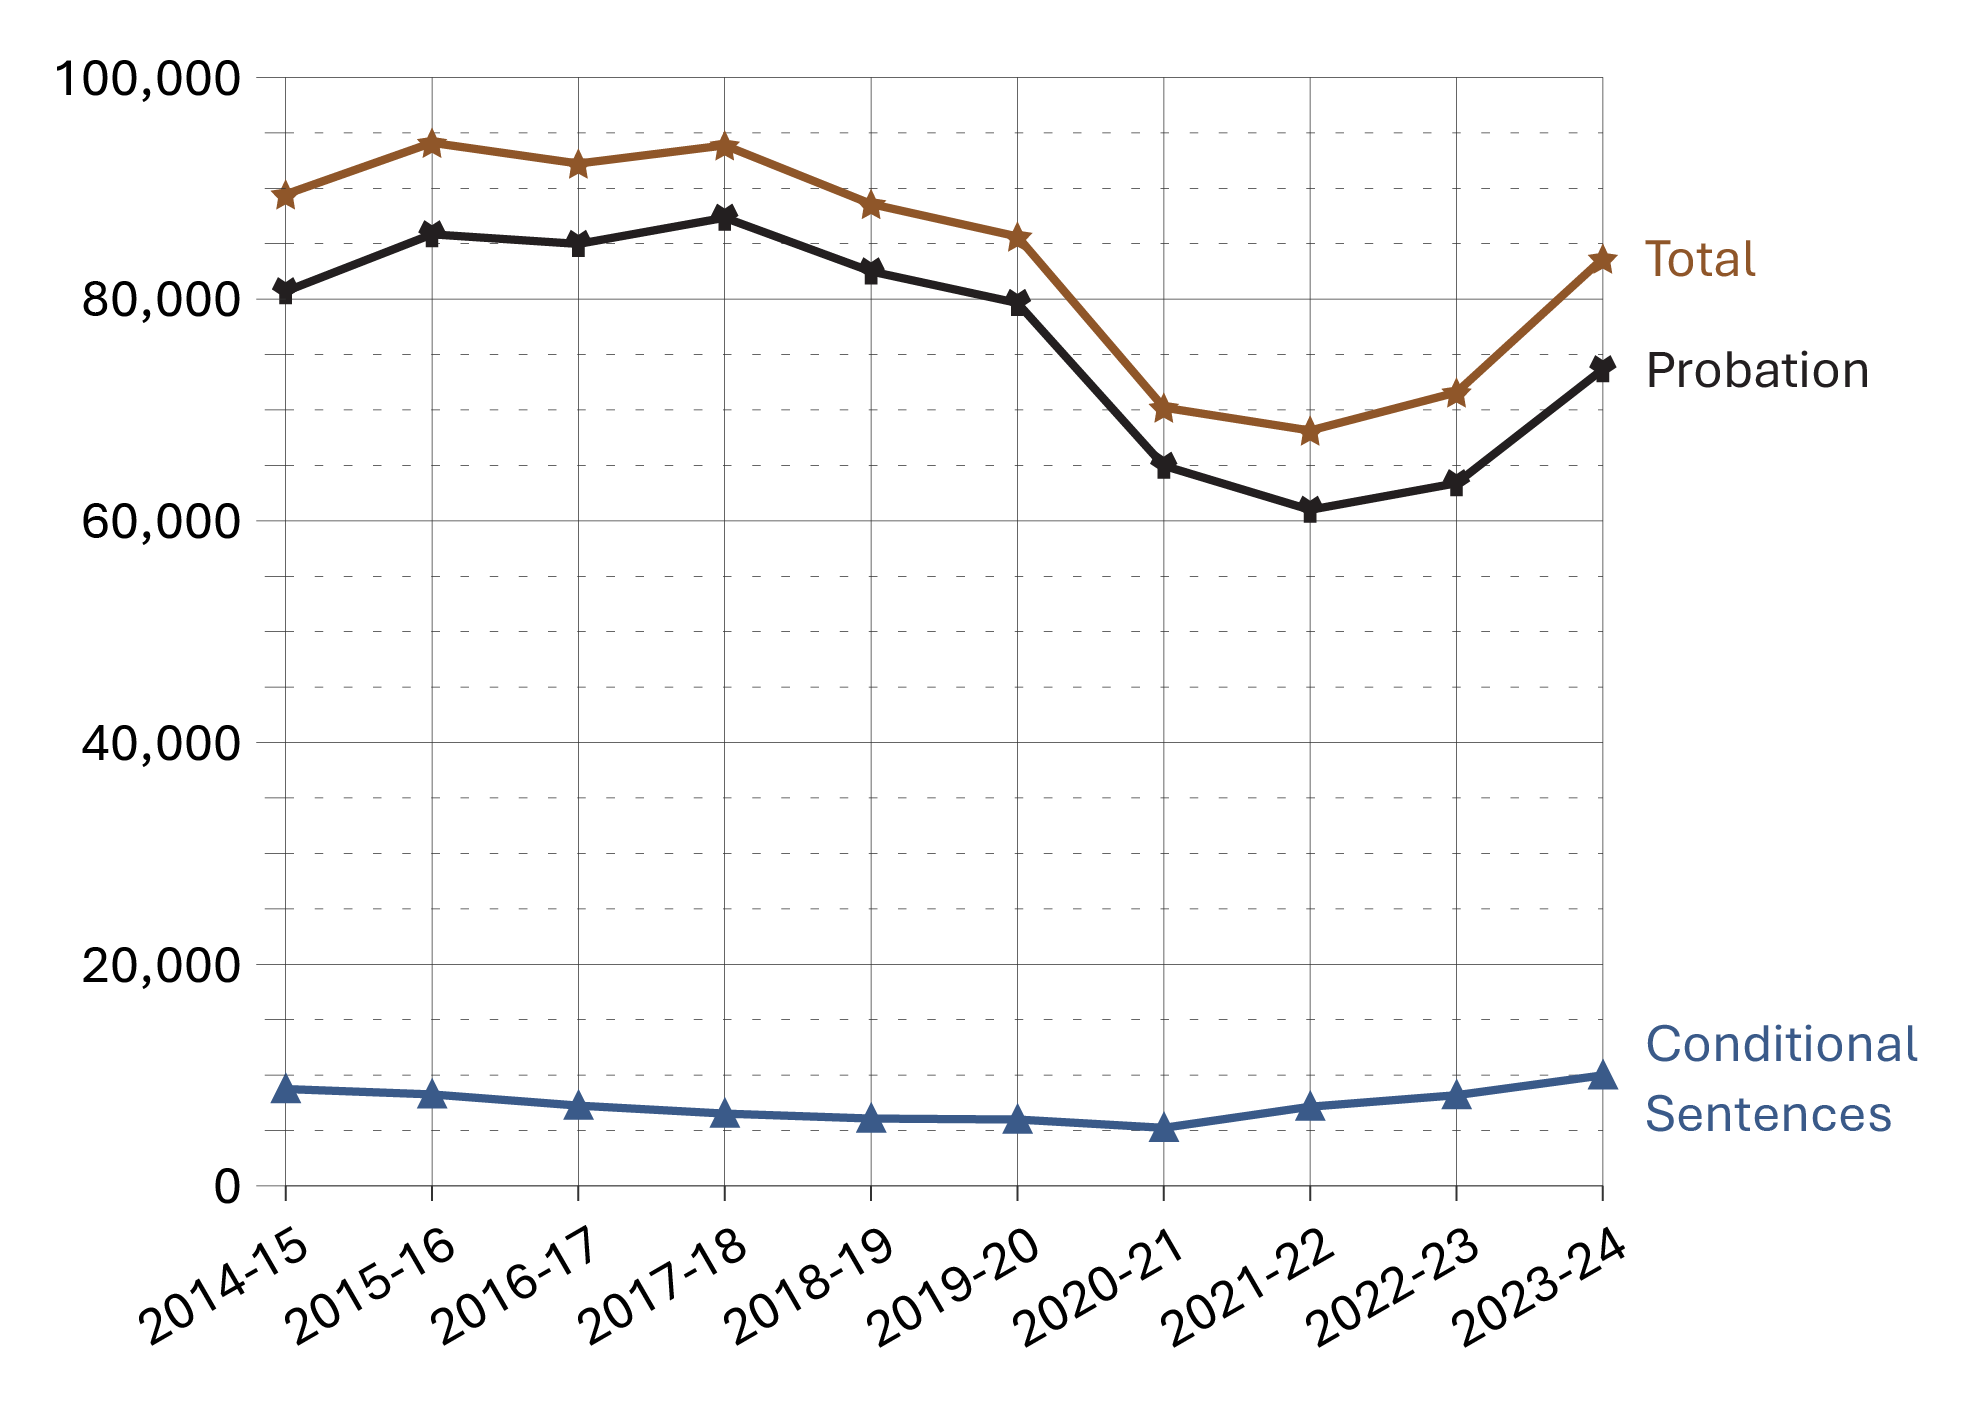
Image description
Line graph showing the average number of offenders under provincial/territorial supervision on probation or on conditional sentence over a 10 year period from fiscal year 2014-15 to 2023-24. Across all years, the vast majority of offenders were on probation. Conditional sentences were far less common. Full data are available in the table below.
Source: Statistics Canada. Table 35-10-0154-01, Average counts of adults in provincial and territorial correctional programs.
- In the 10-year period between 2014-15 and 2023-24, there was a 6.5% decrease in the provincial/territorial community corrections population. The 2023-24 rate is 16.9% higher than in 2022-23, and -2.3% lower than the rate 5 years prior in 2019-20.
- The number of offenders on conditional sentence orders increased 14.2% from 8,746 in 2014-15 to 9,983 in 2023-24. The 2023-24 rate is 21.9% higher than 2022-23 and 66.5% higher than the rate 5 years prior in 2019-20.
- The number of offenders on probation decreased 8.7% from 2014-15 to 2023-24. The 2023-24 rate is 16.2% higher than in 2022-23 and 7.5% lower than the rate in 2019-20.
| Fiscal year | Average offender counts on probation | Average offender counts on conditional sentence | Total |
|---|---|---|---|
| 2014-15 | 80,705 | 8,746 | 89,451 |
| 2015-16 | 85,845 | 8,259 | 94,104 |
| 2016-17 | 84,978 | 7,249 | 92,228 |
| 2017-18 | 87,342 | 6,529 | 93,871 |
| 2018-19 | 82,500 | 6,082 | 88,582 |
| 2019-20 | 79,652 | 5,996 | 85,648 |
| 2020-21 | 64,971 | 5,246 | 70,216 |
| 2021-22 | 60,994 | 7,150 | 68,144 |
| 2022-23 | 63,393 | 8,191 | 71,584 |
| 2023-24 | 73,673 | 9,983 | 83,656 |
Source: Statistics Canada. Table 35-10-0154-01, Average counts of adults in provincial and territorial correctional programs.
Table C31 Notes
Data points reflect the average daily count of adult offenders on probation/conditional sentence over the 12-month fiscal year period.
A conditional sentence is a disposition of the court where the offender serves a term of imprisonment in the community under specified conditions. This type of sentence can only be imposed in cases where the term of imprisonment would be less than 2 years. Conditional sentences have been a provincial and territorial sentencing option since September 1996.
The figure includes data from the most recent year available at the time of preparation.
Reported year periods reflect a fiscal year. A fiscal year runs from April 1 to March 31 of the following year.
Population of offenders on provincial paroleFootnote *: 10-year trend
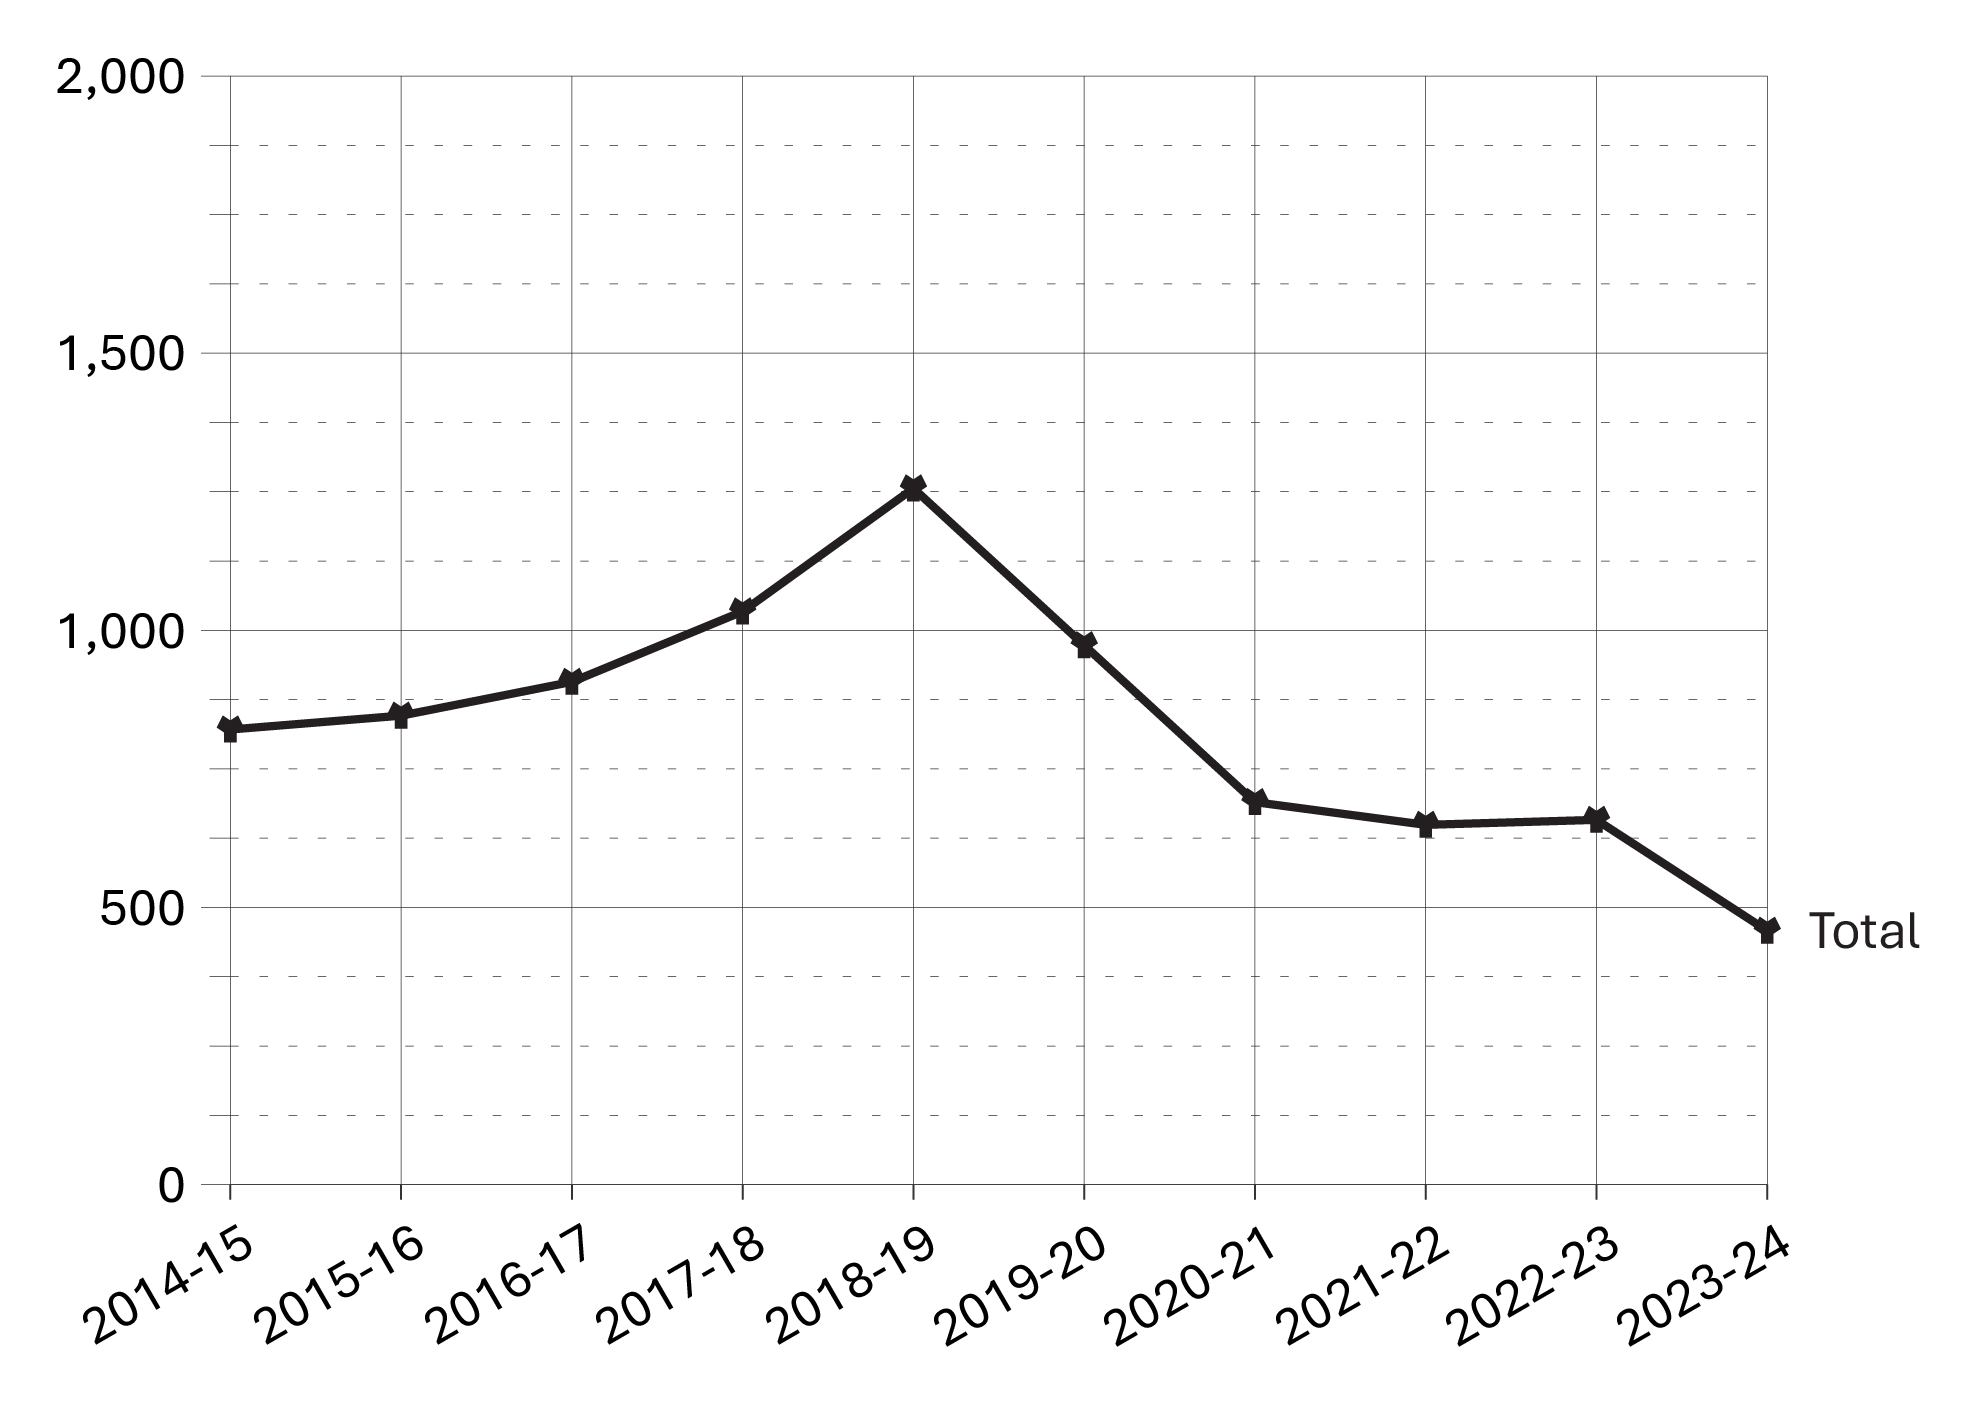
Image description
Line graph showing the average monthly counts of offenders on provincial parole over a ten year period from fiscal year 2014-15 to 2023-24. The average monthly counts of offenders on provincial parole peaked in 2018-19, and then steadily decreased until 2023-24. Full data are available in the table below.
Source: Statistics Canada. Table 35-10-0154-01, Average counts of adults in provincial and territorial correctional programs.
- The number of offenders on provincial parole (as reported by provincial parole boards onlyFootnote *) decreased 30.4% from 2022-23 to 2023-24 (658 offenders to 458).
- In the 5 years between 2019-20 to 2023-24, there was a 52.9% decrease in the number of offenders on provincial parole (as reported by provincial parole boards onlyFootnote *), down from 973 in 2019-20 to 458 in 2023-24. Fluctuations observed between 2019-20 and 2022-23 may be due to the imposition and cessation of the COVID-19 pandemic lockdown restrictions.
| Fiscal year | Quebec provincial board | Ontario provincial board | Alberta provincial board | Total provincial boards | Parole Board of CanadaFootnote * | Total provincial and federal boards | % change |
|---|---|---|---|---|---|---|---|
| 2014-15 | 612 | 207 | NR | 821 | 151 | 972 | 100 |
| 2015-16 | 639 | 207 | NR | 846 | 139 | 985 | 1.3 |
| 2016-17 | 701 | 205 | NR | 907 | 151 | 1,058 | 6.9 |
| 2017-18 | 792 | 242 | NR | 1,034 | 163 | 1,197 | 11.6 |
| 2018-19 | 858 | 398 | NR | 1,256 | 152 | 1,408 | 15.0 |
| 2019-20 | 682 | 289 | NR | 973 | 127 | 1,100 | -28.1 |
| 2020-21 | 490 | 197 | 2 | 690 | 117 | 807 | -36.3 |
| 2021-22 | 489 | 140 | 20 | 649 | 93 | 742 | -8.8 |
| 2022-23 | 475 | 162 | 22 | 658 | 82 | 740 | -0.2 |
| 2023-24 | 310 | 132 | 16 | 458 | NAFootnote ** | NAFootnote ** | NAFootnote ** |
Source: Statistics Canada. Table 35-10-0154-01, Average counts of adults in provincial and territorial correctional programs.
Table C32 Notes
Section D: Conditional Release
Number of CSC offenders granted temporary absences: 10-year trend
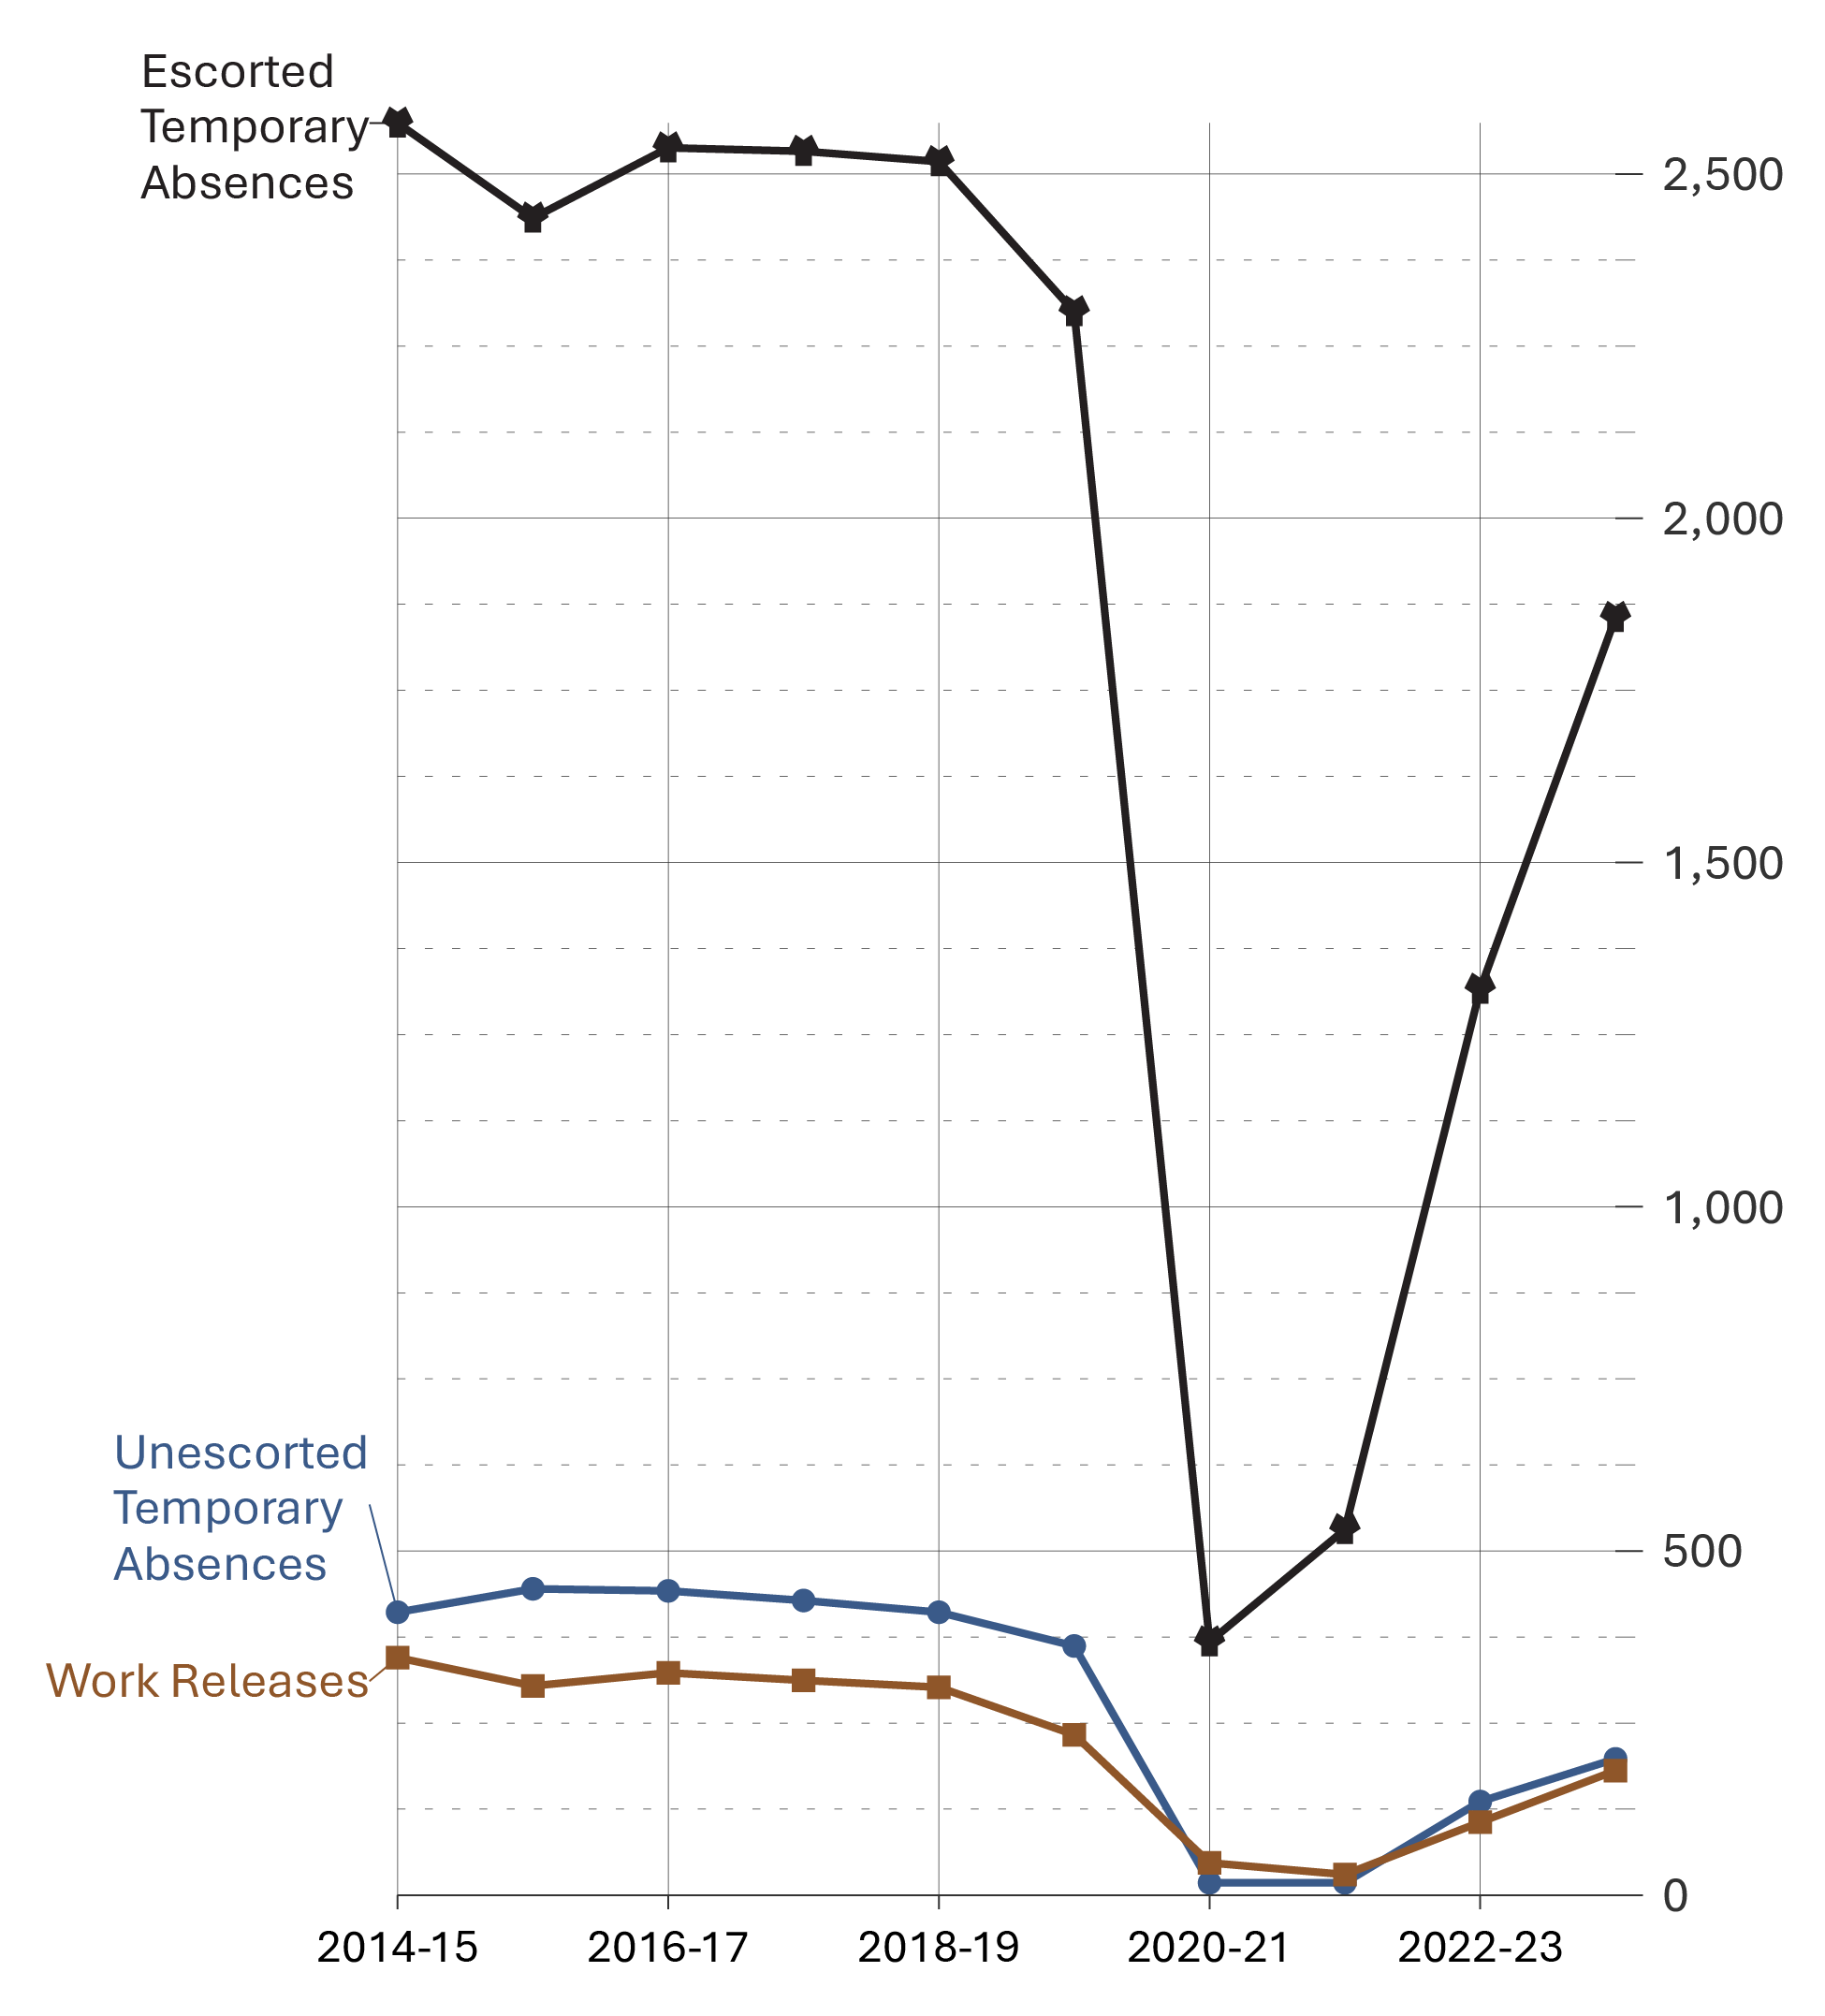
Image description
Line graph showing the number of offenders granted temporary absences and work releases over a ten year period from fiscal year 2014-15 to 2023-24. The graph includes escorted temporary absences, unescorted temporary absences, and work releases. Over time there were consistently more escorted temporary absences. However, the number of escorted temporary absences declined sharply in fiscal year 2020-21, before beginning to climb back toward previous highs. Full data are available in the table below.
Source: Correctional Service of Canada.
- There was an increase in the number of offenders receiving escorted temporary absences, from 1,316 in 2022-23 to 1,856 in 2023-24.
- There was an increase in the number of offenders receiving unescorted temporary absences, from 136 in 2022-23 to 198 in 2023-24.
- The number of offenders receiving work releases increased from 106 in 2022-23 to 181 in 2023-24.
- For the past 10 years (from 2014-15 to 2023-24), the average successful completion rates for escorted temporary absences was 99.6%, 98.7% for unescorted temporary absences and 93.6% for work releases.
| Fiscal year | Escorted temporary absences (# of offenders) | Escorted temporary absences (# of permits) | Unescorted temporary absences (# of offenders) | Unescorted temporary absences (# of permits) | Work releases (# of offenders) | Work releases (# of permits) |
|---|---|---|---|---|---|---|
| 2014-15 | 2,574 | 49,628 | 411 | 3,563 | 345 | 489 |
| 2015-16 | 2,436 | 47,066 | 445 | 4,078 | 304 | 418 |
| 2016-17 | 2,538 | 48,568 | 442 | 3,782 | 323 | 477 |
| 2017-18 | 2,533 | 50,459 | 428 | 3,163 | 312 | 443 |
| 2018-19 | 2,518 | 55,914 | 411 | 2,819 | 302 | 434 |
| 2019-20 | 2,300 | 50,984 | 362 | 2,892 | 233 | 314 |
| 2020-21 | 368 | 2,602 | 18 | 59 | 47 | 54 |
| 2021-22 | 531 | 3,859 | 18 | 44 | 30 | 36 |
| 2022-23 | 1,316 | 19,844 | 136 | 761 | 106 | 135 |
| 2023-24 | 1,856 | 35,273 | 198 | 1,455 | 181 | 277 |
Source: Correctional Service of Canada.
Table D1 Notes
A temporary absence is permission given to an eligible offender to be away from the normal place of confinement for medical, administrative, community service, family contact, personal development for rehabilitative purposes, or compassionate reasons, including parental responsibilities.
A work release is a structured program of release of specified duration for work or community service outside the penitentiary, under the supervision of a staff member or other authorized person or organization.
Successful completion includes temporary absences or work releases with a completion status of “on time” or “extension”.
These numbers depict the number of offenders who received at least one temporary absence permit (excluding those for medical purposes) or at least one work release. An offender may be granted more than one temporary absence permit or work release over a period of time.
Reported year periods reflect fiscal years. A fiscal year runs from April 1 to March 31 of the following year.
Offenders released from federal institutions, including Healing Lodges, on parole: 10-year trend
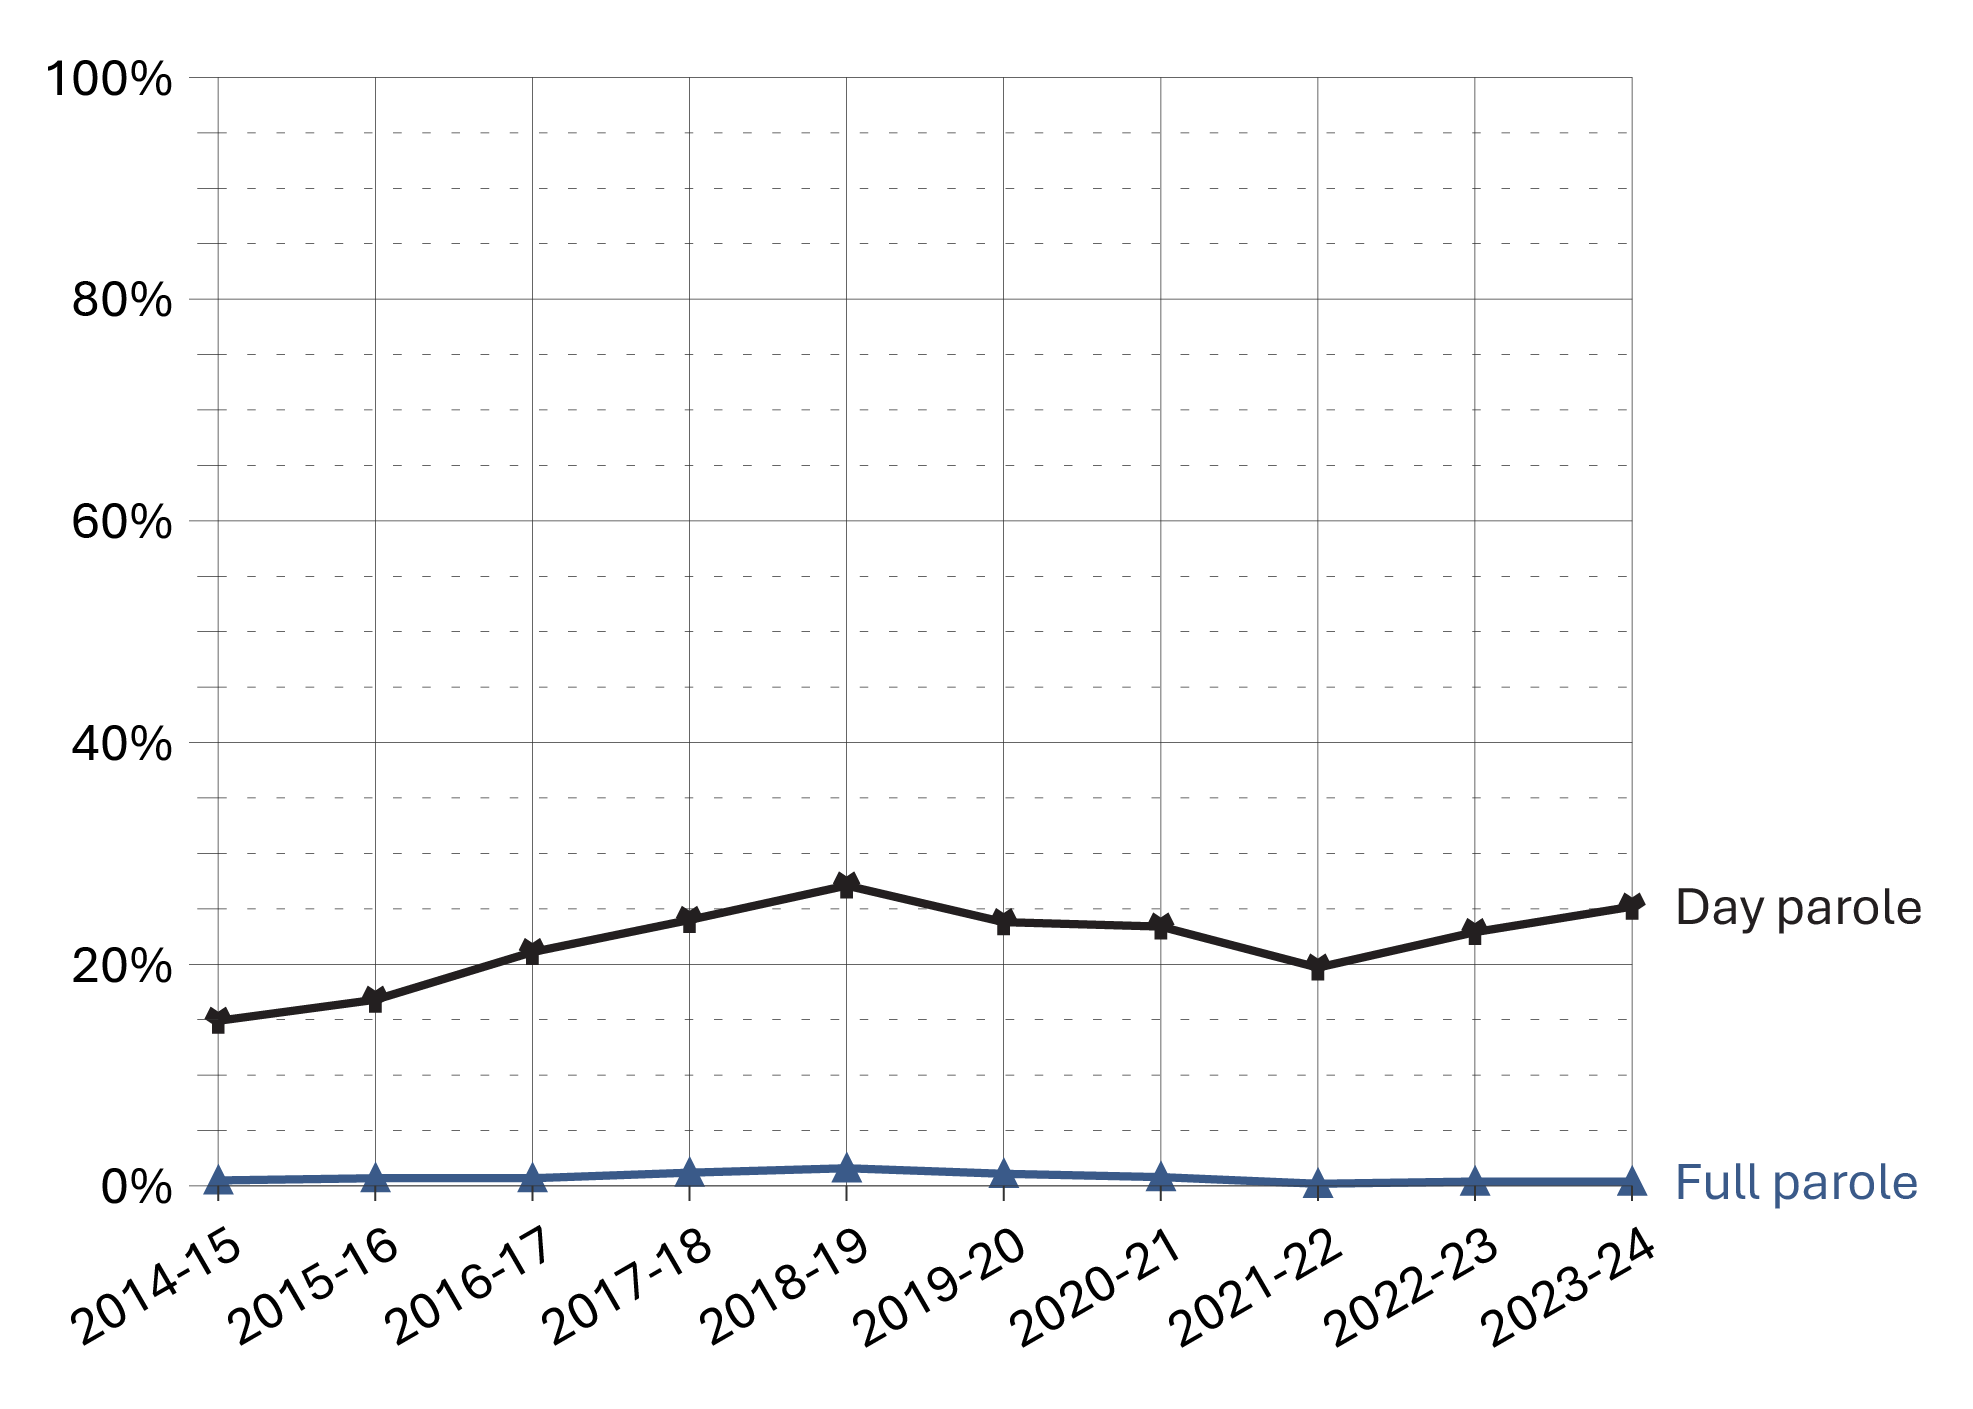
Image description
Line graph showing the percentage of Indigenous offenders released from federal institutions or Healing Lodges, by day parole and full parole, over a ten year period from fiscal year 2014-15 to 2023-24. Over time, more Indigenous offenders are released on day parole. Full data are available in the table below.
Source: Correctional Service of Canada.
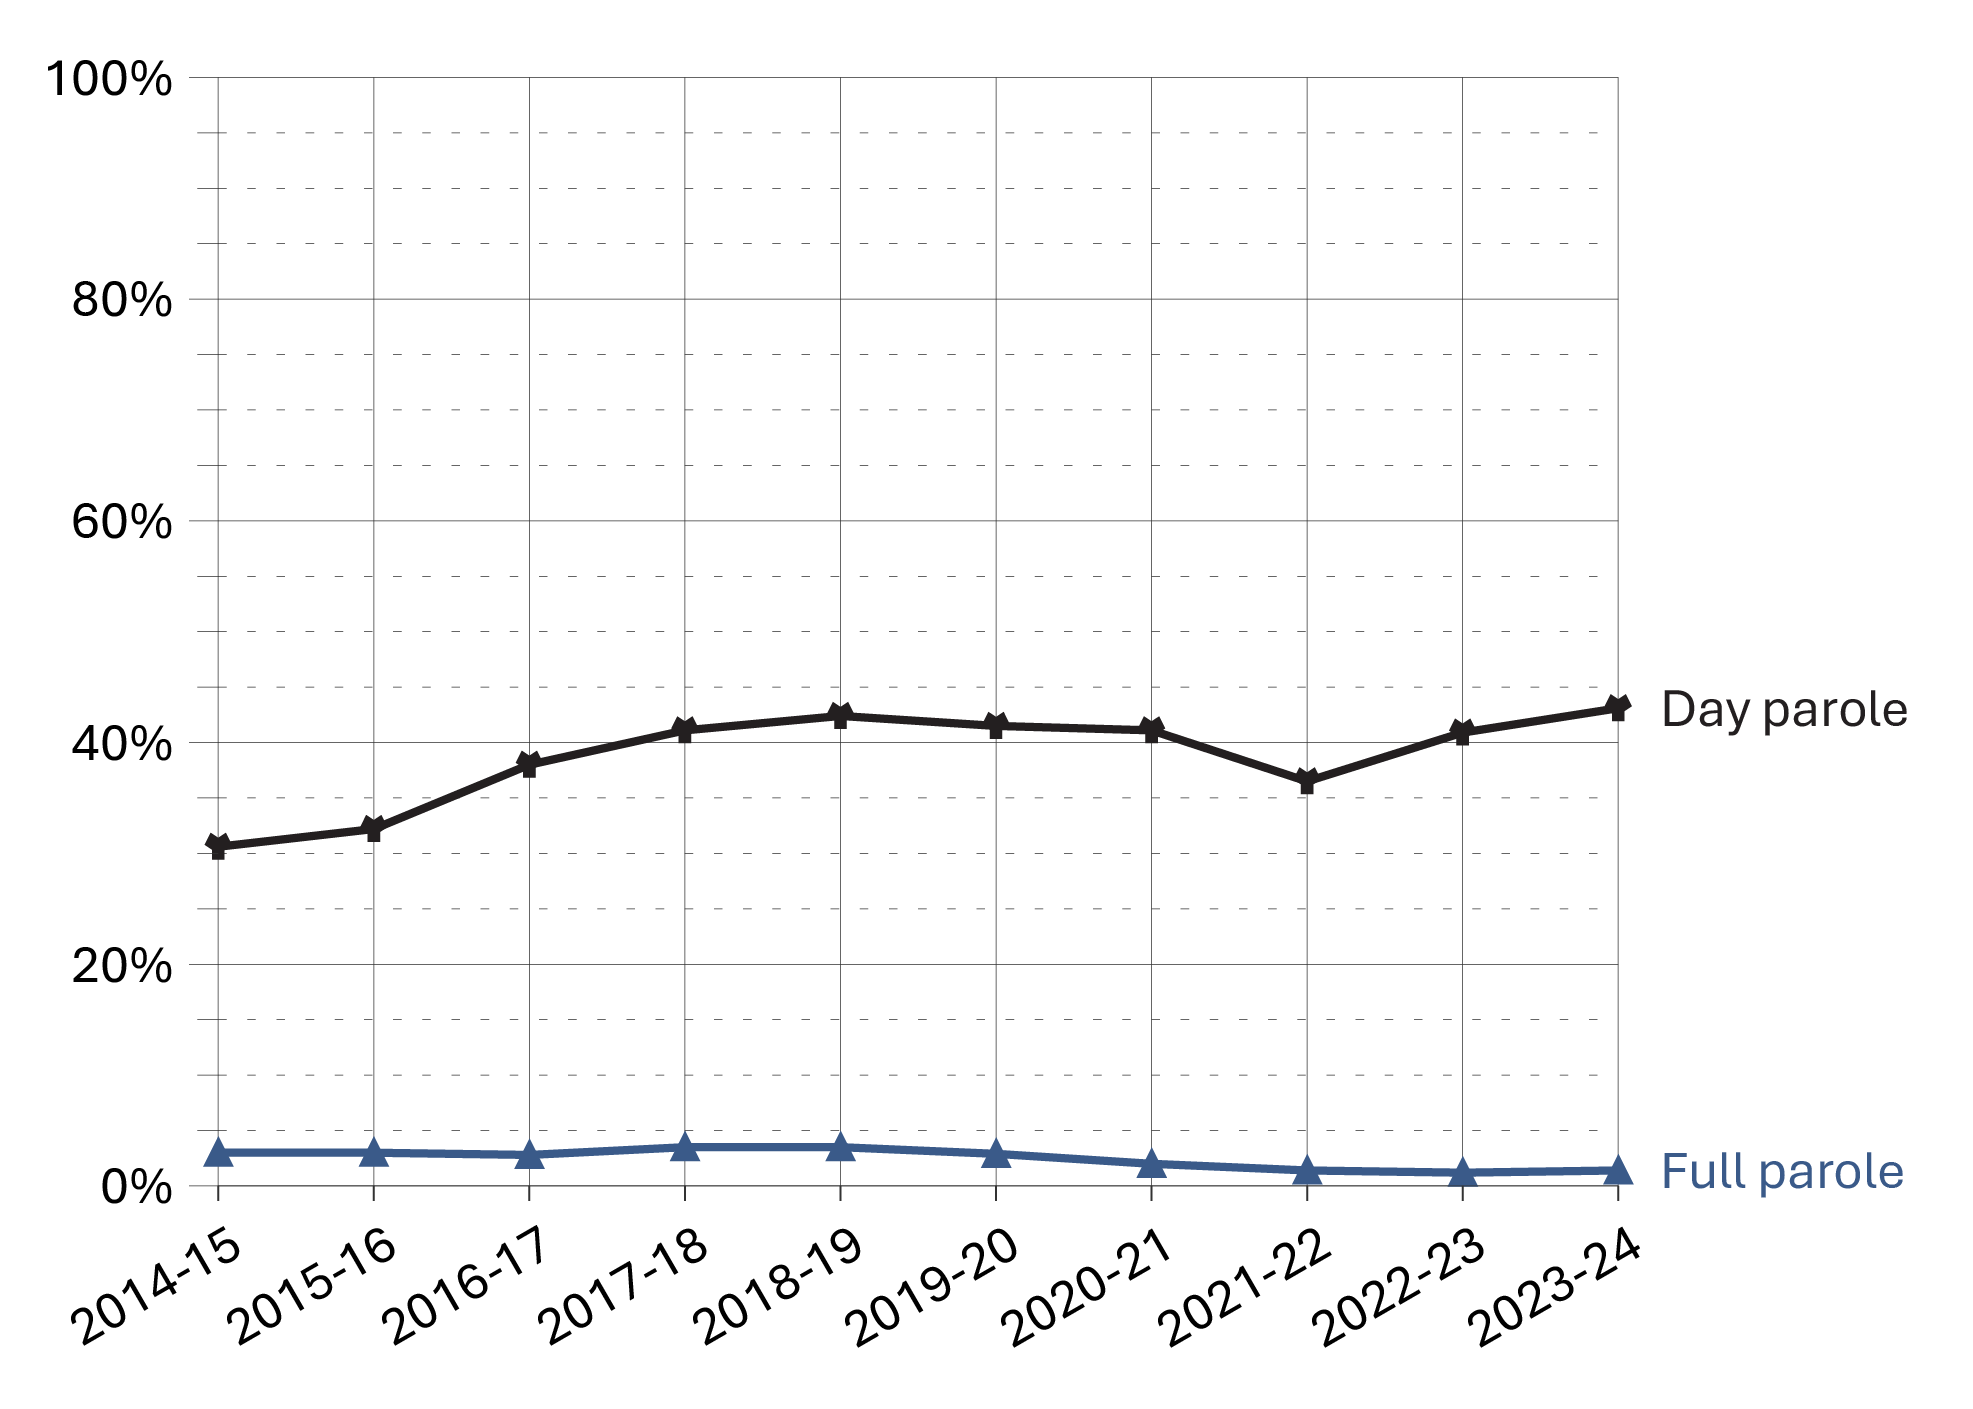
Image description
Line graph showing the percentage of non-Indigenous offenders released from federal institutions or Healing Lodges, by day parole and full parole, over a ten year period from fiscal year 2014-15 to 2023-24. Over time, more non-Indigenous offenders are released on day parole. Full data are available in the table below.
Source: Correctional Service of Canada.
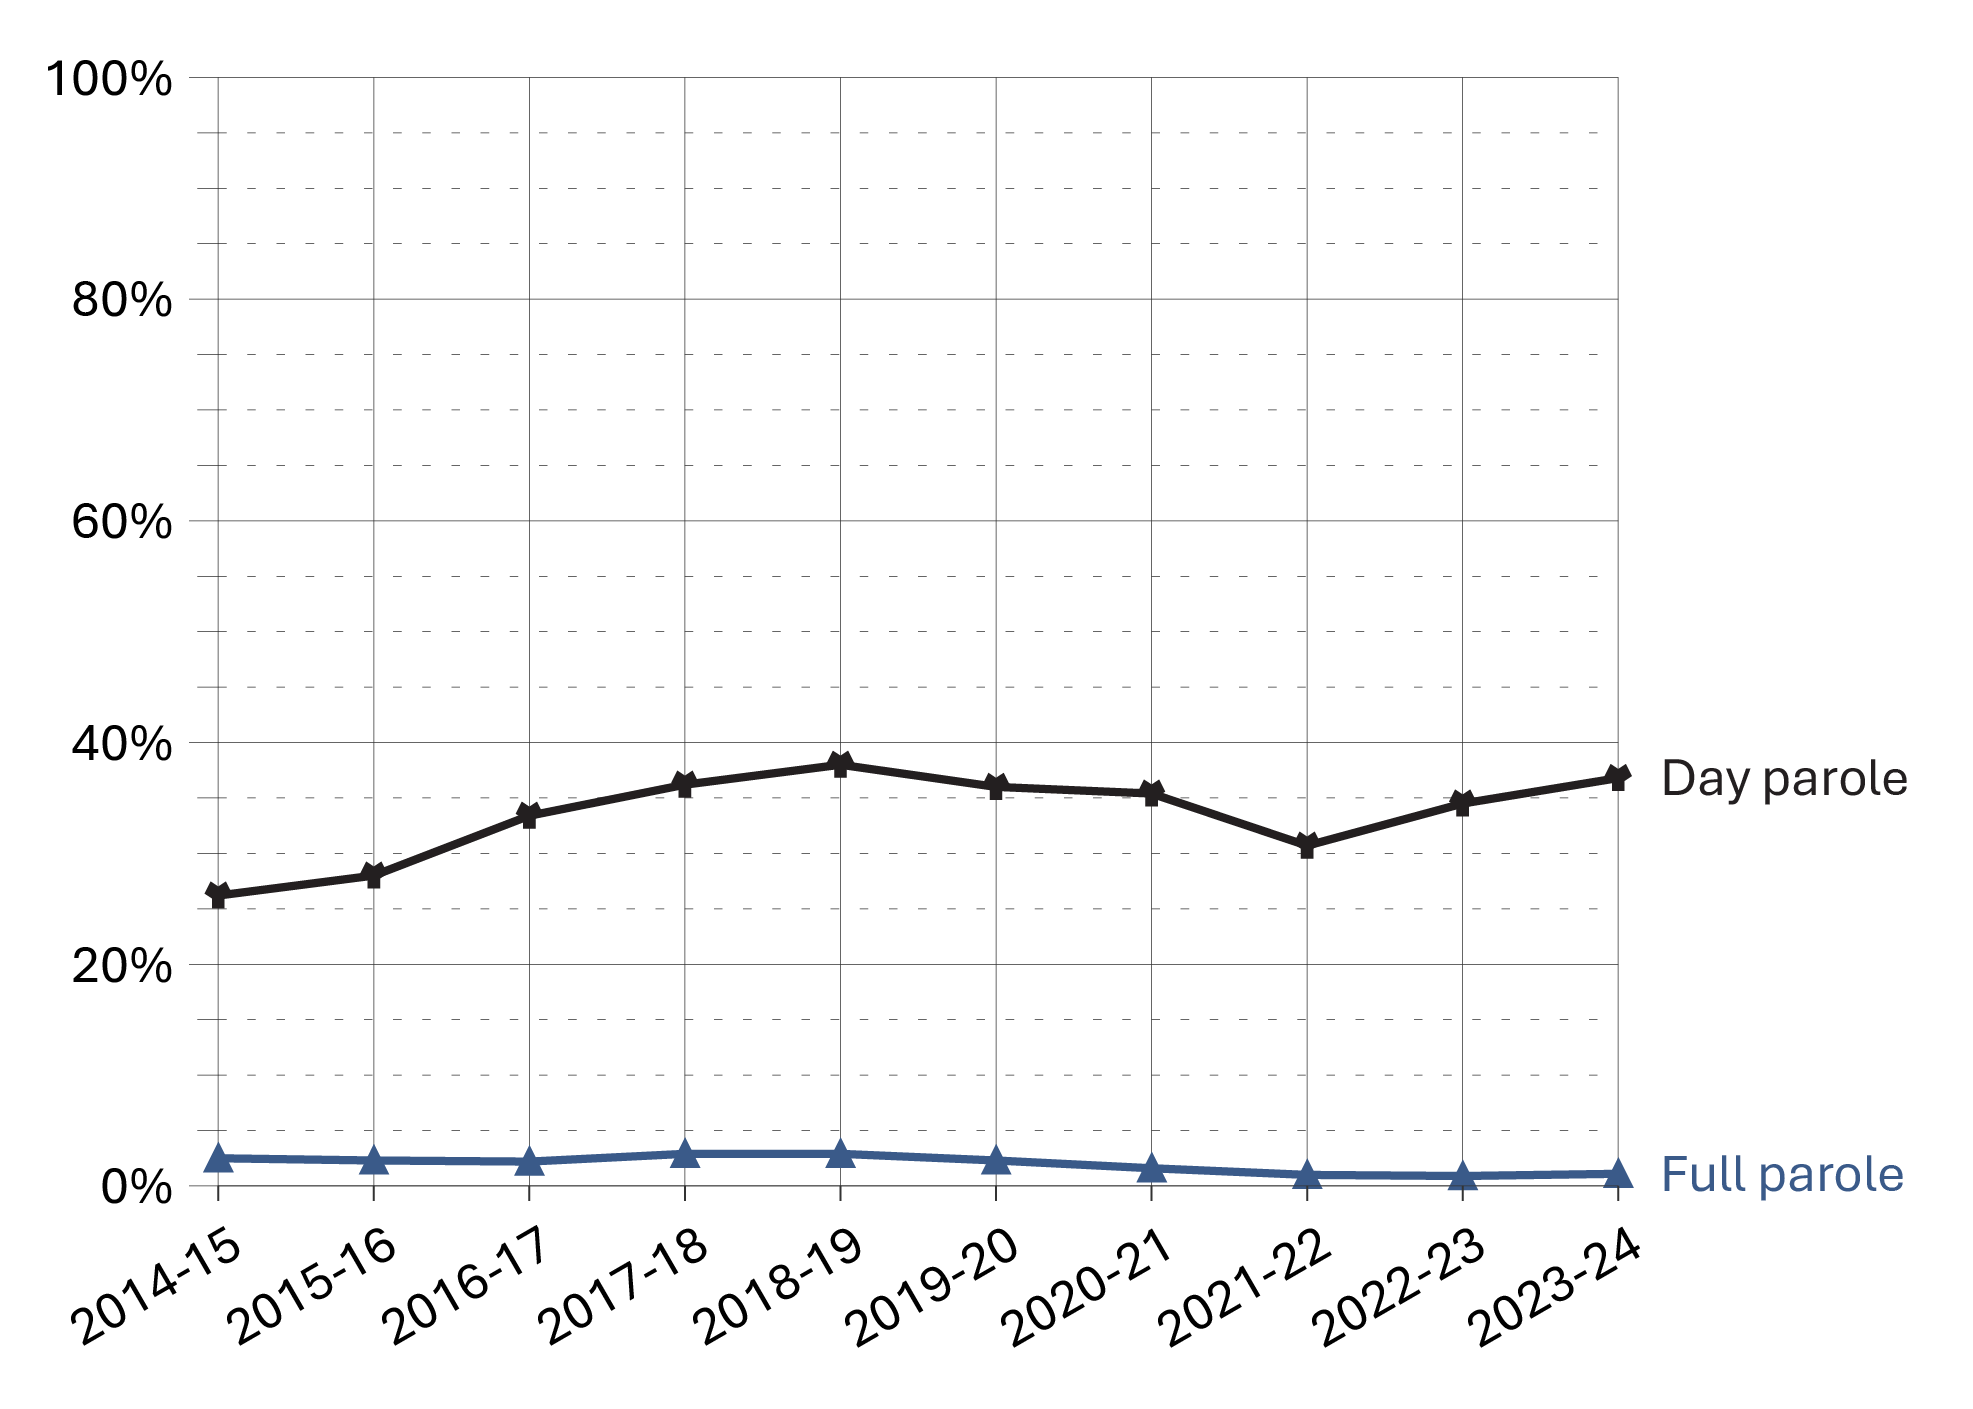
Image description
Line graph showing the percentage of total offenders released from federal institutions or Healing Lodges, by day parole and full parole, over a ten year period from fiscal year 2014-15 to 2023-24. Over time, more offenders are released on day parole. Full data are available in the table below.
Source: Correctional Service of Canada.
- In fiscal year 2023-24, 36.8% of all releases from federal institutions were on day parole and 1.1% were on full parole.
- In fiscal year 2023-24, 25.2% of releases for Indigenous offenders were on day parole and 0.4% were on full parole compared to 43.1% and 1.4% respectively for non-Indigenous offenders.
- In fiscal year 2023-24, 35.6% of releases from federal institutions for male offenders were on day parole and 1.1% were on full parole, compared to 51.1% and 1.2%, respectively, for female offenders.
- Over the past ten years (from 2014-15 to 2023-24), the percentage of releases on day parole increased from 26.2% to 36.8% and the percentage of releases on full parole decreased from 2.5% to 1.1%.
| Fiscal year | Day parole | % | Full parole | % | Total Indigenous releases |
|---|---|---|---|---|---|
| 2014-15 | 314 | 14.9 | 10 | 0.5 | 2,106 |
| 2015-16 | 349 | 16.8 | 14 | 0.7 | 2,079 |
| 2016-17 | 441 | 21.1 | 14 | 0.7 | 2,086 |
| 2017-18 | 507 | 24.0 | 26 | 1.2 | 2,109 |
| 2018-19 | 557 | 27.1 | 33 | 1.6 | 2,053 |
| 2019-20 | 522 | 23.8 | 24 | 1.1 | 2,196 |
| 2020-21 | 491 | 23.4 | 16 | 0.8 | 2,102 |
| 2021-22 | 440 | 19.7 | 5 | 0.2 | 2,232 |
| 2022-23 | 514 | 22.9 | 10 | 0.4 | 2,245 |
| 2023-24 | 563 | 25.2 | 10 | 0.4 | 2,235 |
Source: Correctional Service of Canada.
| Fiscal year | Day parole | % | Full parole | % | Total non-Indigenous releases |
|---|---|---|---|---|---|
| 2014-15 | 1,661 | 30.6 | 175 | 3.2 | 5,426 |
| 2015-16 | 1,781 | 32.2 | 164 | 3.0 | 5,537 |
| 2016-17 | 2,086 | 38.0 | 153 | 2.8 | 5,491 |
| 2017-18 | 2,115 | 41.1 | 182 | 3.5 | 5,141 |
| 2018-19 | 2,126 | 42.4 | 175 | 3.5 | 5,011 |
| 2019-20 | 2,019 | 41.5 | 140 | 2.9 | 4,865 |
| 2020-21 | 1,822 | 41.1 | 87 | 2.0 | 4,435 |
| 2021-22 | 1,521 | 36.5 | 57 | 1.4 | 4,166 |
| 2022-23 | 1,639 | 40.9 | 49 | 1.2 | 4,003 |
| 2023-24 | 1,797 | 43.1 | 59 | 1.4 | 4,171 |
Source: Correctional Service of Canada.
| Fiscal year | Day parole | % | Full parole | % | Total male releases |
|---|---|---|---|---|---|
| 2014-15 | 1,790 | 25.2 | 165 | 2.3 | 7,091 |
| 2015-16 | 1,923 | 27.0 | 160 | 2.2 | 7,112 |
| 2016-17 | 2,245 | 32.0 | 143 | 2.0 | 7,015 |
| 2017-18 | 2,301 | 34.4 | 188 | 2.8 | 6,682 |
| 2018-19 | 2,369 | 36.4 | 193 | 3.0 | 6,516 |
| 2019-20 | 2,248 | 34.5 | 155 | 2.4 | 6,522 |
| 2020-21 | 2,076 | 34.2 | 91 | 1.5 | 6,064 |
| 2021-22 | 1,709 | 28.9 | 57 | 1.0 | 5,913 |
| 2022-23 | 1,912 | 33.0 | 56 | 1.0 | 5,787 |
| 2023-24 | 2,096 | 35.6 | 63 | 1.1 | 5,889 |
Source: Correctional Service of Canada.
| Fiscal year | Day parole | % | Full parole | % | Total female releases |
|---|---|---|---|---|---|
| 2014-15 | 185 | 42.0 | 20 | 4.5 | 441 |
| 2015-16 | 207 | 41.1 | 18 | 3.6 | 504 |
| 2016-17 | 282 | 50.2 | 24 | 4.3 | 562 |
| 2017-18 | 321 | 56.5 | 20 | 3.5 | 568 |
| 2018-19 | 314 | 57.3 | 15 | 2.7 | 548 |
| 2019-20 | 293 | 54.4 | 9 | 1.7 | 539 |
| 2020-21 | 237 | 50.1 | 12 | 2.5 | 473 |
| 2021-22 | 252 | 52.0 | 5 | 1.0 | 485 |
| 2022-23 | 241 | 52.3 | 3 | 0.7 | 461 |
| 2023-24 | 264 | 51.1 | 6 | 1.2 | 517 |
Source: Correctional Service of Canada.
| Fiscal year | Day parole | % | Full parole | % | Total releases |
|---|---|---|---|---|---|
| 2014-15 | 1,975 | 26.2 | 185 | 2.5 | 7,532 |
| 2015-16 | 2,130 | 28.0 | 178 | 2.3 | 7,616 |
| 2016-17 | 2,527 | 33.4 | 167 | 2.2 | 7,577 |
| 2017-18 | 2,622 | 36.2 | 208 | 2.9 | 7,250 |
| 2018-19 | 2,683 | 38.0 | 208 | 2.9 | 7,064 |
| 2019-20 | 2,541 | 36.0 | 164 | 2.3 | 7,061 |
| 2020-21 | 2,313 | 35.4 | 103 | 1.6 | 6,537 |
| 2021-22 | 1,961 | 30.7 | 62 | 1.0 | 6,398 |
| 2022-23 | 2,153 | 34.5 | 59 | 0.9 | 6,248 |
| 2023-24 | 2,360 | 36.8 | 69 | 1.1 | 6,406 |
Source: Correctional Service of Canada.
Table D2 Notes
All releases include: Conditional releases of day parole, full parole or statutory release.
The data include all releases from a federal institution or Healing Lodge in a given fiscal year excluding offenders with quashed sentences, offenders who died in custody, LTSO releases, offenders released at warrant expiry, and offenders transferred to foreign countries. An offender may be released more than once during the reporting timeframe in cases where a previous release was subject to revocation, suspension, temporary detention, interruption, or in cases where an offender served more than one sentence.
Day parole is a type of conditional release granted by the Parole Board of Canada whereby offenders are permitted to participate in community-based activities in preparation for full parole or statutory release. The conditions require offenders to return nightly to an institution or halfway house unless otherwise authorized by the Parole Board of Canada.
Full parole is a type of conditional release granted by the Parole Board of Canada whereby the remainder of the sentence is served under supervision in the community.
Percentage is calculated based on the number of day and full paroles compared to the total releases for each offender group.
Reported year periods reflect fiscal years. A fiscal year runs from April 1 to March 31 of the following year.
Federal day and full parole grant rates by gender: 10-year trend
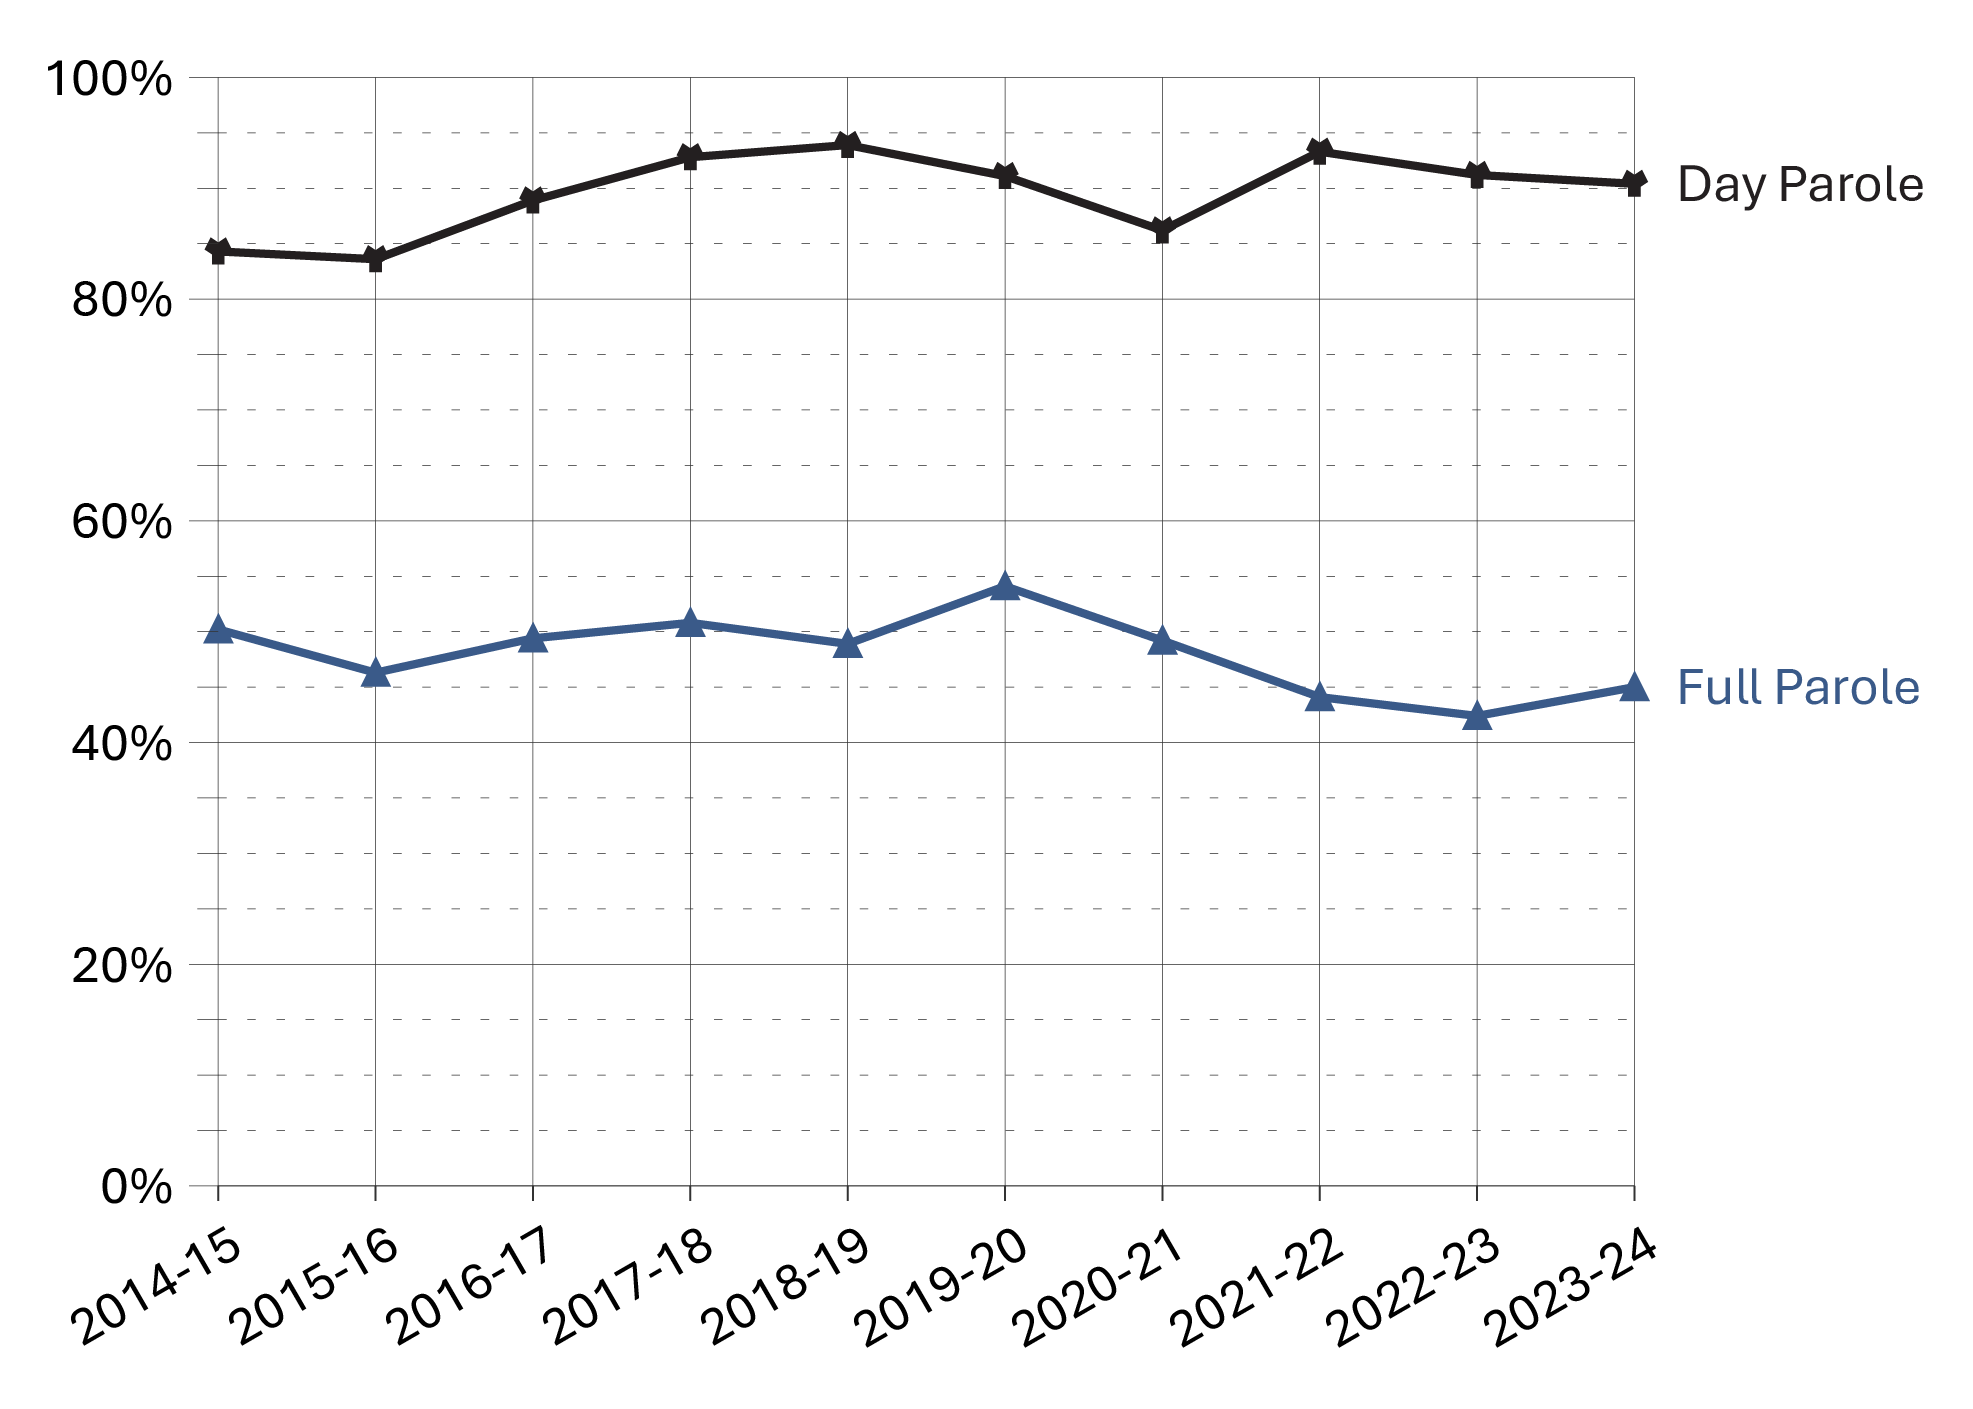
Image description
Line graph showing the grant rates of federal day parole and full parole among women over a ten year period from fiscal year 2014-15 to 2023-24. Day parole grant rates have remained consistently more common than full parole grant rates over time. Full data are available in the table below.
Source: Parole Board of Canada.
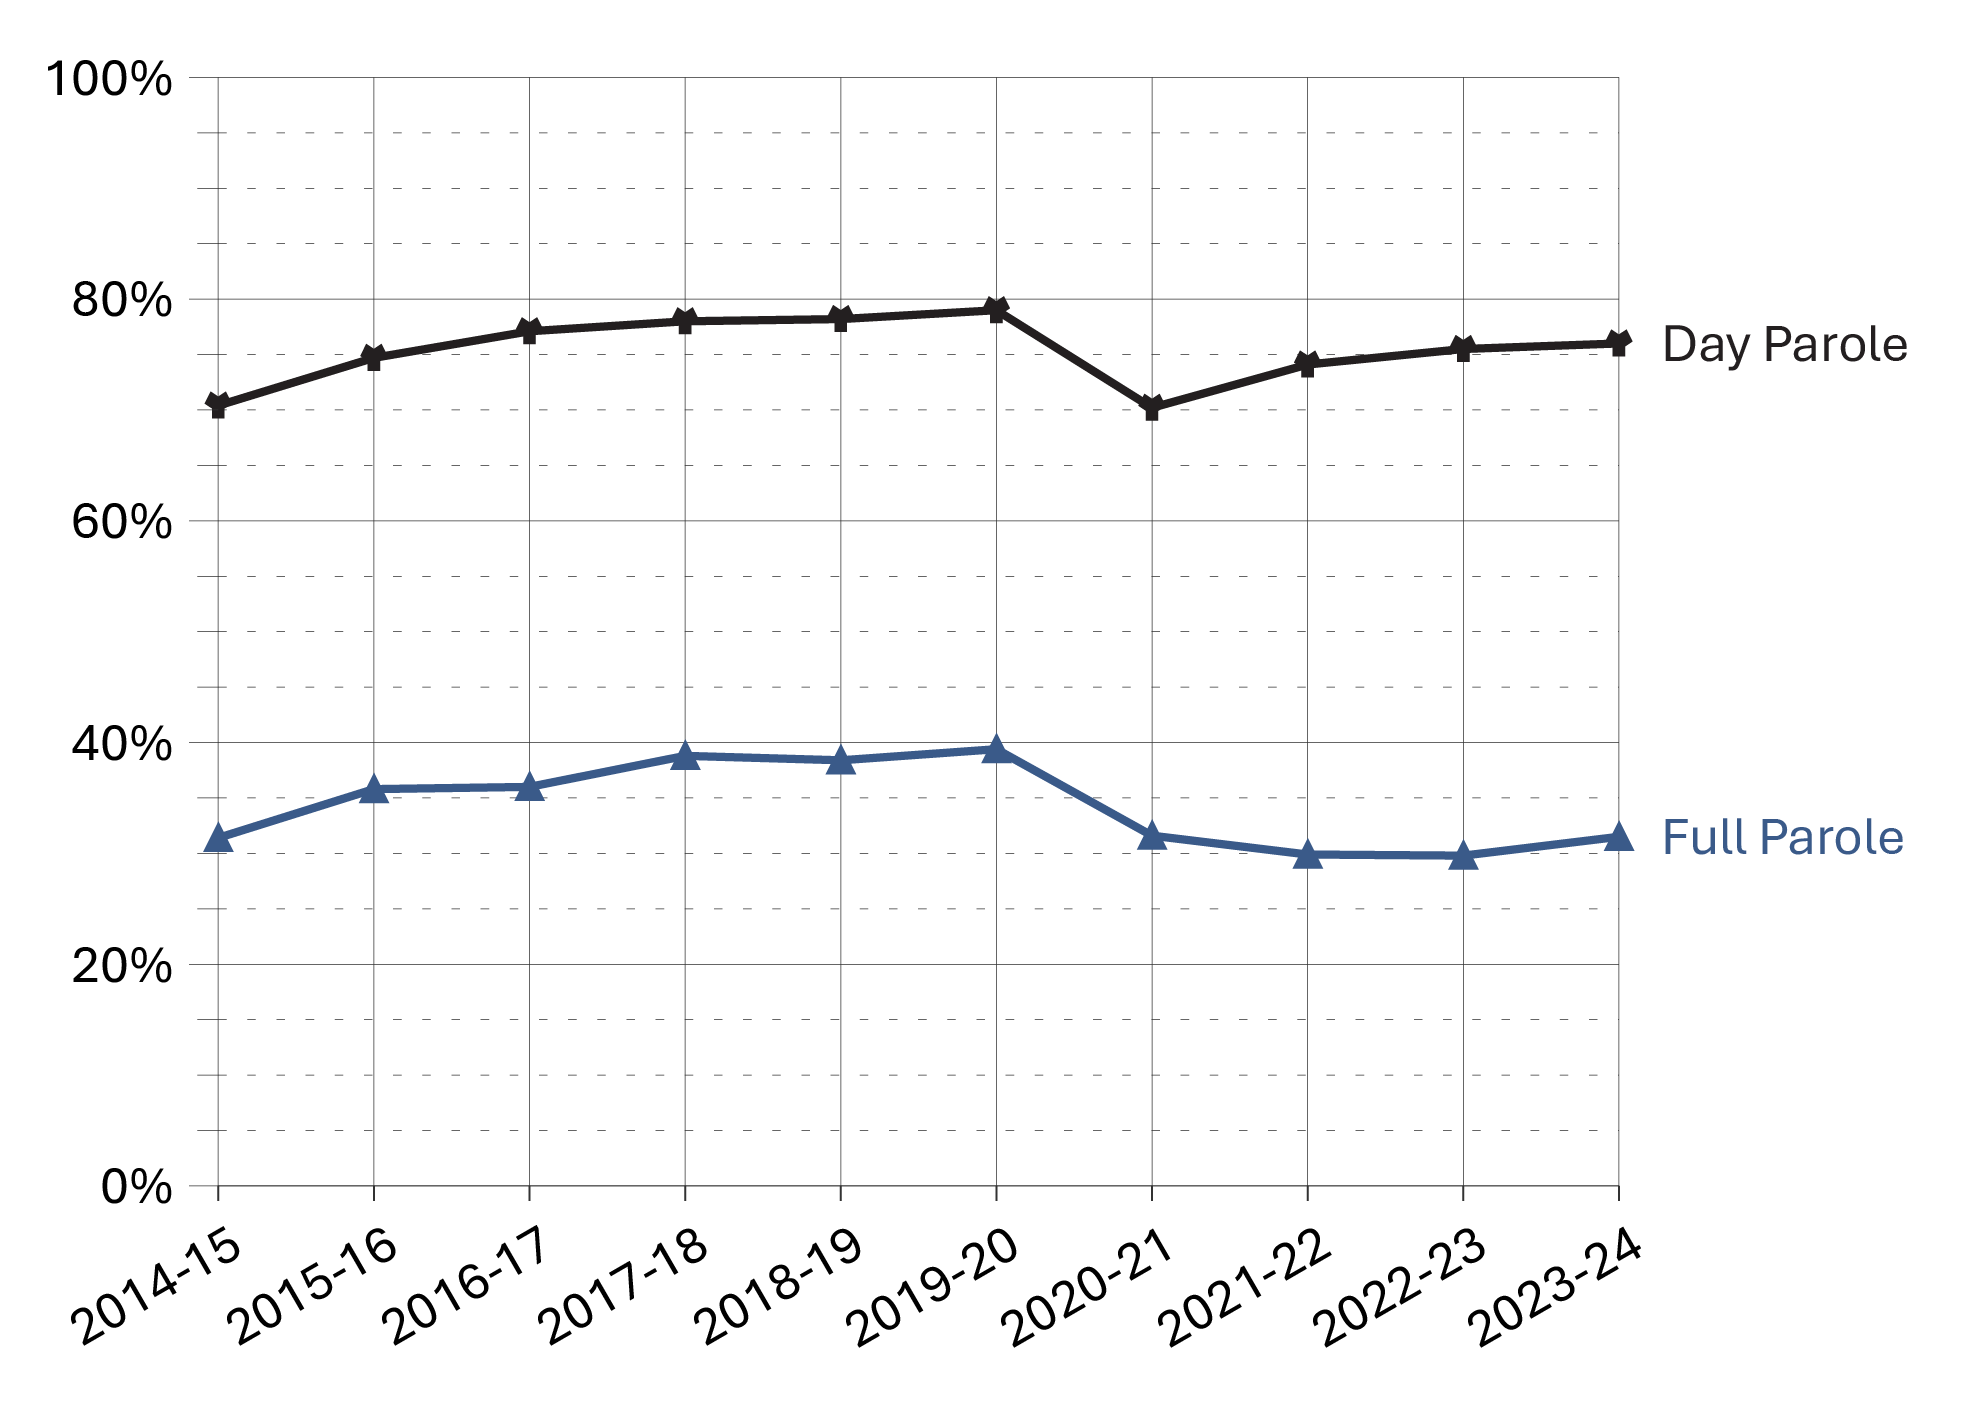
Image description
Line graph showing the grant rates of federal day parole and full parole among men over a ten year period from fiscal year 2014-15 to 2023-24. Day parole grant rates have remained consistently more common than full parole grant rates over time. Full data are available in the table below.
Source: Parole Board of Canada.
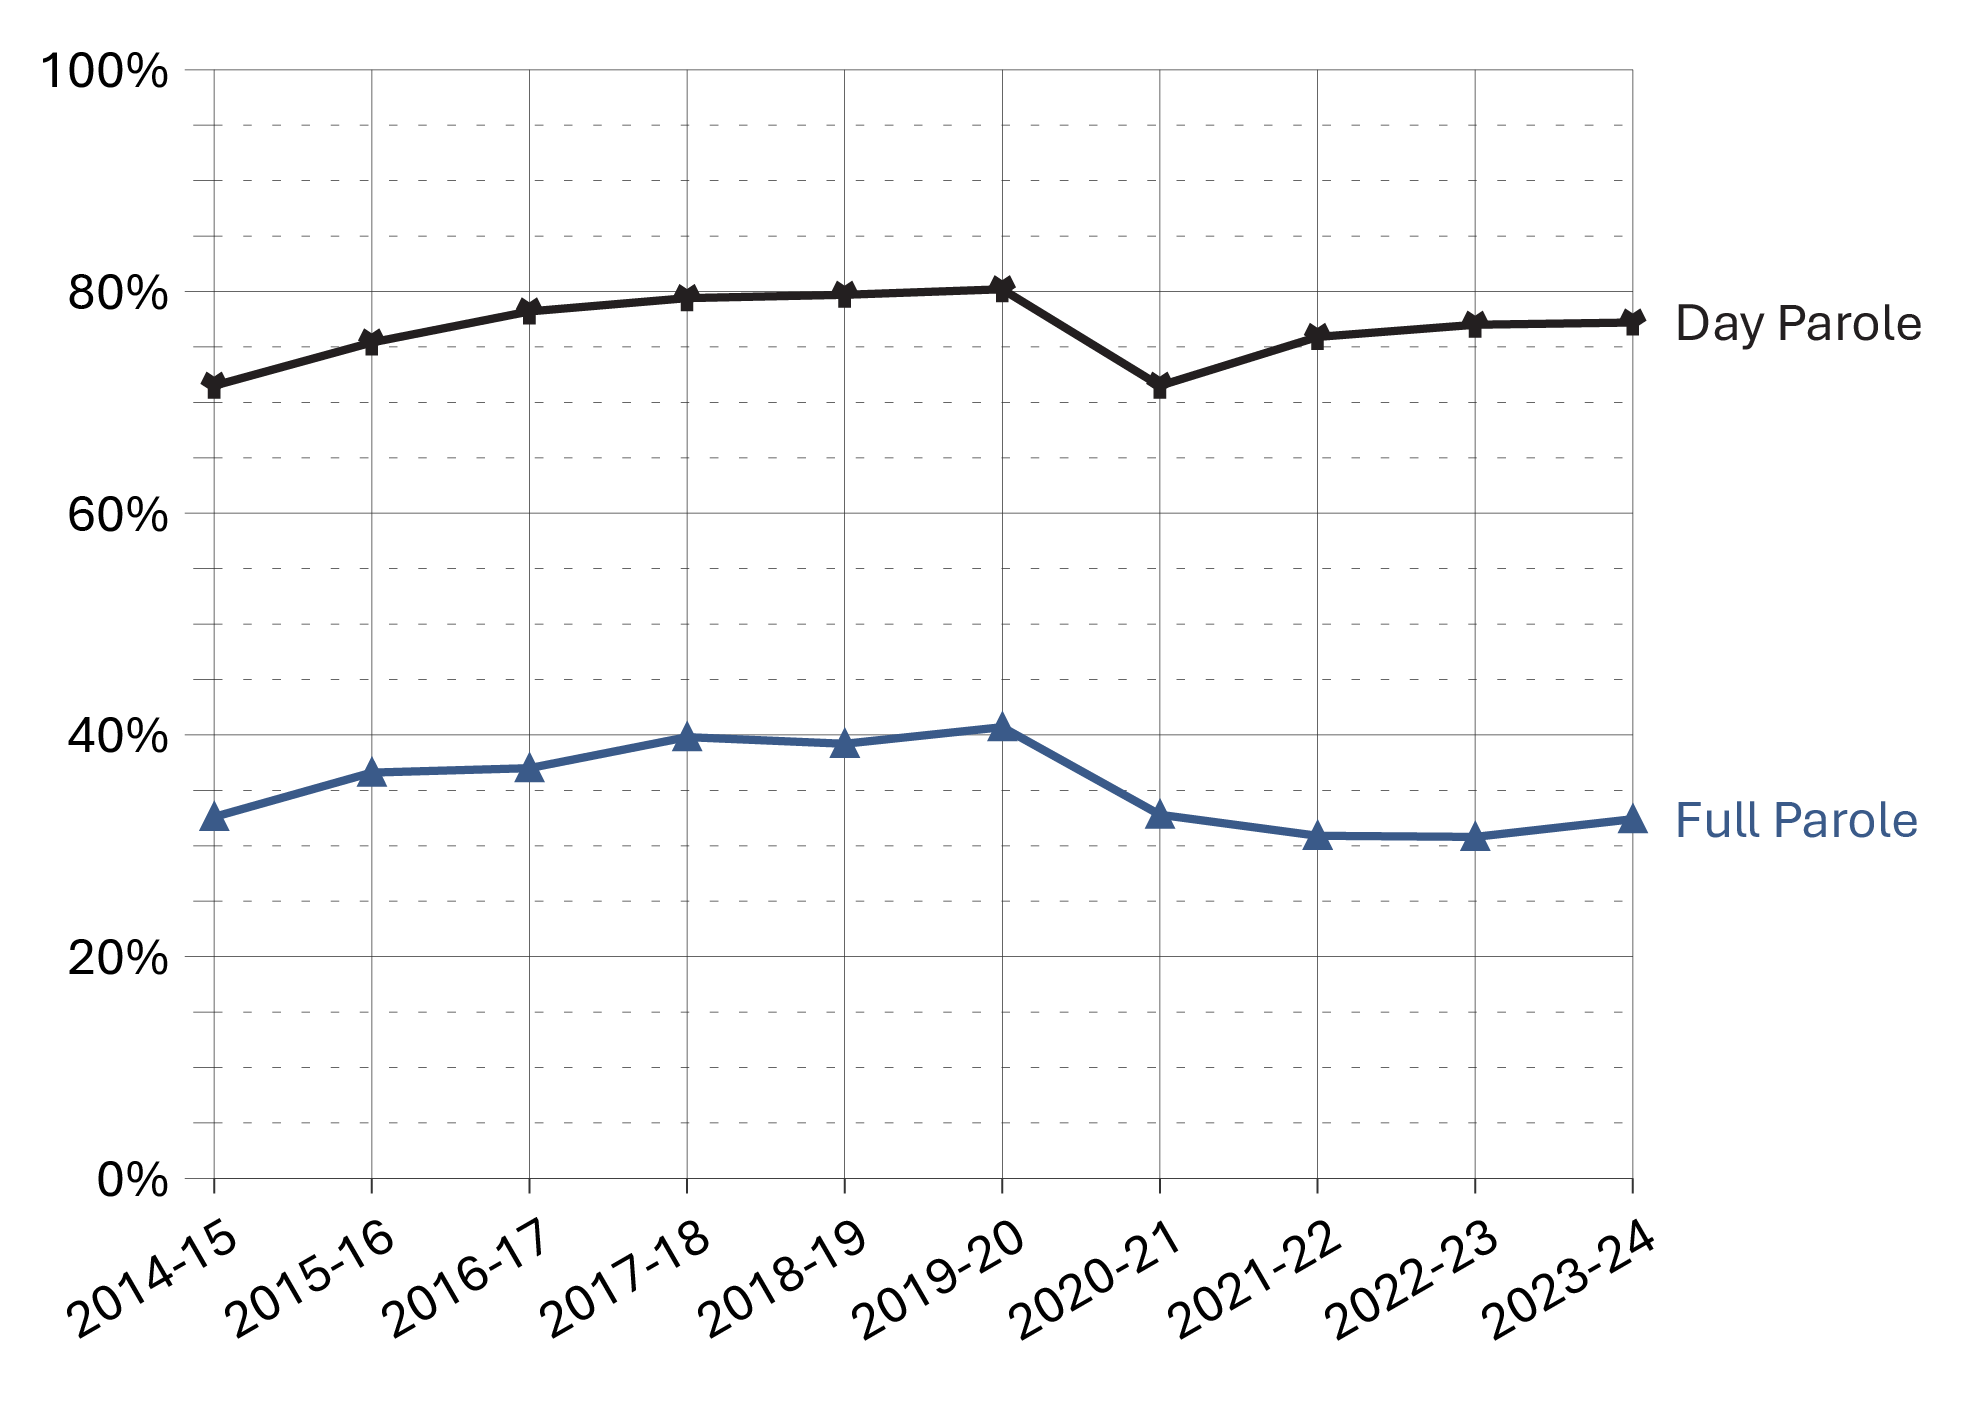
Image description
Line graph showing the grant rates of federal day parole and full parole among offenders over a ten year period from fiscal year 2014-15 to 2023-24. Day parole grant rates have remained consistently more common than full parole grant rates over time. These rates have remained relatively consistent overtime. Full data are available in the table below.
Source: Parole Board of Canada.
- In 2023-24, the federal day parole grant rateFootnote * remained stable (77.2%, +0.2%) compared to the previous fiscal year.
- In 2023-24, the federal full parole grant rateFootnote * increased slightly (32.4%, +1.7%) compared to the previous fiscal year.
- Over the past 10 fiscal years (from 2014-15 to 2023-24), women offenders had a much higher grant rateFootnote * of federal day parole and full parole (89.9% and 48.3%) than men offenders (75.4% and 34.3%).
| Fiscal year | Granted: Women | Denied: Women | Grant rateFootnote *: Women (%) | Granted: Men | Denied: Men | Grant rateFootnote *: Men (%) | Grant rateFootnote *: Total (%) |
|---|---|---|---|---|---|---|---|
| 2014-15 | 301 | 56 | 84.3 | 3,056 | 1,283 | 70.4 | 71.5 |
| 2015-16 | 305 | 60 | 83.6 | 3,164 | 1,074 | 74.7 | 75.4 |
| 2016-17 | 417 | 52 | 88.9 | 3,507 | 1,039 | 77.1 | 78.2 |
| 2017-18 | 462 | 36 | 92.8 | 3,687 | 1,039 | 78.0 | 79.4 |
| 2018-19 | 481 | 31 | 93.9 | 3,780 | 1,051 | 78.2 | 79.7 |
| 2019-20 | 448 | 44 | 91.1 | 3,623 | 963 | 79.0 | 80.2 |
| 2020-21 | 363 | 58 | 86.2 | 3,422 | 1,451 | 70.2 | 71.5 |
| 2021-22 | 391 | 28 | 93.3 | 2,932 | 1,027 | 74.1 | 75.9 |
| 2022-23 | 412 | 40 | 91.2 | 3,234 | 1,052 | 75.5 | 77.0 |
| 2023-24 | 395 | 42 | 90.4 | 3,538 | 1,120 | 76.0 | 77.2 |
Source: Parole Board of Canada.
| Fiscal year | Granted: Women | Denied: Women | Grant rateFootnote *: Women (%) | Granted: Men | Denied: Men | Grant rateFootnote *: Men (%) | Grant rateFootnote *: Total (%) |
|---|---|---|---|---|---|---|---|
| 2014-15 | 111 | 110 | 50.2 | 1,064 | 2,320 | 31.4 | 32.6 |
| 2015-16 | 118 | 137 | 46.3 | 1,207 | 2,163 | 35.8 | 36.6 |
| 2016-17 | 161 | 165 | 49.4 | 1,336 | 2,379 | 36.0 | 37.0 |
| 2017-18 | 187 | 181 | 50.8 | 1,490 | 2,355 | 38.8 | 39.8 |
| 2018-19 | 171 | 179 | 48.9 | 1,503 | 2,416 | 38.4 | 39.2 |
| 2019-20 | 198 | 168 | 54.1 | 1,429 | 2,199 | 39.4 | 40.7 |
| 2020-21 | 149 | 154 | 49.2 | 1,309 | 2,828 | 31.6 | 32.8 |
| 2021-22 | 119 | 151 | 44.1 | 977 | 2,296 | 29.9 | 30.9 |
| 2022-23 | 120 | 163 | 42.4 | 1,036 | 2,440 | 29.8 | 30.8 |
| 2023-24 | 122 | 149 | 45.0 | 1,138 | 2,477 | 31.5 | 32.4 |
Source: Parole Board of Canada.
Table D3 Notes
Federal day and full parole grant rates by Indigenous and non-Indigenous offenders: 10-year trend
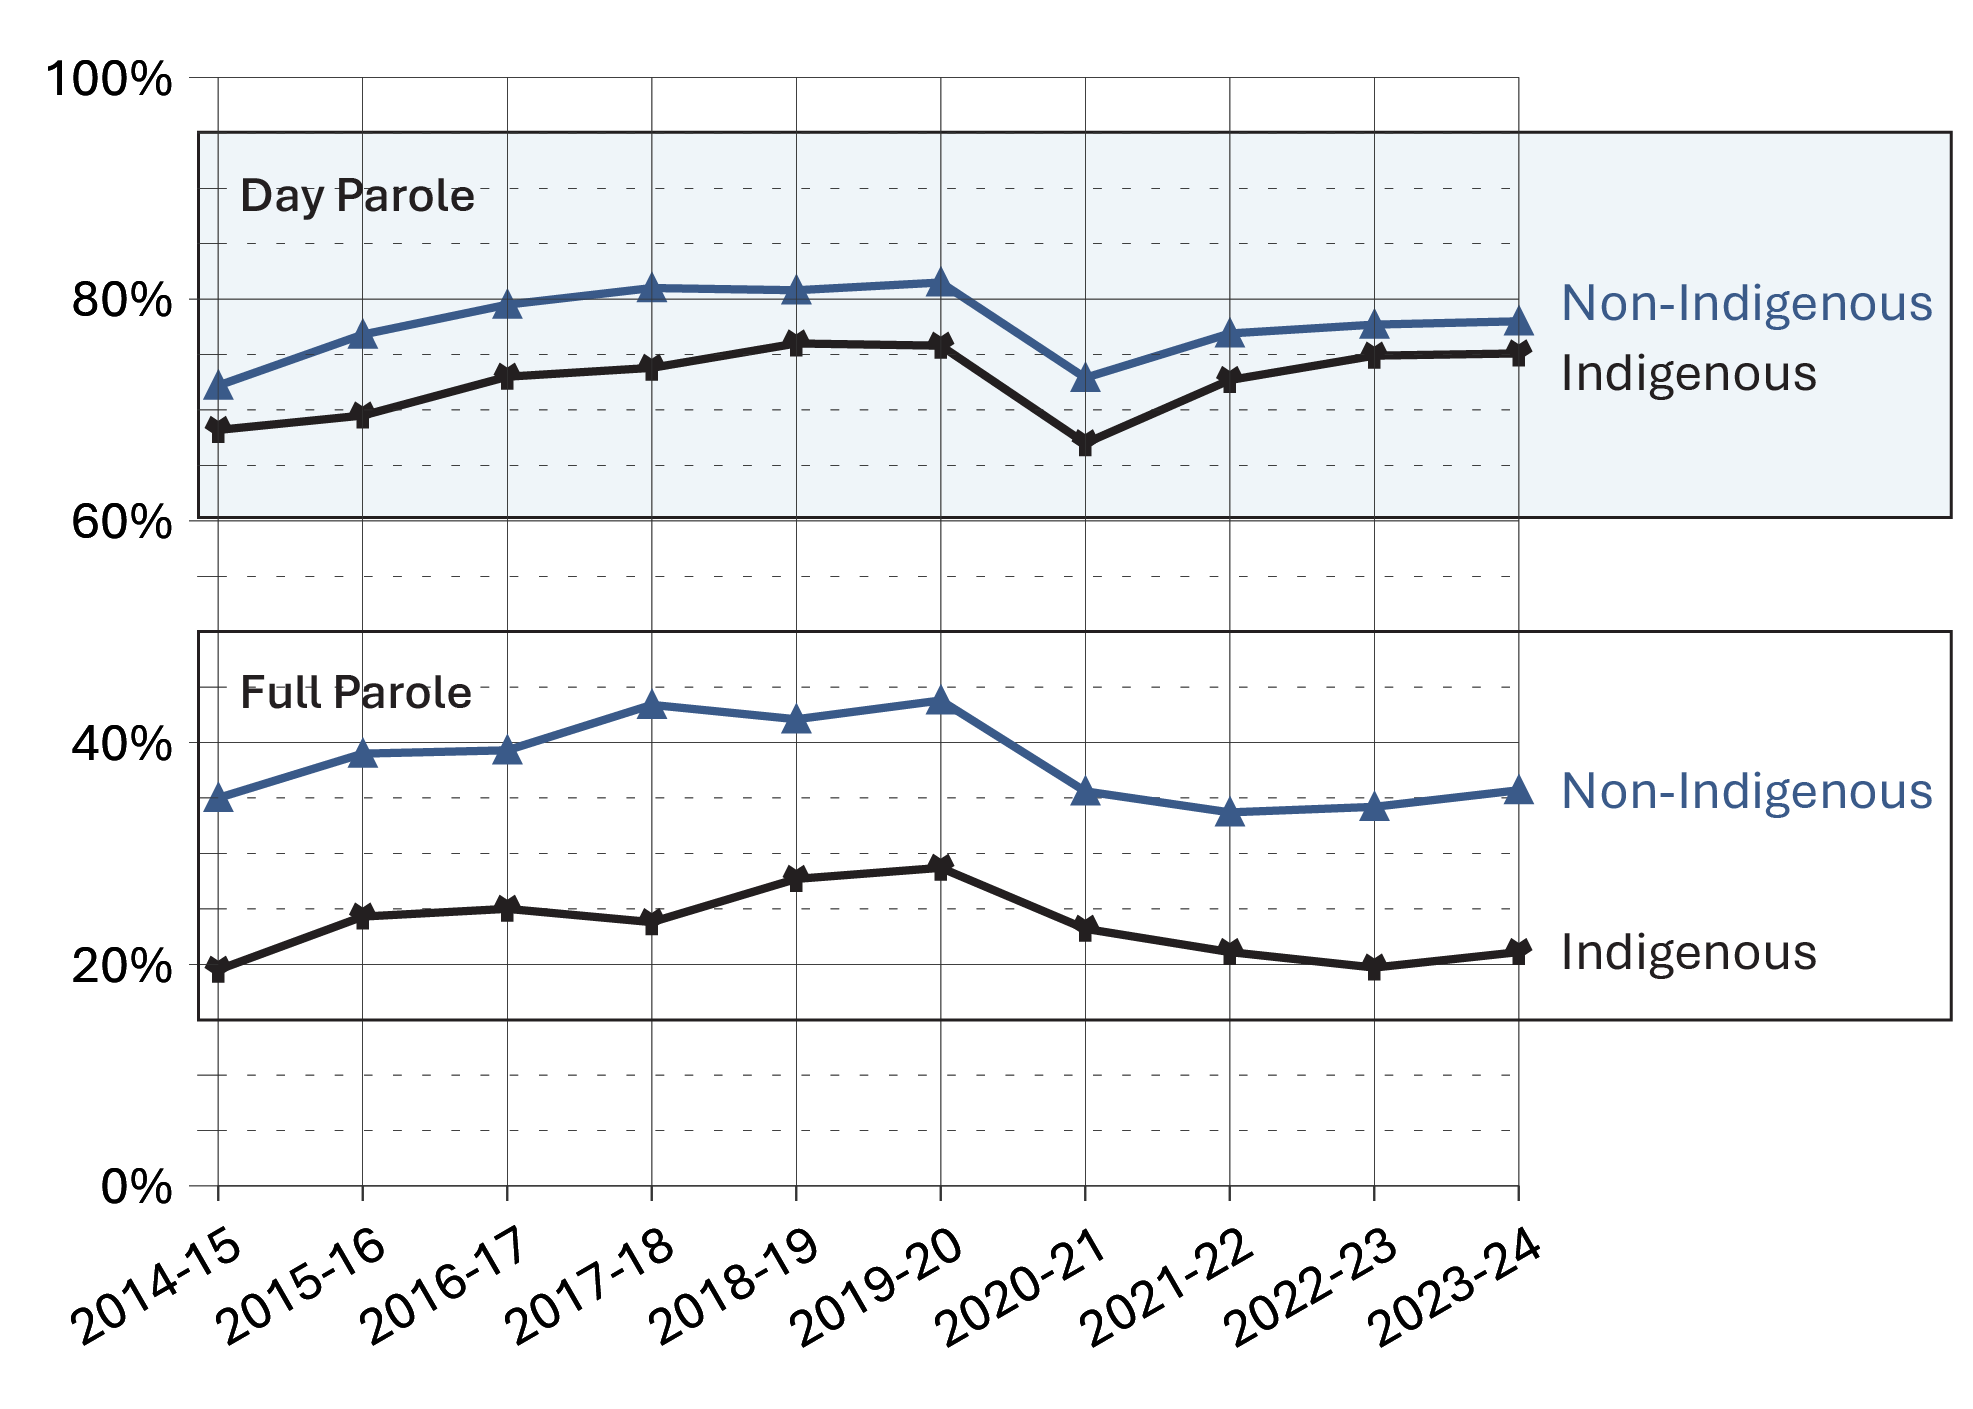
Image description
Line graph showing the grant rates of federal day and full parole by Indigenous and non-Indigenous offenders over a ten year period from fiscal year 2014-15 to 2023-24. Day parole grant rates are consistently higher for both Indigenous and non-Indigenous offenders. Full parole is granted at a slightly higher rate for non-Indigenous offenders compared to their Indigenous counterparts. Full data are available in the table below.
Source: Parole Board of Canada.
- In 2023-24, the federal day parole grant rate remained stable for both Indigenous (75.1%; +0.2%) and non-Indigenous offenders (78.0%; +0.3%) compared to 2022-23.
- In 2023-24, the federal full parole grant rate increased slightly for both Indigenous (21.1%; +1.4%) and non-Indigenous offenders (35.7%; +1.6%) compared to 2022-23.
- For each of the past 10 fiscal years (from 2014-15 to 2023-24), lower federal day and full parole grant rates have been reported for Indigenous offenders than for non-Indigenous offenders.
| Race group | 2014-15 | 2015-16 | 2016-17 | 2017-18 | 2018-19 | 2019-20 | 2020-21 | 2021-22 | 2022-23 | 2023-24 |
|---|---|---|---|---|---|---|---|---|---|---|
| Indigenous grant rate (%) | 68.2 | 69.5 | 73.0 | 73.8 | 76.0 | 75.8 | 67.0 | 72.7 | 74.9 | 75.1 |
Granted (#) |
581 | 626 | 731 | 838 | 943 | 917 | 881 | 787 | 927 | 1,023 |
Denied (#) |
271 | 275 | 271 | 298 | 297 | 292 | 433 | 296 | 311 | 340 |
| Asian grant rate (%) | 76.2 | 78.1 | 82.8 | 82.4 | 84.0 | 82.1 | 75.4 | 82.2 | 85.1 | 82.4 |
Granted (#) |
250 | 236 | 270 | 263 | 263 | 256 | 242 | 221 | 274 | 267 |
Denied (#) |
78 | 66 | 56 | 56 | 50 | 56 | 79 | 48 | 48 | 57 |
| Black grant rate (%) | 69.7 | 71.0 | 76.1 | 73.3 | 78.2 | 76.2 | 67.5 | 71.0 | 72.1 | 74.6 |
Granted (#) |
223 | 252 | 245 | 266 | 295 | 311 | 291 | 259 | 263 | 312 |
Denied (#) |
97 | 103 | 77 | 97 | 82 | 97 | 140 | 106 | 102 | 106 |
| Caucasian grant rate (%) | 72.3 | 77.3 | 79.5 | 81.7 | 80.9 | 81.8 | 73.1 | 77.5 | 77.5 | 77.9 |
Granted (#) |
2,234 | 2,246 | 2,504 | 2,605 | 2,619 | 2,430 | 2,240 | 1,940 | 2,031 | 2,162 |
Denied (#) |
857 | 660 | 644 | 584 | 620 | 539 | 823 | 564 | 588 | 612 |
| Other grant rate (%) | 65.7 | 78.6 | 79.8 | 81.6 | 80.2 | 87.4 | 78.7 | 73.0 | 77.6 | 78.2 |
Granted (#) |
71 | 110 | 174 | 177 | 142 | 159 | 133 | 116 | 152 | 176 |
Denied (#) |
37 | 30 | 44 | 40 | 35 | 23 | 36 | 43 | 44 | 49 |
| Total day parole grant rate (%) | 71.5 | 75.4 | 78.2 | 79.4 | 79.7 | 80.2 | 71.5 | 75.9 | 76.9 | 77.2 |
Total granted (#) |
3,359 | 3,470 | 3,924 | 4,149 | 4,262 | 4,073 | 3,787 | 3,323 | 3,647 | 3,940 |
Total denied (#) |
1,340 | 1,134 | 1,092 | 1,075 | 1,084 | 1,007 | 1,511 | 1,057 | 1,093 | 1,164 |
Source: Parole Board of Canada.
| Race group | 2014-15 | 2015-16 | 2016-17 | 2017-18 | 2018-19 | 2019-20 | 2020-21 | 2021-22 | 2022-23 | 2023-24 |
|---|---|---|---|---|---|---|---|---|---|---|
| Indigenous grant rate (%) | 19.5 | 24.3 | 25.0 | 23.8 | 27.7 | 28.7 | 23.2 | 21.1 | 19.7 | 21.1 |
Granted (#) |
111 | 144 | 161 | 182 | 237 | 232 | 229 | 166 | 175 | 186 |
Denied (#) |
458 | 449 | 482 | 583 | 618 | 576 | 760 | 621 | 715 | 696 |
| Asian grant rate (%) | 47.2 | 48.2 | 51.1 | 52.9 | 49.5 | 49.5 | 44.5 | 41.2 | 45.4 | 49.6 |
Granted (#) |
153 | 122 | 160 | 164 | 158 | 147 | 141 | 101 | 118 | 141 |
Denied (#) |
171 | 131 | 154 | 146 | 161 | 150 | 176 | 144 | 142 | 143 |
| Black grant rate (%) | 39.6 | 37.8 | 39.9 | 43.6 | 38.7 | 44.0 | 36.2 | 33.7 | 33.1 | 28.4 |
Granted (#) |
113 | 129 | 110 | 144 | 121 | 155 | 150 | 121 | 111 | 98 |
Denied (#) |
172 | 212 | 166 | 186 | 192 | 197 | 264 | 238 | 224 | 247 |
| Caucasian grant rate (%) | 33.0 | 37.6 | 37.6 | 41.5 | 41.3 | 42.7 | 33.6 | 32.6 | 33.1 | 35.2 |
Granted (#) |
768 | 870 | 979 | 1,079 | 1,072 | 1,010 | 858 | 652 | 693 | 767 |
Denied (#) |
1,562 | 1,441 | 1,626 | 1,522 | 1,524 | 1,357 | 1,695 | 1,349 | 1,398 | 1,413 |
| Other grant rate (%) | 30.6 | 47.2 | 42.6 | 52.2 | 46.0 | 48.8 | 47.1 | 36.4 | 31.9 | 34.5 |
Granted (#) |
30 | 60 | 87 | 108 | 86 | 83 | 80 | 56 | 59 | 70 |
Denied (#) |
68 | 67 | 117 | 99 | 101 | 87 | 90 | 98 | 126 | 133 |
| Total full parole grant rate (%) | 32.6 | 36.6 | 37.0 | 39.8 | 39.2 | 40.7 | 32.8 | 30.9 | 30.7 | 32.4 |
Total granted (#) |
1,175 | 1,325 | 1,497 | 1,677 | 1,674 | 1,627 | 1,458 | 1,096 | 1,156 | 1,262 |
Total denied (#) |
2,431 | 2,300 | 2,545 | 2,536 | 2,596 | 2,367 | 2,985 | 2,450 | 2,605 | 2,632 |
Source: Parole Board of Canada.
Table D4 Notes
Number of Culturally Responsive Hearings: 10-year trend
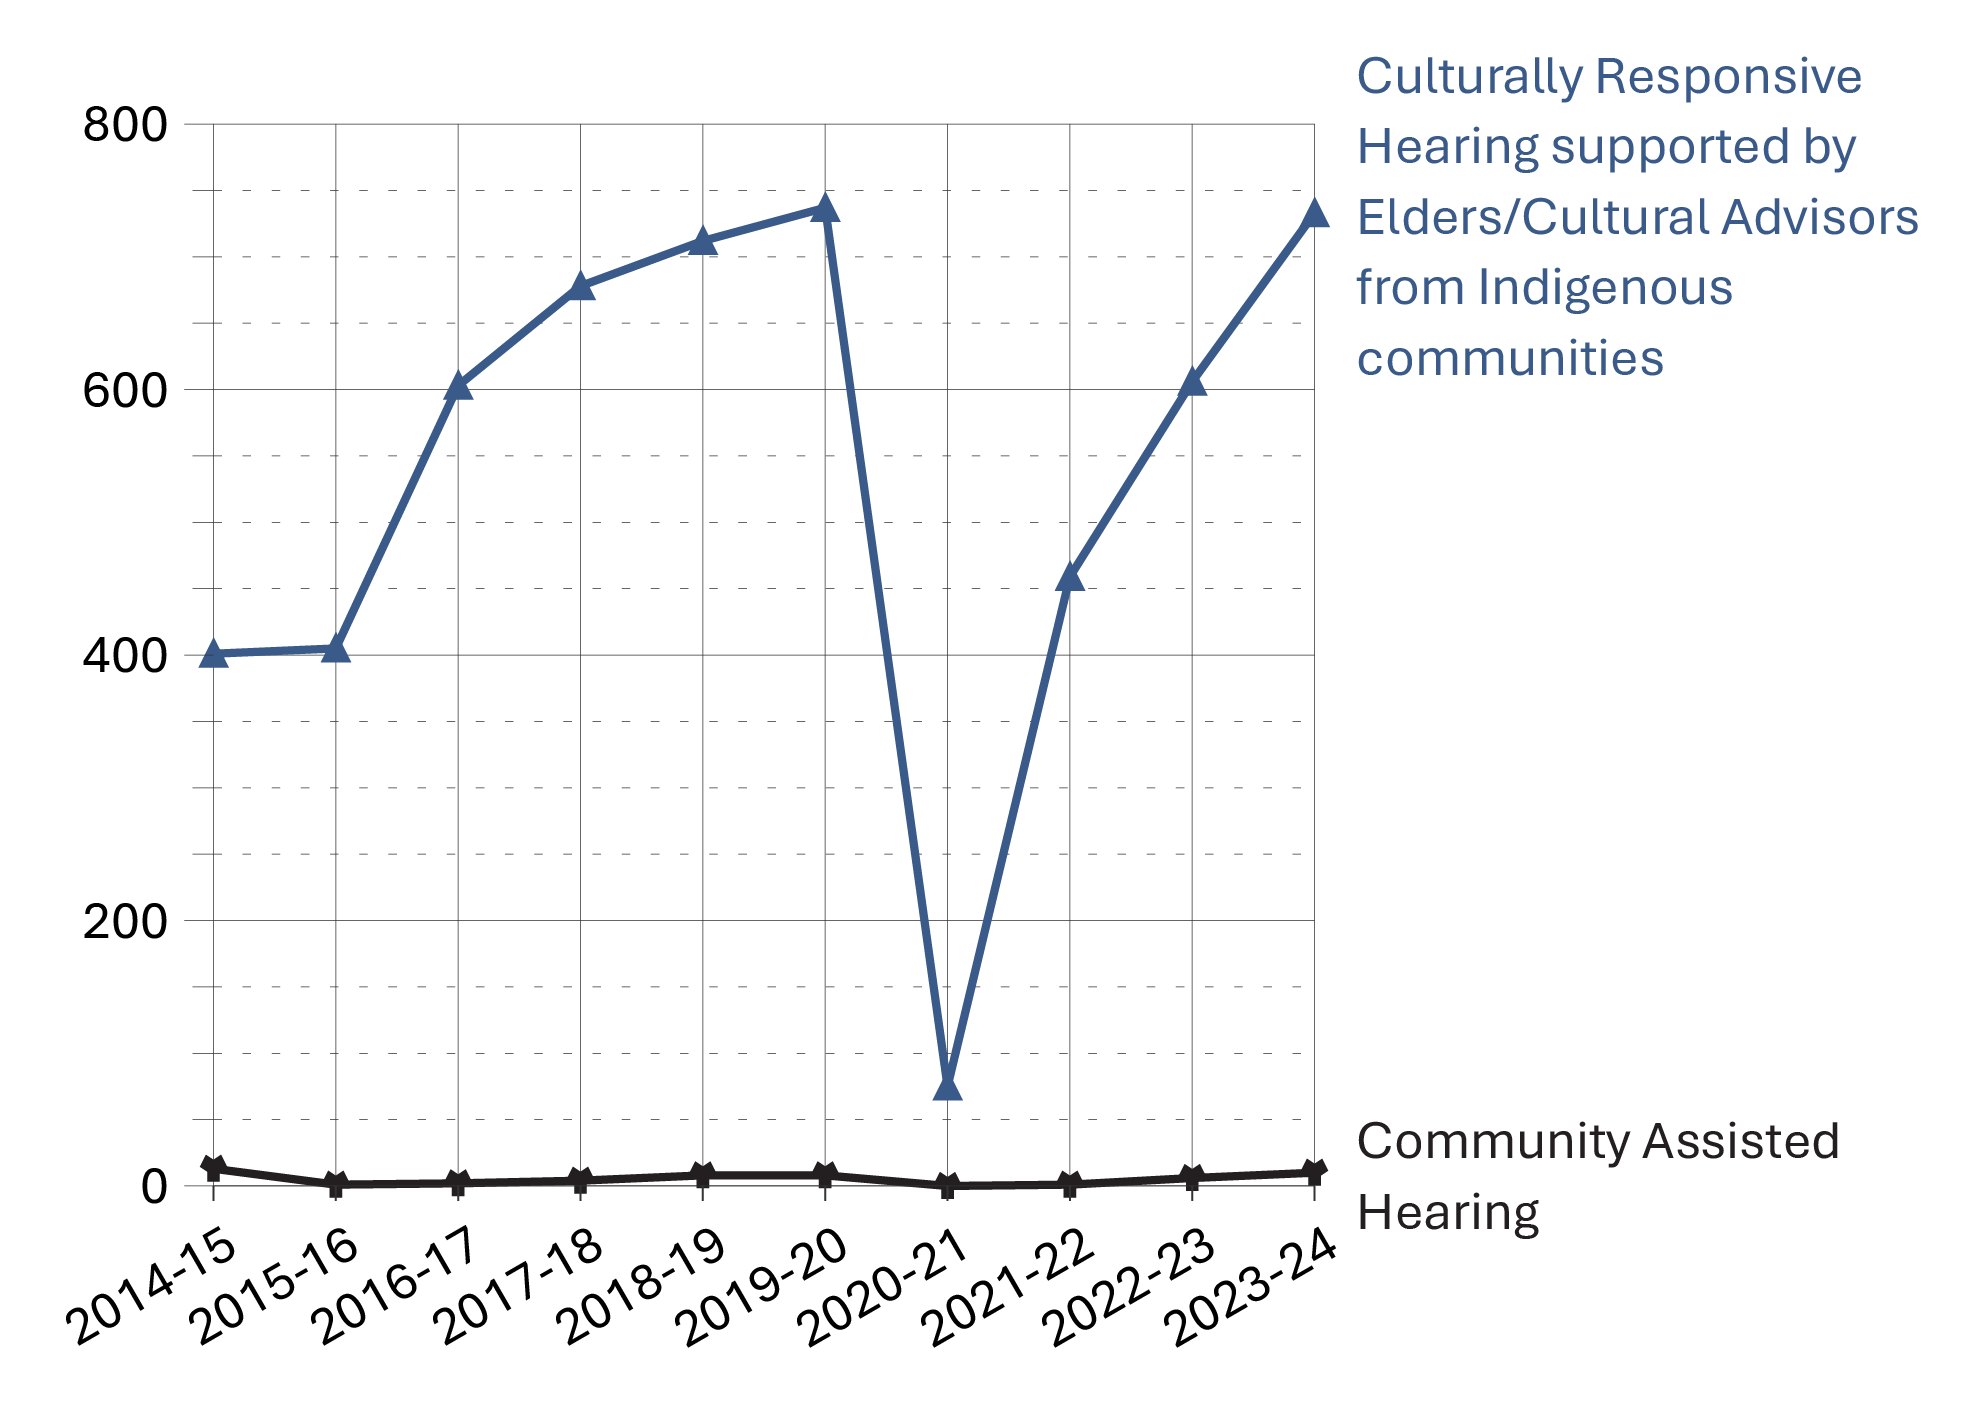
Image description
Line graph showing the number of Culturally Responsive Elder-Assisted parole hearings and Community Assisted hearings, over a ten year period from fiscal year 2014-15 to 2023-24. Over time, Elder-Assisted hearings were more frequent. In fiscal year 2020-21, there was a sharp decline in Elder-Assisted hearings, although rates have risen to previous levels in 2023-24. Full data are available in the table below.
Source: Parole Board of Canada.
- After reporting a decrease of 89.9% in 2020-21 due to health and safety measures put in place to respond to the COVID-19 pandemic, the number of federal Community Assisted and Culturally Responsive Hearings supported by Elders/Cultural Advisors from Indigenous communities increased significantly in 2021-22 (to 460 from 75). In 2023-24, the number of Community-Assisted and Culturally Responsive Hearings supported by Elders/Cultural Advisors from Indigenous communities further increased to 743, reaching pre-pandemic levels.
- In the 10-year period from 2014-15 to 2023-24, the number of Community-Assisted and Culturally Responsive Hearings supported by Elders/Cultural Advisors from Indigenous communities has increased by 79.5%.
| Fiscal year | Community Assisted Hearings | Culturally Responsive Hearings supported by Elders/Cultural Advisors from Indigenous communities |
|---|---|---|
| 2014-15 | 13 | 401 |
| 2015-16 | 1 | 405 |
| 2016-17 | 2 | 603 |
| 2017-18 | 4 | 678 |
| 2018-19 | 8 | 712 |
| 2019-20 | 8 | 737 |
| 2020-21 | 0 | 75 |
| 2021-22 | 1 | 459 |
| 2022-23 | 6 | 606 |
| 2023-24 | 10 | 733 |
Source: Parole Board of Canada.
Table D5 Notes
Per section 9.1.1 of the Parole Board of Canada's Decision-Making Policy Manual, the objective of Culturally Responsive Hearings is to provide an adapted hearing processes for Indigenous and Black offenders that adhere to the decision-making criteria set out in law.
Community Assisted: A Culturally Responsive Hearing that involves the application of Section 84 of the Corrections and Conditional Release Act and allows members of the Indigenous community where the offender's release is being proposed to participate. Community Assisted Hearings are generally conducted in the community.
In June 2022, to address the over-representation of Black individuals in the criminal justice system, the PBC introduced a pilot project based out of the Atlantic region to offer Culturally Responsive Hearings (CRHs) supported by Cultural Advisors from Black communities. In January 2024, the PBC implemented CRHs supported by Cultural Advisors from Black communities across all regions. In 2023-24, there were 23 CRHs supported by Cultural Advisors from Black communities, an increase from the 18 held in 2022-23 during the first fiscal year of the pilot.
Reported year periods reflect fiscal years. A fiscal year runs from April 1 to March 31 of the following year.
Proportion of sentence served prior to being released on parole: 10-year trend
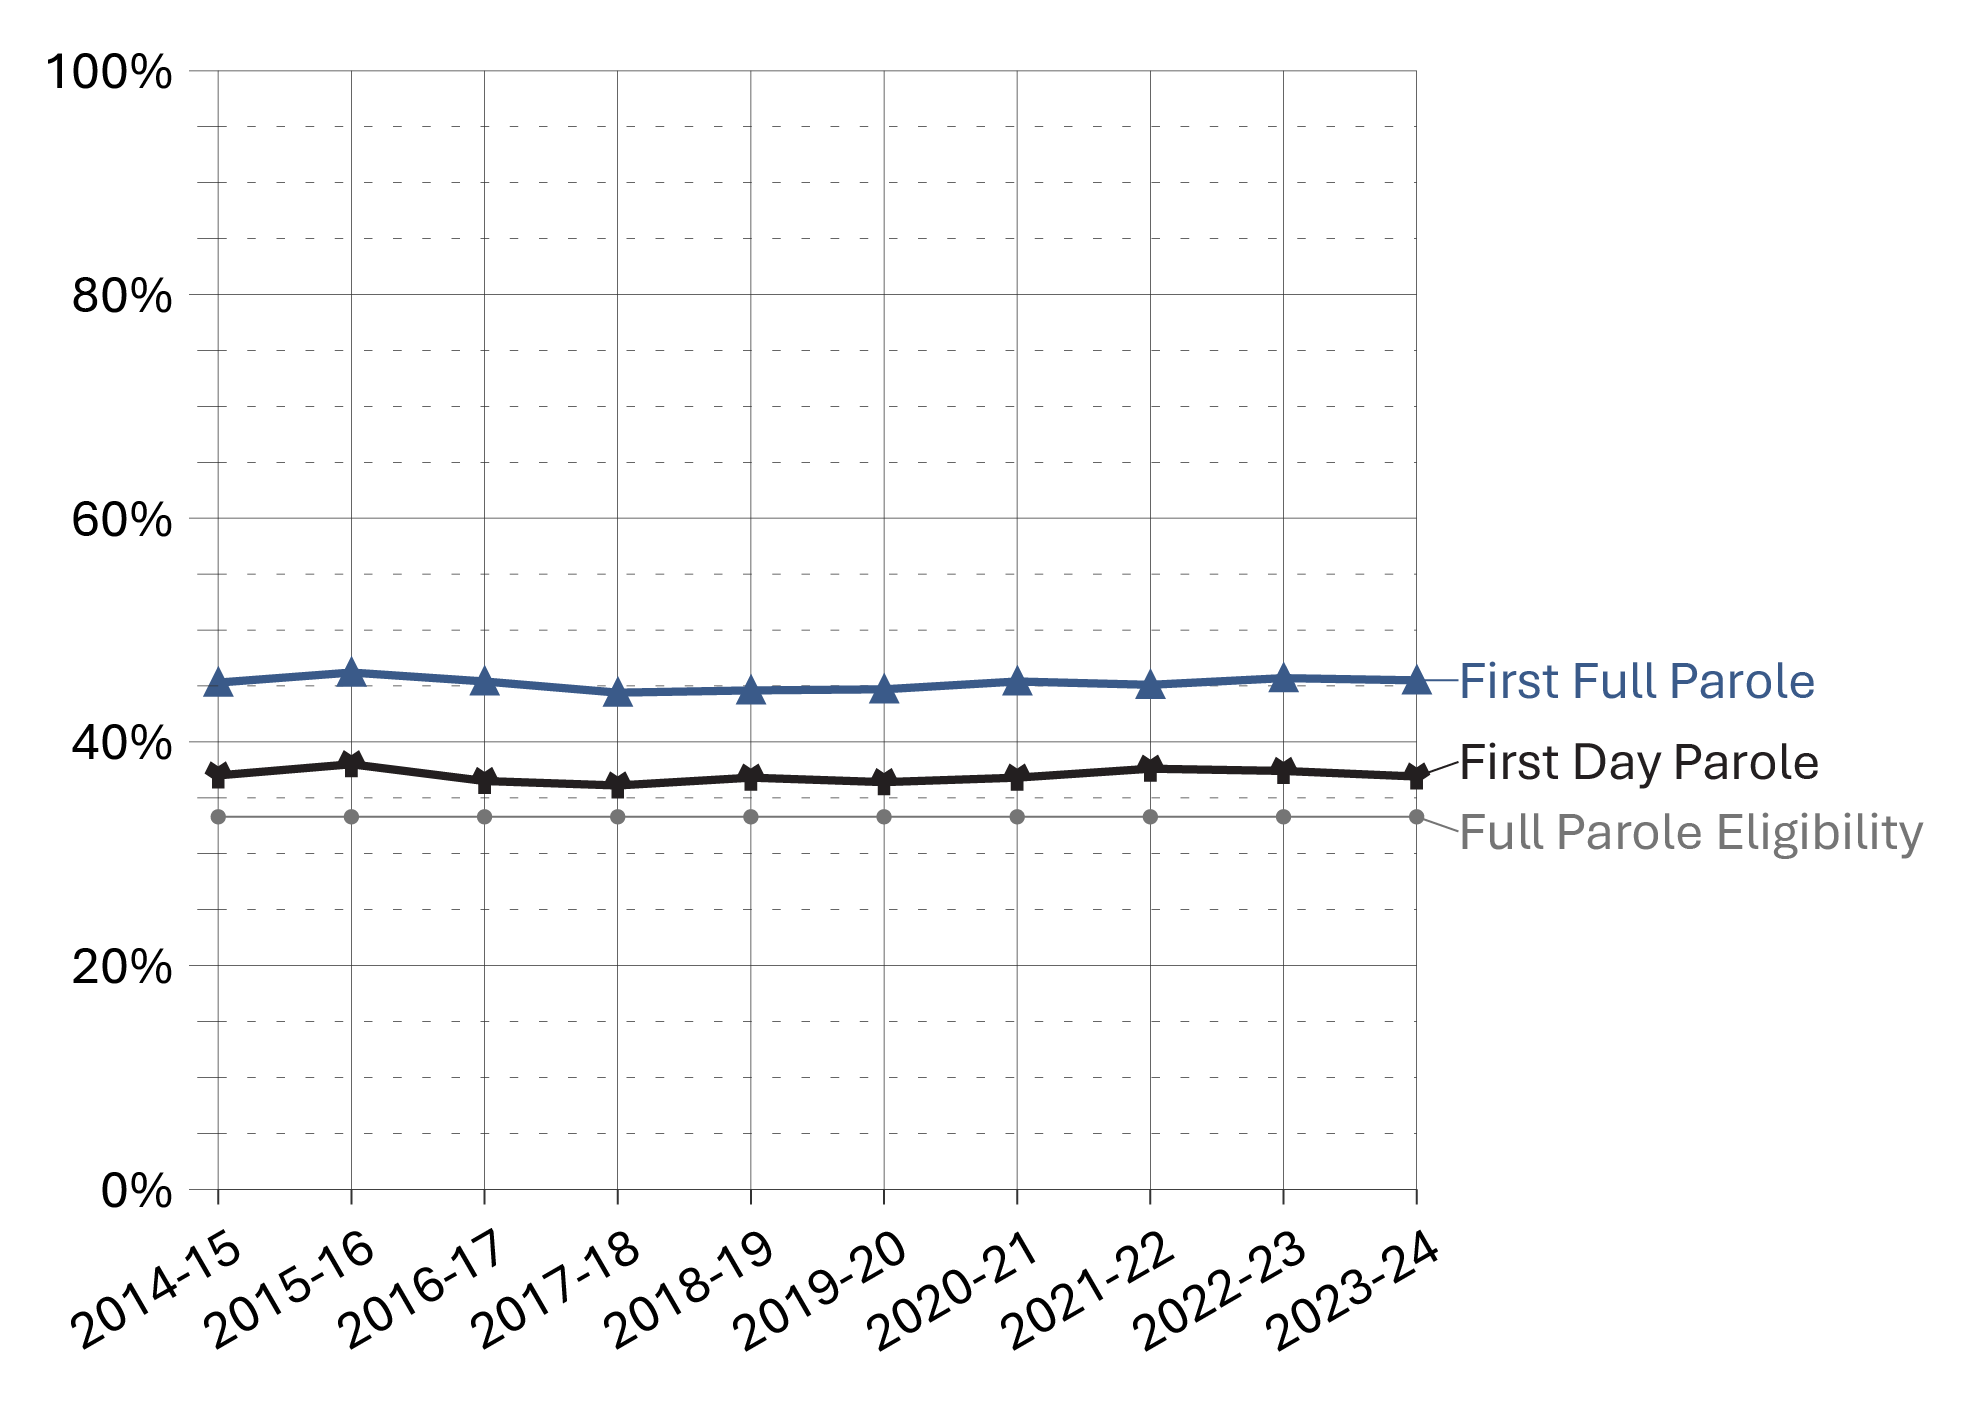
Image description
Line graph showing the proportion of sentences served in custody before first federal parole over a ten year period from fiscal year 2014-15 to 2023-24. The graph includes first full parole, first day parole, and dotted reference line to indicate when full parole eligibility begins. First full parole is more frequent than first day parole. These rates have remained consistent over the 10-year time period. Full data are available in the table below.
Source: Parole Board of Canada.
- In 2023-24, the average proportion of sentence served before the first federal day parole release for offenders serving determinate sentences remained stable (36.9%; -0.4%) from the previous fiscal year.
- The proportion of sentence served prior to the first federal full parole release for offenders serving determinate sentences remained stable (45.5%; -0.2%) in 2023-24 when compared to the previous fiscal year.
- In 2023-24, men offenders served a higher proportion of their sentences before being released on their first federal day parole and full parole (37.3%; 45.8%) than women offenders (33.9%; 42.5%).
- In 2023-24, the average proportion of sentence served by both men and women offenders before their first federal day parole release remained stable (+0.1% and -0.9%, respectively) compared to 2014-15.
- In 2023-24, the average proportion of sentence served before the first federal full parole release decreased for women offenders (-1.7%) and remained stable for men offenders (+0.5%) compared to 2014-15.
| Fiscal year | Women (%) | Men (%) | Total (%) |
|---|---|---|---|
| 2014-15 | 34.8 | 37.2 | 37.0 |
| 2015-16 | 36.5 | 38.1 | 38.0 |
| 2016-17 | 33.1 | 37.0 | 36.5 |
| 2017-18 | 32.5 | 36.6 | 36.1 |
| 2018-19 | 32.0 | 37.4 | 36.8 |
| 2019-20 | 30.4 | 37.2 | 36.4 |
| 2020-21 | 33.2 | 37.2 | 36.8 |
| 2021-22 | 33.9 | 38.2 | 37.6 |
| 2022-23 | 35.1 | 37.6 | 37.4 |
| 2023-24 | 33.9 | 37.3 | 36.9 |
Source: Parole Board of Canada.
| Fiscal year | Women (%) | Men (%) | Total (%) |
|---|---|---|---|
| 2014-15 | 44.3 | 45.4 | 45.3 |
| 2015-16 | 44.9 | 46.3 | 46.2 |
| 2016-17 | 43.3 | 45.7 | 45.4 |
| 2017-18 | 41.7 | 44.8 | 44.4 |
| 2018-19 | 41.5 | 44.9 | 44.6 |
| 2019-20 | 41.4 | 45.1 | 44.7 |
| 2020-21 | 42.7 | 45.8 | 45.4 |
| 2021-22 | 42.2 | 45.5 | 45.1 |
| 2022-23 | 44.0 | 45.9 | 45.7 |
| 2023-24 | 42.5 | 45.8 | 45.5 |
Source: Parole Board of Canada.
Table D6 Notes
Full parole is a type of conditional release granted by the Parole Board of Canada in which the remainder of the sentence is served under supervision in the community. The Parole Board of Canada must review the cases of all offenders for full parole at the time prescribed by legislation, unless the offender advises the Parole Board of Canada in writing that they do not wish to be considered for full parole.
Day parole is a type of conditional release granted by the Parole Board of Canada in which offenders are permitted to participate in community-based activities in preparation for full parole or statutory release. The conditions require offenders to return nightly to an institution, halfway house, or other location deemed appropriate for managing their risk, unless otherwise authorized by the Parole Board of Canada. Not all offenders apply for day parole, and some apply more than once before being granted day parole.
Timing of parole in the sentence refers to the percentage of the sentence served at the time the first day parole or full parole starts during the sentence. In most cases a full parole is preceded by a day parole. These calculations are based on sentences under federal jurisdiction, excluding life sentences and indeterminate sentences. Offenders (other than those serving life or indeterminate sentences or subject to judicial determination) normally become eligible for full parole after serving 1/3 of their sentence or 7 years, whichever is less. Eligibility for day parole is normally at 6 months before full parole eligibility.
Not included were proportion of sentence served by offenders who identified as another gender. In 2023-24, the proportion of sentence served by those offenders prior to being release on federal day parole was 35.2 % and 45.0% on federal full parole.
Reported year periods reflect fiscal years. A fiscal year runs from April 1 to March 31 of the following year.
Proportion of sentence served by Indigenous and non-Indigenous offenders prior to being released on parole: 10-year trend
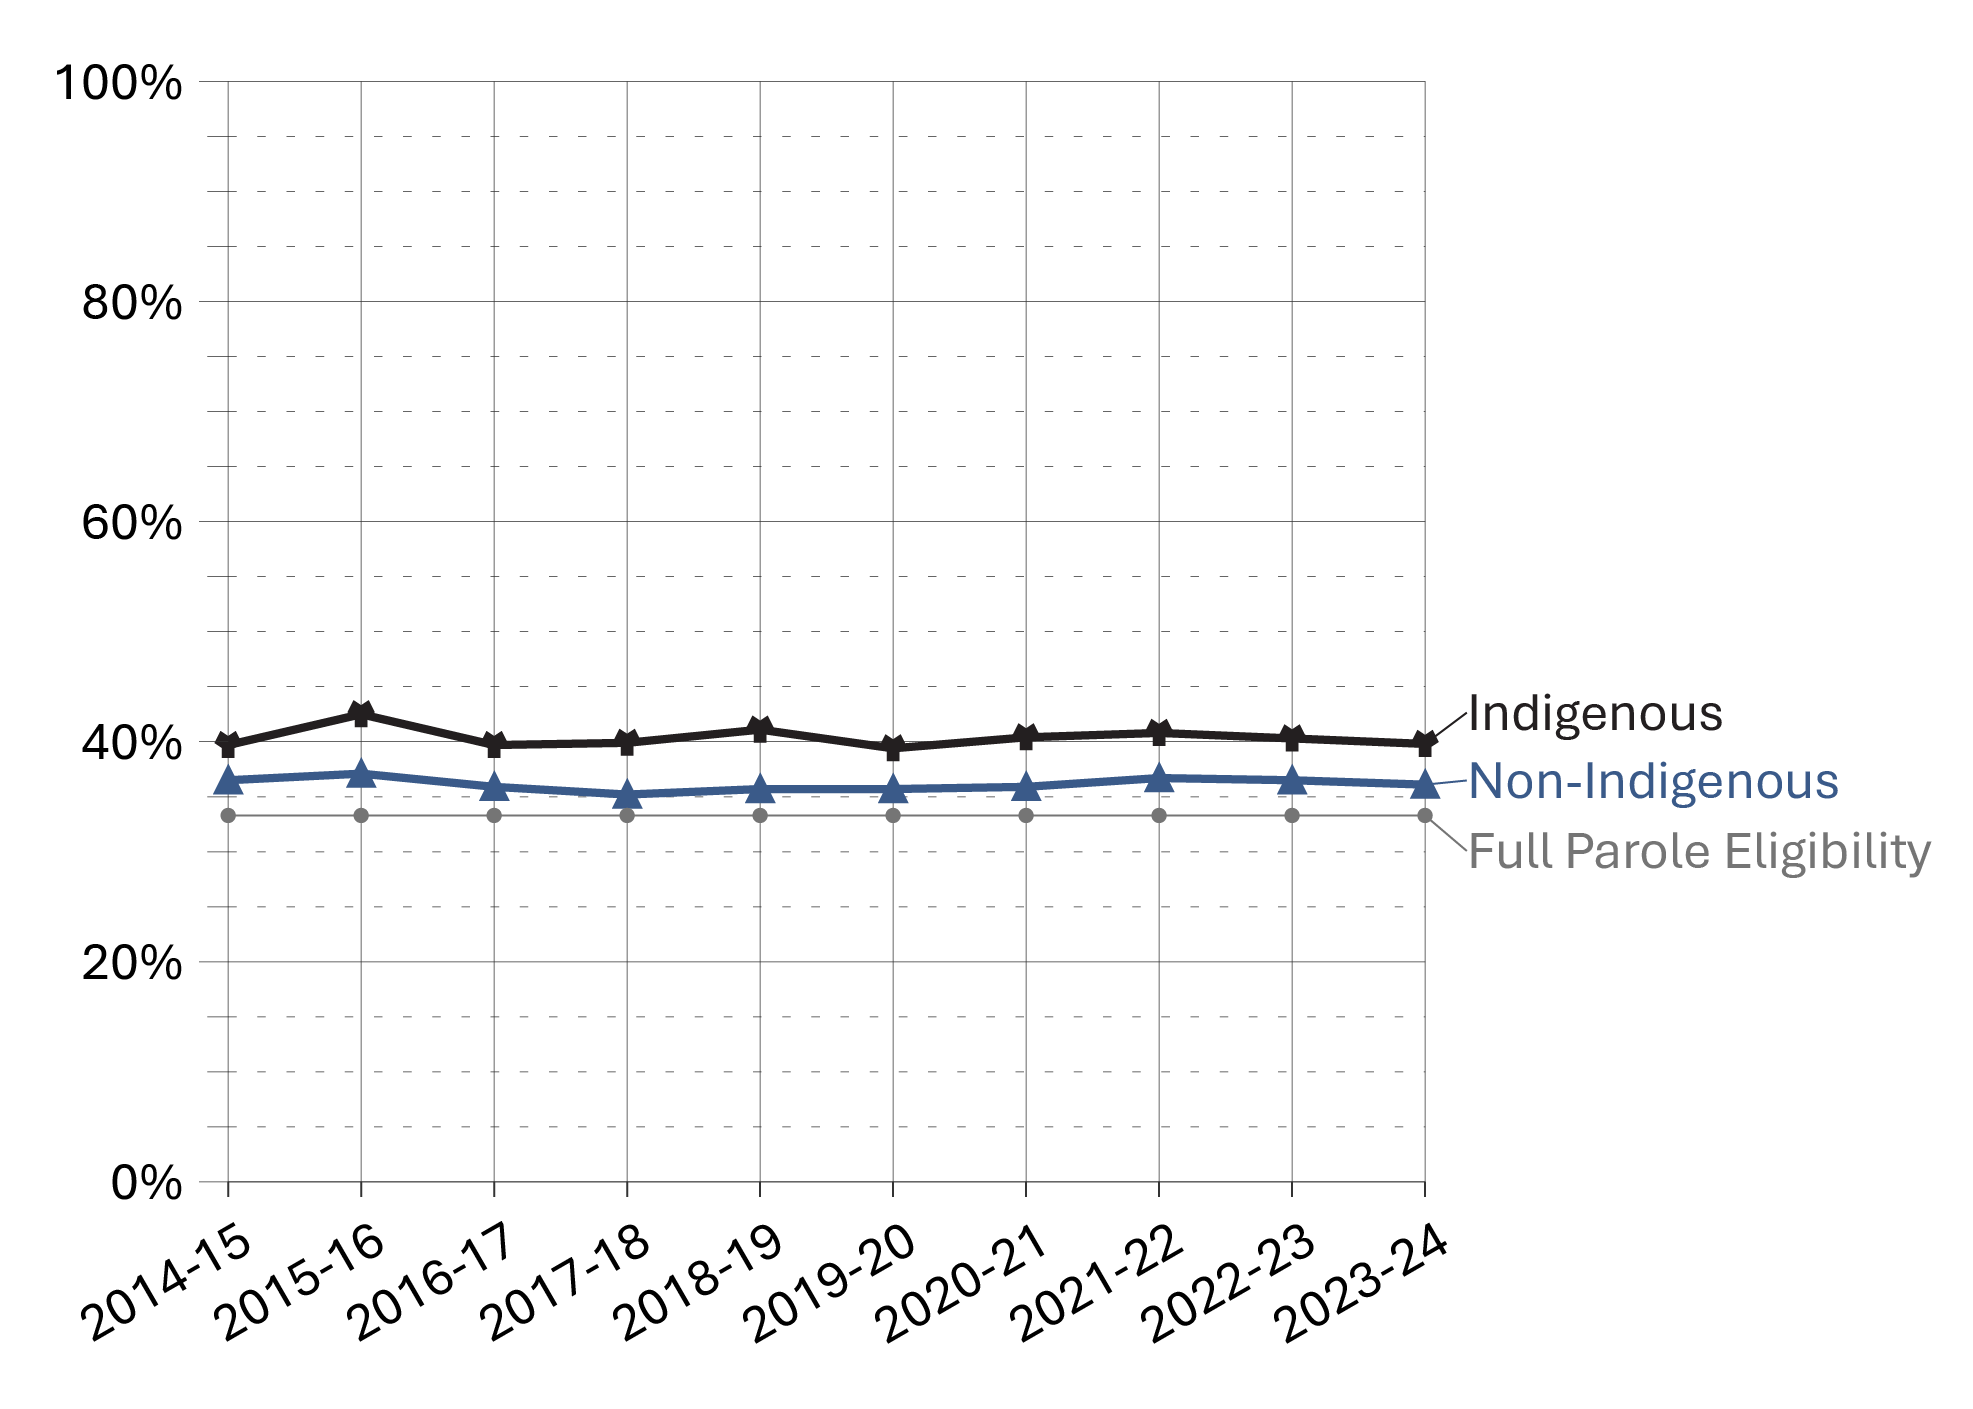
Image description
Line graph showing the proportion of sentences served in custody before first federal day parole, by Indigenous and non-Indigenous offenders, over a ten year period from fiscal year 2014-15 to 2023-24. The graph includes a dotted reference line to indicate when full parole eligibility begins. Over time, Indigenous offenders are slightly more likely than non-Indigenous offenders to serve a proportion of their sentence in federal custody before first day parole. Proportions have remained consistent over time. Full data are available in the table below.
Source: Parole Board of Canada.
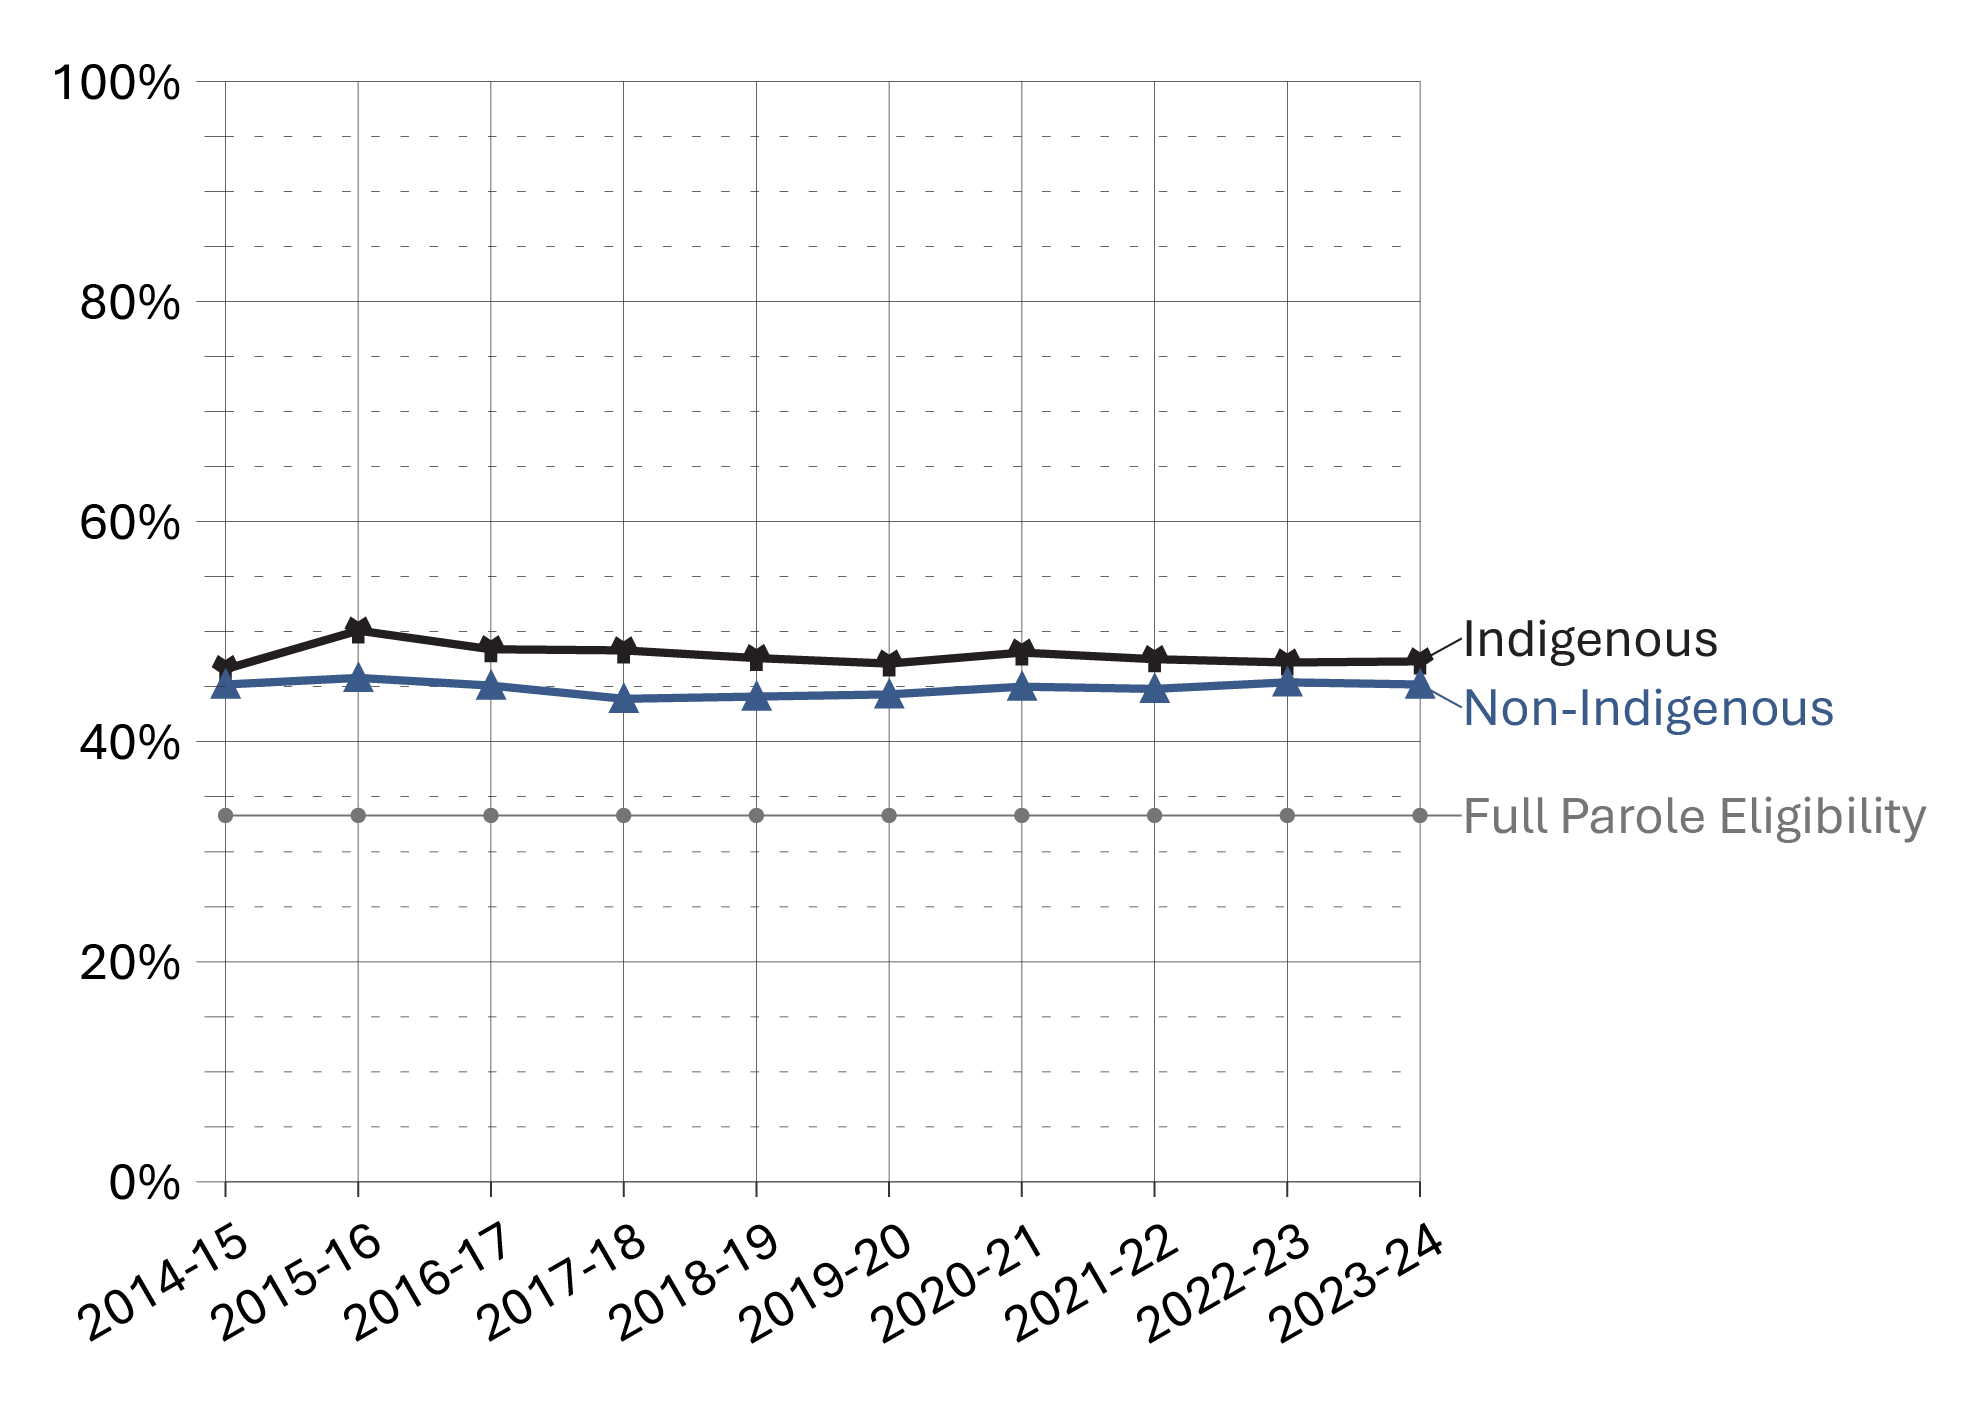
Image description
Line graph showing the proportion of sentences served in custody before first federal full parole, by Indigenous and non-Indigenous offenders, over a ten year period from fiscal year 2014-15 to 2023-24. The graph includes a dotted reference line to indicate when full parole eligibility begins. Over time, Indigenous offenders are slightly more likely than non-Indigenous offender's to serve a proportion of their sentence in federal custody before first full parole. Proportions have remained consistent over time. Full data are available in the table below.
Source: Parole Board of Canada.
- In 2023-24, Indigenous offenders served a higher proportion of their sentences before being released on their first federal day parole (39.8% vs 36.1%) and full parole (47.3% vs 45.2%) than non-Indigenous offenders.
- In 2023-24, the average proportion of sentence served by Indigenous offenders before their first federal day parole release and full parole release remained stable (+0.1% and +0.6%, respectively) compared to 2014-15.
- In 2023-24, the average proportion of sentence served by non-Indigenous offenders before their first federal day parole and full parole release remained stable (-0.4% and 0.0%, respectively) compared to 2014-15.
| Race group | 2014-15 | 2015-16 | 2016-17 | 2017-18 | 2018-19 | 2019-20 | 2020-21 | 2021-22 | 2022-23 | 2023-24 |
|---|---|---|---|---|---|---|---|---|---|---|
| Indigenous | 39.7 | 42.5 | 39.7 | 39.9 | 41.1 | 39.4 | 40.4 | 40.8 | 40.3 | 39.7 |
| Asian | 33.6 | 34.2 | 32.5 | 32.6 | 35.6 | 33.7 | 33.8 | 34.9 | 34.5 | 32.9 |
| Black | 40.4 | 38.9 | 39.4 | 36.6 | 38.8 | 34.7 | 36.8 | 37.8 | 38.0 | 37.2 |
| Caucasian | 36.4 | 37.2 | 36.0 | 35.3 | 35.5 | 36.2 | 36.1 | 36.7 | 36.6 | 36.3 |
| Other | 37.1 | 35.8 | 33.7 | 34.6 | 32.8 | 34.6 | 34.4 | 37.1 | 36.0 | 36.7 |
| Total | 37.0 | 38.0 | 36.5 | 36.1 | 36.8 | 36.4 | 36.8 | 37.6 | 37.4 | 36.9 |
Source: Parole Board of Canada.
| Race group | 2014-15 | 2015-16 | 2016-17 | 2017-18 | 2018-19 | 2019-20 | 2020-21 | 2021-22 | 2022-23 | 2023-24 |
|---|---|---|---|---|---|---|---|---|---|---|
| Indigenous | 46.6 | 50.1 | 48.4 | 48.3 | 47.6 | 47.1 | 48.1 | 47.5 | 47.2 | 47.3 |
| Asian | 43.3 | 43.5 | 44.5 | 41.3 | 42.6 | 43.0 | 42.9 | 43.4 | 44.6 | 42.7 |
| Black | 44.6 | 47.8 | 45.0 | 43.8 | 43.3 | 45.6 | 45.0 | 44.4 | 46.7 | 47.3 |
| Caucasian | 45.6 | 45.9 | 45.4 | 44.2 | 44.6 | 44.3 | 45.3 | 45.2 | 45.5 | 45.2 |
| Other | 44.8 | 44.4 | 42.5 | 45.0 | 43.0 | 44.3 | 45.8 | 43.7 | 44.5 | 46.8 |
| Total | 45.3 | 46.2 | 45.4 | 44.4 | 44.6 | 44.7 | 45.4 | 45.1 | 45.7 | 45.5 |
Source: Parole Board of Canada.
Table D7 Notes
During intake assessment, parole officers ask federal offenders to self-identify their race and this information is entered into the Correctional Service of Canada's (CSC) Offender Management System. Parole Board of Canada (PBC) uses the term “race grouping” as this is the term used by CSC to collect the information from offenders and also reflects how the data is captured in CSC's and PBC's data tables.
Full parole is a type of conditional release granted by the Parole Board of Canada in which the remainder of the sentence is served under supervision in the community. The Parole Board of Canada must review the cases of all offenders for full parole at the time prescribed by legislation, unless the offender advises the Parole Board of Canada in writing that they do not wish to be considered for full parole.
Day parole is a type of conditional release granted by the Parole Board of Canada in which offenders are permitted to participate in community-based activities in preparation for full parole or statutory release. The conditions require offenders to return nightly to an institution, halfway house, or other location deemed appropriate for managing their risk, unless otherwise authorized by the Parole Board of Canada. Not all offenders apply for day parole, and some apply more than once before being granted day parole.
Timing of parole in the sentence refers to the percentage of the sentence served at the time the first day parole or full parole starts during the sentence. In most cases a full parole is preceded by a day parole. These calculations are based on sentences under federal jurisdiction, excluding life sentences and indeterminate sentences. Offenders (other than those serving life or indeterminate sentences or subject to judicial determination) normally become eligible for full parole after serving 1/3 of their sentence or 7 years, whichever is less. Eligibility for day parole is normally at 6 months before full parole eligibility.
Reported year periods reflect fiscal years. A fiscal year runs from April 1 to March 31 of the following year.
Outcome of federal day parole supervision periods
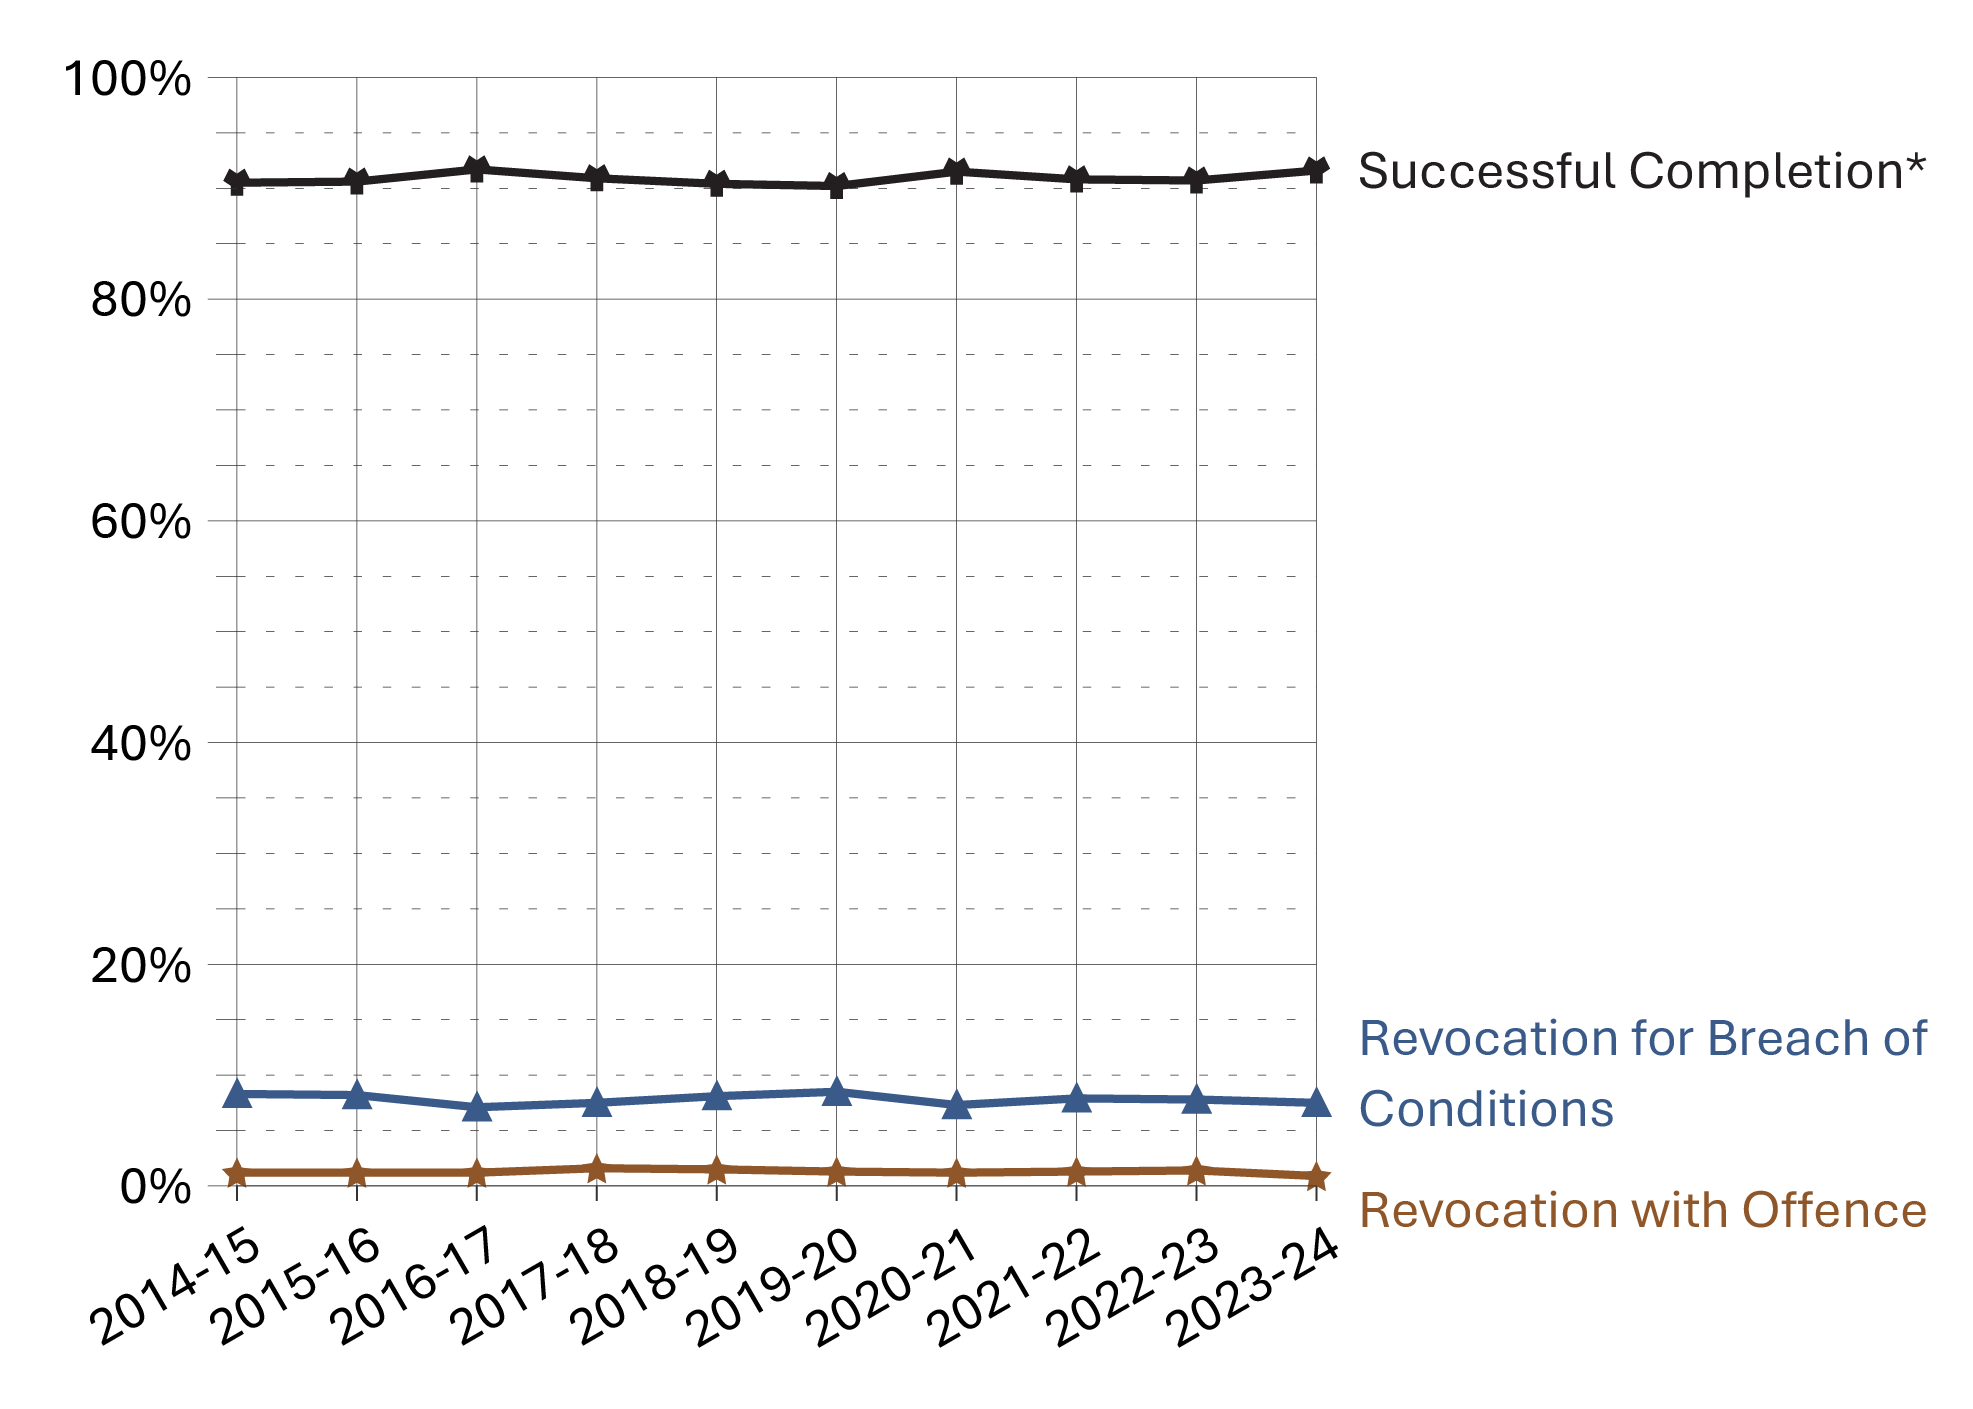
Image description
Line graph showing the outcome of federal day parole supervision periods across ten years from fiscal year 2014-15 to 2023-24. The graph includes successful completions of day parole, revocation for breach conditions, and revocation with offence. Over time, the vast majority of those on day parole reported successful completion. Full data are available in the table below.
Source: Parole Board of Canada.
- In the past 10 fiscal years (from 2014-15 to 2023-24), the successful completionFootnote * rate of federal day parole supervision periods was on average 90.9%. Of the 9.1% unsuccessful completions, most were for breach of conditions.
- In 2023-24, the successful completionFootnote * rate of federal day parole supervision periods remained stable (91.6%; +0.9%) compared to 2022-23.
- The rate of violent reoffending of federal day parole supervision periods has been very low in the past 5 fiscal years, averaging 0.2%.
| Federal day parole outcomes | 2019-20 | % | 2020-21 | % | 2021-22 | % | 2022-23 | % | 2023-24 | % |
|---|---|---|---|---|---|---|---|---|---|---|
| Successful completion | 3,772 | 90.2 | 3,562 | 91.5 | 3,028 | 90.8 | 3,088 | 90.7 | 3,430 | 91.6 |
| Revocation for breach of conditions | 356 | 8.5 | 284 | 7.3 | 262 | 7.9 | 266 | 7.8 | 279 | 7.5 |
| Revocation with non-violent offence | 47 | 1.1 | 36 | 0.9 | 38 | 1.1 | 41 | 1.2 | 28 | 0.7 |
| Revocation with violent offence | 9 | 0.2 | 12 | 0.3 | 7 | 0.2 | 8 | 0.2 | 6 | 0.2 |
| Total | 4,184 | 100.0 | 3,894 | 100.0 | 3,335 | 100.0 | 3,403 | 100.0 | 3,743 | 100.0 |
Source: Parole Board of Canada.
Table D8 Notes
Outcome of federal full parole supervision periods
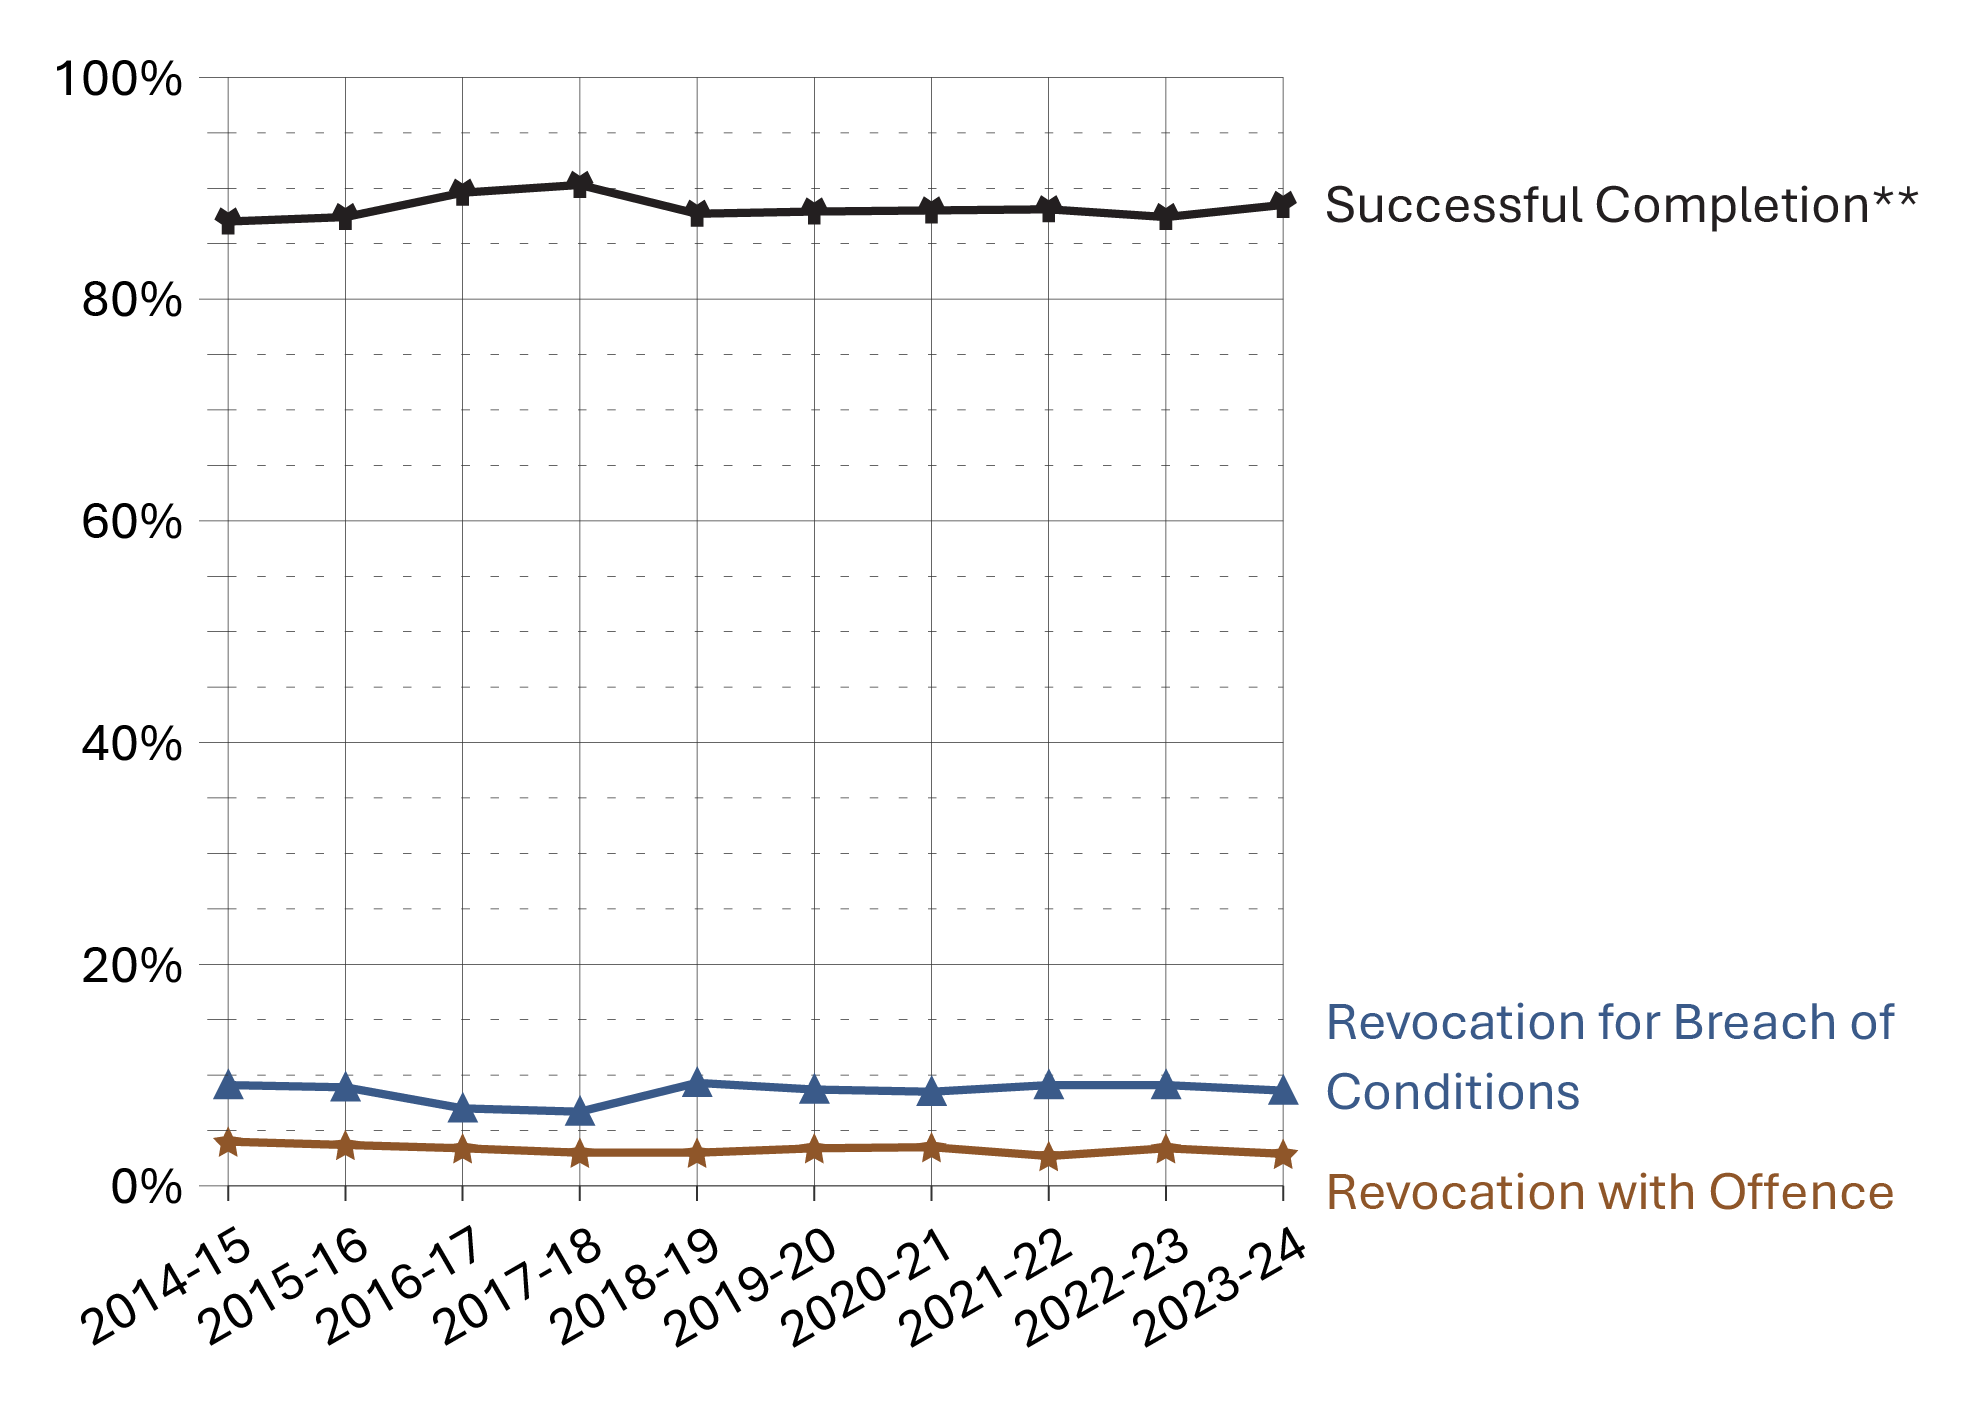
Image description
Line graph showing the outcome of federal full parole supervision periods across ten years from fiscal year 2014-15 to 2023-24. The graph includes successful completions of full parole, revocation for breach conditions, and revocation with offence. Over time, the vast majority of those on day parole reported successful completion. Full data are available in the table below.
Source: Parole Board of Canada.
- In the past 10 fiscal years (from 2014-15 to 2023-24), the successful completion rateFootnote ** of federal full parole supervision periods for offenders serving determinate sentences was on average 88.2%. Of the 11.8% unsuccessful completions, most were for breach of conditions.
- In 2023-24, the successful completion rateFootnote ** of federal full parole supervision periods slightly increased to 88.5% (+1.1%) compared to 2022-23.
- The rate of violent reoffending of federal full parole supervision periods has been low in the past 5 fiscal years, averaging 0.8% (and ranging from 0.4% to 1.1%).
| Federal full parole outcomes | 2019-20 | % | 2020-21 | % | 2021-22 | % | 2022-23 | % | 2023-24 | % |
|---|---|---|---|---|---|---|---|---|---|---|
| Successful completionFootnote ** | 1,274 | 87.9 | 1,272 | 88.0 | 1,253 | 88.1 | 996 | 87.4 | 924 | 88.5 |
| Revocation for breach of conditions | 126 | 8.7 | 123 | 8.5 | 130 | 9.1 | 104 | 9.1 | 90 | 8.6 |
| Revocation with non-violent offence | 37 | 2.6 | 40 | 2.8 | 26 | 1.8 | 27 | 2.4 | 26 | 2.5 |
| Revocation with violent offence | 13 | 0.9 | 10 | 0.7 | 13 | 0.9 | 12 | 1.1 | 4 | 0.4 |
| Total | 1,450 | 100.0 | 1,445 | 100.0 | 1,422 | 100.0 | 1,139 | 100.0 | 1,044 | 100.0 |
Source: Parole Board of Canada.
Table D9 Notes
Offenders released from federal institutions including Healing Lodges on statutory release: 10-year trend
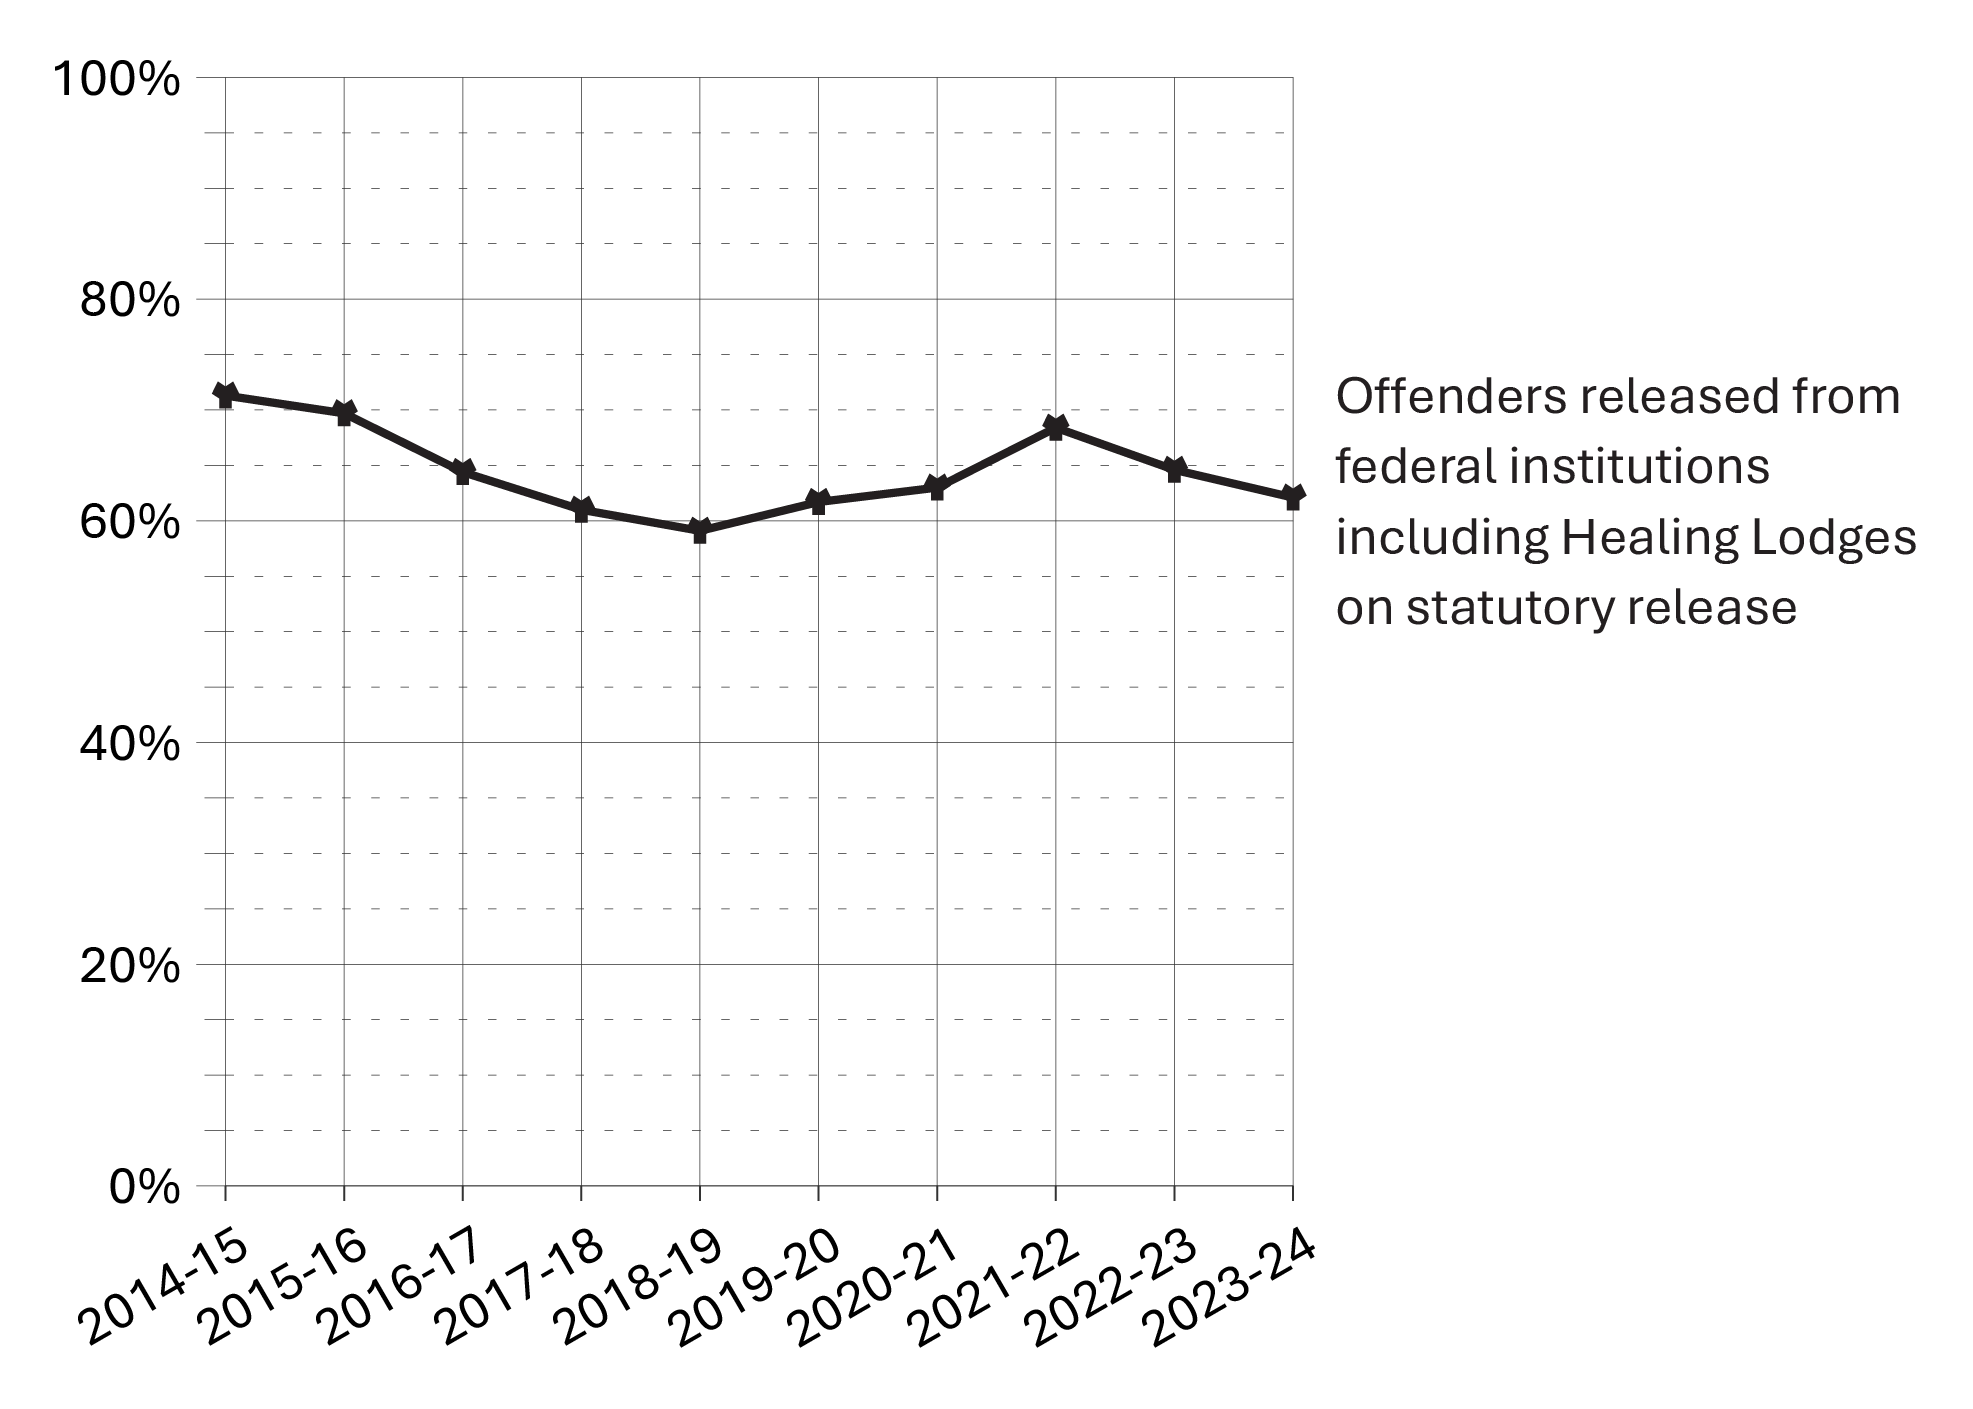
Image description
Line graph showing the percentage of offenders released from federal institutions including Healing Lodges on statutory release over a ten year period from fiscal year 2014-15 to 2023-24. Proportions have remained relatively consistent over time. Full data are available in the table below.
Source: Correctional Service of Canada.
- In fiscal year 2023-24, 62.1% of all releases from federal institutions were at statutory release.
- In fiscal year 2023-24, 74.4% of releases for Indigenous offenders were at statutory release compared to 55.5% of releases for non-Indigenous offenders.
- In fiscal year 2023-24, 63.3% of all releases from federal institutions for male offenders were at statutory release, compared to 47.8% of releases for female offenders.
- Over the past ten years (from 2014-15 to 2023-24), the percentage of releases at statutory release decreased from 71.3% to 62.1%.
| Fiscal year | Indigenous: Statutory release | Indigenous: Total releases | %Footnote * | Non-Indigenous: Statutory release | Non-Indigenous: Total releases | %Footnote * |
|---|---|---|---|---|---|---|
| 2014-15 | 1,782 | 2,106 | 84.6 | 3,590 | 5,426 | 66.2 |
| 2015-16 | 1,716 | 2,079 | 82.5 | 3,592 | 5,537 | 64.9 |
| 2016-17 | 1,631 | 2,086 | 78.2 | 3,252 | 5,491 | 59.2 |
| 2017-18 | 1,576 | 2,109 | 74.7 | 2,844 | 5,141 | 55.3 |
| 2018-19 | 1,463 | 2,053 | 71.3 | 2,710 | 5,011 | 54.1 |
| 2019-20 | 1,650 | 2,196 | 75.1 | 2,706 | 4,865 | 55.6 |
| 2020-21 | 1,595 | 2,102 | 75.9 | 2,526 | 4,435 | 57.0 |
| 2021-22 | 1,787 | 2,232 | 80.1 | 2,588 | 4,166 | 62.1 |
| 2022-23 | 1,721 | 2,245 | 76.7 | 2,315 | 4,003 | 57.8 |
| 2023-24 | 1,662 | 2,235 | 74.4 | 2,315 | 4,171 | 55.5 |
Source: Correctional Service of Canada.
| Fiscal year | Male: Statutory release | Male: Total releases | %Footnote * | Female: Statutory release | Female: Total releases | %Footnote * |
|---|---|---|---|---|---|---|
| 2014-15 | 5,136 | 7,091 | 72.4 | 236 | 441 | 53.5 |
| 2015-16 | 5,029 | 7,112 | 70.7 | 279 | 504 | 55.4 |
| 2016-17 | 4,627 | 7,015 | 66.0 | 256 | 562 | 45.6 |
| 2017-18 | 4,193 | 6,682 | 62.8 | 227 | 568 | 40.0 |
| 2018-19 | 3,954 | 6,516 | 60.7 | 219 | 548 | 40.0 |
| 2019-20 | 4,119 | 6,522 | 63.2 | 237 | 539 | 44.0 |
| 2020-21 | 3,897 | 6,064 | 64.3 | 224 | 473 | 47.4 |
| 2021-22 | 4,147 | 5,913 | 70.1 | 228 | 485 | 47.0 |
| 2022-23 | 3,819 | 5,787 | 66.0 | 217 | 461 | 47.1 |
| 2023-24 | 3,730 | 5,889 | 63.3 | 247 | 517 | 47.8 |
Source: Correctional Service of Canada.
| Fiscal year | Statutory release | Total releases | %Footnote * |
|---|---|---|---|
| 2014-15 | 5,372 | 7,532 | 71.3 |
| 2015-16 | 5,308 | 7,616 | 69.7 |
| 2016-17 | 4,883 | 7,577 | 64.4 |
| 2017-18 | 4,420 | 7,250 | 61.0 |
| 2018-19 | 4,173 | 7,064 | 59.1 |
| 2019-20 | 4,356 | 7,061 | 61.7 |
| 2020-21 | 4,121 | 6,537 | 63.0 |
| 2021-22 | 4,375 | 6,398 | 68.4 |
| 2022-23 | 4,036 | 6,248 | 64.6 |
| 2023-24 | 3,977 | 6,406 | 62.1 |
Source: Correctional Service of Canada.
Table D10 Notes
Outcome of federal statutory release supervision periods
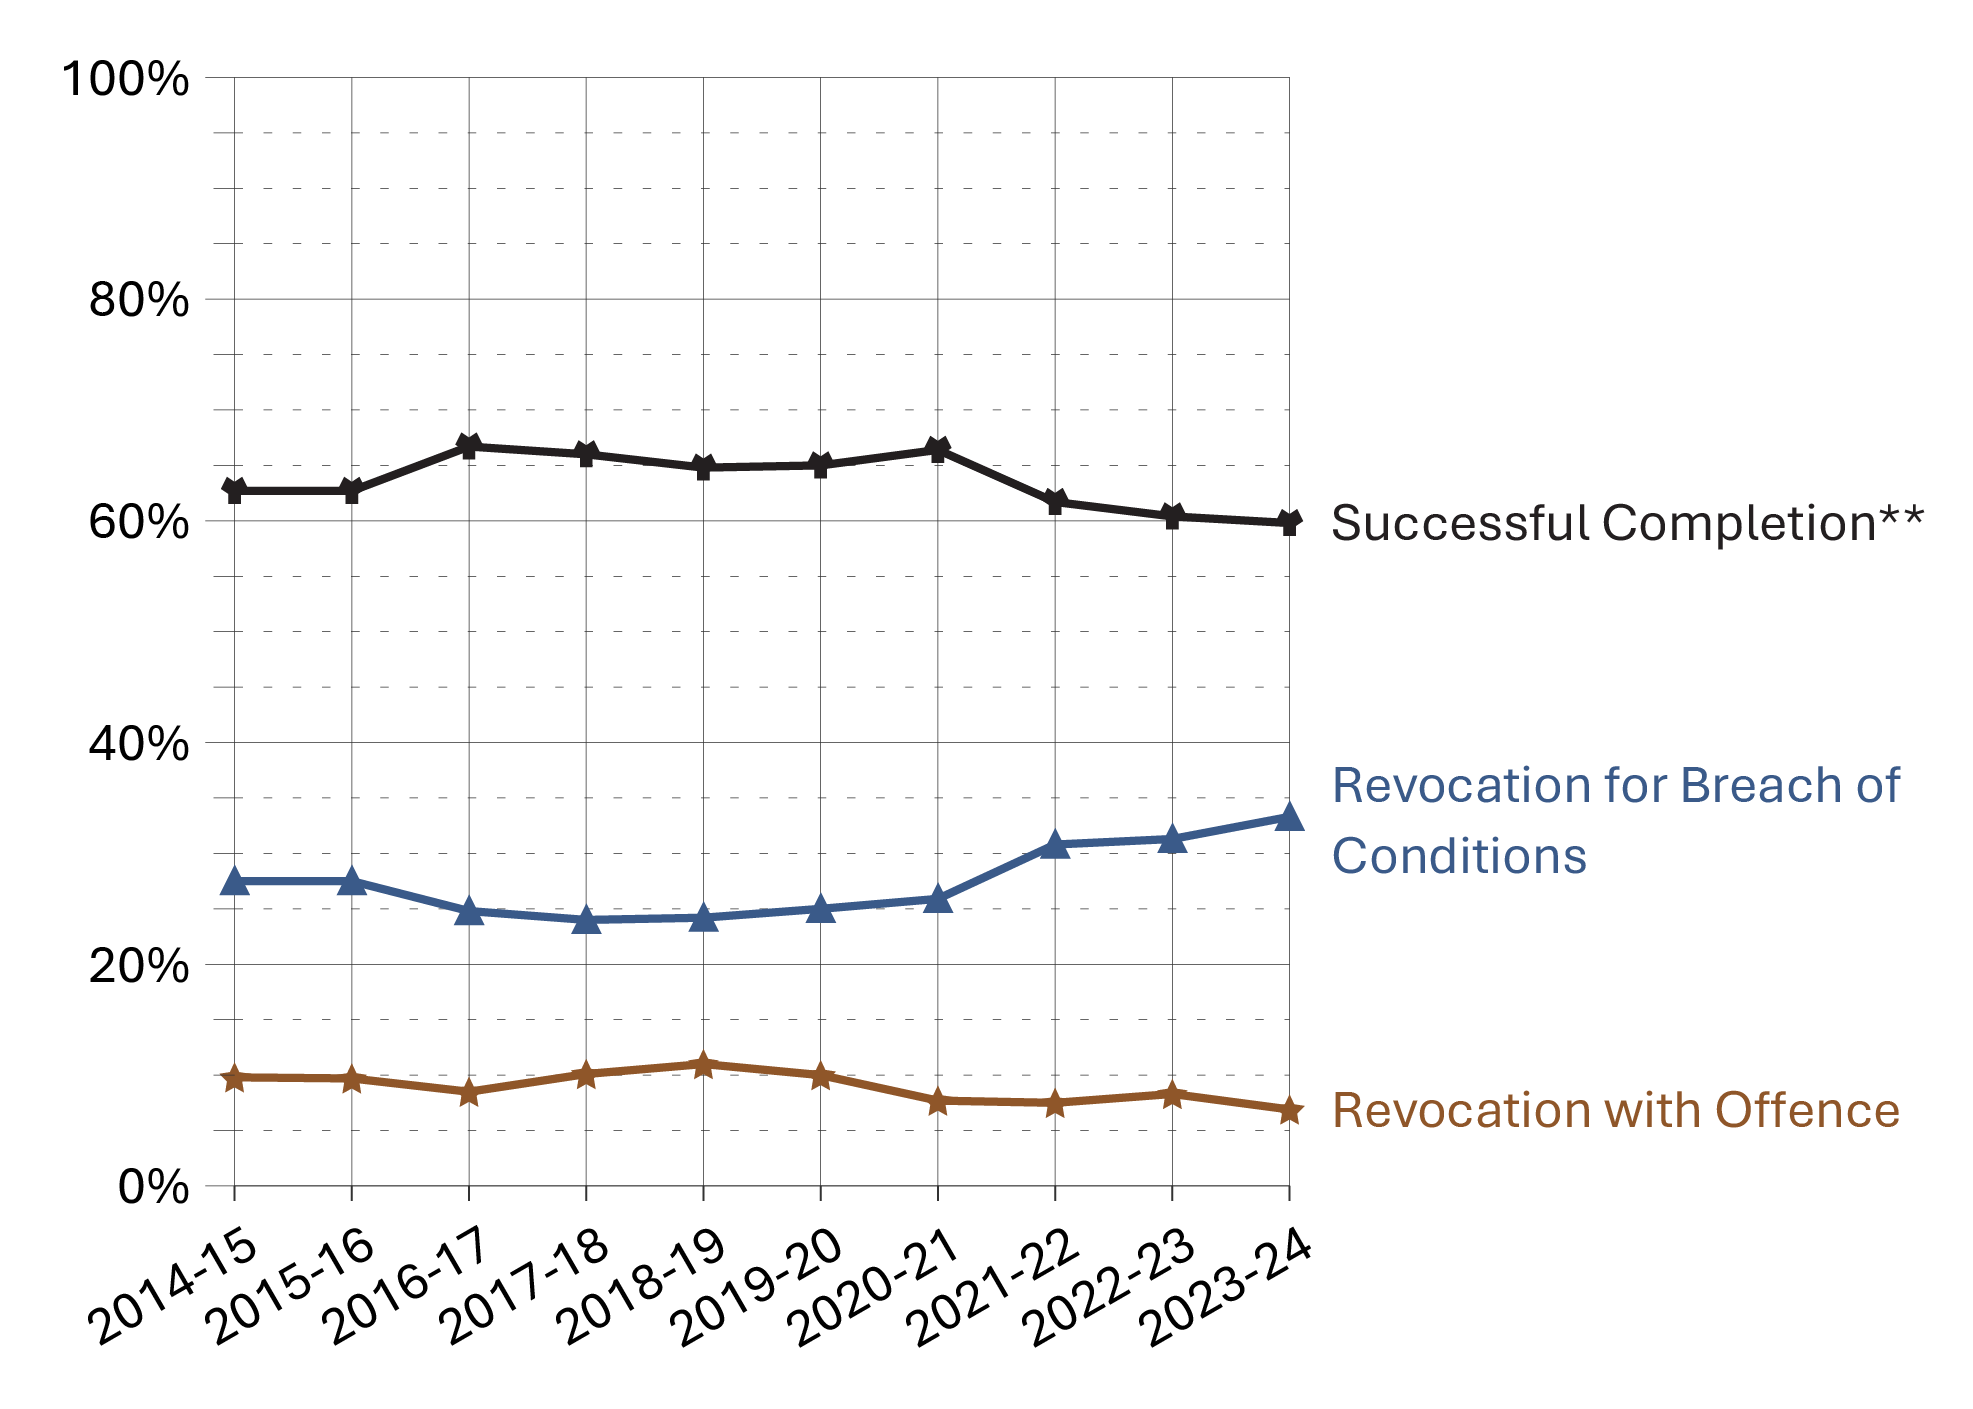
Image description
Line graph showing the percentage of statutory release outcomes over a ten year period from fiscal year 2014-15 to 2023-24. The graph includes successful completions of statutory release, revocation for breach conditions, and revocation with offence. Over time, the vast majority of those on day parole reported successful completion. Full data are available in the table below.
Source: Parole Board of Canada.
- In 2023-24, the successful completionFootnote ** rate of statutory releaseFootnote * supervision periods remained stable (59.8%; -0.6%) compared to 2022-23.
- Over the past 5 fiscal years (from 2019-20 to 2023-24), the revocation with violent offence rates (1.4%) were, on average, 6.2 times higher for offenders on statutory release than for offenders on federal day parole (0.2%) and 1.8 times higher than for offenders on federal full parole (0.8%).
| Statutory releaseFootnote * outcomes | 2019-20 | % | 2020-21 | % | 2021-22 | % | 2022-23 | % | 2023-24 | % |
|---|---|---|---|---|---|---|---|---|---|---|
| Successful completionFootnote ** | 3,381 | 65.0 | 3,329 | 66.4 | 3,238 | 61.7 | 2,932 | 60.4 | 2,741 | 59.8 |
| Revocation for breach of conditions | 1,299 | 25.0 | 1,297 | 25.9 | 1,615 | 30.8 | 1,522 | 31.3 | 1,524 | 33.3 |
| Revocation with non-violent offence | 407 | 7.8 | 304 | 6.1 | 316 | 6.0 | 352 | 7.3 | 287 | 6.3 |
| Revocation with violent offence | 111 | 2.1 | 81 | 1.6 | 78 | 1.5 | 49 | 1.0 | 30 | 0.7 |
| Total | 5,198 | 100.0 | 5,011 | 100.0 | 5,247 | 100.0 | 4,855 | 100.0 | 4,582 | 100.0 |
Source: Parole Board of Canada.
Table D11 Notes
Rates of violent offence convictions for offenders on federal conditional release: 10-year trend
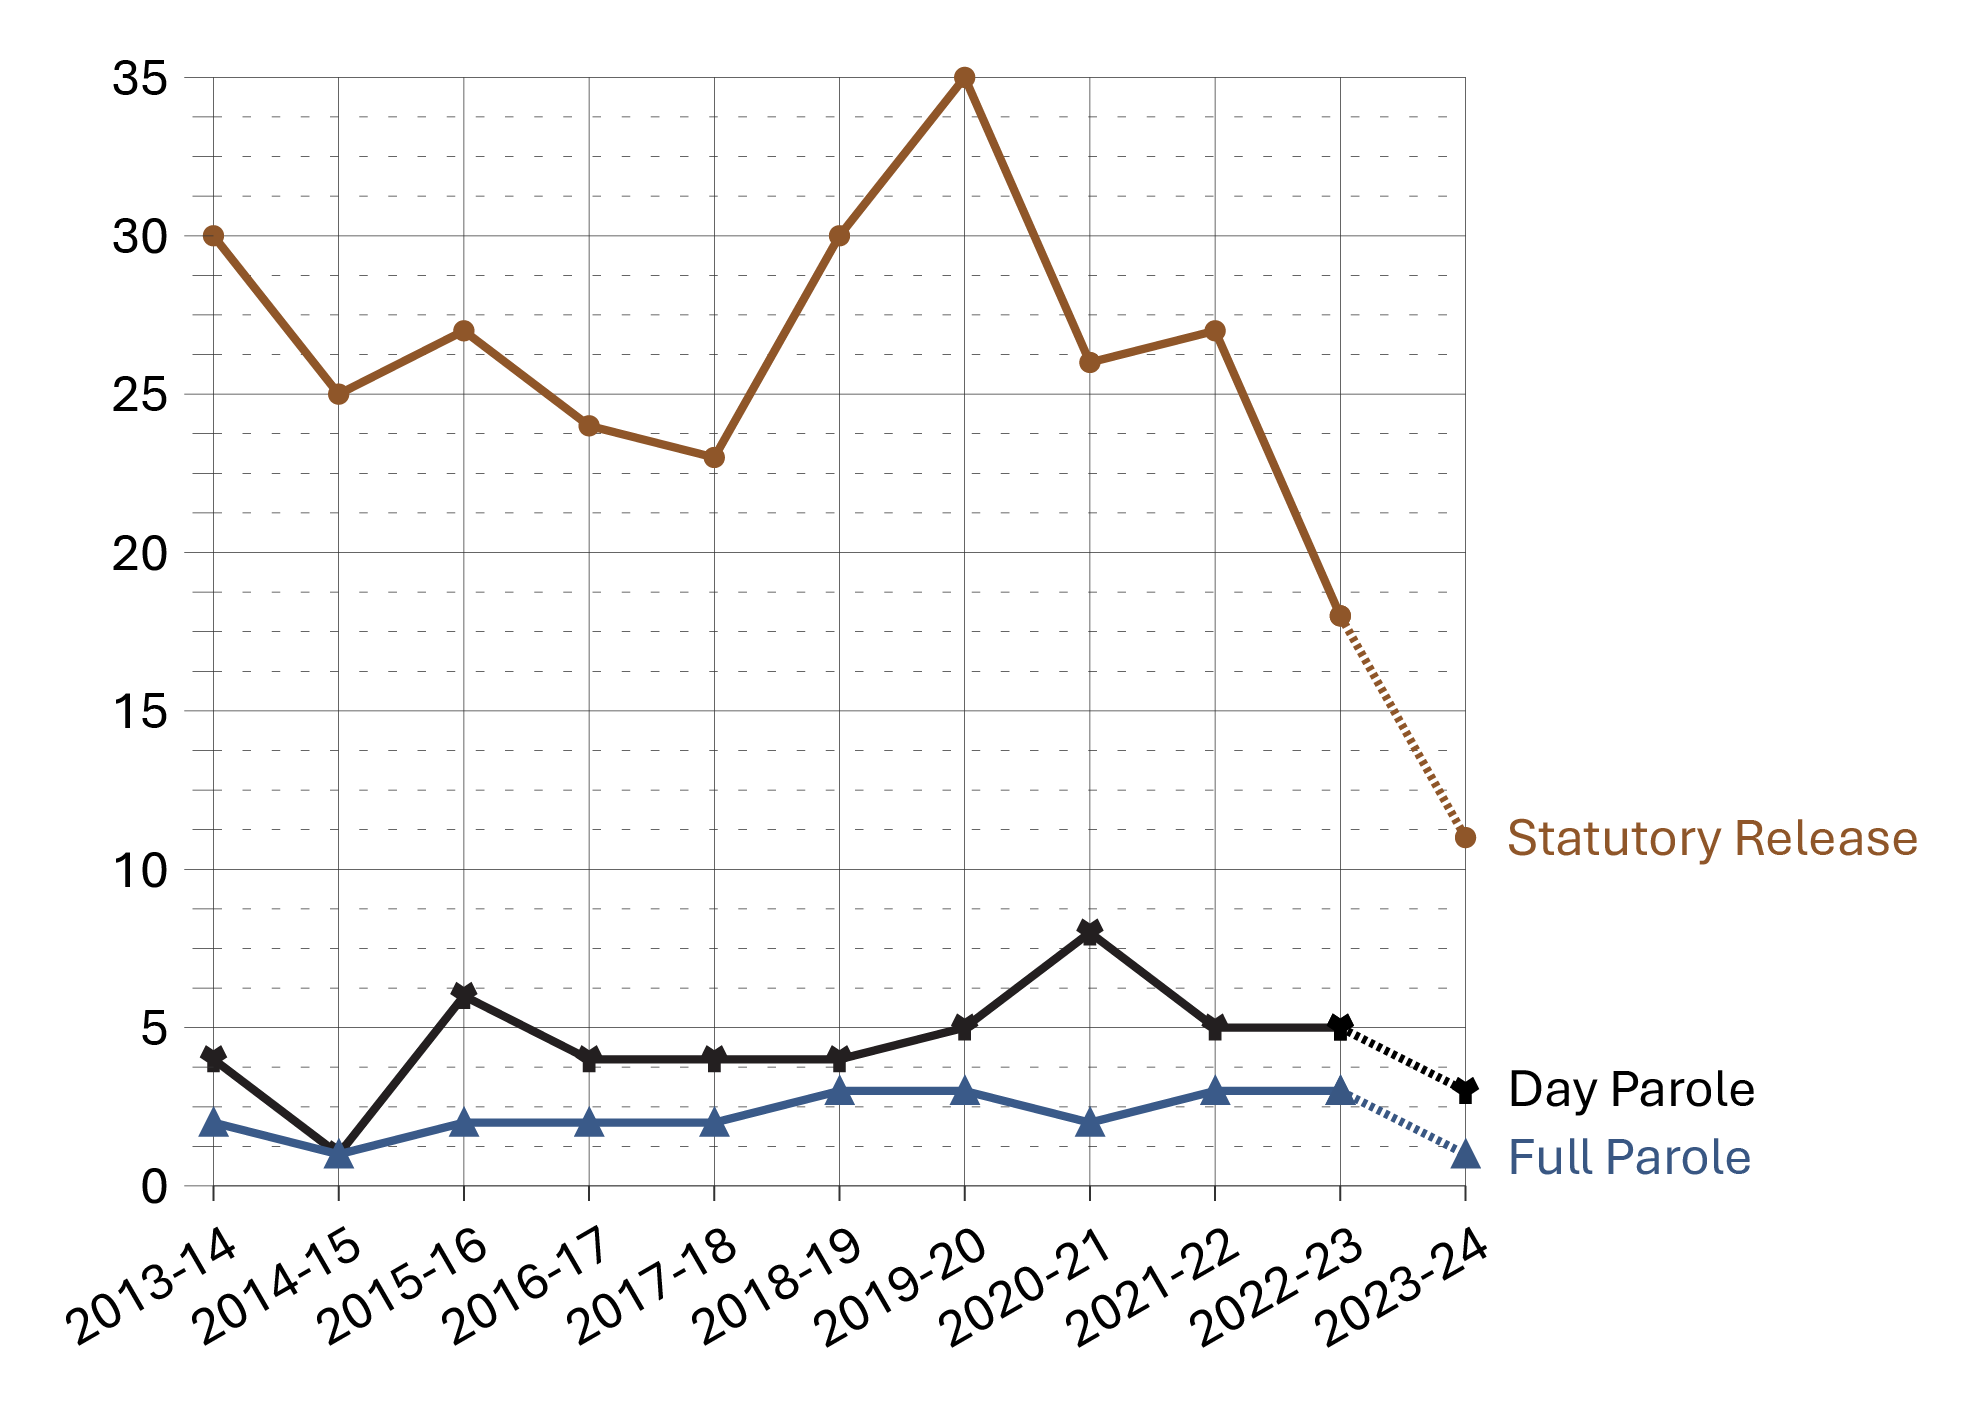
Image description
Line graph showing the rates of violent offence convictions per 1,000 supervised offenders over an eleven year period from fiscal year 2013-14 to 2023-24. The graph includes statutory release, day parole, and full parole. Over time, rates of violent offences were most common among offenders on statutory release. Violent offences for offenders on both full parole and day parole were quite low, relative to offenders on statutory release. There are dotted lines for all data between fiscal years 2022-23 and 2023-24, which are intended to signify that due to delays in the court process, these numbers under-represent the actual number of convictions, as verdicts may not have been reached by year-end. Full data are available in the table below.
Source: Parole Board of Canada.
- During the 10-fiscal year period between 2013-14 and 2022-23Footnote *, the number of convictions for a violent offence for offenders on federal conditional release decreased 39.5% (from 119 in 2013-14 to 72 in 2022-23). Over this period, the annual average number of convictions for violent offences was 7.3 for offenders on day parole, 10.4 for offenders on full parole, and 86.9 for offenders on statutory release.
- During the 10-fiscal-year period between 2013-14 and 2022-23Footnote *, convictions for violent offences on statutory release accounted for 83.1% of all convictions by offenders on federal conditional release.
- When comparing the rates of conviction for violent offences per 1,000 supervised offenders (between 2013-14 and 2022-23Footnote *), offenders on statutory release were 11.1 times more likely to commit a violent offence during their supervision periods than offenders on full parole, and 5.7 times more likely to commit a violent offence than offenders on day parole.
| Fiscal year | Day parole | Full parole | Statutory release | Total |
|---|---|---|---|---|
| 2013-14 | 5 | 8 | 106 | 119 |
| 2014-15 | 1 | 4 | 87 | 92 |
| 2015-16 | 9 | 7 | 96 | 112 |
| 2016-17 | 7 | 8 | 85 | 100 |
| 2017-18 | 7 | 8 | 78 | 93 |
| 2018-19 | 8 | 15 | 98 | 121 |
| 2019-20 | 9 | 14 | 111 | 134 |
| 2020-21 | 12 | 11 | 81 | 104 |
| 2021-22 | 7 | 14 | 78 | 99 |
| 2022-23 | 8 | 15 | 49 | 72 |
| 2023-24 | 6 | 5 | 30 | 41 |
Source: Parole Board of Canada.
| Fiscal year | Day parole | Full parole | Statutory release |
|---|---|---|---|
| 2013-14 | 4 | 2 | 30 |
| 2014-15 | 1 | 1 | 25 |
| 2015-16 | 6 | 2 | 27 |
| 2016-17 | 4 | 2 | 24 |
| 2017-18 | 4 | 2 | 23 |
| 2018-19 | 4 | 3 | 30 |
| 2019-20 | 5 | 3 | 35 |
| 2020-21 | 8 | 2 | 26 |
| 2021-22 | 5 | 3 | 27 |
| 2022-23 | 5 | 3 | 18 |
| 2023-24 | 3 | 1 | 11 |
Source: Parole Board of Canada.
Table D12 Notes
Violent offences include murder and Schedule I offences (listed in the Corrections and Conditional Release Act) such as assaults, sexual offences, arson, abduction, robbery, and some weapon offences.
Supervised offenders include offenders who are on parole and statutory release, those temporarily detained in federal institutions, and those who are deported or extradited.
Statutory release refers to a conditional release that is subject to supervision after the offender has served two-thirds of the sentence.
Day and full parole include those offenders serving determinate and indeterminate sentences.
Reported year periods reflect fiscal years. A fiscal year runs from April 1 to March 31 of the following year.
Section E: Special Applications of Criminal Justice
Number of initial detention reviews: 10-year trend
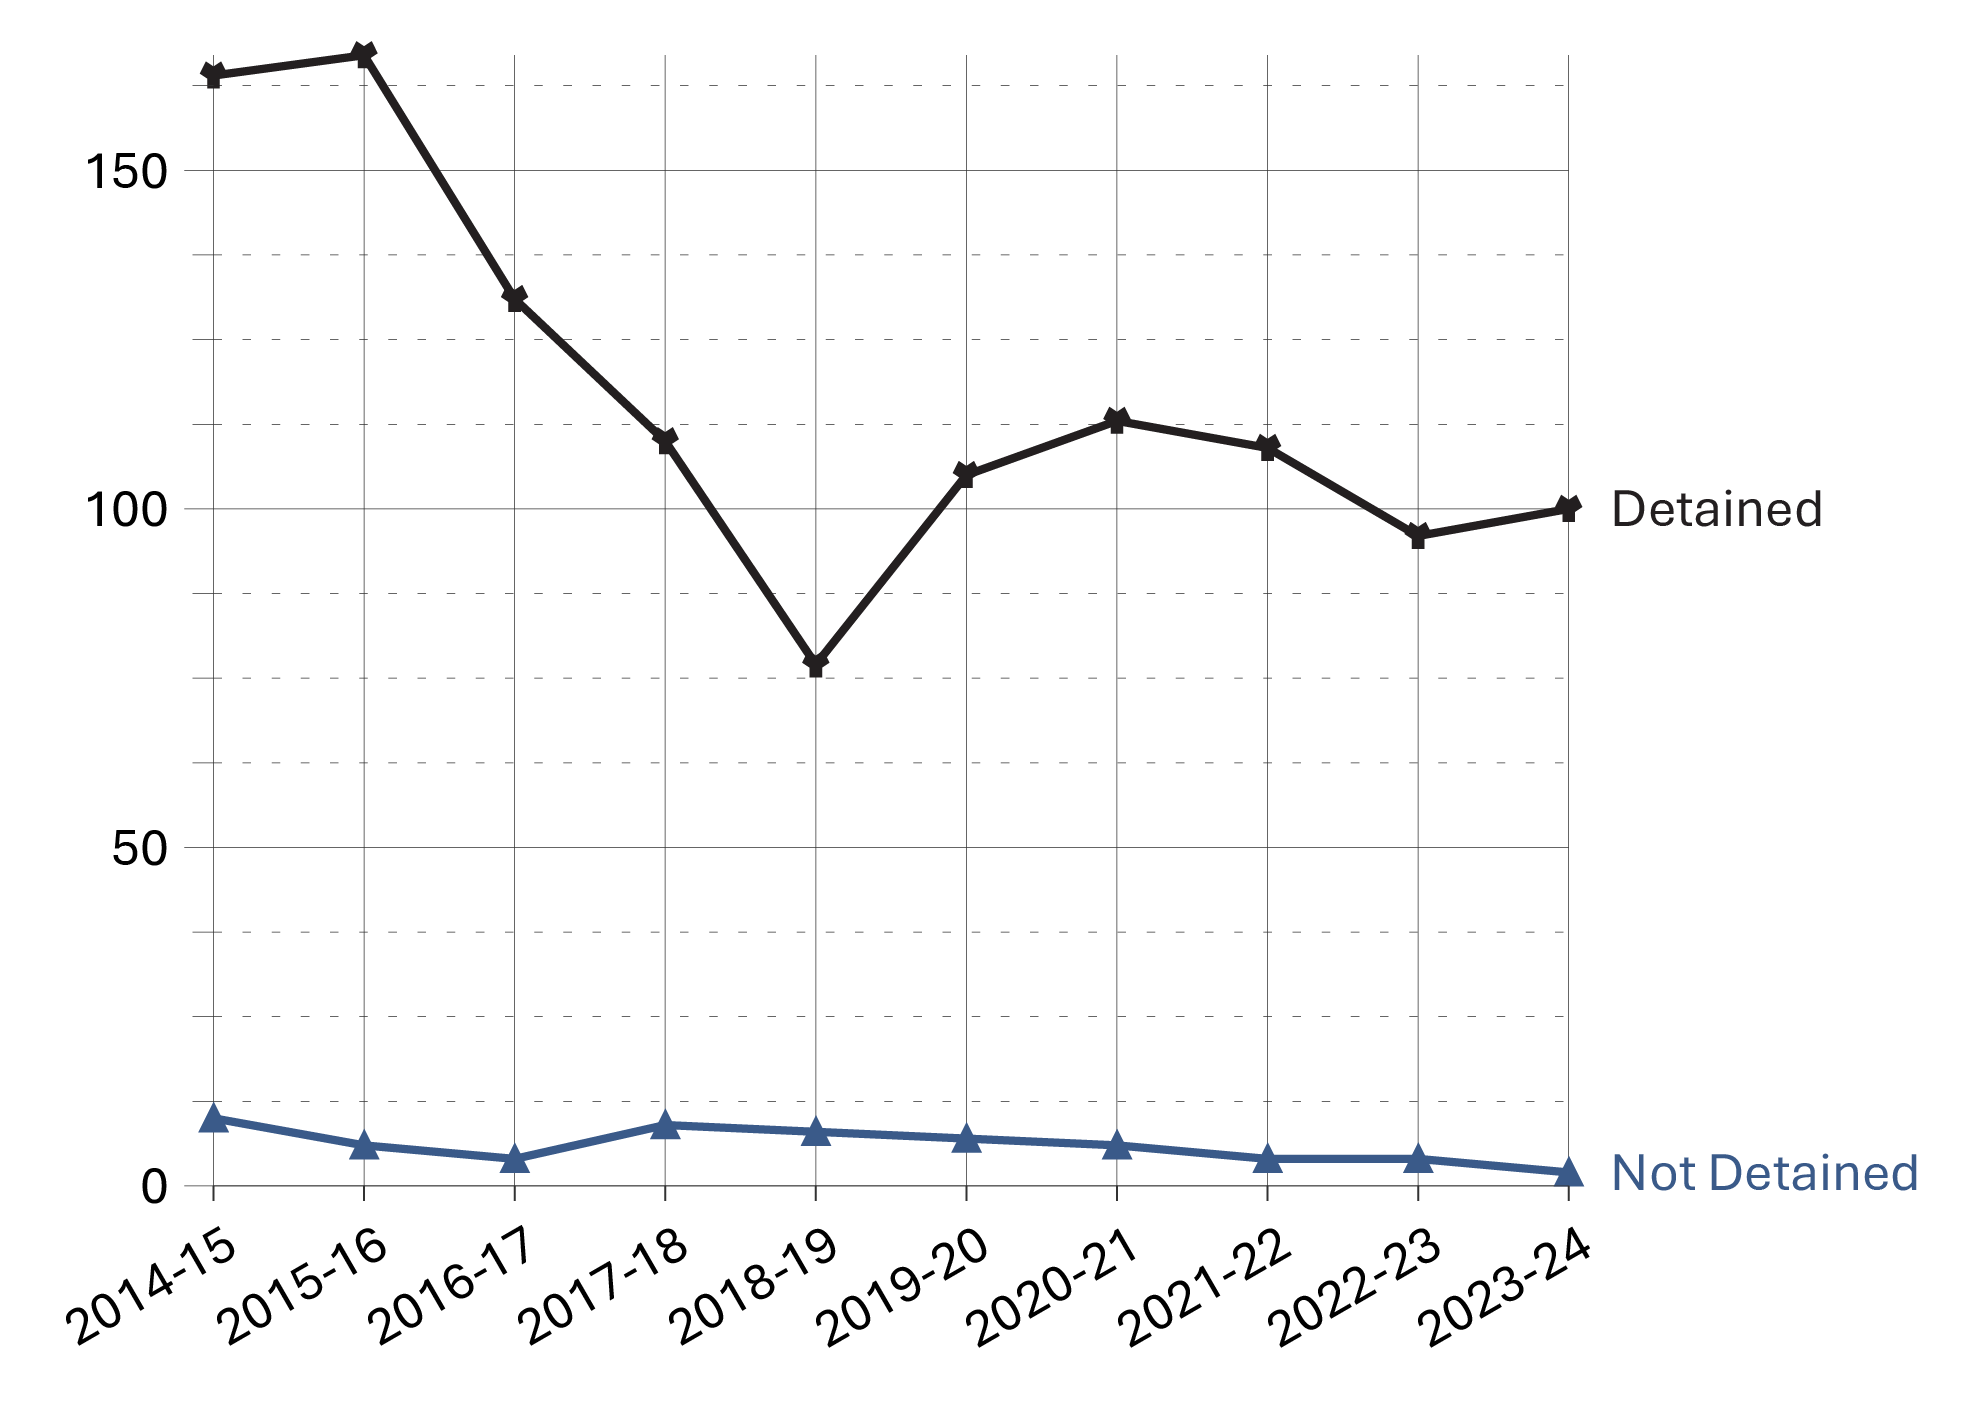
Image description
Line graph showing the number of initial detention reviews over a ten year period from fiscal year 2014-15 to 2023-24. The graph includes the number of reviews for detained offenders and non-detained offenders. Over time, the number of reviews for detained offenders are consistently higher than for non-detained offenders. There was a steady decline for detained offender reviews until fiscal year 2018-19, then the number slightly increased. Detention reviews for non-detained offenders remained consistently low over time. Full data are available in the table below.
Source: Parole Board of Canada.
- In 2023-24, the number of referrals for detention increased slightly from 100 to 102 when compared to 2022-23. The detention rate was 98.0%.
- In 2023-24, the detention rate for all race groups was 100% apart from Caucasian offenders with a detention rate of 95.1%.
- As of April 7, 2024, Indigenous offenders accounted for 32.7%, Asian offenders accounted for 5.2%, Black offenders accounted for 9.2%, Caucasian offenders accounted for 44.9%, and offenders in the “Other” race group accounted for 8.0%, of the federal incarcerated offender population serving determinate sentences.
- In 2023-24, Indigenous offenders accounted for 41.2% and Caucasian offenders accounted for 40.2% of federal incarcerated offenders serving determinate sentences of offenders referred for detention. Black (9.8%), Asian (4.9%) and “Other” (3.9%) race groups accounted for the remaining proportion of federal incarcerated offenders serving determinate sentences of offenders referred for detention.
Table E1. Number of initial detention reviews by race group
| Race group | 2014-15 | 2015-16 | 2016-17 | 2017-18 | 2018-19 | 2019-20 | 2020-21 | 2021-22 | 2022-23 | 2023-24 |
|---|---|---|---|---|---|---|---|---|---|---|
| Indigenous | 71 | 75 | 55 | 51 | 38 | 50 | 58 | 49 | 48 | 42 |
| Asian | 7 | 2 | 1 | 1 | 2 | 2 | 3 | 6 | 3 | 5 |
| Black | 10 | 13 | 10 | 10 | 6 | 6 | 12 | 10 | 8 | 10 |
| Caucasian | 69 | 76 | 59 | 47 | 28 | 43 | 38 | 43 | 34 | 39 |
| Other | 7 | 1 | 6 | 1 | 3 | 4 | 2 | 1 | 3 | 4 |
| Total (#) | 164 | 167 | 131 | 110 | 77 | 105 | 113 | 109 | 96 | 100 |
| Total (%) | 94.3 | 96.5 | 97.0 | 92.4 | 90.6 | 93.8 | 95.0 | 96.5 | 96.0 | 98.0 |
| Race group | 2014-15 | 2015-16 | 2016-17 | 2017-18 | 2018-19 | 2019-20 | 2020-21 | 2021-22 | 2022-23 | 2023-24 |
|---|---|---|---|---|---|---|---|---|---|---|
| Indigenous | 5 | 2 | 2 | 5 | 6 | 4 | 2 | 1 | 2 | 0 |
| Asian | 0 | 1 | 1 | 0 | 0 | 0 | 0 | 0 | 0 | 0 |
| Black | 1 | 2 | 0 | 1 | 0 | 1 | 1 | 2 | 0 | 0 |
| Caucasian | 4 | 1 | 1 | 3 | 2 | 2 | 3 | 0 | 2 | 2 |
| Other | 0 | 0 | 0 | 0 | 0 | 0 | 0 | 1 | 0 | 0 |
| Total (#) | 10 | 6 | 4 | 9 | 8 | 7 | 6 | 4 | 4 | 2 |
| Total (%) | 5.7 | 3.5 | 3.0 | 7.6 | 9.4 | 6.3 | 5.0 | 3.5 | 4.0 | 2.0 |
| Race group | 2014-15 | 2015-16 | 2016-17 | 2017-18 | 2018-19 | 2019-20 | 2020-21 | 2021-22 | 2022-23 | 2023-24 |
|---|---|---|---|---|---|---|---|---|---|---|
| Indigenous | 76 | 77 | 57 | 56 | 44 | 54 | 60 | 50 | 50 | 42 |
| Asian | 7 | 3 | 2 | 1 | 2 | 2 | 3 | 6 | 3 | 5 |
| Black | 11 | 15 | 10 | 11 | 6 | 7 | 13 | 12 | 8 | 10 |
| Caucasian | 73 | 77 | 60 | 50 | 30 | 45 | 41 | 43 | 36 | 41 |
| Other | 7 | 1 | 6 | 1 | 3 | 4 | 2 | 2 | 3 | 4 |
| Total (#) | 174 | 173 | 135 | 119 | 85 | 112 | 119 | 113 | 100 | 102 |
| Total (%) | 100.0 | 100.0 | 100.0 | 100.0 | 100.0 | 100.0 | 100.0 | 100.0 | 100.0 | 100.0 |
Source: Parole Board of Canada.
Table E1 Notes
During intake assessment, parole officers ask federal offenders to self-identify their race and this information is entered into the Correctional Service of Canada's (CSC) Offender Management System. Parole Board of Canada (PBC) uses the term “race grouping” as this is the term used by CSC to collect the information from offenders and also reflects how the data is captured in CSC's and PBC's data tables.
Initial Detention Review: In accordance with subsection 130(1) of the Corrections and Conditional Release Act, a review conducted upon referral by the Correctional Service of Canada. On completion of its review, the Board may order that an individual not be released from imprisonment before the expiration of their sentence according to law – except on an escorted temporary absence for medical or administrative reasons – if it is satisfied that the individual is likely, if released, to commit an offence causing the death of or serious harm to another person, a sexual offence involving a child, or a serious drug offence before the end of their sentence. Detention orders are subject to review within 1 or 2 years, depending on the type of offence.
Reported year periods reflect fiscal years. A fiscal year runs from April 1 to March 31 of the following year.
Annual judicial review hearings
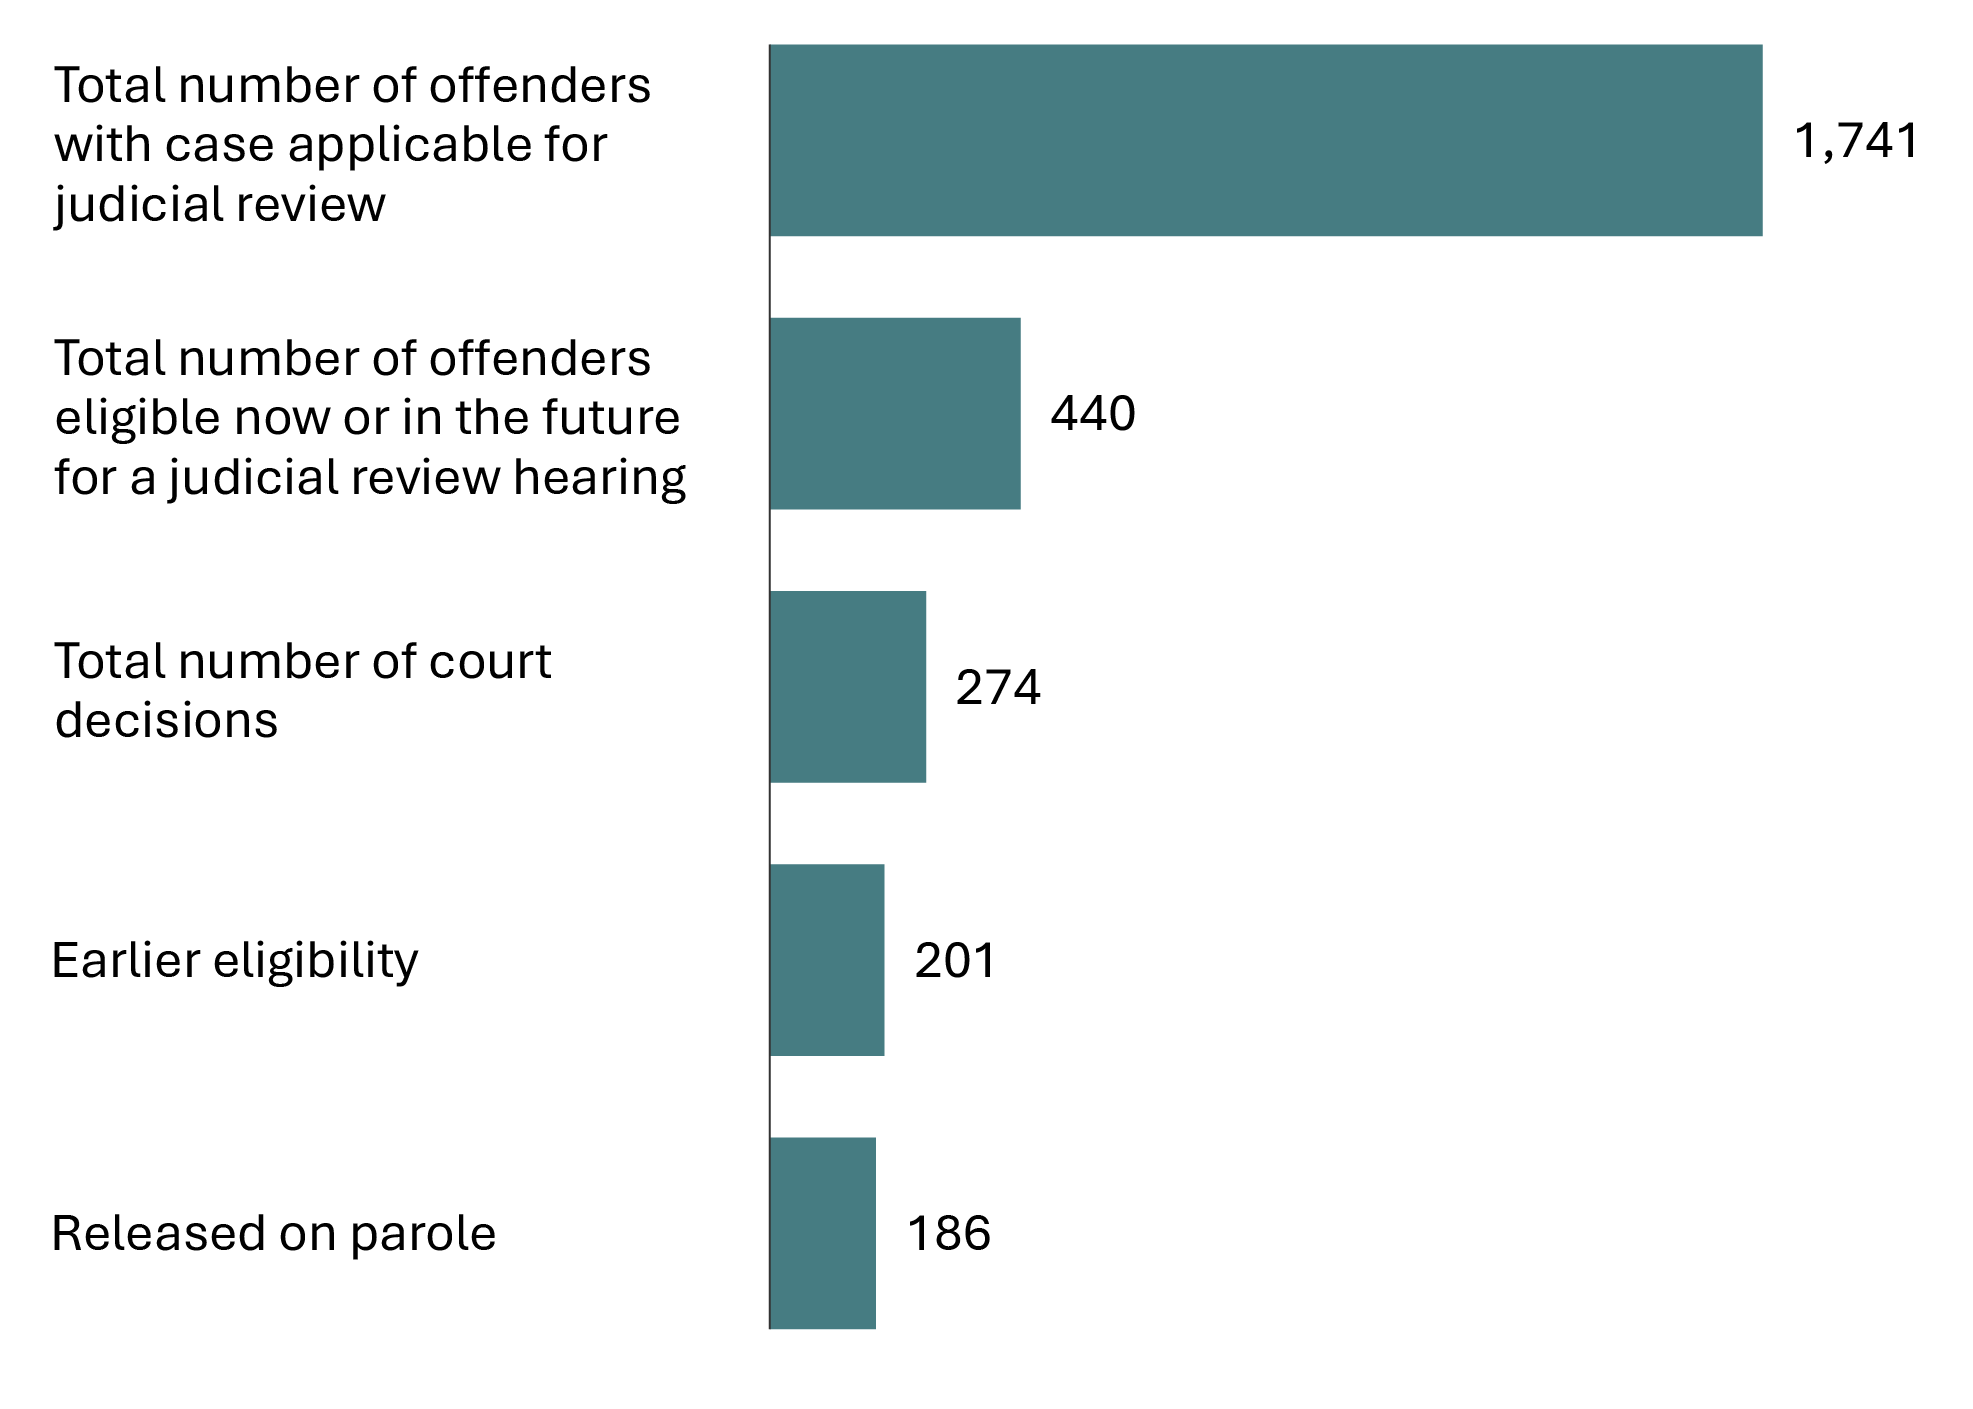
Image description
Bar chart showing the number of judicial review hearings between fiscal year 1987-88 and 2023-24. The chart includes the total number of offenders with cases applicable for judicial review, the total number of offenders eligible at this time or in the future for a judicial review hearing, the total number of court decisions, decisions of earlier eligibility, and the number of offenders released on parole. The number of offenders with a case applicable for judicial review had the greatest number of review hearings in the time period. Full data are available in the table below.
Source: Correctional Service of Canada.
- Since the first judicial review hearing in 1987, there have been a total of 274 court decisions (i.e., between fiscal year 1987-88 and the end of fiscal year 2023-24).
- Of these cases, 73.4% of the court decisions resulted in a reduction of the period that must be served before parole eligibility.
- Of the 440 offenders eligible to apply for a judicial review, 291 have already served 15 years of their sentence, whereas 149 have not.
- Of the 201 offenders who had their parole eligibility date moved closer, 197 had reached their revised Day Parole eligibility date. Of these offenders, 186 were released on parole, and 122 were being actively supervised in the communityFootnote *.
- A higher percentage of second degree (81.5%) than first degree (72.5%) murder cases have resulted in a reduction of the period required to be served before parole eligibility.
Table E2. Judicial review hearings between fiscal year 1987-88 and fiscal year 2023-24
| Province/territory of judicial review | 1st degree murder | 2nd degree murder |
|---|---|---|
| Northwest Territories | 1 | 0 |
| Nunavut | 0 | 0 |
| Yukon | 0 | 0 |
| Newfoundland and Labrador | 0 | 0 |
| Prince Edward Island | 0 | 0 |
| Nova Scotia | 1 | 1 |
| New Brunswick | 1 | 0 |
| Quebec | 81 | 16 |
| Ontario | 28 | 0 |
| Manitoba | 8 | 4 |
| Saskatchewan | 7 | 0 |
| Alberta | 21 | 0 |
| British Columbia | 31 | 1 |
| Total | 179 | 22 |
| Province/territory of judicial review | 1st degree murder | 2nd degree murder |
|---|---|---|
| Northwest Territories | 0 | 0 |
| Nunavut | 0 | 0 |
| Yukon | 0 | 0 |
| Newfoundland and Labrador | 0 | 0 |
| Prince Edward Island | 0 | 0 |
| Nova Scotia | 1 | 0 |
| New Brunswick | 1 | 0 |
| Quebec | 7 | 2 |
| Ontario | 36 | 1 |
| Manitoba | 1 | 0 |
| Saskatchewan | 3 | 0 |
| Alberta | 9 | 1 |
| British Columbia | 10 | 1 |
| Total | 68 | 5 |
| Province/territory of judicial review | 1st degree murder | 2nd degree murder |
|---|---|---|
| Northwest Territories | 1 | 0 |
| Nunavut | 0 | 0 |
| Yukon | 0 | 0 |
| Newfoundland and Labrador | 0 | 0 |
| Prince Edward Island | 0 | 0 |
| Nova Scotia | 2 | 1 |
| New Brunswick | 2 | 0 |
| Quebec | 88 | 18 |
| Ontario | 64 | 1 |
| Manitoba | 9 | 4 |
| Saskatchewan | 10 | 0 |
| Alberta | 30 | 1 |
| British Columbia | 41 | 2 |
| Total | 247 | 27 |
Source: Correctional Service of Canada.
Table E2 Notes
Judicial review is an application to the court for a reduction in the time required to be served before being eligible for parole. Judicial review procedures apply to offenders who have been sentenced to imprisonment for life without eligibility for parole until more than 15 years of their sentence has been served. Offenders can apply when they have served at least 15 years of their sentence. Judicial reviews are conducted in the province where the conviction took place.
Reported year periods reflect fiscal years. A fiscal year runs from April 1 to March 31 of the following year.
Number of Dangerous Offender designations
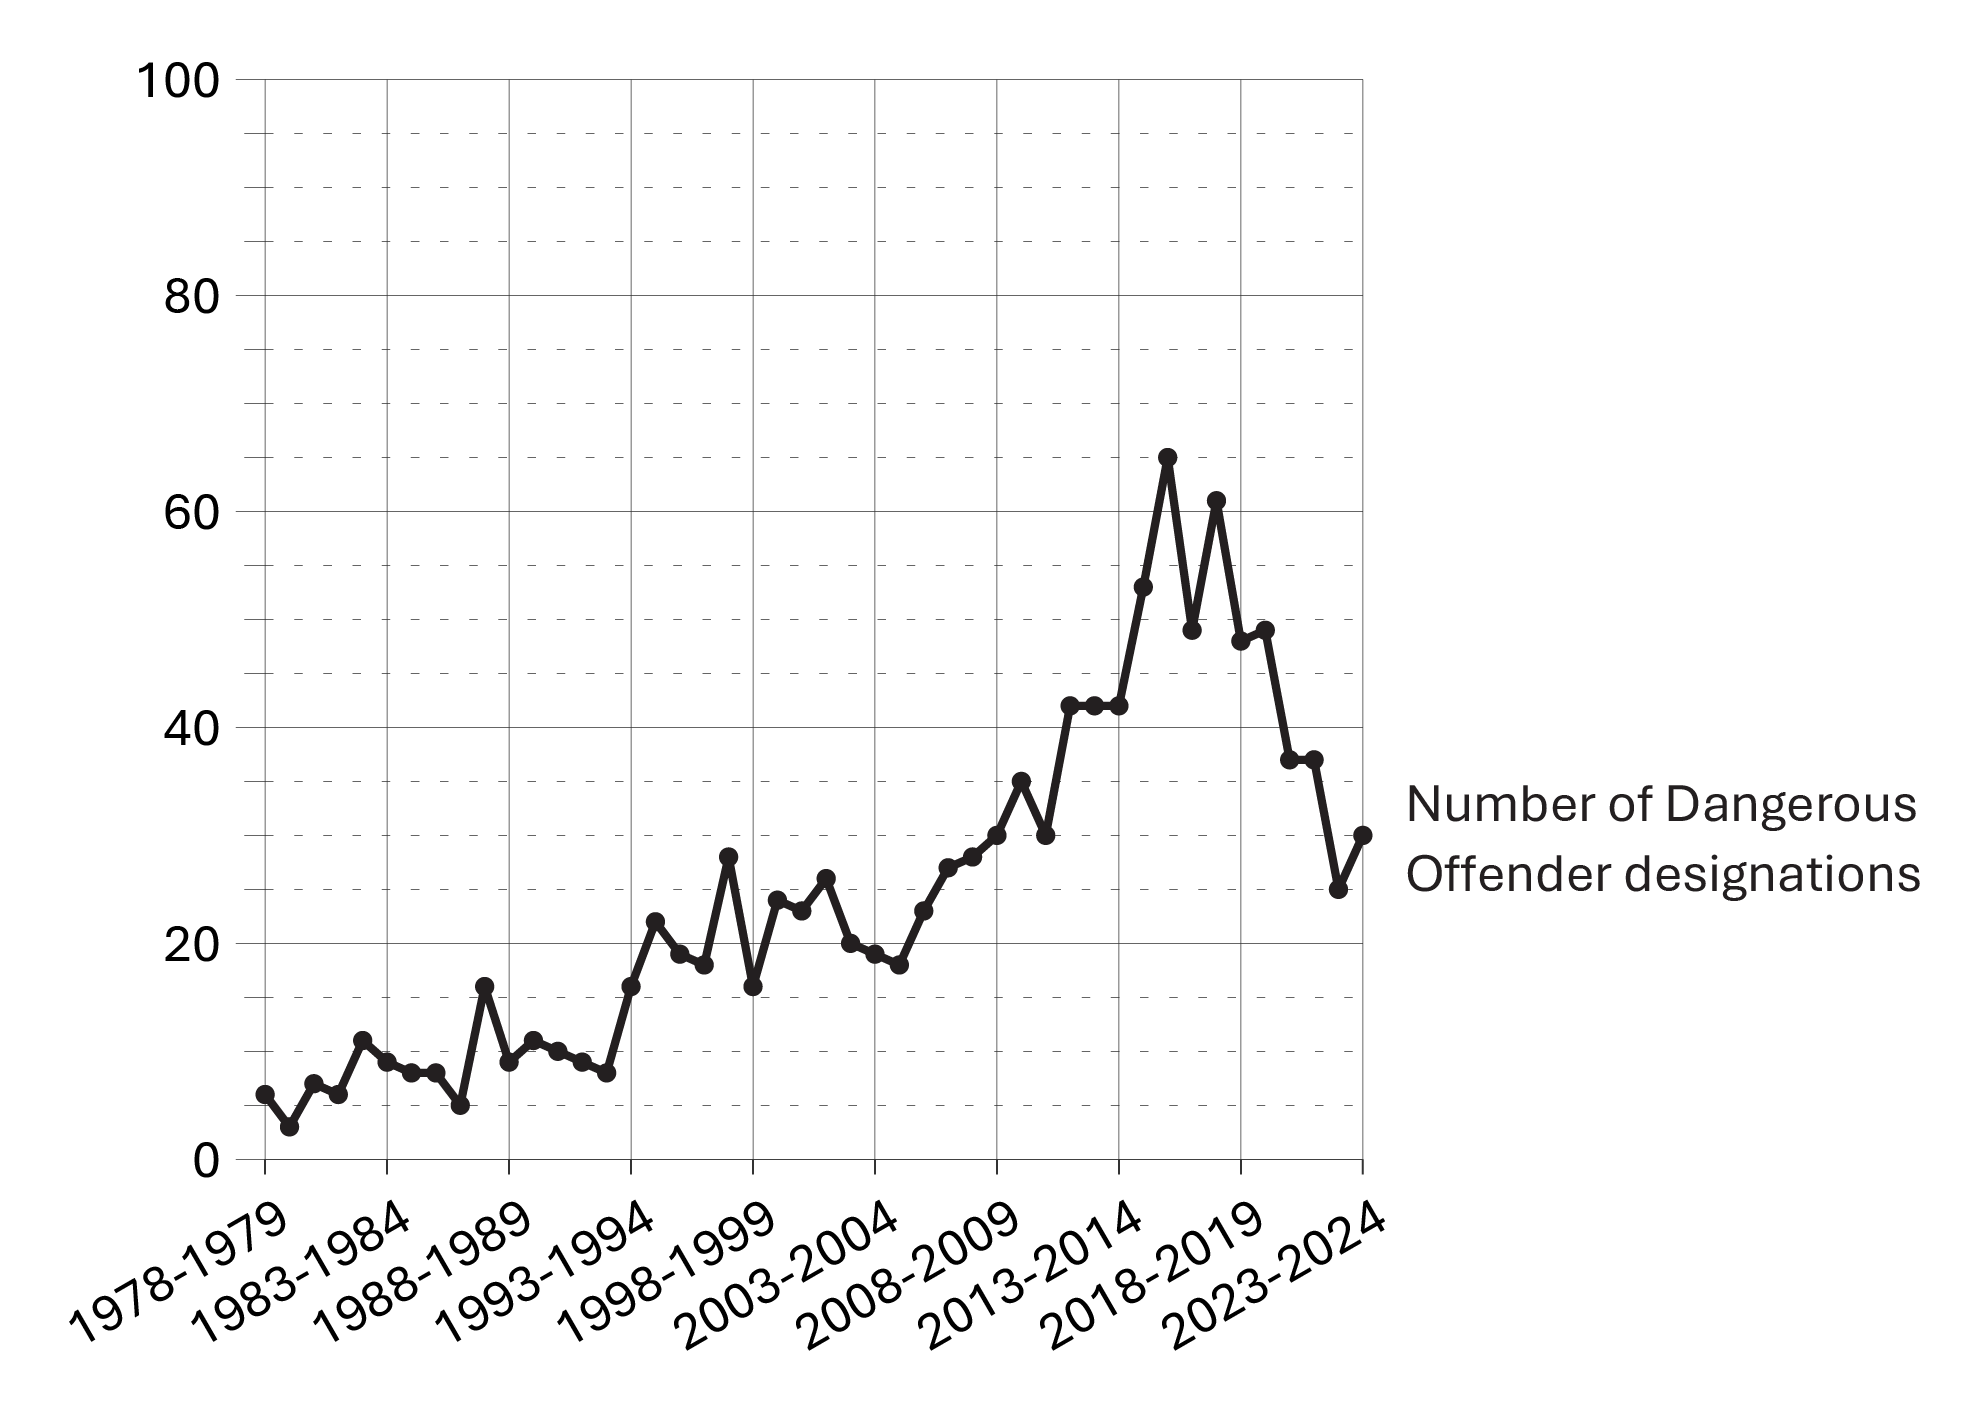
Image description
Line graph showing the total number of offenders designated as Dangerous Offenders between fiscal year 1978-79 and 2023-24. The number of Dangerous Offenders designations have steadily increased over time, with the sharpest peak in fiscal years 2015-16 and 2017-18. After this, the number of Dangerous Offender designations has steadily decreased, though have not returned to the levels observed previous to the mid-2000s. Full data are available in the table below.
Source: Correctional Service of Canada.
- As of the end of fiscal year 2023-24, 1,128 Dangerous Offender designations were ordered by the court since 1978.
- At the end of fiscal year 2023-24 there were 909 offenders with a Dangerous Offender designation under the responsibility of Correctional Service Canada, and of those, 74.1% had indeterminate sentences.
- Of these 909 offenders with a Dangerous Offender designation, 740 were in custody (representing 5.3% of the total in-custody population) and 169 were in the community under supervision. There were 10 female offenders with a Dangerous Offender designation. Indigenous offenders accounted for 37.7% of the offenders with a Dangerous Offender designation and 29.0% of the total offender population.
| Province/territory of designation | # of indeterminate offenders | # of determinate offenders | Total |
|---|---|---|---|
| Newfoundland and Labrador | 6 | 2 | 8 |
| Nova Scotia | 19 | 3 | 22 |
| Prince Edward Island | 0 | 0 | 0 |
| New Brunswick | 4 | 0 | 4 |
| Quebec | 98 | 31 | 129 |
| Ontario | 288 | 119 | 407 |
| Manitoba | 27 | 4 | 31 |
| Saskatchewan | 60 | 40 | 100 |
| Alberta | 55 | 10 | 65 |
| British Columbia | 107 | 20 | 127 |
| Yukon | 2 | 3 | 5 |
| Northwest Territories | 8 | 1 | 9 |
| Nunavut | 0 | 2 | 2 |
| Total | 674 | 235 | 909 |
Source: Correctional Service of Canada.
| Province/territory of designation | All designations (designated since 1978) |
|---|---|
| Newfoundland and Labrador | 15 |
| Nova Scotia | 29 |
| Prince Edward Island | 0 |
| New Brunswick | 8 |
| Quebec | 157 |
| Ontario | 498 |
| Manitoba | 35 |
| Saskatchewan | 114 |
| Alberta | 79 |
| British Columbia | 171 |
| Yukon | 7 |
| Northwest Territories | 11 |
| Nunavut | 4 |
| Total | 1,128 |
Source: Correctional Service of Canada.
Table E3 Notes
The number of Dangerous Offenders designated per year does not include overturned decisions.
Offenders who have died since receiving designations are no longer classified as “active”; however, they are still represented in the above graph, which depicts the total number of offenders “designated”.
The percentage of offenders with a Dangerous Offender designation who had at least one current conviction for a sexual offence is not available.
Dangerous Offender legislation came into effect in Canada on October 15, 1977, replacing the Habitual Offender and Dangerous Sexual Offender provisions that were abolished. A Dangerous Offender is an individual given an indeterminate or a determinate sentence on the basis of a particularly violent crime or pattern of serious violent offences where it is judged that the offender's behaviour is unlikely to be inhibited by normal standards of behavioural restraint (see Section 753 of the Criminal Code of Canada).
In addition to the offenders with a Dangerous Offender designation, there were 6 Dangerous Sexual Offenders and 1 offender with an Habitual Offender designation under the responsibility of Correctional Service Canada at the end of fiscal year 2023-24.
Determinate sentence for Dangerous Offenders must be a minimum punishment of imprisonment for a term of two years — and have an order that the offender be subject to long-term supervision for a period that does not exceed 10 years.
Reported year periods reflect fiscal years. A fiscal year runs from April 1 to March 31 of the following year.
Number of long-term supervision orders imposed
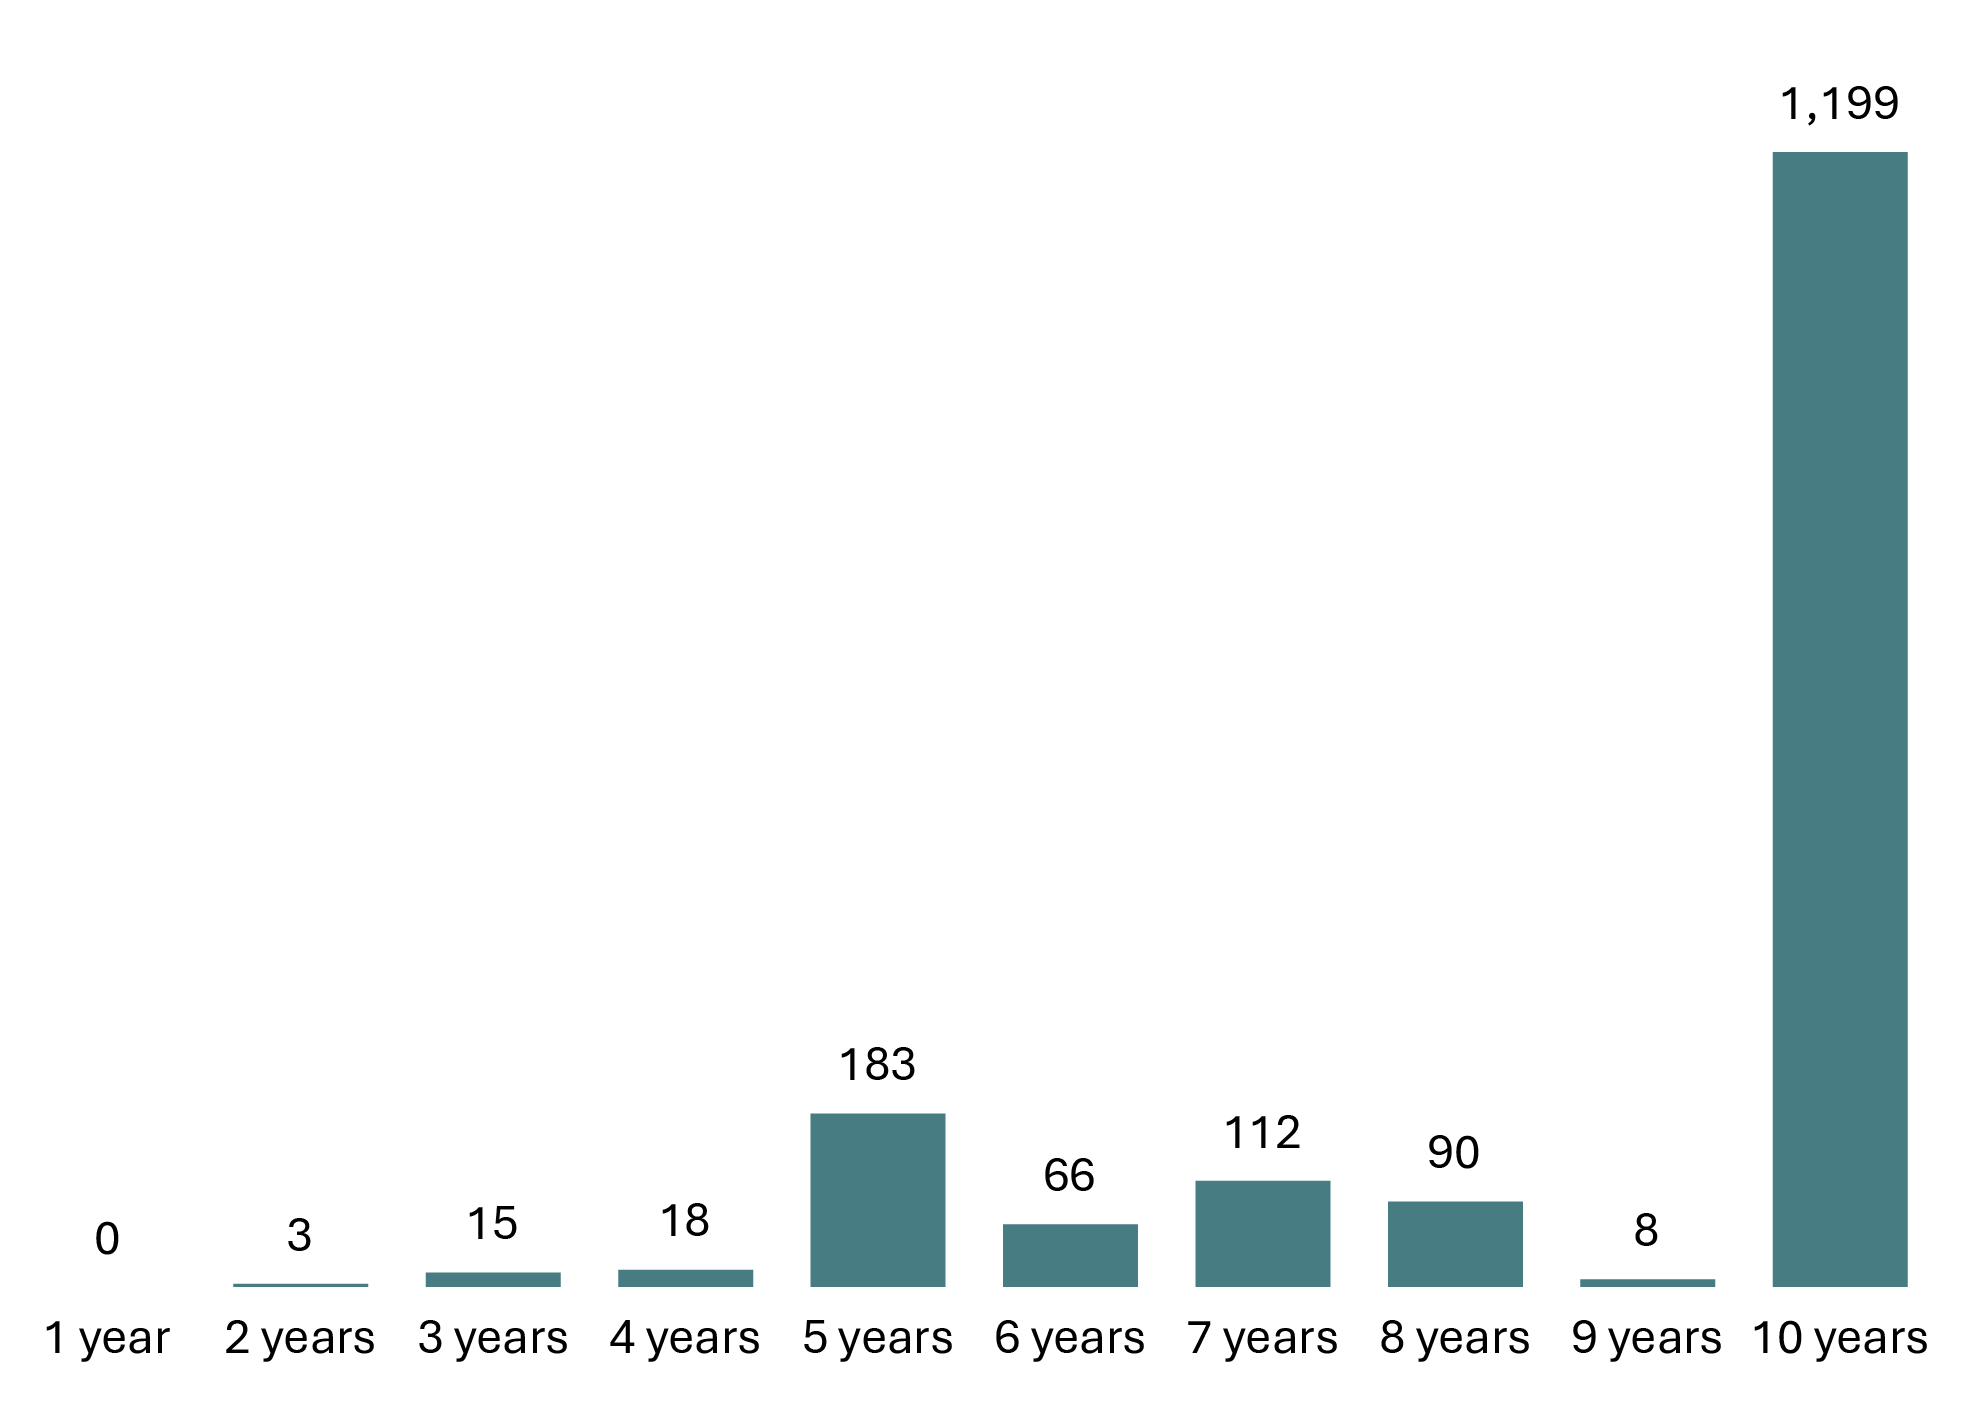
Image description
Bar chart showing the number of long-term supervision orders imposed during the 2023-24 fiscal year, by length of supervision order imposed. The chart includes long-term supervision orders ranging from 1 to 10 years in length. Long term supervision orders are by far the most common for offenders serving a sentence of ten years. The second most common long term supervision order occurrence is for offenders serving a sentence of five years. Full data are available in the table below.
Source: Correctional Service of Canada.
- At the end of fiscal year 2023-24, the courts had imposed 1,694 long term supervision orders since the legislation came into effect. Of these, 70.8% were for a period of 10 years.
- At the end of fiscal year 2023-24, there were 959 offenders with long term supervision orders under the responsibility of Correctional Service Canada. There were 17 females with long term supervision orders under the responsibility of Correctional Service Canada.
- There were 474 offenders being supervised in the community on their long term supervision order at the end of the fiscal year 2023-24. Of these, 376 offenders were supervised in the community, 9 offenders were temporarily detained, 84 offenders were on remand, 4 offenders were unlawfully at large for less than 90 days and 1 offender was supervised and subject to an immigration hold by Canada Border Services Agency.
| Province or territory of order | 1 year | 2 years | 3 years | 4 years | 5 years | 6 years | 7 years | 8 years | 9 years | 10 years | Total |
|---|---|---|---|---|---|---|---|---|---|---|---|
| Newfoundland and Labrador | 0 | 0 | 0 | 0 | 0 | 0 | 0 | 1 | 0 | 13 | 14 |
| Nova Scotia | 0 | 0 | 0 | 0 | 4 | 0 | 1 | 3 | 0 | 17 | 25 |
| Prince Edward Island | 0 | 0 | 0 | 0 | 1 | 0 | 0 | 0 | 0 | 1 | 2 |
| New Brunswick | 0 | 0 | 1 | 0 | 2 | 0 | 0 | 1 | 0 | 8 | 12 |
| Quebec | 0 | 2 | 10 | 6 | 112 | 29 | 57 | 27 | 3 | 385 | 631 |
| Ontario | 0 | 0 | 1 | 8 | 20 | 16 | 26 | 34 | 0 | 387 | 492 |
| Manitoba | 0 | 0 | 0 | 0 | 1 | 2 | 3 | 2 | 0 | 39 | 47 |
| Saskatchewan | 0 | 1 | 1 | 1 | 12 | 10 | 14 | 11 | 3 | 101 | 154 |
| Alberta | 0 | 0 | 1 | 0 | 10 | 1 | 1 | 1 | 0 | 80 | 94 |
| British Columbia | 0 | 0 | 0 | 2 | 14 | 4 | 7 | 8 | 0 | 140 | 175 |
| Yukon | 0 | 0 | 0 | 0 | 2 | 1 | 3 | 1 | 1 | 19 | 27 |
| Northwest Territories | 0 | 0 | 0 | 0 | 2 | 1 | 0 | 0 | 1 | 4 | 8 |
| Nunavut | 0 | 0 | 1 | 1 | 3 | 2 | 0 | 1 | 0 | 5 | 13 |
| Total | 0 | 3 | 15 | 18 | 183 | 66 | 112 | 90 | 8 | 1,199 | 1,694 |
Source: Correctional Service of Canada.
| Province or territory of order | Incarcerated | DP, FP or SRFootnote * | LTSO period | LTSO interruptedFootnote ** | Total |
|---|---|---|---|---|---|
| Newfoundland and Labrador | 1 | 1 | 6 | 1 | 9 |
| Nova Scotia | 4 | 0 | 5 | 2 | 11 |
| Prince Edward Island | 0 | 0 | 0 | 0 | 0 |
| New Brunswick | 0 | 0 | 1 | 3 | 4 |
| Quebec | 147 | 23 | 154 | 55 | 379 |
| Ontario | 66 | 11 | 173 | 33 | 283 |
| Manitoba | 4 | 0 | 8 | 4 | 16 |
| Saskatchewan | 34 | 7 | 40 | 27 | 108 |
| Alberta | 11 | 0 | 23 | 9 | 43 |
| British Columbia | 13 | 5 | 52 | 10 | 80 |
| Yukon | 9 | 0 | 7 | 1 | 17 |
| Northwest Territories | 2 | 0 | 2 | 0 | 4 |
| Nunavut | 1 | 1 | 3 | 0 | 5 |
| Total | 292 | 48 | 474 | 145 | 959 |
Source: Correctional Service of Canada.
Table E4 Notes
Record suspensions and pardons: 5-year trend
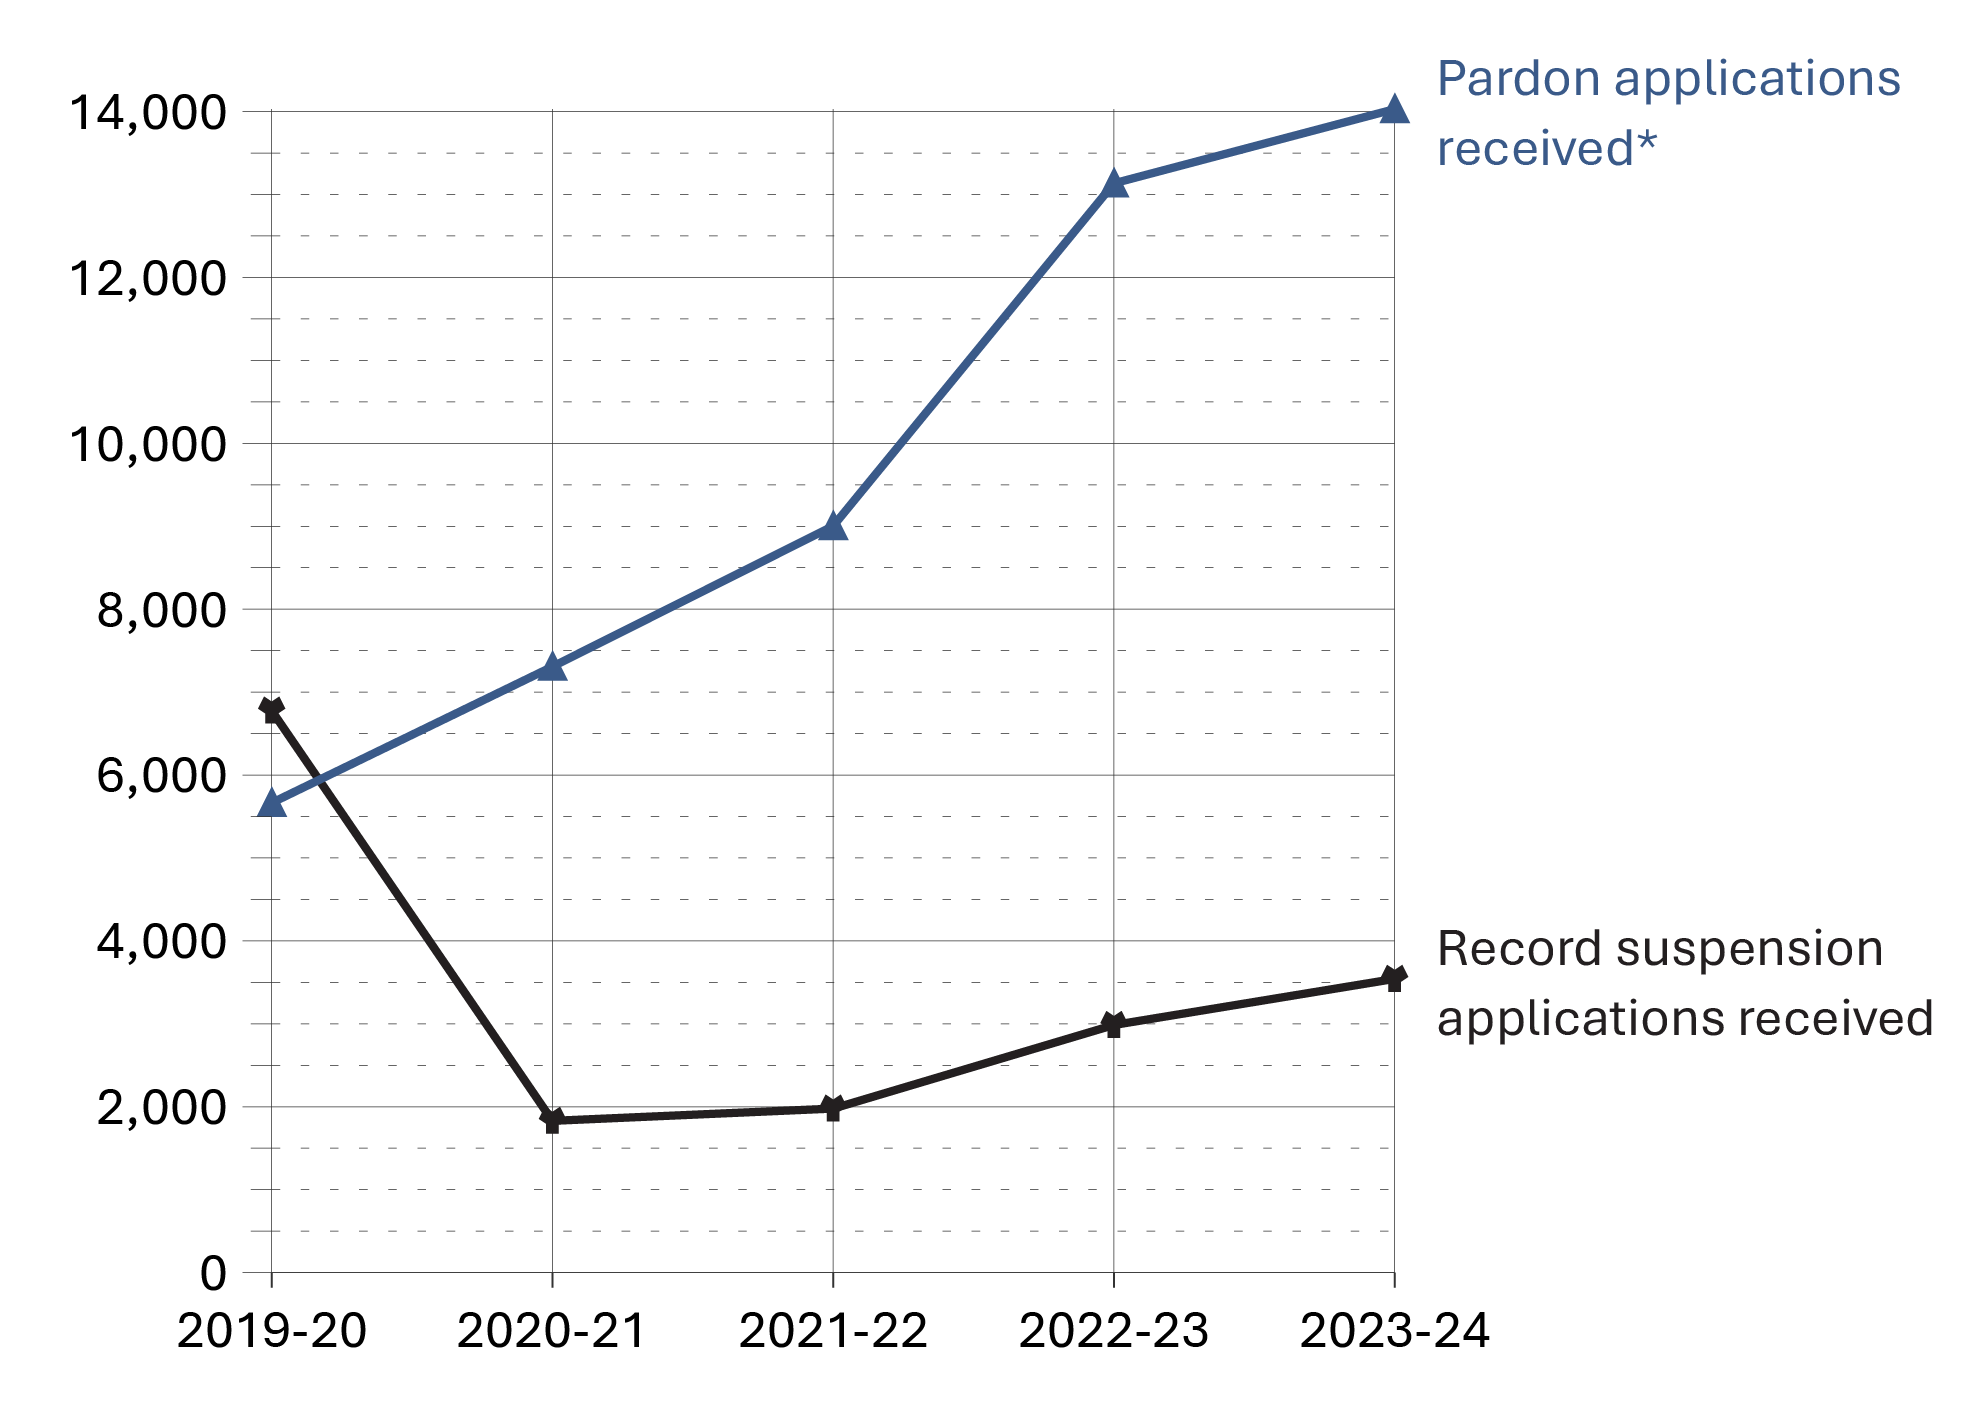
Image description
Line graph showing the number of record suspension and pardon applications received over a five year period from fiscal year 2019-20 to 2023-24. Over the 10-year period, the number of pardon applications received has steadily increased and are far more common than the number of record suspension applications received. In addition, the number of applications for record suspensions sharply declined in fiscal year 2020-21, and have slowly increased, but has not rebounded to the previous number observed in fiscal year 2019-20. Full data are available in the table below.
Source: Parole Board of Canada.
- In 2023-24, the Parole Board of Canada received 3,542 record suspension applications and accepted 2,483 applications for processing. The Board also received 14,030 pardon applications and accepted 10,302 applications for processing. The acceptance rate was 72.8%.
- In 2023-24, the Parole Board of Canada made 2,312 record suspension decisions; 97.3% of record suspensions were ordered and 2.7% were refused.
- In 2023-24, the Parole Board of Canada rendered 10,882 pardon decisions, granting/issuing a pardon in 98.2% of cases and denying a pardon in 1.8% of cases.
- In 2023-24, the PBC also ordered 123 Cannabis Record Suspensions.
- In the past 5 fiscal years (from 2019-20 to 2023-24), the number of record suspension and pardon applications received by the Parole Board of Canada increased by 41.2%Footnote *.
- Since 1970, when the pardon/record suspension process began, 584,754 pardons/record suspensions have been granted/issued and ordered.
Table E5. Number of record suspension and pardon applicationsFootnote *, decisions and revocations/cessations
| Record suspension applications | 2019-20 | 2020-21 | 2021-22 | 2022-23 | 2023-24 |
|---|---|---|---|---|---|
| Received | 6,777 | 1,830 | 1,978 | 2,986 | 3,542 |
| Accepted | 5,227 | 1,411 | 1,254 | 2,072 | 2,483 |
| % accepted | 77.1 | 77.1 | 63.4 | 69.4 | 70.1 |
| Record suspension decisions | 2019-20 | 2020-21 | 2021-22 | 2022-23 | 2023-24 |
|---|---|---|---|---|---|
| Ordered | 5,287 | 1,403 | 1,559 | 1,909 | 2,250 |
| Refused | 209 | 103 | 56 | 48 | 62 |
| Total ordered/refused | 5,496 | 1,506 | 1,615 | 1,957 | 2,312 |
| % ordered | 96.2 | 93.2 | 96.5 | 97.5 | 97.3 |
| Pardon applications | 2019-20 | 2020-21 | 2021-22 | 2022-23 | 2023-24 |
|---|---|---|---|---|---|
| Received | 5,664 | 7,307 | 9,003 | 13,135 | 14,030 |
| Accepted | 4,360 | 6,032 | 6,031 | 9,545 | 10,302 |
| % accepted | 77.0 | 82.6 | 67.0 | 72.7 | 73.4 |
| Pardon decisions | 2019-20 | 2020-21 | 2021-22 | 2022-23 | 2023-24 |
|---|---|---|---|---|---|
| Granted | 3,155 | 4,846 | 4,667 | 3,810 | 7,052 |
| Issued | 1,552 | 2,467 | 2,053 | 3,498 | 3,629 |
| Denied | 209 | 218 | 245 | 184 | 201 |
| Total granted/issued/denied | 4,916 | 7,531 | 6,965 | 7,492 | 10,882 |
| % granted/issued | 95.7 | 97.1 | 96.5 | 97.5 | 98.2 |
| Cannabis Record Suspensions | 2019-20 | 2020-21 | 2021-22 | 2022-23 | 2023-24 |
|---|---|---|---|---|---|
| Received | 437 | 239 | 197 | 224 | 212 |
| Accepted | 248 | 166 | 146 | 153 | 120 |
| % accepted | 56.8 | 69.5 | 74.1 | 68.3 | 56.6 |
| Ordered | 238 | 168 | 148 | 152 | 123 |
| Pardon/record suspension revocations/cessations | 2019-20 | 2020-21 | 2021-22 | 2022-23 | 2023-24 |
|---|---|---|---|---|---|
| RevocationsFootnote ** | 410 | 314 | 250 | 232 | 284 |
| Cessations | 439 | 270 | 306 | 343 | 349 |
| Total revocations/cessations | 849 | 584 | 556 | 575 | 633 |
| Cumulative # granted/issued and orderedFootnote *** | 545,611 | 554,327 | 562,606 | 571,823 | 584,754 |
| Cumulative # revocations/cessationsFootnote *** | 28,118 | 28,702 | 29,258 | 29,833 | 30,466 |
Source: Parole Board of Canada.
Table E5 Notes
Section F: Federal Services to Registered Victims
Number of contacts with registered victims: 5-year trend
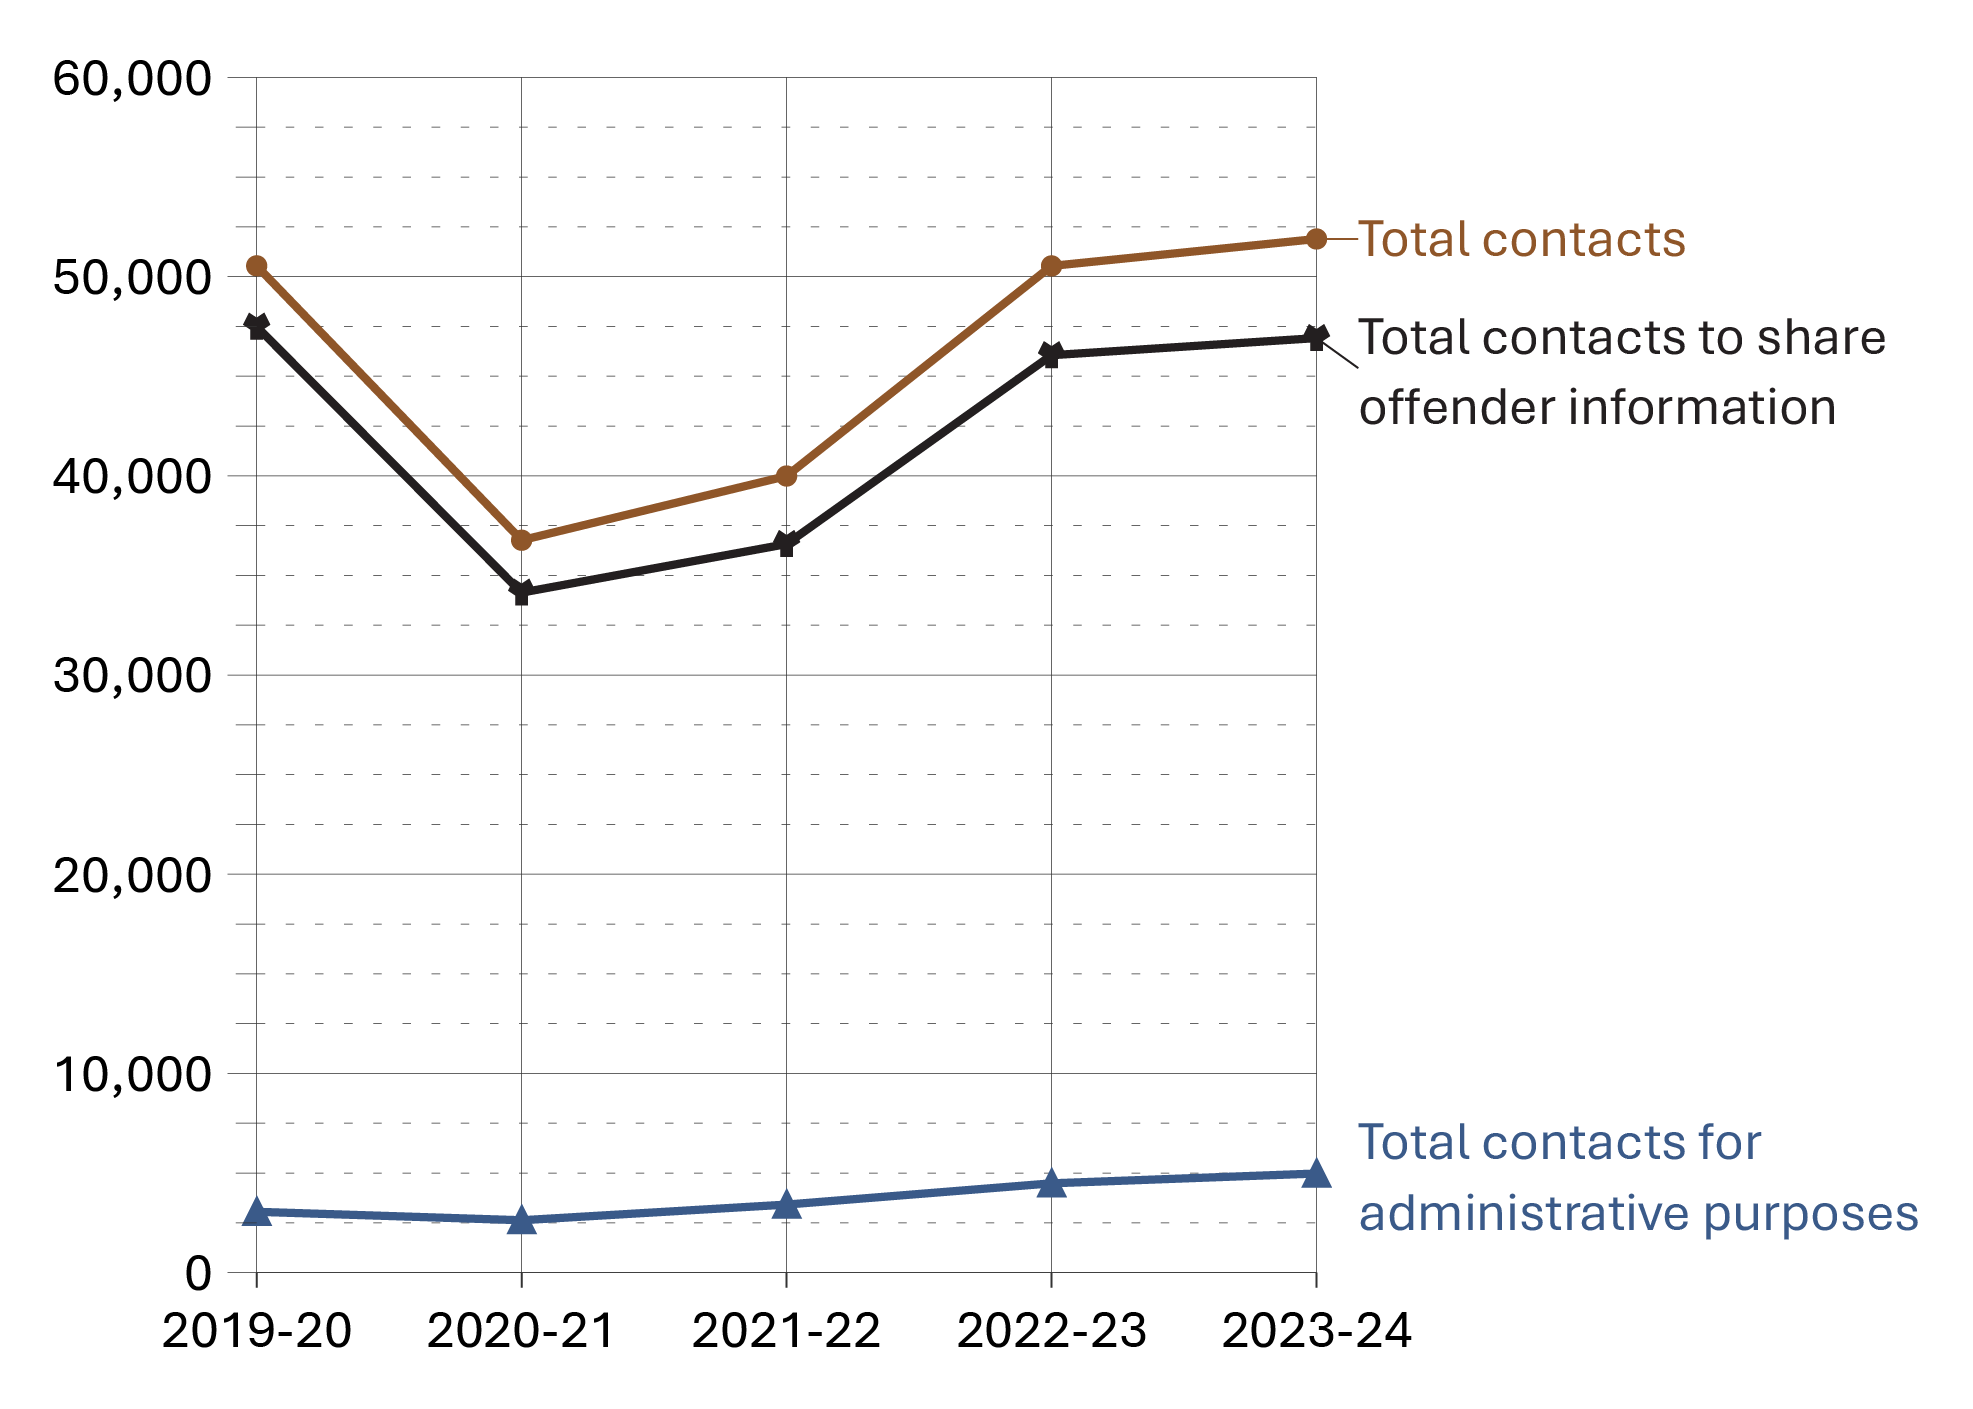
Image description
Line graph showing the number of contacts with registered victims over a five year period from fiscal year 2019-20 to 2023-24. The graph includes the number of total contacts, total contacts to share offender information, and total contacts for administration purposes. Almost all contacts with registered victims were to share offender information. Full data are available in the table below.
Source: Correctional Service of Canada.
- The majority of contacts with registered victims (90.4%) were to share offender information. There was a decrease from 2019-20 to 2023-24, from 94.0% to 90.4%.
- The total number of contacts with registered victims decreased by 20.9% from 2019-20 to 2021-22 (50,539 to 39,989), and then increased by 29.8% from 2021-22 to 2023-24 (39,989 to 51,889).
| Contact type | 2019-20 | 2020-21 | 2021-22 | 2022-23 | 2023-24 |
|---|---|---|---|---|---|
| Total contacts to share offender information | 47,485 | 34,137 | 36,574 | 46,054 | 46,914 |
| Total contacts for administrative purposes | 3,054 | 2,629 | 3,415 | 4,482 | 4,975 |
| Total contacts | 50,539 | 36,766 | 39,989 | 50,536 | 51,889 |
Source: Correctional Service of Canada.
Table F1 Notes
The Canadian Victims Bill of Rights defines a victim as an individual who has suffered physical or emotional harm, property damage, or economic loss as the result of the commission or alleged commission of an offence. The CCRA also allows a spouse, a relative or dependant, an individual who is responsible for the care or support of the victim or the care or support of a dependant of the victim, to act on behalf of a victim, if the victim cannot act on their own behalf. Victims include persons harmed as the result of an act of an offender, whether or not the offender was prosecuted or convicted for that act, as long as an official complaint has been made to the police or to the Crown.
Victims do not automatically receive information about the offender who harmed them. If they have been harmed by an offender serving a sentence of two years or more, victims are asked to register with the Correctional Service of Canada (CSC) or the Parole Board of Canada to receive information or access services. The registration process allows CSC to verify that the individual meets the definition of victim, which is required under law before sharing protected offender information.
For more information about victim registration, visit: https://www.canada.ca/en/correctional-service/services/you-csc/victims/register.html
Contacts to share offender information include those where the CSC Victim Services Unit communicates offender information to victims. This might include information such as temporary absences, transfers, travel permits, conditional release, and sentencing information. Contacts for administrative reasons include tasks such as updating contact information, discussing the Restorative Opportunities program, and referrals to provincial or community stakeholders.
The numbers above exclude internal tasks that do not involve contacting victims, and do not include task types that can be used for documenting both internal tasks or communicating with victims. They also do not count multiple attempts it may take to make contact with a victim.
Reported year periods reflect fiscal years. A fiscal year runs from April 1 to March 31 of the following year.
Number of victim statements received for consideration in release decisions: 5-year trend
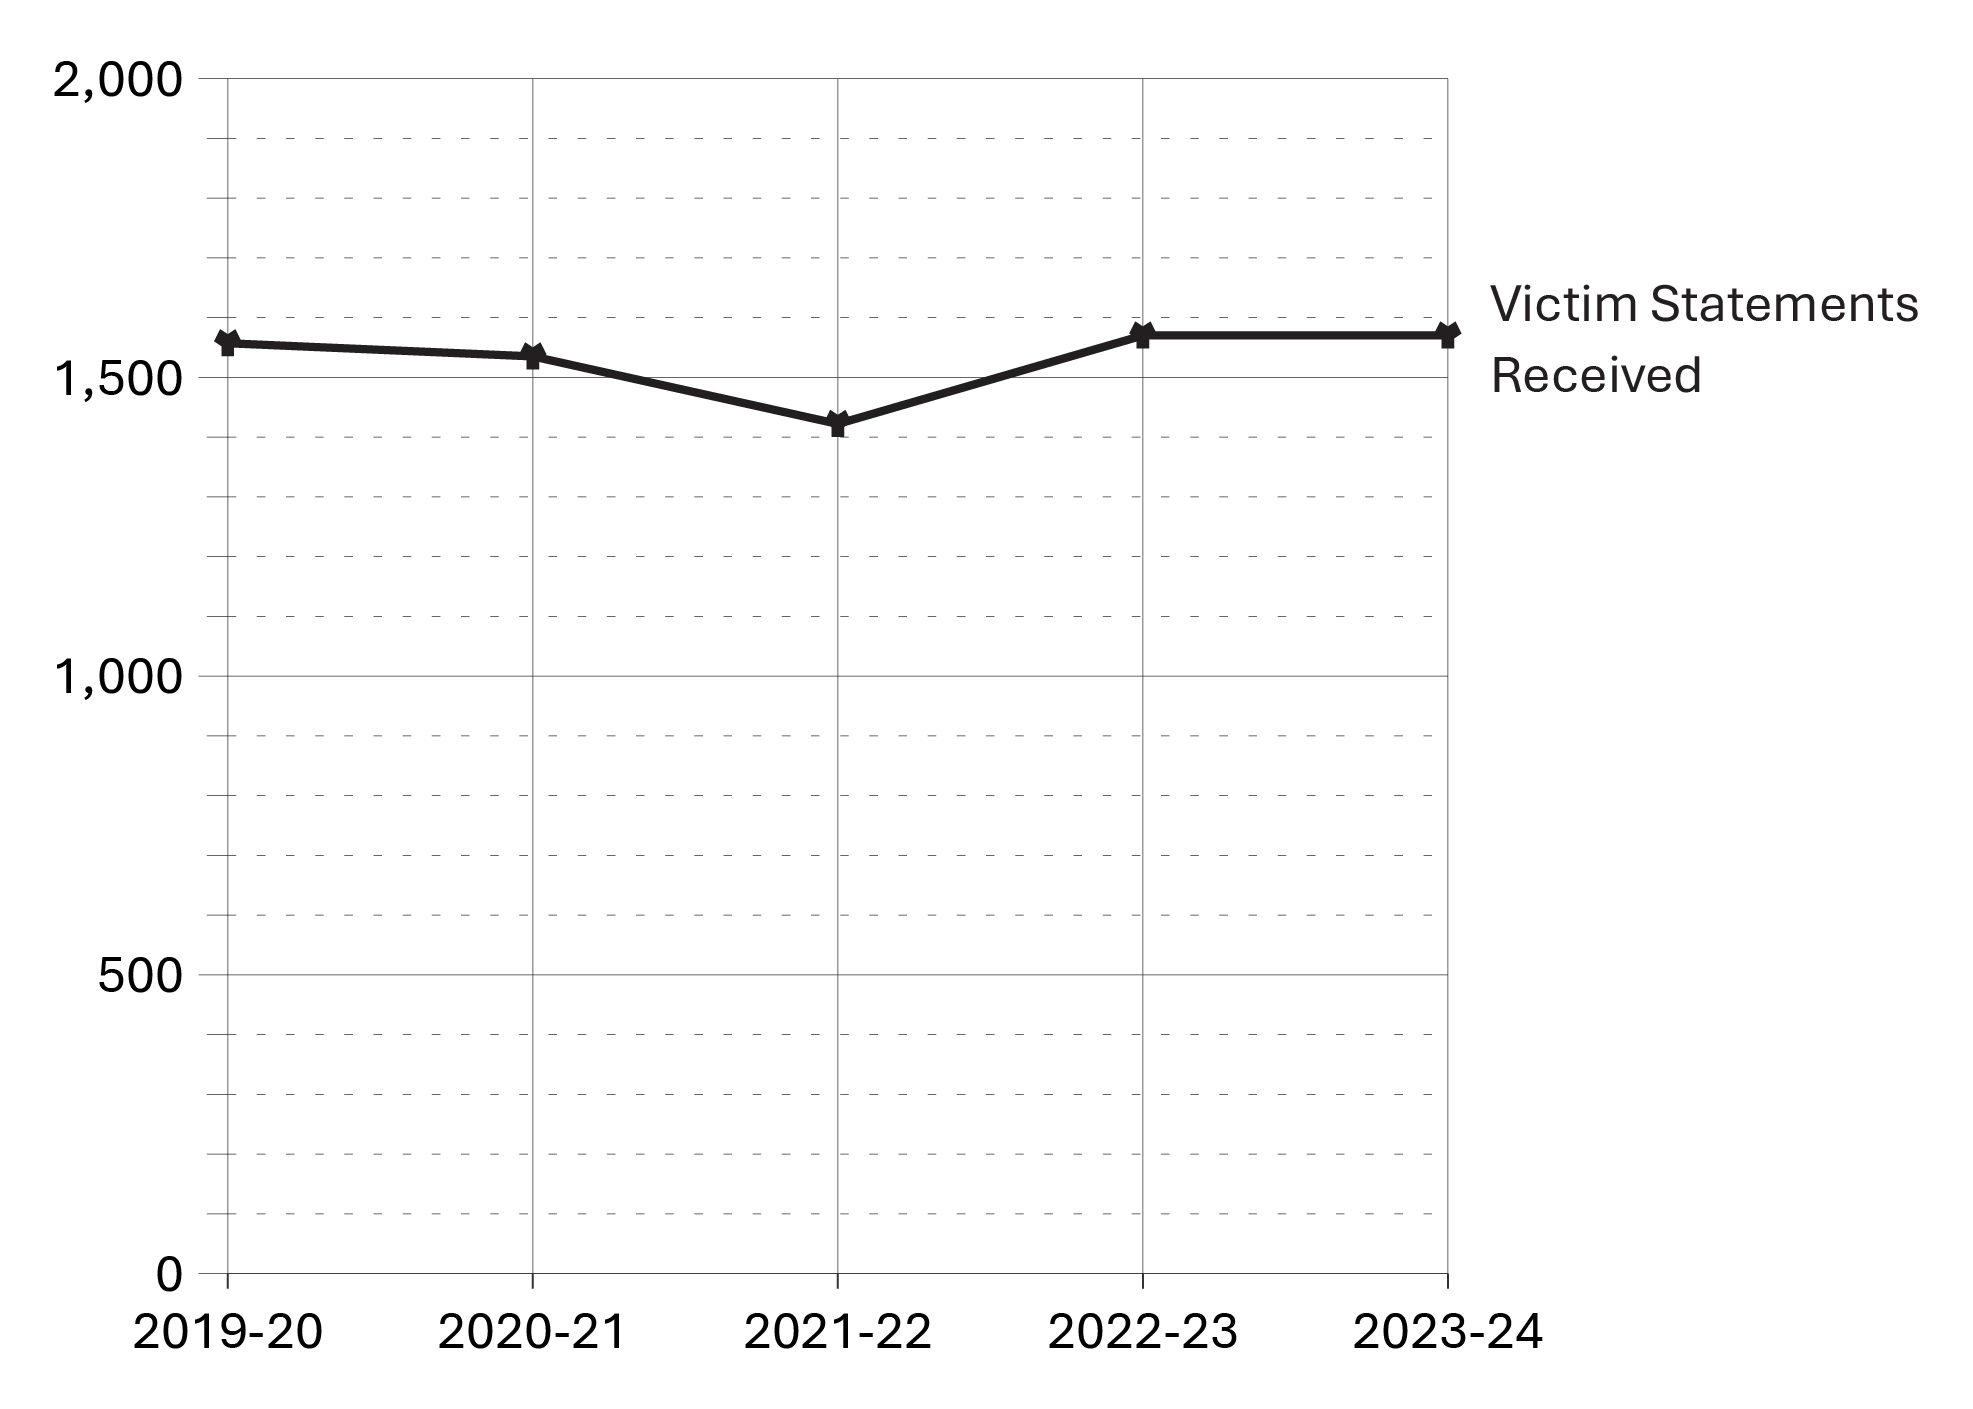
Image description
Line graph showing the number of victim statements received for consideration in release decisions over a five year period from fiscal year 2019-20 to 2023-24. The number of victim statements received has been very consistent over time. Full data are available in the table below.
Source: Correctional Service of Canada.
- The number of victim statements received for consideration remained relatively stable for the past 5 fiscal years.
| Fiscal year | Number of victim statements received |
|---|---|
| 2019-20 | 1,557 |
| 2020-21 | 1,535 |
| 2021-22 | 1,422 |
| 2022-23 | 1,570 |
| 2023-24 | 1,570 |
Source: Correctional Service of Canada.
Table F2 Notes
The Canadian Victims Bill of Rights defines a victim as an individual who has suffered physical or emotional harm, property damage, or economic loss as the result of the commission or alleged commission of an offence. The CCRA also allows a spouse, a relative or dependant, an individual who is responsible for the care or support of the victim or the care or support of a dependant of the victim, to act on behalf of a victim, if the victim cannot act on their own behalf. Victims include persons harmed as the result of an act of an offender, whether or not the offender was prosecuted or convicted for that act, as long as an official complaint has been made to the police or to the Crown.
CSC will consider statements from victims who choose not to register.
Not all statements received will be considered when release decisions are made; victims may choose to withdraw their statement before it is considered. In previous years, these withdrawn statements were included in the reported totals, but they have been excluded from the totals above given they are withdrawn before being considered.
Reported year periods reflect fiscal years. A fiscal year runs from April 1 to March 31 of the following year.
Requests for financial assistance to attend parole hearings: 5-year trend
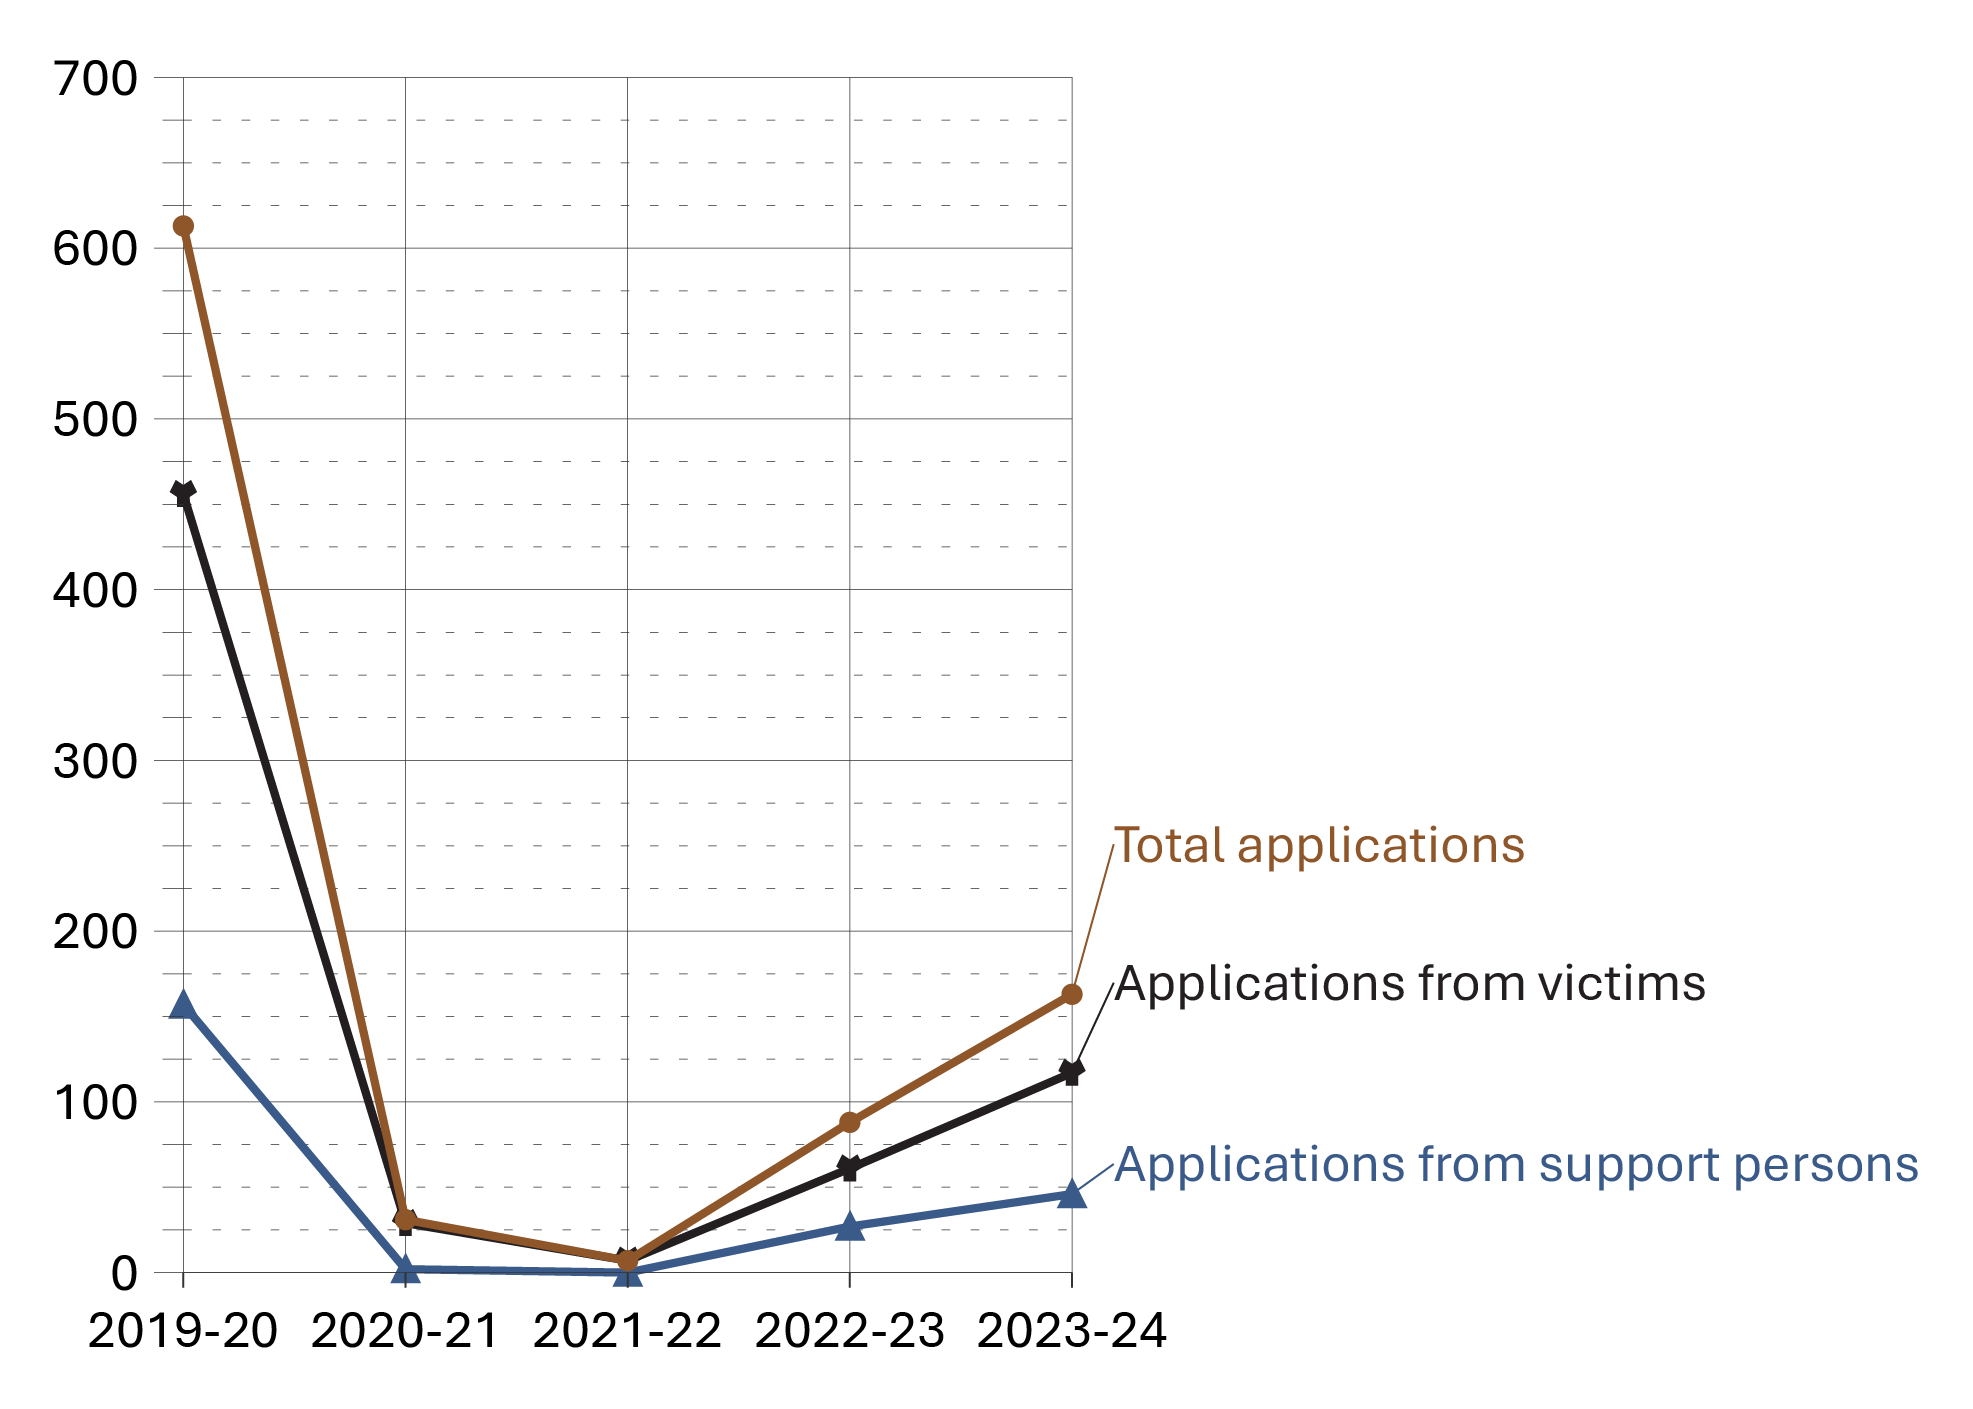
Image description
Line graph showing the number of requests for financial assistance to attend parole hearings over a five year period from fiscal year 2019-20 to 2023-24. The graph includes the number of total applications, applications from victims, and applications from support persons. For applications from both victims and support persons for financial assistance, numbers sharply declined in fiscal year 2020-21, but have since been increasing, though have not returned to levels observed before 2020-21. Full data are available in the table below.
Source: Justice Canada.
- The number of victim applications for financial assistance to attend parole hearings decreased between 2019-20 and 2021-22 and then gradually increased from 2021-22 and 2023-24. Fluctuations may be due to the imposition and cessation of the COVID-19 pandemic lockdown restrictions, which began in mid-March 2020. To adapt to COVID-19, Parole Board of Canada hearings were conducted primarily by teleconference and/or video conference in 2020-21 and 2021-22.
- Between fiscal years 2022-23 and 2023-24, the total number of applications for financial assistance increased from 61 to 117. Numbers of applications have not returned to pre-pandemic levels as the Parole Board of Canada schedules virtual hearings over in-person.
| Application type | 2019-20 | 2020-21 | 2021-22 | 2022-23 | 2023-24 |
|---|---|---|---|---|---|
| Number of applications for financial assistance received from victims | 456 | 29 | 7 | 61 | 117 |
| Number of applications for financial assistance received from support persons | 157 | 2 | 0 | 27 | 46 |
| Total number of applications | 613 | 31 | 7 | 88 | 163 |
Source: Justice Canada.
Table F3 Notes
The number of applications in 2023-24 include applications for hearings that ended up being changed from “in person” to “virtual”, and for hearings that were postponed or cancelled altogether.
Victims can apply for financial assistance for a support person to accompany them to a parole hearing.
Reported year periods reflect fiscal years. A fiscal year runs from April 1 to March 31 of the following year.
Number of Parole Board of Canada contacts with victims: 10-year trend
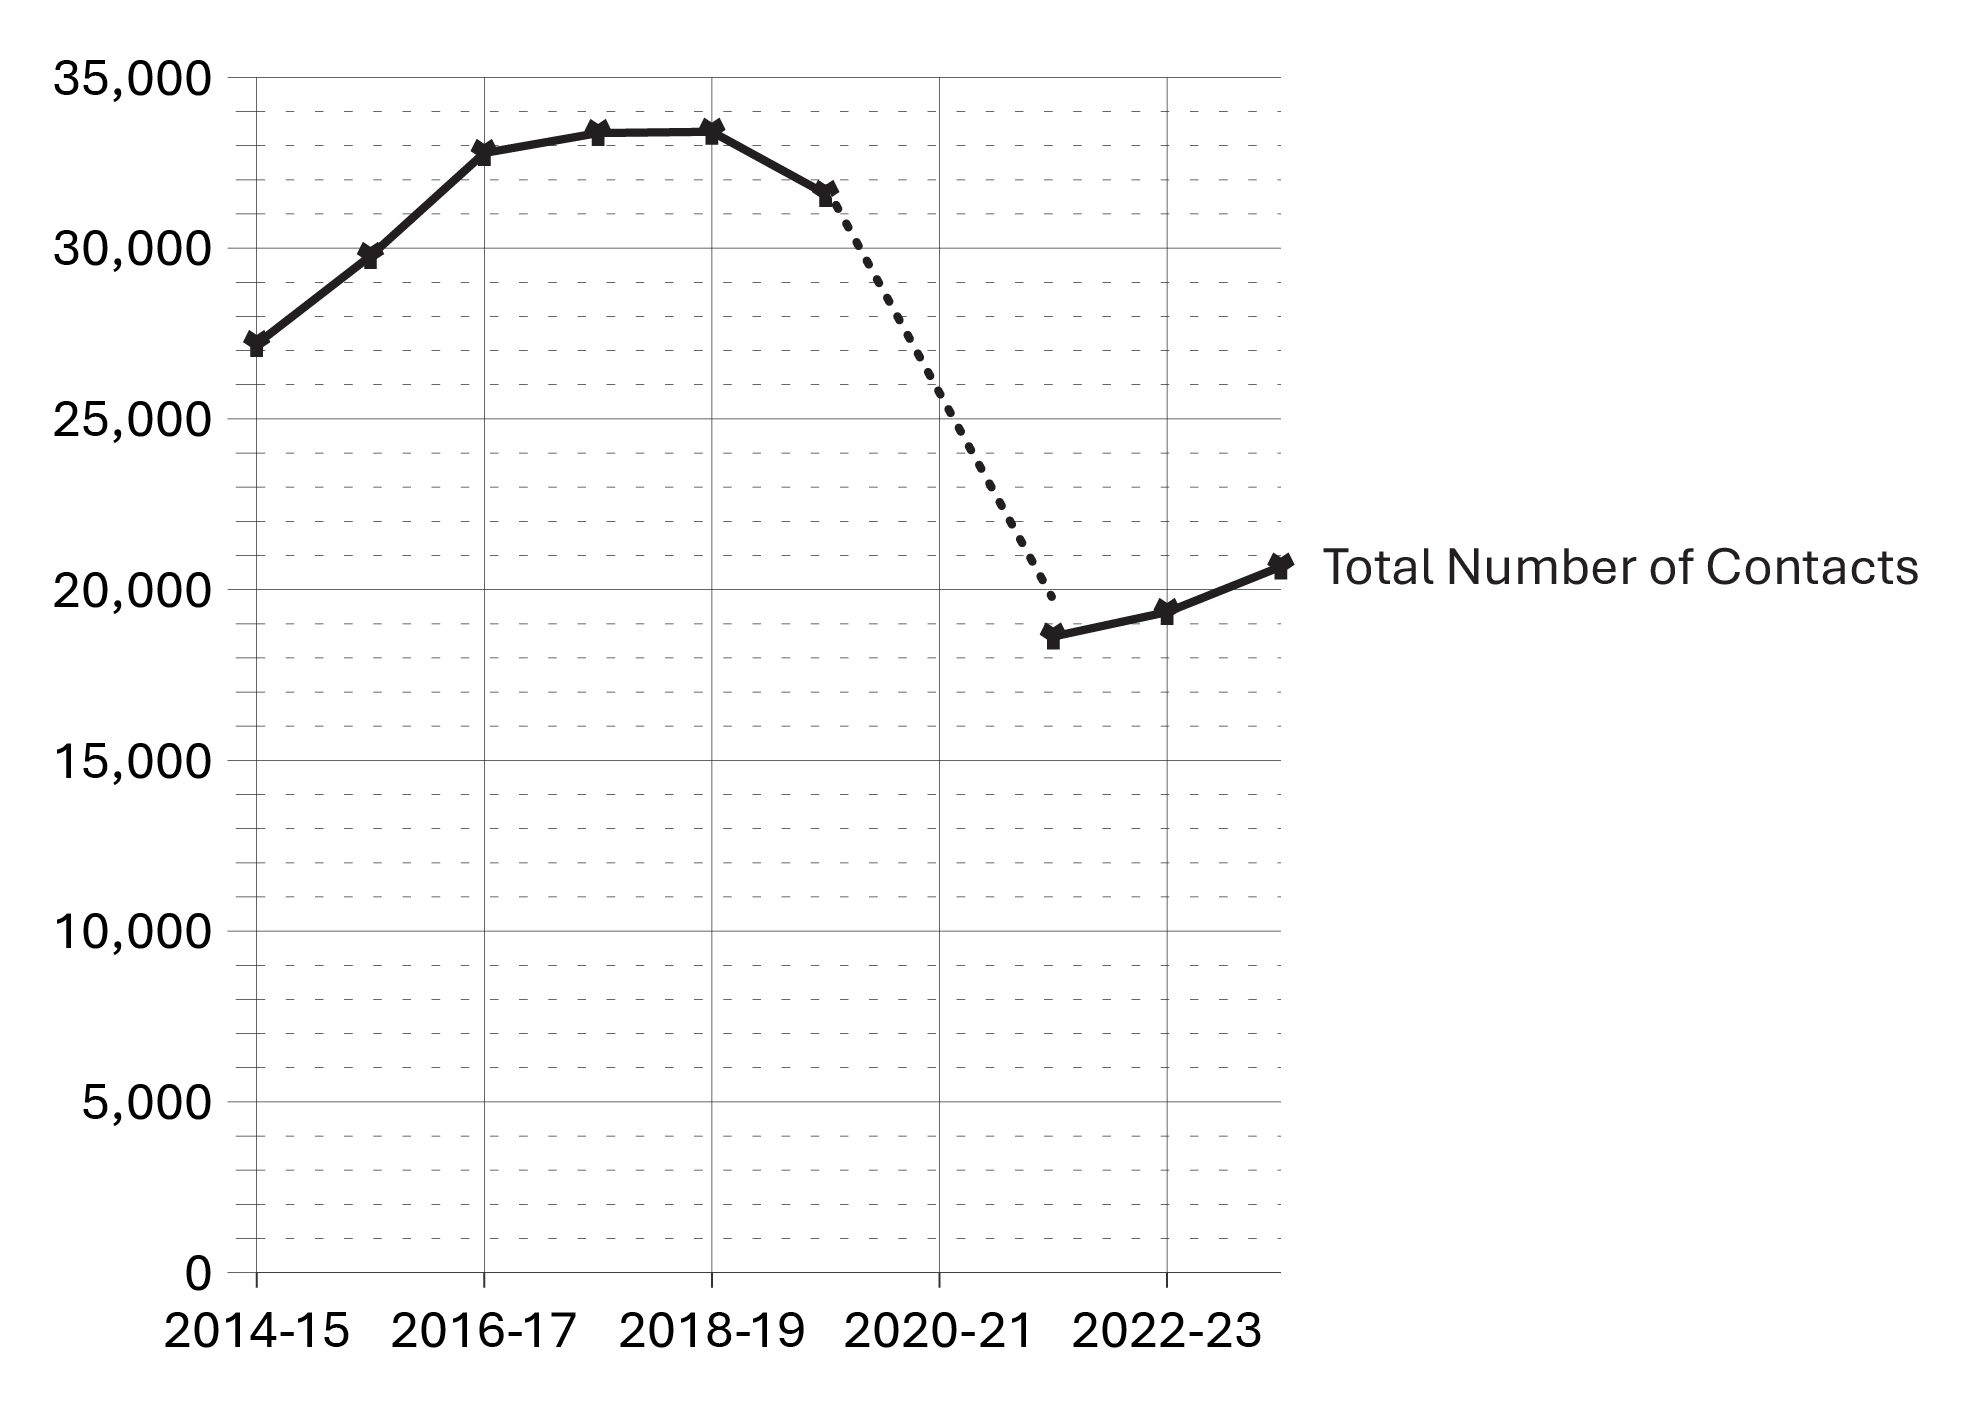
Image description
Line graph showing the number of victims formally contacted by the Parole Board of Canada over a ten year period from fiscal year 2014-15 to 2023-24. The number of Parole Board contacts with victims increased between fiscal years 2014-15 to 2018-19, then decreased slightly from 2018-19 to 2019-20. Data are not available for fiscal year 2020-21 as the Parole Board of Canada transitioned from manual data collection to using an automated system, the Victims Application Module, during this timeframe. The reduction in contacts with victims between 2019-20 and 2021-22 is also the result of this transition to an automated system. From fiscal year 2021-22 to 2023-24, there has been a small increase in the number of contacts with victims. Full data are available in the table below.
Source: Parole Board of Canada.
- In 2023-24, the Parole Board of Canada (PBC) reported 20,674 contacts with victims, an increase of 6.9% compared to 2022-23.
- In the past 10 fiscal years (from 2014-15 to 2023-24), the number of PBC contacts with victims decreased by 24.0% (6,517 fewer contacts)Footnote *.
| Fiscal year | Number of contacts |
|---|---|
| 2014-15 | 27,191 |
| 2015-16 | 29,771 |
| 2016-17 | 32,786 |
| 2017-18 | 33,370 |
| 2018-19 | 33,408 |
| 2019-20 | 31,587 |
| 2020-21Footnote * | NAFootnote ** |
| 2021-22 | 18,627 |
| 2022-23 | 19,343 |
| 2023-24 | 20,674 |
Source: Parole Board of Canada.
Table F4 Notes
Victim presentations at PBC Hearings: 10-year trend
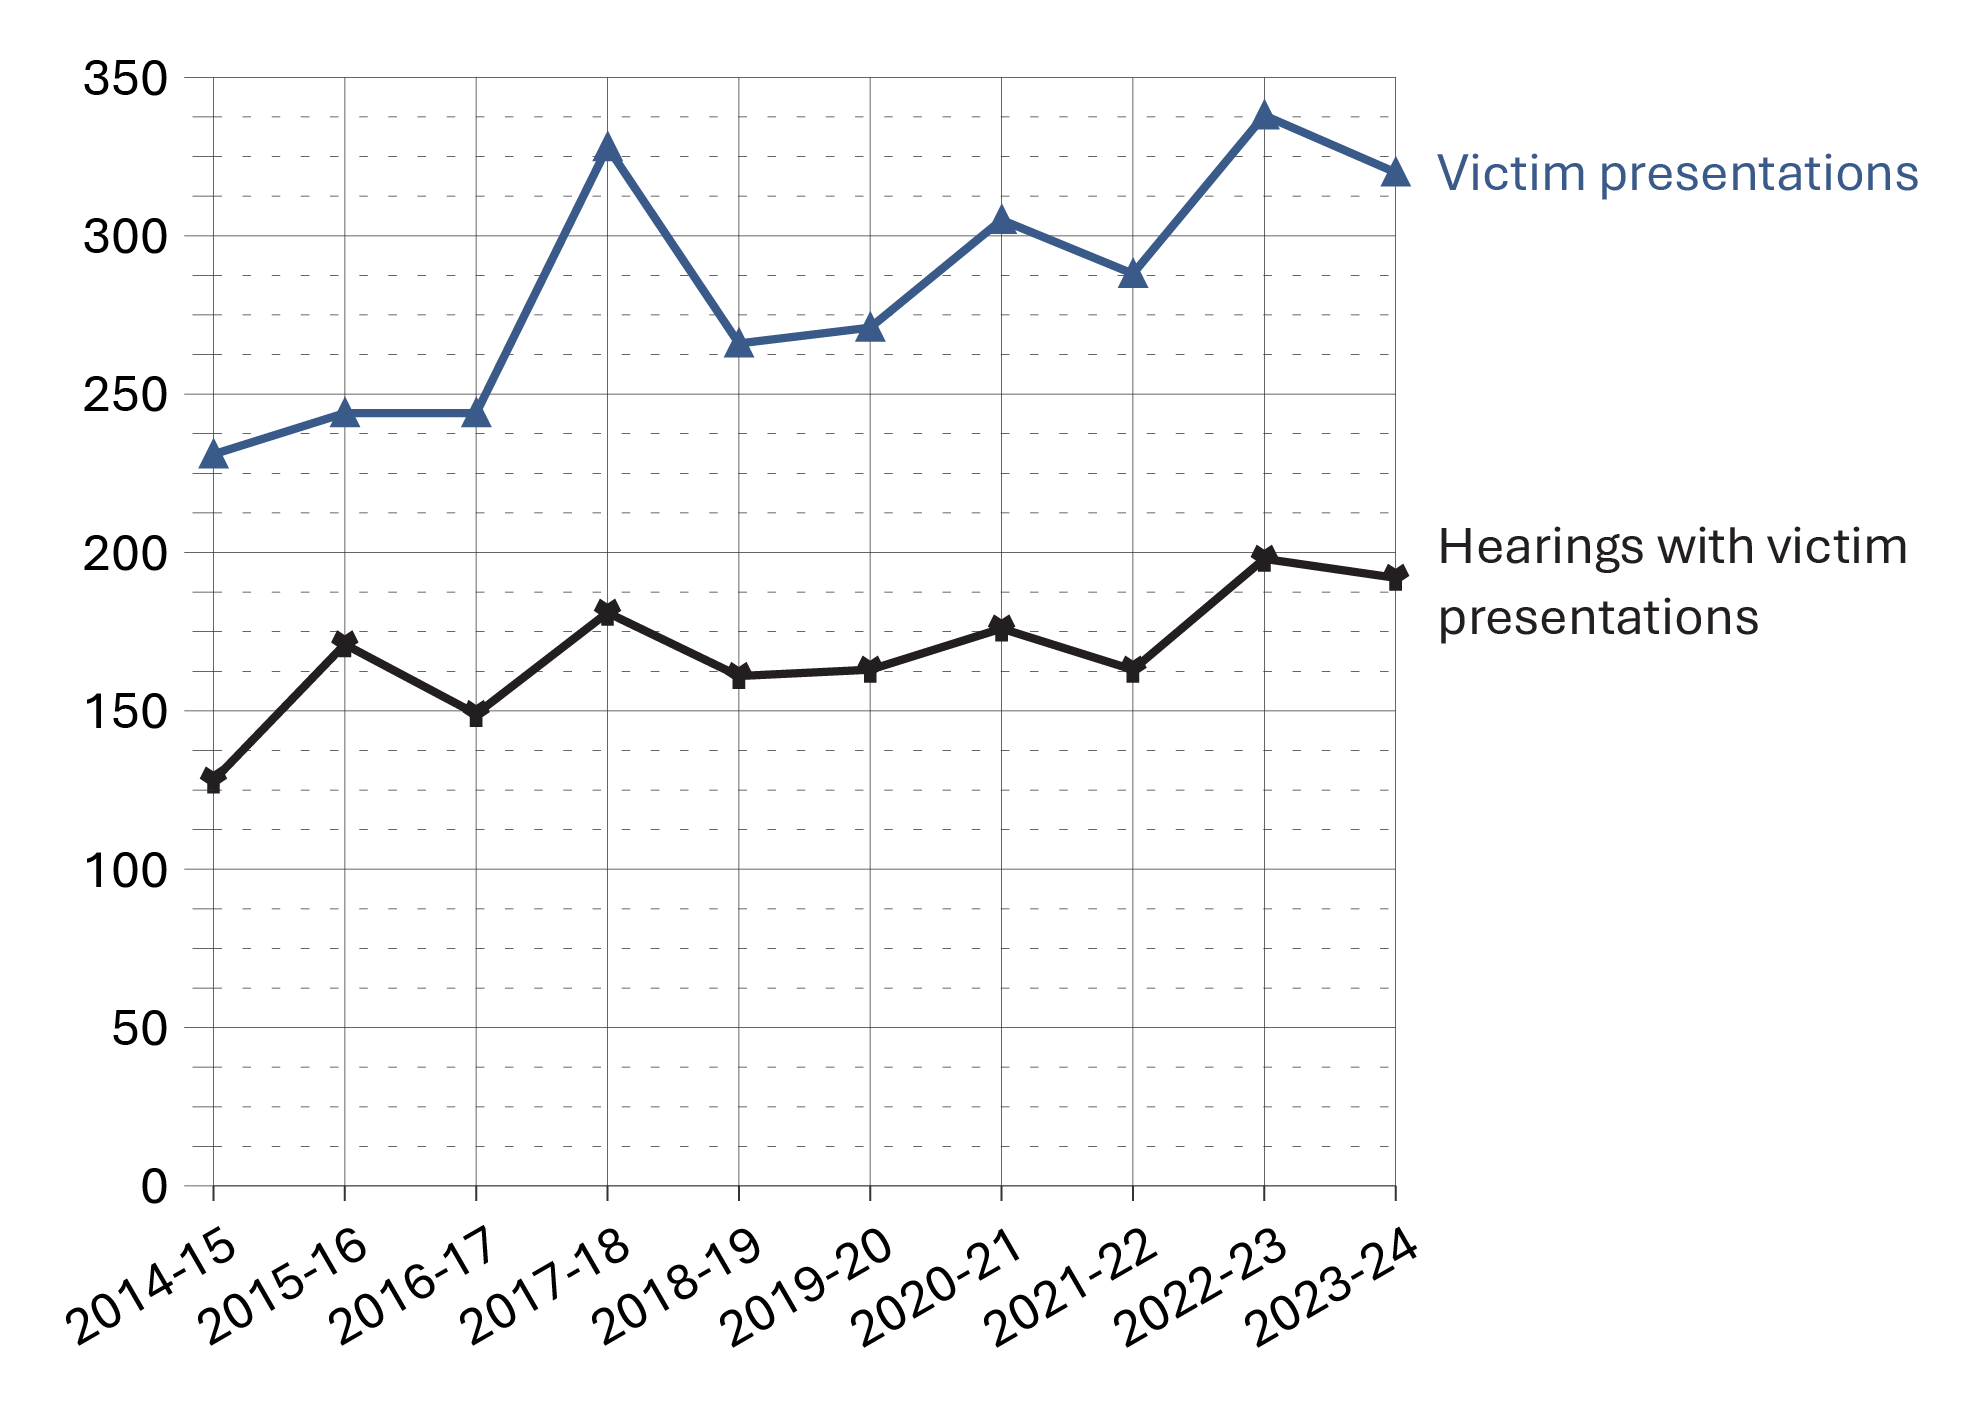
Image description
Line graph showing the number of victim presentations and the number of hearings with victim presentations over a ten year period from fiscal year 2014-15 to 2023-24. Over time, both the number of victim presentations and hearings with victim presentations have fluctuated in a similar pattern, although victim presentations remain more common. Full data are available in the table below.
Source: Parole Board of Canada.
- In 2023-24, victims made 320 presentations (a decrease of 5.3% or 18 fewer presentations) at 192 hearings (a decrease of 3.0% or 6 fewer hearings) compared to 2022-23.
- In 2023-24, there was a 6.3% increase (346 more hearings) in the total number of Parole Board of Canada hearings (with or without victim presentations) compared to 2022-23.
- In 2023-24, 80.6% of victim presentations were delivered remotely (e.g., by video-conference) and 19.4% were presented in-person.
| Fiscal year | Number of hearings with presentations | Victim presentations |
|---|---|---|
| 2014-15 | 128 | 231 |
| 2015-16 | 171 | 244 |
| 2016-17 | 149 | 244 |
| 2017-18 | 181 | 328 |
| 2018-19 | 161 | 266 |
| 2019-20 | 163 | 271 |
| 2020-21 | 176 | 305 |
| 2021-22 | 163 | 288 |
| 2022-23 | 198 | 338 |
| 2023-24 | 192 | 320 |
Source: Parole Board of Canada.
Table F5 Notes
Reported year periods reflect fiscal years. A fiscal year runs from April 1 to March 31 of the following year.
Number of decisions sent from PBC decision registry: 5-year trend
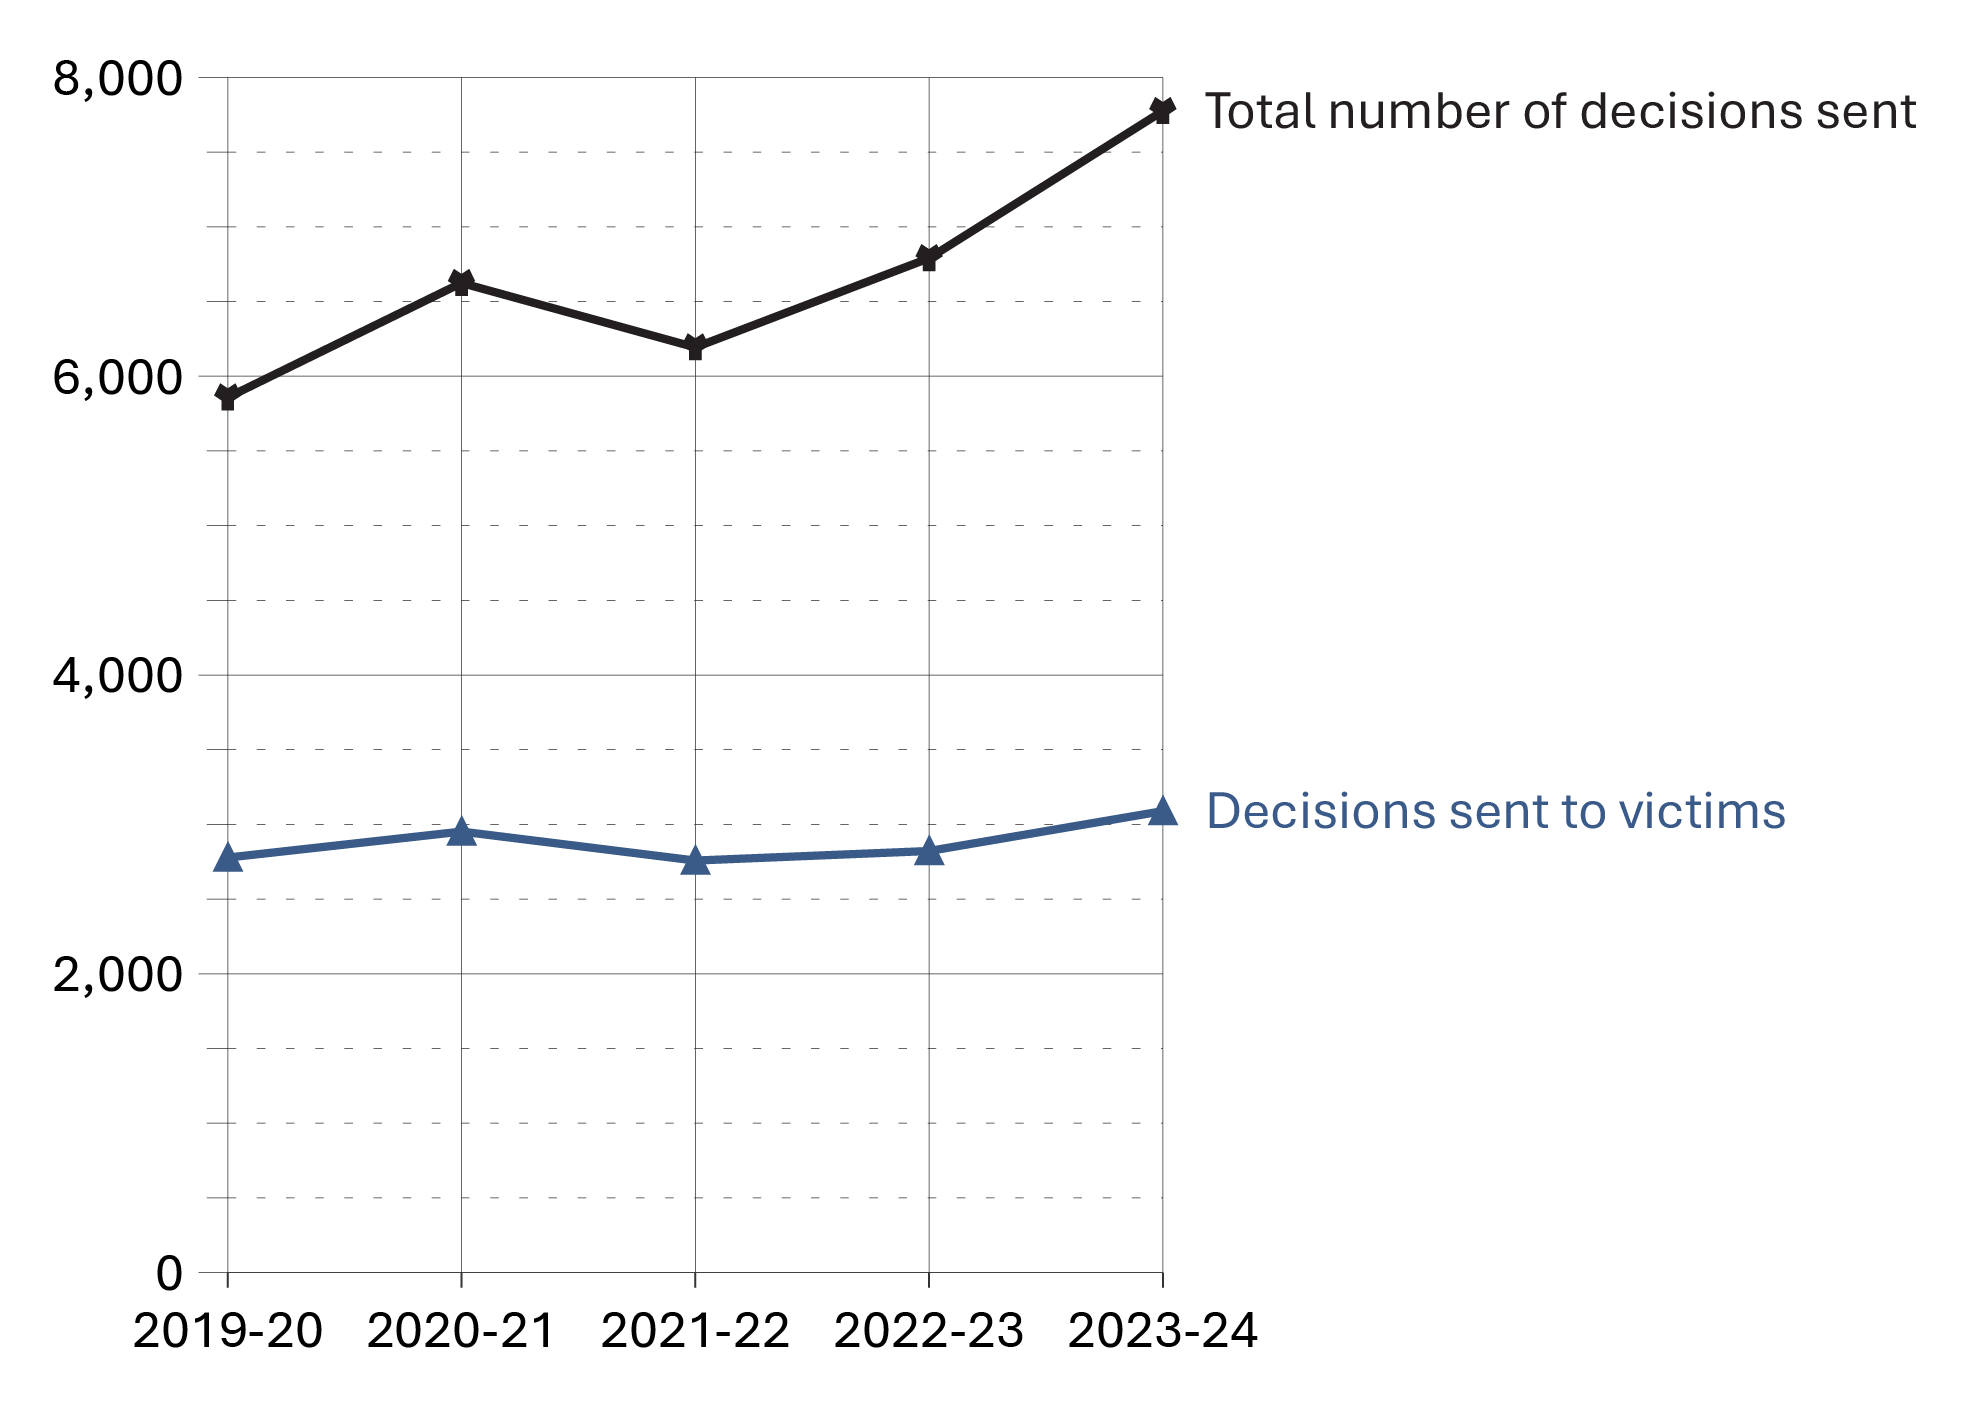
Image description
Line graph showing the total number of decisions sent from the Parole Board of Canada decision registry over a five year period from fiscal year 2019-20 to 2023-24. The number of decisions sent to victims accounted for almost half of the total number of decisions sent. Full data are available in the table below.
Source: Parole Board of Canada.
- In 2023-24, 7,775 decisions were sent from the Parole Board of Canada's decision registry, an increase of 14.5% from the previous fiscal year.
- In 2023-24, the number of decisions sent to victims from the decision registry increased by 9.5% to 3,089 compared to the previous fiscal year.
- Between 2019-20 and 2023-24, the number of decisions sent from the decision registry has increased by 32.7%.
| Fiscal year | Decisions sent to victims | % | Total number of decisions sent |
|---|---|---|---|
| 2019-20 | 2,778 | 47.4 | 5,858 |
| 2020-21 | 2,952 | 44.6 | 6,624 |
| 2021-22 | 2,758 | 44.5 | 6,193 |
| 2022-23 | 2,822 | 41.6 | 6,790 |
| 2023-24 | 3,089 | 39.7 | 7,775 |
Source: Parole Board of Canada.
Table F6 Notes
- Date modified: