Assessing the risk of sexual offenders on community supervision: The Dynamic Supervision Project

Table of contents
- Executive summary
- Acknowledgements
- Introduction
- Method
- Measures
- Procedure
- Results
- Discussion
- References
- Appendices
- 1. STABLE-2000 Tally Sheet
- 2. Rules for combining static and stable factors
- 3. Distribution of stable risk factors (first assessment)
- 4. STABLE-2007 Tally Sheet
- 5. Three year recidivism rates for Static/Stable-2000 – original version
- 6. Three year recidivism rates for Static/Stable-2000 – revised version
- 7. Three year recidivism rates for Static/Stable-2007
- 8. Sexual recidivism rates for Static/Stable-2007 risk categories
- 9. Violent and general recidivism rates for Static/Stable-2007 risk categories
- 10. Predictive accuracy across sub-groups
- 11. Distribution of acute risk factors (all assessments)
- 12. ACUTE-2007 Tally Sheet
- 13. Rules for combining static, stable and acute risk factors
- 14. Relative risk for recidivism within 45 days based on combined Static-99, Stable-2007 and acute scores
2007-05
R. Karl Hanson, Andrew J. R. Harris, Terri-Lynne Scott and Leslie Helmus
Executive summary
Sexual offenders do great societal damage causing justifiable public concern. Over the past 10 years psychology has developed techniques to reliably sort male sexual offenders into low, moderate, and high risk for sexual recidivism (MnSOST-R, Risk Matrix-2000, RRASOR, STATIC-99, STATIC-2002) based upon historical, static, non-changeable risk factors. The “static” structure of these tests effectively precludes their ability to measure changes in risk. The STABLE-2007 and the ACUTE-2007 are specialized tools designed to assess and track changes in risk status over time by assessing changeable “dynamic” risk factors. “Stable” dynamic risk factors are personal skill deficits, predilections, and learned behaviours that correlate with sexual recidivism but that can be changed through a process of “effortful intervention”. Should “effortful intervention” (read: treatment or supervision) take place in such a way as to reduce these risk-relevant factors there would be a concomitant reduction in the likelihood of sexual recidivism. “Acute” dynamic risk factors are highly transient conditions that would only last hours or days. These factors are rapidly changing environmental and intrapersonal stresses, conditions, or events that have been shown by previous research to be related to imminent sexual reoffence. These instruments should be used to inform correctional managers as to how much risk they are managing, to inform decisions on levels of community treatment and supervision, and estimate changes in risk status pre and post treatment or other interventions.
The Dynamic Supervision Project involved every Canadian province and territory and the states of Alaska and Iowa in a robust test of risk assessment methodologies. A total of 156 parole and probation officers completed repeated 3-level (static, stable & acute) risk assessments on 997 sexual offenders across 16 jurisdictions. All of the probation and parole officers scoring risk of reoffence for these community-based sexual offenders were trained in sexual offender risk assessment by attending a two-day training that focussed on scoring actual case examples. Sexual, violent and “other” recidivism information was gathered from official criminal histories after a median of 41 months of follow-up. The sexual recidivism rate for this widely disparate group of community-based sexual offenders was 7.6% after three years (n = 790).
The STABLE-2007 and the ACUTE-2007 are easier to score than their predecessors and combinations of the STATIC-99 and STABLE-2007, scored by all contributing officers, produced ROC (receiver operating characteristic) values for sexual reoffence of .76 and .72 for violent reoffence. When used by “conscientious” officers the STATIC-99/STABLE-2007 combined scores produced an ROC for sexual reoffence of .84 and .80 for violent recidivism. STABLE-2007 and ACUTE-2007 assessments were found to add predictive power above and beyond that available to assessments of static risk alone.
This study provides evidence that trained community supervision officers can reliably score valid and useful sex offender risk assessments. Results of this nature, even taking into account the need for replication and cross-validation, suggest significant policy and practice implications for the community supervision of sexual offenders.
Acknowledgements
Although only four authors appear on the title of this manuscript, this study would not have been possible without the contributions of many people, most importantly the 156 community supervision officers who took time from their already busy schedules to submit data to this project. Special thanks are due to the following for their help with training, implementation and/or data collection: Tim Astle, Alexandrine Chevel, Randy Cole, Jean-Louis Cormier, Susan Cox, Lisa Ginter, Luke Gregory, Carla Ground, Uwe Jensen, Claudia Levesque, Eileen McWade, Donna-Lee Rabey-McKay, Patricia Ratel, Amanda Scorrar, Alan Shoom, Mark Stehlin, Danielle Paris and Karl Williams. Helpful comments on the report and the measures were provided by David Thornton, Ruth Mann and Yolanda Fernandez. We would also like to thank the following PS research staff for all their work on this multi-year project: Jennifer Cooney, Erik Gaudreault, Shannon Hodgson, Shelley Price and Kimberly Smallshaw. Thanks to all. We hope that we have merited your trust by providing information that promotes safe and just community supervision of sexual offenders.
Introduction
Sexual offences are among the crimes that provoke the most public concern. A number of policies have been developed to address this concern, including sex offender registries, specialized treatment programs and long-term supervision orders. A fundamental assumption of all these initiatives is that community supervision of sexual offenders can reduce their risk of reoffending.
Supervision can only reduce risk, however, when it monitors and addresses factors related to recidivism. The available research has identified a number of factors associated with the long-term recidivism rates of sexual offenders (Hanson & Bussière, 1998; Hanson & Morton-Bourgon, 2005). By using combinations of these factors, evaluators can differentiate between those offenders who have a substantial probability (greater than 50%) of being apprehended for a new sexual offence and those offenders who rarely reoffend (less than 10% probability; Hanson & Thornton, 2000).
The factors currently used to predict long-term recidivism potential are mainly static, historical variables, such as the number of prior sexual offences and victim characteristics. Such unchangeable, static factors cannot be used to measure changes in risk levels nor to determine how or when to intervene. To measure change, evaluators require knowledge of dynamic (changeable) risk factors. There are two types of dynamic factors worth considering: a) stable dynamic factors, which are potentially changeable but endure for months or years (e.g., alcoholism, intimacy deficits), and b) acute dynamic factors, which can change over a period of weeks or days, even hours, and signal the timing of new offences (e.g., drunkenness, acute distress).
Many of the important decisions made by community supervision officers are based on dynamic risk factors (amenability to supervision, timing of revocation). Research on dynamic risk factors, however, is much less developed than the research on static factors. Consequently, evaluators assessing sexual offenders on community supervision are often forced to make decisions based on factors that may or may not be related to recidivism (e.g., behaviour during treatment). The current study aimed to advance risk assessment for sexual offenders by identifying the dynamic risk factors for sexual offenders on community supervision, and by presenting a method by which static, stable and acute factors can be combined into an overall evaluation of risk.
The risk factors selected for this study were based on previous research (e,g., Hanson, Gizzarelli & Scott, 1994; Quinsey, Coleman, Jones & Altrows, 1997; Wilson, 1999; see review by Hanson & Morton‑Bourgon, 2004, 2005) and empirically validated structured risk tools that include dynamic factors: esspecially, the Sex Offender Need Assessment Rating (SONAR; Hanson & Harris, 2001), STEP Deviance (Beech, Friendship, Erikson & Hanson, 2002), and Structured Risk Assessment (SRA; Thornton, 2002). The main categories of stable dynamic risk factors that were identified were negative social influences, intimacy deficits, problems with sexual self-regulation, attitudes tolerant of sexual crimes, lack of co-operation with supervision, and problems with general self-regulation. The acute factors identified were those mostly strongly related to sexual recidivism in Hanson and Harris (2000), including sexual preoccupations, victim access, hostility, emotional collapse, substance abuse, collapse of social supports, and lack of cooperation with supervision.
It was expected that sexual self-regulation deficits and attitudes tolerant of sexual crime would be specifically related to sexual recidivism, and that problems with general self-regulation would be most strongly related to general recidivism and to violations of community supervision. Although all the items had promise, many were selected based on indirect evidence or retrospective file reviews (Hanson & Harris, 2000; Thornton, 2002). Consequently, there was a need for an empirical test of the most promising dynamic items using a truly prospective design.
Prospective risk studies with sexual offenders are difficult because the expected base rate of recidivism is low. Approximately 10% to 15% would be expected to be detected committing a new sexual offence after 5 years (Hanson & Bussière, 1998; Harris & Hanson, 2004). Given that most of the individual predictor variables correlate with sexual offence recidivism in the r = .10 to .20 range (Hanson & Bussière, 1998; Hanson & Morton-Bourgon, 2005), and that risk scales correlate with recidivism in the .25 to .35 range (Hanson & Morton-Bourgon, 2007), sample sizes of 500 to 1000 are required in order to obtain 90% probability of detecting small effects (r = .15, n = 464; r = .10, n = 1,048; given alpha = .05, two-tailed; Information Management Services, 1994).
The approach used to accumulate the necessary sample size was to incorporate data collection into the routine supervision practice of multiple jurisdictions. The most promising static, stable and acute risk factors were organized into a comprehensive assessment package, which was refined through field testing with experienced supervision officers (see method section). Next, we approached diverse jurisdictions offering to train officers in the assessment package if they were willing to contribute data for a period of three years. Consequently, the data collected for this study represented the combined efforts of community supervision officers from all Canadian provinces and territories, the Correctional Service of Canada, and the states of Alaska and Iowa.
Officers participating in the project were asked to collect the following information on new sexual offenders on their case loads: a) static risk factors upon intake; b) stable risk factors every six months; and c) acute risk factors at every offender contact. The evaluation focused on the validity of the individual risk factors, as well as the validity of various methods of combining the risk factors into an overall evaluation of the offender's supervision priority. Another important question was whether it was possible for community supervision officers to conduct reliable and valid assessments of sensitive personal characteristics (e.g., deviant sexual interests). Officers vary considerably in their skills and training, and it may be that certain factors drawn from in-depth psychological assessments may translate poorly to the context of routine community supervision.
Method
Subjects
All offenders were adults starting a period of community supervision (probation or parole) for a recent sexual offence. A sexual offence was defined as an offence with a sexual motivation involving a non-consenting person or persons unable to provide consent (Category “A” offences in the Static-99 coding rules, Harris, Phenix, Hanson & Thornton, 2003). The vast majority of the offenders were currently serving sentences for sexual offences, although a small number had a conviction for a sexual offence within the previous two years but were currently being supervised for a non-sexual offence. In all cases, the supervising officers considered the offenders' primary problem to be sexual offending and were supervising them as such. Offenders were excluded if they had been in the community for a period of six months prior to initial assessment, had successfully appealed their conviction, were serving sentences for crimes committed prior to the age of 18, or had only been convicted of sexual offences involving consenting adults (e.g., prostitution).
The offenders came from 16 different jurisdictions (see Table 1): all Canadian provinces and territories, the Atlantic Region of the Correctional Service of Canada, and the states of Alaska and Iowa. In total, 156 officers submitted assessment information on 997 offenders, of which 978 had a static assessment, 805 had at least one stable assessment, and 749 had at least one acute assessment. Descriptive information on the sample is presented in Table 2. On average, the offenders were 40 years old and serving their first sentence for a sexual offence (70%). Half the sample had child victims, and approximately 10% had only non-contact offences. Most of the sexual offences (77%) involved physical contact but not overt physical injury. Approximately 20% of the offenders self-identified as being of Aboriginal heritage, 10% had been hospitalized overnight for a psychiatric condition, and 5% had previously been diagnosed as developmentally delayed.
There were six women in the sample; one of them reoffended with a non-sexual violent crime. Given that the recidivism rates of the female sexual offenders would be expected to differ from the rates for males (Cortoni & Hanson, 2005), the female sexual offenders were not considered further.
| Jurisdiction | Officers |
Offenders |
|---|---|---|
| (Alberta) | 7 | 45 |
| (British Columbia) | 14 | 132 |
| (Manitoba) | 8 | 34 |
| (New Brunswick) | 15 | 192 |
| (Newfoundland) | 26 | 93 |
| (Northwest Territories) | 1 | 1 |
| (Nova Scotia) | 3 | 10 |
| (Nunavut) | 4 | 12 |
| (Ontario) | 34 | 130 |
| (Prince Edward Island) | 5 | 19 |
| (Quebec) | 8 | 23 |
| (Saskatchewan) | 9 | 72 |
| (Yukon) | 2 | 10 |
| (CSC Atlantic) | 1 | 13 |
| (Alaska) | 12 | 116 |
| (Iowa) | 7 | 95 |
| TOTAL | 156 | 997 |
| ANY STATIC (n = 978) | ANY STABLE (n = 805) | |||
|---|---|---|---|---|
| n (%) | n missing | n (%) | n missing | |
| Age at release M (SD) | 40.1 (13.4) | 5 | 39.6 (13.5) | 9 |
| Female | 6 (0.6%) | 2 | 6 (0.8%) | 8 |
| Offender Type | 38 | 39 | ||
| Non-contact | 89 (9.5%) | 71 (9.3%) | ||
| Extra-familial child molester | 255 (27.1%) | 205 (26.8%) | ||
| Incest | 208 (22.1%) | 182 (23.8%) | ||
| Rapist | 341 (36.3%) | 268 (35.0%) | ||
| Mixed | 47 (5.0%) | 40 (5.2%) | ||
| Most serious victim injury | 4 | 10 | ||
| Non-contact offences only | 96 (9.9%) | 77 (9.7%) | ||
| Physical contact | 752 (77.2%) | 622 (78.2%) | ||
| Victim injury | 117 (12.0%) | 92 (11.6%) | ||
| Life threatening injury | 9 (0.9%) | 4 (0.5%) | ||
| Any prior sexual offences | 289 (29.6%) | 0 | 230 (28.8%) | 6 |
| Developmentally delayed | 53 (5.6%) | 24 | 42 (5.4%) | 23 |
| Major mental disorder | 111 (11.6%) | 22 | 85 (10.9%) | 22 |
| Aboriginal | 183 (19.1%) | 20 | 154 (19.7%) | 22 |
Note: Extra-familial child molesters had only unrelated victims less than 14 years old. Incest offenders only had related victims less than 18 years old. Rapists had unrelated victims age 14 or older, or any victims age 18 or older.
Measures
Static risk factors
Static risk factors were assessed using the Static-99 (Hanson & Thornton, 2000; Harris et al., 2003). Static-99 contains 10 items based on criminal history, victim characteristics (gender, relationship to offender) and relationship history. Each of the items are awarded a point for higher risk (except prior sexual offence which is accorded up to three points), and the points are added to create total scores. The conventional risk categories are as follows: 0 – 1 is low, 2 – 3 is moderate-low, 4 -5 is moderate-high, and 6 or higher is high risk. Static-99 has shown moderate accuracy in the prediction of sexual recidivism in diverse samples from North America and Europe (average d of .70, 42 samples, 13,288 offenders; Hanson & Morton-Bourgon, 2007). In addition to the Static-99 items, the static questionnaire included basic demographic information for the offender as well as the ages and pre-existing relationships for all known victims of sexual offences.
After scoring the Static-99, the officers were asked “Are there any exceptional circumstances that support an override of the static risk assessment? (e.g., historical offender being low risk because last known offence was 30 years ago, or a first-time offender is high risk due to a large number of victims)”. They responded either “no”, “yes, increase risk”, or “yes, decrease risk”, and provided a brief narrative justifying their decision.
Stable risk factors
The measure of stable risk factors, Stable-2000, was developed for this study. Stable risk factors were defined as offender characteristics that are related to recidivism and capable of changing over months or years. The 16 factors were assessed using three-point ratings scales “0 – no problem”, “1 – some concern/slight problem” and “2 – present/definite concern” following a structured scoring manual. The manual instructed evaluators to estimate the offender's typical or baseline level of functioning during the following 6 to 12 months based on all available information. The minimum information required was a structured interview with the offender and a file review of sufficient depth to score the static information requested above (Static-99 scores, victim information, demographics). When available, evaluators were encouraged to use other sources of information, such as psychological assessments, police reports, specialized testing, previous pre-sentence reports and collateral contacts.
The 16 items were organized into six sections (see Stable–2000 Tally Sheet, Appendix 1). The first section, significant social influences, identified the people in the offender's life who were not paid to be with him or her, and then computed a section score based on the number of positive and negative social influences. The intimacy deficits sections contained 5 items: a) stability of the offender's current intimate relationship; b) emotional identification with children; c) hostility toward women; d) general social rejection/loneliness; and e) lack of concern for others. Three items were included in the sexual self-regulation section: a) high sex drive/sexual pre-occupations; b) use of sex as a coping strategy; and c) deviant sexual interests. The attitude section assessed: a) sexual entitlement; b) attitudes tolerant of rape; and c) attitudes tolerant of adult-child sex. The fifth section assessed the officers' assessment of the degree to which the offender was co-operating with supervision. This included explicit compliance with the conditions of supervision and a more general evaluation of whether the offender was “working with” or “working against” the officer. The final section, general self-regulation, addressed three items: a) impulsive acts; b) poor cognitive problem-solving skills; and c) negative emotionality/hostility.
After scoring all the items, the highest score in each sub-section counted as the section score, resulting in total scores that could range from 0 to 12. The following nominal categories were proposed: 0 – 4 was “low” need, 5 – 8 was “moderate” need, and 9 – 12 was “high” need.
Acute risk factors
The items assessing acute risk factors were developed for this study based on previous studies of high risk behaviours and the immediate precursors of sexual reoffending (Hanson & Harris, 2000; Proulx, McKibben & Lusignan, 1996). Acute-2000 included seven items rated according to a scoring manual from “0 – no problem”, “1 – maybe/some”, “2 – yes, definite problem” and “3 – intervene now” (see Appendix 12 for the revised Acute Tally Sheet). The “intervene now” category was designed to indicate situations in which the officer felt that the risk of new offending was sufficiently high that preventive actions were immediately necessary (e.g., offender making direct threats against a specific victim, realistic suicidal ideation). The seven acute factors were as follows: access to victims, emotional collapse, collapse of social supports, hostility, substance abuse, sexual preoccupations and rejection of supervision. As well, space was provided for officers to monitor a unique factor that the officer believed to be important for a specific offender (e.g., homelessness, compliance with psychiatric medication). For each area, the officers also indicated whether the factor became worse, stayed the same, or improved since the last supervision meeting. Officers were not directed to compute total scores, but to consider the current risk factors in the context of the offender's pre-determined risk level based on the static and stable factors.
Combining static, stable and acute factors
Given that Stable-2000 and Acute-2000 were created for this study, there was no empirical evidence upon which to generate rules for combining the factors into an overall evaluation of risk. Nevertheless, a set of rules was proposed (see Appendix 2). These rules involved starting with the Static-99 risk categories, and adjusting the overall rating based on the Stable-2000 scores. Ultimately, the proposed rules were reasonably close to the rules developed after examining the recidivism rates of the offenders in this study.
For the acute risk factors, officers were counselled to consider the current (most recent) assessment as an indicator of the likelihood of recidivism during the next month. The current behaviour was to be interpreted in the context of the overall risk level previously determined by the static and stable variables. The acute score was divided into four categories: a) normal supervision (no risk factors); b) extra attention (one risk factor for low or moderate priority offenders); c) elevated supervision (one risk factor for high priority offenders, or two risk factors for low or moderate priority offenders); and d) intervene now (any intervene now ratings).
Procedure
Data collection
Data were collected as part of the routine supervision practices of the officers participating in the project. The assessment data were considered administrative records controlled by the specific jurisdictions and did not require the consent of offenders to collect. Formal agreements were developed with the participating jurisdictions to share the data with the researchers at Public Safety Canada (then Solicitor General Canada) for the common purpose of program evaluation. In all cases, the data remained the property of the specific jurisdictions, and the researchers at Public Safety Canada were in the role of data managers. For the province of Quebec, however, the consent of the offenders was required before the data could be shared with a federal government department. Consequently, the offenders from Quebec all signed consent forms allowing their assessment data to be used for this study.
Following training, participating officers were requested to submit information on consecutive, new cases until a sufficient sample size had been collected (estimated to be three years). File review conducted for the purpose of the reliability training suggested that the selection of cases was not always consecutive. The reasons for scoring only some new cases are unknown, but appeared to be related to the degree of local administrative support for the project and the competing time demands placed on the officers. The officers submitting data to the project were volunteers. Some jurisdictions required officers to attend the training, and other jurisdictions adopted all or some of the measures as standard practice; however, the decision to submit data to the research project was at the initiative of the individual officers.
The requested data collection protocol involved submitting static information (including Static-99) within the first month of supervision. The stable assessment was to be completed within the first three months, and then every six months thereafter. Once the first stable data were submitted, the acute factors were to be assessed every session (but not more than weekly). In practice, the static assessment took approximately 30 minutes to complete. The first stable assessment could be done in as little as 60 minutes, but typically required two interview sessions of 45 – 60 minutes plus time for file review. The acute assessments required 5 – 10 minutes in addition to the time needed to conduct routine supervisory sessions.
Training
All officers submitting data to the project were required to attend a two day training session. Most of the training sessions were conducted by the principal investigators, although other trainers were used in some jurisdictions. In rare cases, officers submitted data who had been trained by apprenticing with other local officers. The training primarily involved descriptions of the scoring criteria and structured exercises (both oral and written). The final written scoring exercise was collected for reliability purposes (see below). The training did not have any formal pass/fail criteria, but officers who were having obvious difficulty were encouraged to review their work with another officer before submitting it to the project.
Data were submitted via fax or secure website. In the initial registration, the offenders' identifying information was linked to a unique identifier known only to the research team and the supervising officer. In order to protect confidentiality, all subsequent data submissions included only the unique identifier.
Reliability
Reliability was examined in two ways. The first method involved comparing the officers' responses in the final training exercise to the responses of Karl Hanson and Andrew Harris (the principal investigators and test developers). Training exercises were analyzed for 213 officers trained by the principal investigators and 45 officers trained in Ontario by Susan Cox, Mark Stehlin, and Donna-Lee Rabey-McKay. Approximately one third of the officers completed one of three different exercises. The reliability is reported in terms of “percent correct” because there was artificial variability in the training exercises and an answer key that was presumed to be correct.
For officers trained by the principal investigators, between 91% and 95% (depending on the exercise) were within one point of the correct answer for the total Static-99 score. For Stable-2000 total scores, between 47% and 67% were within one point of the correct answer and between 74% and 99% were within three points. The percent correct for the 21 acute ratings ranged from zero to 99%, with a median of 82% correct. It is reasonable to assume that for the one item in which all the officers disagreed with the answer key, the answer key was incorrect.
For the Ontario officers trained by other trainers, between 88% and 91% were within one point of the correct answer for the total Static-99 score. For Stable-2000 total scores, between 28% and 80% were within one point of the correct answer and between 80% and 100% were within three points. The percent correct for the 21 acute ratings ranged from zero to 100%, with a median of 87% correct. These results indicate that it is possible to train trainers who can train as effectively as the original test developers.
The second method of checking reliability involved file reviews of 92 cases registered with the project. The review cases were selected randomly from the settings providing the largest number of complete cases (static, stable and acute data submitted), as well as additional locations that fit into the travel schedule of the expert ratersFootnote 1. Both criteria resulted in over-sampling major urban settings. Cases were pre-selected to have completed the static assessment and at least one stable assessment (the review found that the static assessment was missing for four cases and the stable assessment was missing for five cases). The reviewers' task was to identify the best scoring given the file information available. The reliability calculated from this approach would tend to overestimate rater agreement because: a) the second raters were not blind to the previous ratings, b) both ratings were based on the same file information coded by the original rater, and c) the second rater was able to question the original rater about information that was missing or ambiguous. Consequently, these reliability reviews should be considered a test of the extent to which the officers understood the coding rules rather than a test of the concordance between fully independent assessments.
The agreement was high between the original ratings and the consensus ratings developed through file reviews. The intraclass correlation (ICC) for Static-99 was .91 (k = 88), and .89 for Stable-2000 total scores (k = 87). The ICCs for the individual Acute items ranged from .64 to .95, with a median of .90 (k = 75). The Stable item with the lowest rater reliability was significant social influences (ICC of .66) and the acute item with lowest rater reliability was collapse of social supports (.64). The only item that had unacceptable levels of rater agreement was the override rating, in which the ICC was not meaningfully above chance levels (ICC = .15, k = 74).
Recidivism
Information concerning new offences was gathered through reviews of state, provincial, and national (Canadian) criminal history records, as well as from supervising officers and local police jurisdictions. For Canadian offenders, centralized criminal history records maintained by the RCMP were received in August, 2005, and June, 2006. Provincial/state records were received from the following jurisdictions: Alaska (September, 2004; August, 2005), British Columbia (January, 2006), Iowa (July, 2004; June, 2005), Manitoba (April, 2005), and Ontario (December, 2005). The Offender Management System of the Correctional Service of Canada (CSC) was checked in May, 2005, for recidivism information of the CSC offenders registered in the project.
Once a recidivism event was identified, we then obtained the date on which the offence occurred, and a brief description of the offence behaviour in order to classify it into one of five categories (see below). Offence information was provided by the supervising officers, provincial or state correctional systems, and through direct contact with the police jurisdictions responsible for the original charges. In some cases, the police provided information about new offences that had yet to appear on other records. Consequently, the last known recidivism event was in February, 2007 – the date of our last follow-up with a police jurisdiction.
The follow-up period was calculated from the date that the first assessment information was collected to the date of the last recidivism information received. For the few cases that did not appear on any official record, the follow-up end date was set one month after the last assessment information was received. The offender start dates ranged from January 18, 2001 to October 19, 2005, with a median follow-up time of 41 months (M = 40.9, SD = 13.3, range of 1 to 65 months). For the purpose of survival analyses, the start date was the date of first assessment or the date of release into the community, whichever was latest. The survival end date was the earliest of the following events: sexual recidivism, death, deportation, end of follow-up, or incarceration for a period of time that included the follow-up end date.
Five types of recidivism were recorded. The first category was “sexual crime recidivism”, which included all crimes with a sexual motivation, whether or not the name of the offence was explicitly sexual. This included contact and non-contact offences, as well as sexual offences involving consenting adults (e.g., prostitution, public sex). The second category, “any sexual recidivism”, included sexual crimes as well as sexual breaches, defined as official sanctions for sexually motivated violations of the conditions of community supervision including behaviour that was not otherwise illegal (e.g., child molester loitering in a park). “Violent recidivism” was defined as all crimes that involved direct confrontation with the victim, and included sexual crime recidivism but not sexual breaches. Given that some of the sexual offences were not violent (e.g., prostitution), this category could also be called “violent or sexual recidivism”. The fourth category was “any criminal recidivism”, which included all crimes but excluded breaches. The final category, “any recidivism”, included all crimes (sexual, violent and non-violent) as well as all breaches (sexually motivated and other).
Criminal recidivism was considered to have occurred if the agency reporting the information believed that the offence occurred. For example, we counted as a sexual recidivist a man who self-reported to his therapist that he had exposed himself even though no official sanctions were initiated at that time. For breaches, however, an official record of parole revocation or a new conviction for violation of conditional release was required. If the conviction was for a breach, but the offence description indicated that a crime had occurred, the incident was coded as a crime. Given that criminal history records were the major source of recidivism information, the vast majority of recidivism events were linked to an officially recorded charge or conviction.
Overview of analyses
The first set of analyses examined the predictive validity of the stable risk factors by examining their association with each of the five types of recidivism. The next set of analyses examined whether it was possible to improve the predictive accuracy of the stable assessment by revising the scoring system -- (it was). Given that the original Stable-2000 has already been fully implemented in some jurisdictions, subsequent analyses present findings for both the original Stable-2000 and two revisions. The first revision retains all the original items but provides new rules for combining the static and stable items into an overall evaluation of case priority. The second revision, now called Stable-2007, also revised the coding of some of the original stable items. The final set of analyses examined the predictive validity of the acute items, both alone and in combination with the overall evaluation of priority.
Results
The overall recidivism rates for the 991 male offenders in the sample were as follows: sexual crime, 6.9% (68); any sexual recidivism including sexual breaches, 9.1% (90); any violent or sexual recidivism, 13.5% (134); any criminal recidivism, 18.7% (185); and any recidivism including breaches, 28.0% (277). There were, however, significant differences in the recidivism rates across jurisdictions. Such differences would be expected given the differences in the follow-up times and the sources of the recidivism information, and that the different jurisdictions were responsible for different offenders (only those with probation sentences, only those with sentences of two years or more, all sex offenders sentenced in a state for non-federal offences). Analyzing the jurisdictional variation in recidivism rates is beyond the scope of the current report, but readers should be aware that some of the variation in outcome was associated with jurisdictional differences that could not be accounted for by the variables measured in this study.
Stable variables
The association between the 16 stable items and recidivism was examined using correlation coefficients, frequency tables, and ROC analyses. Each of these approaches assumes a slightly different statistical model and provided similar but not identical results. The ROC AUC (“area under the curve”) results are presented in Table 3. Seven of the 16 items showed significant linear relationships to all outcomes:
- negative social influences
- hostility toward women
- rejection/loneliness
- lack of concern for others
- lack of cooperation with supervision
- impulsive acts
- poor cognitive problem-solving
An additional three items showed significant, linear relationships with the outcome criteria they were designed to predict: sexual pre-occupations and sex as coping were significantly related to sexual recidivism; negative emotion/hostility was related to violent and general recidivism. These 10 items were retained without revision in Stable-2007.
One item, lovers/intimate partners, was significantly related to the relevant outcomes, but the relationship was non-linear (i.e., those with a score of one had lower recidivism rates than offenders with a score of zero). For Stable-2007, the scoring of this item was revised by taking into account whether the offender had ever lived with a lover for two consecutive years (the Static-99 item). The revised item, now called relationship stability, was significantly and linearly related to all outcomes.
None of the three attitude items was significantly related to sexual recidivism. Sexual entitlement and rape attitudes were significantly related to violent and general recidivism; however, this effect was largely due to rapists scoring higher on these items than child molesters, and rapists also being the offenders most prone to general criminal behaviour. There were no meaningful associations between the attitude measures and recidivism within the group of rapists. Child molester attitudes were unrelated to any type of recidivism in the total sample, nor in the subsamples of rapists and child molesters. Consequently, the three attitude measures were not included in Stable-2007.
Emotional identification with children showed significant, but non-linear relationships with sexual recidivism in the total sample and among the child molesters (ROC AUC were non-significant). For child molesters, there was little difference in the sexual recidivism rates of those who scored zero (5.7%, n = 280) or one (4.5%, n = 156), but those who scored two showed significantly higher rates of sexual recidivism (16.2%, n = 37). When the criteria were expanded to include sexual breaches, the recidivism rates were 7.9%, 9.0% and 24.3% (against a base rate of 9.5%). Emotional identification showed the same trend among incest offenders, but was unrelated to any type of recidivism among the rapists or those who had unrelated teen victims (if anything, it appeared protective). Consequently, emotional identification with children was retained in Stable-2007, but only scored for those who had at least one child victim (age 13 or less).
Deviant sexual interests was only weakly related to sexual recidivism, which was surprising given its strong association with sexual recidivism in previous meta-analyses (Hanson & Bussière, 1998; Hanson & Morton-Bourgon, 2005). The scoring rules specified that deviant interests could be assessed via self-report, specialized testing or offence history. Examination of the results suggested that a significant minority of the officers had given insufficient weight to offence history in their judgement of deviant interests (e.g., an offender with eight boy victims was scored as a “zero”). Consequently, this item was revised for Stable-2007, forcing offence history to be considered in the assessment of deviant sexual interests. Specifically, minimum scores were set based on the total number of prior victims (two to seven victims required a minimum score of “one”; eight or more victims required a minimum score of “two”). Given that requiring scorers to count prior victims makes it impossible for those with eight or more victims to improve, a sub-item was added that addresses whether sexual behaviour during the past two years indicates non-deviant adjustment. This sub-item is not part of the total score, but is included so that it can be evaluated in future implementations.Footnote 2
In summary, 10 of the original Stable-2000 items predicted recidivism as well or better than expected and were retained in Stable-2007. The three attitude items did not meaningfully predict recidivism and were deleted. Three additional items were retained with minor modifications (relationship stability, emotional identification with children, and deviant sexual interests). Descriptive information of the 16 original and three revised items can be found in Appendix 3.
Combining stable variables
The next analyses examined the best method of combining the stable items into a total score. The two main options considered were a) using the worst score in each subsection (the original method), and b) summing all items. Neither method was convincingly more accurate than the other. The relative superiority of the two approaches changed based on the outcome criteria and subgroup examined, and none of the differences in predictive accuracy was statistically or practically significant. Given that the simple addition of items is, well. . . the simplest, it was the option used for Stable-2007. The Stable-2007 tally sheet is presented in Appendix 4. In the total sample of adult male sexual offenders, the average Stable-2007 score was 7.5, (SD = 4.9, range of 0 to 26, n = 792), and the average Stable-2000 score was 5.2 (SD = 2.6, range of 0 to 12, n = 799). The internal consistency (alpha) of the 13 Stable-2007 items was .80, and for the 16 Stable-2000 items, alpha equalled .83.
| Type of recidivism | |||||||||||||||
|---|---|---|---|---|---|---|---|---|---|---|---|---|---|---|---|
| Sexual | Sexual (incl. sex breach) | Violent | Any crime | Any crime (incl. breaches) | |||||||||||
| ROC | 95% C.I. | ROC | 95% C.I. | ROC | 95% C.I. | ROC | 95% C.I. | ROC | 95% C.I. | ||||||
| Static-99 (n = 972) | .74 | .67 | .80 | .69 | .63 | .74 | .71 | .66 | .76 | .70 | .66 | .74 | .69 | .66 | .73 |
| Stable-2000 (n = 799) | .64 | .56 | .71 | .66 | .59 | .72 | .65 | .59 | .70 | .64 | .59 | .69 | .67 | .63 | .71 |
| Stable-2007 (n = 792) | .67 | .59 | .74 | .69 | .63 | .75 | .66 | .61 | .72 | .66 | .61 | .71 | .69 | .65 | .73 |
| Stable-2000 items | |||||||||||||||
| Social influences (n = 798) | .59 | .51 | .66 | .60 | .53 | .67 | .60 | .54 | .66 | .60 | .55 | .66 | .61 | .56 | .65 |
| Lovers (n = 799) | .59 | .52 | .66 | .59 | .53 | .65 | .55 | .49 | .60 | .58 | .53 | .62 | .61 | .57 | .66 |
| Identification/kids (n = 798) | .50 | .42 | .58 | .55 | .48 | .62 | .50 | .44 | .56 | .49 | .44 | .54 | .52 | .47 | .56 |
| Hostility/women (n = 799) | .58 | .50 | .66 | .59 | .52 | .66 | .59 | .53 | .65 | .57 | .52 | .62 | .55 | .51 | .60 |
| Rejection/lonely (n = 799) | .60 | .52 | .68 | .61 | .54 | .67 | .55 | .49 | .61 | .56 | .51 | .61 | .57 | .53 | .62 |
| Lack of concern (n = 798) | .58 | .50 | .66 | .57 | .50 | .64 | .60 | .54 | .66 | .62 | .56 | .67 | .61 | .56 | .65 |
| Sex preoccupation (n = 798) | .58 | .50 | .65 | .58 | .51 | .65 | .54 | .49 | .60 | .52 | .47 | .58 | .56 | .51 | .60 |
| Sex as coping (n = 798) | .62 | .54 | .70 | .60 | .53 | .67 | .55 | .49 | .61 | .54 | .49 | .59 | .54 | .50 | .59 |
| Deviant sex interests (n = 799) | .56 | .47 | .64 | .57 | .50 | .64 | .52 | .46 | .58 | .50 | .44 | .55 | .49 | .44 | .53 |
| Entitlement (n = 798) | .54 | .47 | .62 | .54 | .47 | .61 | .58 | .52 | .64 | .57 | .52 | .62 | .57 | .52 | .61 |
| Support assault/adult (n = 799) | .54 | .46 | .62 | .53 | .46 | .60 | .58 | .52 | .64 | .56 | .51 | .61 | .54 | .50 | .59 |
| Child molest attitude (n = 798) | .47 | .39 | .55 | .50 | .43 | .57 | .45 | .39 | .51 | .44 | .39 | .49 | .48 | .43 | .52 |
| Coop/supervision (n = 799) | .58 | .50 | .66 | .62 | .54 | .69 | .62 | .56 | .67 | .60 | .55 | .65 | .63 | .59 | .68 |
| Impulsive acts (n = 799) | .64 | .57 | .71 | .64 | .58 | .71 | .67 | .62 | .72 | .67 | .63 | .72 | .69 | .65 | .73 |
| Poor prob-solving (n = 799) | .60 | .53 | .68 | .63 | .57 | .70 | .64 | .59 | .69 | .64 | .59 | .69 | .64 | .59 | .68 |
| Negative emotion (n = 799) | .55 | .46 | .63 | .56 | .49 | .63 | .57 | .51 | .63 | .57 | .52 | .62 | .58 | .54 | .62 |
| Stable-2007 items | |||||||||||||||
| Lovers (n = 793) | .62 | .55 | .69 | .62 | .56 | .68 | .59 | .53 | .65 | .61 | .56 | .65 | .64 | .60 | .68 |
| Identification/kids (n = 798) | .52 | .44 | .60 | .55 | .48 | .62 | .51 | .45 | .57 | .50 | .44 | .55 | .51 | .47 | .56 |
| Deviant sex interests (n = 791) | .58 | .50 | .66 | .58 | .51 | .65 | .53 | .47 | .59 | .50 | .45 | .56 | .50 | .46 | .55 |
An important question is the extent to which the stable variables added useful information beyond that captured by Static-99. In this data set, the average Static-99 score was 2.9 (SD = 1.9, n = 972) and it showed moderate relationships with the recidivism outcomes, with ROC AUC ranging from .69 to .74. In order to test the incremental validity of Stable-2000 and Stable-2007 over Static-99, cox regression was used with jurisdictions identified as strata and Static-99 scores as the covariate. As can be seen in Table 4, Stable-2007 made a significant incremental contribution for all types of recidivism. Stable-2000 made a significant incremental contribution for all types of recidivism, except for sexual crime recidivism.
| Stable-2000 | Stable-2007 | ||||||
|---|---|---|---|---|---|---|---|
| Sample size (Recidivists/total) | β | SE | p | β | SE | p | |
| Sexual crime | 57/737 | .085 | .058 | .141 | .059 | .030 | .049 |
| Any sexual recidivism (including breaches) | 77/742 | .155 | .050 | .002 | .099 | .026 | .000 |
| Violent or sexual | 109/762 | .125 | .041 | .002 | .059 | .021 | .006 |
| Any crime | 153/767 | .123 | .035 | .000 | .061 | .018 | .001 |
| Any recidivism (including breaches) | 232/768 | .132 | .029 | .000 | .069 | .015 | .000 |
The best method of combining the static and stable variables into nominal categories was explored using different cut-points and combination rules. The original categories proposed for Stable-2000 were not optimal, and the predictive accuracy of the need categories could be improved by using the following categorization: zero to two = low need; three to seven = moderate need; and eight or greater = high need. The recommended three group categorization for Stable-2007 is as follows: 0 to 3 = low need, 4 to 11 = moderate need, and 12 or greater = high need. Approximately 20% of the high need group reoffended with a sexual crime or sexual breach compared to approximately 3% in the low need group (see Table 5).
The results also suggested that the original methods proposed for combining the static and stable factors could be improved. The revised algorithm creates five categories instead of four (see Appendix 2). The most substantive difference is that the offenders classified as high risk on Static-99 (6+) but low or moderate need on Stable were still classified as high priority cases. In this study there were only two individuals with this profile, and one of them reoffended with a sexual crime. Another change was that a new category of “very high priority” was created for individuals who scored high on both Static-99 and the stable variables. The same static/stable combination rules worked well for both Stable-2000 and Stable-2007.
| Stable-2000 | Stable-2007 | ||||||||
|---|---|---|---|---|---|---|---|---|---|
| Risk category | Original | Revised | |||||||
| Scores | % | Sample size (Recidivists/ Total) | Scores | % | Sample size (Recidivists/ Total) | Scores | % | Sample size (Recidivists/ Total) | |
| Very low | 0 | 0.0 | 0/23 | ||||||
| Low | 1-4 | 6.7 | 21/312 | 0-2 | 3.6 | 5/137 | 0-3 | 3.3 | 6/184 |
| Moderate | 5-8 | 9.6 | 36/375 | 3-7 | 8.3 | 42/504 | 4-11 | 7.6 | 34/449 |
| High | 9 + | 22.5 | 20/89 | 8+ | 19.0 | 30/158 | 12+ | 23.3 | 37/159 |
| Overall | 9.6 | 77/799 | 9.6 | 77/799 | 9.7 | 77/792 | |||
Three year recidivism rates with confidence intervals calculated from survival analysis are presented for the original and revised versions in Appendices 5 through 7. Appendix 8 and Appendix 9 present the yearly recidivism rates estimated from survival analysis for the Static-99/Stable-2007 categories.
Appendix 10 presents the predictive accuracy of the static and stable categories for various subgroups of offenders. In the overall sample, both the static and stable variables showed at least moderate relationships with all types of recidivism, and the combined static/stable categories were more accurate than either the static or stable variables individually. This same pattern was evident for extrafamilial child molesters, rapists, non-Aboriginal offenders and Canadian offenders.
For Aboriginal offenders, Static-99 was significantly related to all types of recidivism, but the stable variables were only significantly related to any recidivism (primarily non-sexual breaches). The same pattern of results was shown for non-contact offenders and the combined group of “exceptional” offenders, who either had a diagnosis of developmental delay or a history of psychiatric hospitalization. For the Aboriginal and exceptional groups, consideration of the stable need variables did not improve upon the risk prediction provided by Static-99. For the non-contact offenders, however, the static/stable categories showed strong relationships with recidivism (median ROC of .76). The results for the non-contact offenders need to be considered cautiously because the absolute number of recidivists was small (only four sexual recidivists).
For incest offenders, the stable variables were significantly related to most types of recidivism whereas Static-99 was only significantly related to any recidivism (including breaches). This pattern is expected given that there would be little variance in Static-99 scores for incest offenders (all low risk). What was not expected was the low predictive accuracy of Static-99 in the Alaska/Iowa samples. In these data sets, the best predictor of recidivism was the original Stable-2000, although none of the measures were strongly related to any type of recidivism.
To examine the effects of variable data quality on the results, analyses were conducted on the subgroup of offenders for whom complete data were received. For these offenders, the officers had completed the static assessment, the override rating, at least one stable and at least one acute assessment. It was assumed that the officers who completed the full assessment package were the most conscientious and committed to the project and would, therefore, produce the most reliable data. To further reduce variability due to diverse sources of recidivism information, the analyses were restricted to Canadian offenders for whom national criminal history records had been received. In these analyses, the predictive accuracy of the static and stable variables was high. The median AUC for the Static-99/Stable-2007 categories was .80, and .79 for Static-99/Stable-2000 revised categories.
In contrast to the incremental validity of the static/stable categories, the override judgement led to decreased predictive accuracy. When officers were asked to make unstructured judgements of “exceptional circumstances” that should increase or decrease the static risk assessment, the adjusted Static-99 categories showed less association with all types of recidivism than the original Static-99 categories. The lack of meaningful information in the override judgements is not surprising considering that reliability of these judgements was not significantly above chance levels (ICC of .15).
Analysis of stable change
The above analyses were based on the initial stable assessment, which was to be completed within 3 months of starting community supervision. Stable assessments were to be completed every six months for the duration of community supervision. For the sample of 991 offenders, we received 799 initial stables, 293 second stablesFootnote 3, 114 third stables, 46 fourth stables, 19 fifth stables and, for one offender, we received a sixth stable. Given the short follow-up time and low recidivism rates, it was only meaningful to test the relationship to sexual recidivism with the first and second stable assessments.
The Stable-2007 scores were highly consistent between the first and second assessment, ICC of .79 (n =292). On average, offenders were assessed as having fewer needs on Stable-2007 at the second assessment (M = 6.5; SD = 4.9) than at the first assessment (M = 7.2; SD = 4.6; t = 3.79, df = 291, p < .001). The amount of change between the first and second assessment was unrelated to any form of recidivism.
To examine whether the second assessment was more accurate than the first assessment, the first Stable-2007 assessment and the second Stable-2007 assessment were used to predict recidivism 12 months and 24 months after the second assessment. The predictive accuracy of both assessments was similar. When both the first and second assessments were entered simultaneously in logistic regression to predict 12 month and 24 month recidivism for the five outcome variables, the overall model was significant in all cases, but neither assessment contributed uniquely in 9 of the 10 analyses. The only exception was the second stable assessment significantly contributed beyond the first stable assessment for the prediction of sexual recidivism during the following 12 months. This finding is consistent with expectations, but should be treated cautiously because it was based on only six sex crime recidivists.
Acute variables
Between January 18, 2001 and May 18, 2006, 149 officers submitted 7,050 acute ratings for 744 adult male offenders. The number of acute ratings per offender ranged from 1 to 70, with a median of 7 (M = 9.5, SD = 9.2). Descriptive statistics for the items are given in Appendix 11. A “unique” acute factor was rated in 75% of the assessments (n = 5301). The nature of these acute factors was unknown, and, given that they were not significantly related to any form of recidivism, they will not be considered further.
The seven acute factors were all significantly correlated with each other, with a median correlation of r = 24 (range of .13 to .49, n's vary from 6973 to 7028). A principal components factors analysis generated the following initial eigenvalues: 2.6, 1.0, .87, .85 and .65. The scree plot suggested a single factor, but a two factor varimax rotation provided a relatively clean second factor composed of sexual preoccupations (.75), victim access (.74), rejection of supervision (.61) and hostility (.51). The internal consistency of these four items was .65 (alpha), and .72 for all seven items.
To examine the predictive accuracy of the acute variables, a number of different analyses were conducted using acute ratings from different time frames: a) the most recent rating within 45 days of recidivism; b) the average rating within 45 days; c) the average rating within 90 days; and the average rating within 183 days (6 months). The ratings for the recidivists were compared to acute ratings for non-recidivists associated with a randomly selected date. For these analyses, the recidivists were defined as those offenders who reoffended within the specified time frame. The non-recidivists were those who never reoffended with the specific type of crime. The offenders who reoffended with the specific type of crime outside of the time frames were considered to be “missing”. Each of the five recidivism outcomes was analyzed separately, with different recidivism and non-recidivism dates in each sample.
The acute variables significantly associated with recidivism are presented in Table 6.Footnote 4 Victim access, sexual preoccupations, and rejection of supervision were associated with all types of recidivism in all analyses, and hostility was significantly related to recidivism in 13 of 15 analyses. These are the same four variables that clustered together in the factor analyses. Emotional collapse, collapse of social supports, and substance abuse were significantly associated with any recidivism in all time frames, and with any criminal recidivism in two of the three time frames. These three factors, however, were not consistently related to sexual or violent recidivism. Consequently, the acute variables were considered to comprise two scales: a) the total of the seven items as a predictor of general recidivism; and b) a subscale consisting of the four sexual/violence items (see Acute-2007 Tally Sheet, Appendix 12).
For the sex/violence factors, the recommended cut-scores were as follows: none = low, one (maybe/possible problem) = moderate, and two or more = high. For all acute factors, the recommended cut-scores were as follows: none = low, one - two = moderate, and three or more = high. The acute scales showed moderate ability to differentiate between the imminent recidivists and the non-recidivists (ROC AUC's of .65 to .74; see Table 7). In the total collection of 7050 ratings, the average score for the sex/violence factors was 0.99 (SD = 1.42, range of 0 to 12) and 1.68 (SD = 2.14, range of 0 to 18) for all acute factors.
| Type of recidivism | |||||||||||||||
|---|---|---|---|---|---|---|---|---|---|---|---|---|---|---|---|
| Sexual crime recidivism | Any sexual recidivism | Any violent or sexual recidivism | Any criminal recidivism | Any recidivism (including breaches) | |||||||||||
| 45 day | 90 day | 183 day | 45 day | 90 day | 183 day | 45 day | 90 day | 183 day | 45 day | 90 day | 183 day | 45 day | 90 day | 183 day | |
| Victim access | √ | √ | √ | √ | √ | √ | √ | √ | √ | √ | √ | √ | √ | √ | √ |
| Emotional collapse | √ | √ | √ | √ | √ | √ | |||||||||
| Collapse of social supports | √ | √ | √ | √ | √ | ||||||||||
| Hostility | √ | √ | √ | √ | √ | √ | √ | √ | √ | √ | √ | √ | √ | ||
| Substance abuse | √ | √ | √ | √ | √ | √ | √ | ||||||||
| Sexual preoccupations | √ | √ | √ | √ | √ | √ | √ | √ | √ | √ | √ | √ | √ | √ | √ |
| Rejection of supervision | √ | √ | √ | √ | √ | √ | √ | √ | √ | √ | √ | √ | √ | √ | √ |
| Recidivists | Non-recidivists | |||||||||
| Acute measure | n | M | SD | n | M | SD | ROC | ROC | ||
| Sexual crime | 17 | 690 | ||||||||
| Sex/violence | 2.47 | 2.24 | .95 | 1.42 | .74 | .61 | .86 | |||
| Total | 3.35 | 2.55 | 1.70 | 2.19 | .72 | .60 | .84 | |||
| Any sexual (incl. breaches) | 29 | 668 | ||||||||
| Sex/violence | 2.14 | 2.59 | .98 | 1.37 | .65 | .54 | .76 | |||
| Total | 3.03 | 2.96 | 1.73 | 2.16 | .67 | .57 | .77 | |||
| Any violence | 35 | 634 | ||||||||
| Sex/violence | 2.37 | 2.22 | .98 | 1.50 | .70 | .61 | .80 | |||
| Total | 3.54 | 2.97 | 1.75 | 2.27 | .69 | .60 | .79 | |||
| Any crime | 49 | 596 | ||||||||
| Sex/violence | 2.00 | 2.08 | .96 | 1.47 | .66 | .57 | .74 | |||
| Total | 3.16 | 2.91 | 1.68 | 2.19 | .65 | .57 | .74 | |||
| Any recidivism (incl. breaches) | 93 | 522 | ||||||||
| Sex/violence | 1.90 | 2.23 | .82 | 1.24 | .65 | .59 | .72 | |||
| Total | 3.18 | 3.02 | 1.44 | 1.93 | .69 | .63 | .75 | |||
A series of analyses was conducted to determine the extent to which change in the acute factors was associated with increased risk. Specifically, the following changes were examined:
- most recent rating within 45 days compared to the next most recent rating, provided it was within 90 days of recidivism
- average ratings for the most recent 45 days compared to the average ratings of the next 45 days (days 46 to 90);
- average of the most recent 90 days compared to the average of days 91 to 183; and
- average of the most recent 183 days (six months) compared to the prior six months.
In none of the analyses were the difference scores significantly related to any type of recidivism. As well, the officers' ratings of whether the factors were “getting better”, “getting worse” or “staying the same” were not related to recidivism.
The next analyses examined whether the correlations with recidivism were higher for the assessment conducted in the most recent time period compared to the assessments conducted in the next previous time period. There was no clear superiority for the most recent assessment for time periods less than six months. For the six month average, however, the average ratings in the most recent six months were generally better predictors of recidivism than the average ratings in the prior six months (correlations based on all acute totals: .25 vs. .24 for sexual crime recidivism, .18 vs. .26 for any sexual recidivism [wrong direction], .30 vs. .29 for any violent recidivism, .31 vs. .24 for any criminal recidivism, and .38 vs. .32 for any recidivism; sample sizes range from 217 to 235). Readers should note that the differences were not strong even at six months, suggesting that the acute variables assessed in this study were more “stable” than originally intended.
Another important finding was that averaging the acute ratings over longer time periods increased their predictive accuracy. For example, for the predictions of sexual crime recidivism, the correlations with victim access increased from .12 for the most recent assessment in the last 45 days, to .23 for the average of all assessments in the last 45 days, to .29 for the average of the last six months (all p < .01). Similar patterns were shown for all other risk factors.
Logistic regression was used to determine whether the acute scales significantly contributed to the prediction of imminent recidivism (within 45 days) when controlling for pre-existing risk levels. As can be seen in Table 8, the sex/violence factors significantly predicted all types of recidivism after controlling for Static-99, and after controlling for the combined Static-99/Stable-2007 categories. The total of all acute factors significantly added to the prediction of violent and general recidivism, but not sexual crime recidivism.
| Type of recidivism | Sample size (recid/ total) | Sex/violence factors | All acute factors | ||
|---|---|---|---|---|---|
| Controlling for | Controlling for | ||||
| Static-99 | Static/ Stable | Static-99 | Static/ Stable | ||
| Sexual crime | 17 / 644 | .269* | .223* | .129 | .089 |
| Any sexual | 29 / 701 | .268** | .213* | .140* | .094 |
| Violent/sexual | 34 / 675 | .242** | .218* | .156** | .136* |
| Any crime | 47 / 648 | .200** | .181* | .143** | .129* |
| Any crime, including breaches | 93 / 601 | .288*** | .244** | .226*** | .198*** |
* p < .05, ** p < .001, *** p < .001
Based on a review of the recidivism rates, a set of decision rules was constructed to combine static, stable and acute factors into three priority levels (see Appendix 13). These rules start with the Static‑99/Stable-2007 categories, and the priority is adjusted up or down depending on the most recent acute assessment. Compared to the offenders in the static/stable/acute low priority category, offenders in the moderate priority category were approximately twice as likely to reoffend within 45 days (risk ratios of 1.6 to 2.4, depending on the type of recidivism). The static/stable/acute high priority offenders were approximately four times more likely to reoffend than the low priority offenders (see Appendix 14).
Readers should note, however, that the absolute risk of imminent recidivism was small for all types of recidivism. Out of the total 7050 acute assessments, only 17 immediately preceded a new sexual crime (approximately one in 400). Even for the most frequent types of recidivism (any), the frequency was only one in 75 (93/7050). It is not possible, however, to directly translate the above numbers into probabilities of imminent recidivism because a different number of ratings would have been provided for different offenders.
Discussion
This study demonstrated that community supervision officers were able to assess current social and personal characteristics of sexual offenders that were meaningfully related to sexual, violent and general recidivism. Previous research has documented that recidivism can be predicted by static, historical variables, such as offence history and victim characteristics; in the current study, such static variables also showed moderate to large associations with recidivism. Nevertheless, it was possible to improve the accuracy of risk assessments by using a structured approach to combine static, stable and acute characteristics into an overall evaluation of current risk.
The current results were consistent with previous studies in which stable dynamic characteristics significantly contributed information to the prediction of recidivism above that given by established, static actuarial measures (Beech et al., 2002; Hanson & Harris, 2000; Thornton, 2002). To our knowledge, the current study is unique in that it used a truly prospective design in which officers conducted assessments as part of routine supervision practices. The officers were trained in the risk assessment methods, they assessed new cases, and recidivism information was collected on those cases during an average three year follow-up period.
Although the stable and acute factors meaningfully contributed to risk prediction, there was little evidence that changes on these factors were related to recidivism risk. Offenders changed little on the stable factors during the six month retest period, and the change was unrelated to recidivism. Information about interventions was not recorded, but knowledge of the various jurisdictions participating in the study would suggest that few of the offenders would have received more than a minimal amount of treatment. The practical implication is that assessment of the stable variables need not occur more than yearly, provided that there is no new information or change in circumstances that would justify a re-evaluation of risk.
Nunes and Cortoni (2005) found significant reductions in Stable-2000 scores after a moderate intensity treatment program, whereas Miller, Young, Torres, McCoy and Kwartner (2005) found smaller, non-significant changes for another program. Further research is required to determine whether treatment related changes in Stable-2000/Stable-2007 variables would be related to meaningful reductions in recidivism risk. Most assessments of progress in treatment have little relationship to recidivism (Hanson & Morton-Bourgon, 2005). There are, however, contrary examples. Beech, Erikson, Friendship and Ditchfield (2001) and Marques, Wiederanders, Day, Nelson and van Ommeren (2005) found that structured, empirically-based approaches to assessing treatment gains showed moderate relationships to sexual recidivism. Given that structured, empirically-based risk assessments are frequently superior to unguided clinical judgement, it is likely that increasing structure could improve the validity of post-treatment evaluations.
The current study provided strong support for the value of using structured, empirically-based approaches to risk assessment. When the officers were given the opportunity to provide unstructured adjustments to the risk assessments (override, unique acute factors), the adjustments either did nothing (unique acute factors), or degraded the predictive accuracy of the original scores (override). This is not to say that skilled social perception is not important. Officers must use their professional judgement to rate all the stable and acute factors. Without evidence, however, neither the supervision officers (nor the test developers) would be expected to know the best way to combine these factors into an overall evaluation of risk. In this study, most of the original items were meaningfully related to recidivism risk, but, given basic data (score distributions, recidivism rates) it is possible to improve predictive accuracy through relatively minor changes in scoring and weighting schemes.
The lack of predictive validity for the items addressing attitudes tolerant of sexual assault was unexpected. Attitudes figure prominently in theories of sex offending (Malamuth, 2003; Ward & Siegert, 2002) and recommendations for risk assessment (Beech, Fisher & Thornton, 2003). However, the empirical evidence linking attitudes to sexual recidivism has not been strong. Hanson and Morton‑Bourgon's (2004) meta-analysis found that the general category of deviant sexual attitudes showed a small, significant relationship with sexual recidivism, but that none of the specific attitudes (e.g., child molester attitudes) were significantly related to recidivism. It may be that attitudes are important in the recidivism process, but the best method of assessing these attitudes has yet to be established.
The stable variables appear to meaningfully contribute to risk evaluations for the most common types of offenders (rapist, child molesters). For some special groups of offenders, recidivism was predicted by the static, but not the stable variables (Aboriginal offenders, developmentally delayed, psychiatric history). The reason for the lower validity in these groups is unknown, and the results need to be replicated before firm conclusions can be made. In general, the same risk factors that predict general criminal recidivism among non-Aboriginal offenders predict recidivism among Aboriginals (Rugge, 2006) and mentally disordered offenders (Bonta, Law & Hanson, 1998). It may be that sexual offending is linked to different risk factors in these groups, or it could be that certain aspects of their social presentation make it difficult for evaluators to appropriately distinguish criminogenic from non-criminogenic needs.
The relatively low predictive accuracy of both the static and stable variables in Alaska/Iowa offenders was puzzling. Static-99 has shown moderate to large associations with recidivism in diverse jurisdictions, including 10 American states (average d = .69; Hanson & Morton-Bourgon, 2007). The difference may be due to unknown features of the offenders or the supervision practices they received (e.g., particularly effective interventions with the high priority cases). It may also be related to weaknesses in the source of recidivism information. In these jurisdictions, recidivism information was primarily collected from the records of the states' correctional systems. Although these records should reliably record new offences occurring under sentence, they are unlikely to include out-of-state offences that were committed post warrant expiry.
Another indication that the quality of the records could have a substantial influence on the results was the high level of predictive accuracy found for the assessments conducted by the “conscientious” officers, defined as those submitting all the requested information. The reliability review did not identify any systematic problems with rater reliability; however, the reliability cases were selected from those who we expected to have complete data. Our efforts to increase the number of static, stable and acute ratings included in the reliability review may have inadvertently biased the sample toward the most conscientious officers.
Another unexpected finding was that the “acute” factors seemed to measure relatively enduring characteristics rather than being specifically related to the timing of reoffending. The most recent acute assessment significantly contributed to the risk assessment, but the average of the past six months acute assessments was an even better predictor of recidivism. Aggregating acute ratings could increase predictive accuracy by increasing the reliability of the assessment of enduring personality traits (Epstein, 1979). Even assuming 100% reliability, it is reasonable to expect an offender who has consistently failed to cooperate with supervision to be higher risk than an offender who deviated on a single occasion. Consequently, the acute assessment should probably be considered current expressions of life problems, which may or may not be chronic. Our proposed method of considering acute factors is based on the single most recent evaluation, but it is possible that other procedures for summarizing acute factors may provide higher predictive accuracy (e.g., a running average). The best method of considering rapidly changing factors in the applied risk assessments has yet to be established (Hanson, 2005).
Overall, this study provides a rare demonstration of the value of combining static, stable and acute risk factors in the community supervision of sexual offenders. The assessment tools, when properly used, showed levels of predictive accuracy as high as or higher than has been shown for other established methods of risk assessment with sexual offenders. Further research is needed, however, to determine the extent to which the stable and acute variables are related to changes in the recidivism risk. For the stable factors, it may be that behaviour over several years is needed before changes can be reliably assessed. To identify rapidly changing factors associated with the timing of recidivism (i.e., truly acute factors), it may be necessary to have more frequent evaluations that those conducted in the current study (daily rather than monthly).
Further research could also profitably examine different methods for assessing stable and acute factors. In the current study, community supervision officers assessed the items based on structured interviews and file reviews. It is quite likely, however, that more comprehensive evaluations and specialized testing (e.g., phallometric assessments) could improve the reliability and validity of the assessment information. It would also be valuable to know the extent to which the results generalize outside the context of community supervision (e.g., institutions, post-treatment assessments, parole release decisions).
Recommendations
The original Stable-2000/Acute-2000 instruments showed acceptable levels of reliability and validity, and their continued use can be justified when the cost of changing assessment procedures is high. We recommend, however, using the revised versions, Stable-2007 and Acute-2007. The revised versions have higher predictive accuracy than the original versions, and are not any more difficult to administer. If, for logistic reasons, evaluators continue to use the original Stable-2000 items, we strongly recommend using the empirically-derived rules for creating need categories and combining the items. For jurisdictions that have yet to adopt a method of risk assessment for sexual offenders, the approach described in this report warrants serious consideration.
The variability in the accuracy of the risk assessments of different officers suggests that training and supervision should be important considerations when implementing the stable and acute measures. In addition to structured training, it would be desirable to have potential evaluators demonstrate competence in the use of the scoring system before using it.
Risk assessments contribute to community safety to the extent that they direct appropriate interventions. Consequently, jurisdictions that implement risk assessment procedures should also implement training in empirically defensible intervention strategies. Although the effectiveness of interventions with sexual offenders remains controversial (Collaborative Data Outcome Committee, 2007), much is known about interventions that reduce violent and general recidivism (Andrews & Bonta, 2006, Chapter 10). Given that sexual offenders are more likely to reoffend with a non-sexual offence than a sexual offence, there is no reason to believe that similar interventions cannot be helpful in reducing the recidivism risk of sexual offenders.
References
Andrews, D. A., & Bonta, J. S. (2006). The psychology of criminal conduct (4th ed.). Cincinnati, OH: Anderson.
Beech, A., Erikson, M., Friendship, C., & Ditchfield, J. (2001). A six-year follow-up of men going through probation-based sex offender treatment programmes (Findings #144). London, U.K.: Home Office.
Beech, A. R., Fisher, D. D., & Thornton, D. (2003). Risk assessment of sex offenders. Professional Psychology: Research and Practice, 34, 339-352.
Beech, A., Friendship, C., Erikson, M., & Hanson, R. K. (2002). The relationship between static and dynamic risk factors and reconviction in a sample of U.K. child abusers. Sexual Abuse: A Journal of Research and Treatment, 14, 155-167.
Bonta, J., Law, M., & Hanson, R. K. (1998). The prediction of criminal and violent recidivism among mentally disordered offenders: A meta-analysis. Psychological Bulletin, 123, 123-142.
Collaborative Data Outcome Committe. (2007). Sex offender treatment outcome research: Guidelines for evaluation (CODC Guidelines). Part 1: Introduction and overview. (Corrections User Report No. 2007-02). Ottawa: Public Safety Canada.
Cortoni, F., & Hanson, R. K. (2005). A review of the recidivism rates of adult female sexual offenders (Report No R-169). Ottawa: Correctional Service of Canada.
Epstein, S. (1979). The stability of behavior: I. On predicting most of the people much of the time. Journal of Personality and Social Psychology, 37, 1097-1126.
Hanson, R. K. (2005). Stability and change: Dynamic risk factors for sexual offenders. In W. L. Marshall, Y. M. Fernandez, L. E. Marshall, & G. A. Serran (Eds.), Sexual offender treatment: Issues and controversies (pp. 17-31). West Sussex, UK: John Wiley.
Hanson, R. K., & Bussière, M. T. (1998). Predicting relapse: A meta-analysis of sexual offender recidivism studies. Journal of Consulting and Clinical Psychology, 66, 348-362.
Hanson, R. K., Gizzarelli, R., & Scott, H. (1994). The attitudes of incest offenders: Sexual entitlement and acceptance of sex with children. Criminal Justice and Behavior, 21, 187-202.
Hanson, R. K., & Harris, A. J. R. (2000). Where should we intervene? Dynamic predictors of sex offense recidivism. Criminal Justice and Behavior, 27, 6-35.
Hanson, R. K., & Harris, A. J. R. (2001). A structured approach to evaluating change among sexual offenders. Sexual Abuse: A Journal of Research and Treatment, 13, 105-122.
Hanson, R. K., & Morton-Bourgon, K. (2004). Predictors of sexual recidivism: An updated meta-analysis (Corrections User Report No. 2004-02). Ottawa: Public Safety and Emergency Preparedness Canada.
Hanson, R. K., & Morton-Bourgon, K. E. (2005). The characteristics of persistent sexual offenders: A meta-analysis of recidivism studies. Journal of Consulting and Clinical Psychology, 73, 1154-1163.
Hanson, R. K., & Morton-Bourgon, K. E. (2007). The accuracy of recidivism risk assessments for sexual offenders: A meta-analysis (Corrections User Report No 2007-01). Ottawa: Public Safety and Emergency Preparedness Canada.
Hanson, R. K., & Thornton, D. (2000). Improving risk assessments for sex offenders: A comparison of three actuarial scales. Law and Human Behavior, 24, 119-136.
Harris, A. J. R., & Hanson, R. K. (2004). Sex offender recidivism: A simple question (Corrections User Report No. 2004-03) Ottawa: Public Safety and Emergency Preparedness Canada.
Harris, A., Phenix, A., Hanson, R. K., & Thornton, D. (2003). Static-99 coding rules: Revised 2003. Ottawa: Department of the Solicitor General of Canada.
Information Management Services, Inc. (1994). Interactive Power Program [Computer software]. Rockville, MD: Author.
Malamuth, N. M. (2003). Criminal and noncriminal sexual aggressors: Integrating psychopathy in hierarchical-mediational confluence model. In R. A. Prentky, E. S. Janus & M. C. Seto (Eds.), Sexually coercive behavior: Understanding and management (pp. 33-58). Annals of the New York Academy of Sciences, Vol. 989.
Marques, J. K., Wiederanders, M., Day, D. M., Nelson, C., & van Ommeren, A. (2005). Effects of a relapse prevention program on sexual recidivism: Final results from California's Sex Offender Treatment and Evaluation Project (SOTEP). Sexual Abuse: A Journal of Research and Treatment, 17, 79-107.
Miller, H. A., Young, B. A., Torres, A., McCoy, W., & Kwartner, P. (2005, November). The utility of the Sexual Offender Needs Assessment Rating scale (SONAR) in a prison-based treatment program. Presentation at the 24th Annual Research and Treatment Conference of the Association for the Treatment of Sexual Abusers, Salt Lake City, UT.
Nunes, K. L., & Cortoni, F. (2005, November). The utility of psychometric measures in assessing treatment change. Presentation at the 24th Annual Research and Treatment Conference of the Association for the Treatment of Sexual Abusers, Salt Lake City, UT.
Proulx, J., McKibben, A., & Lusignan, R. (1996). Relationship between affective components and sexual behaviors in sexual aggressors. Sexual Abuse: A Journal of Research and Treatment, 8, 279-289.
Quinsey, V. L., Coleman, G., Jones, B., & Altrows, I. (1997). Proximal antecedents of eloping and reoffending among supervised mentally disordered offenders. Journal of Interpersonal Violence, 12, 794-813.
Rugge, T. (2006). Risk assessment of male aboriginal offenders: A 2006 perspective (Corrections User Report 2006-01). Ottawa: Public Safety and Emergency Preparedness Canada.
Thornton, D. (2002). Constructing and testing a framework for dynamic risk assessment. Sexual Abuse: A Journal of Research and Treatment, 14, 139-153.
Ward, T., & Siegert, R. J. (2002). Toward a comprehensive theory of child sexual abuse: A theory knitting perspective. Psychology, Crime, & Law, 8, 319-351.
Wilson, R. J. (1999). Emotional congruence in sexual offenders against children. Sexual Abuse: A Journal of Research and Treatment, 11, 33-47.
Appendices
Appendix 1: STABLE-2000 Tally Sheet
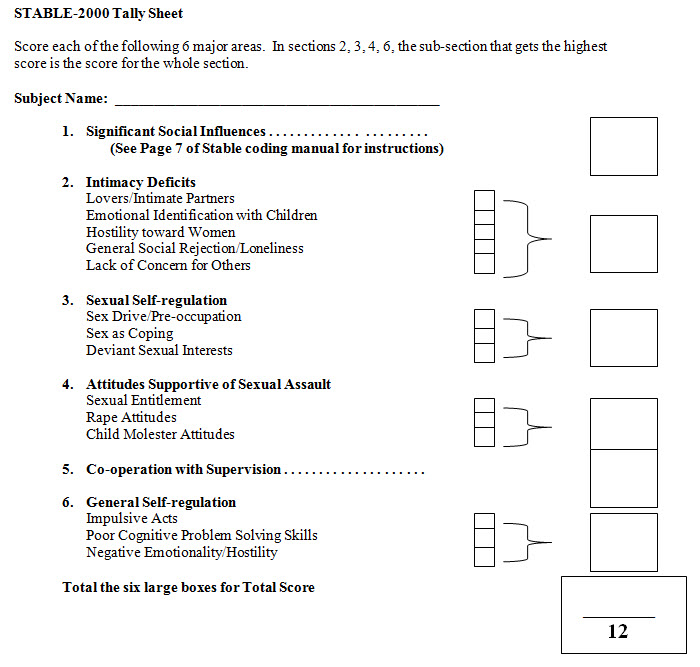
Image Description
Score each of the following 6 major areas. In sections 2, 3, 4, 6, the sub-section that gets the highest score is the score for the whole section.
Subject Name: ____________________________________________
- Significant Social Influences (See Page 7 of Stable coding manual for instructions)
- Intimacy Deficits
- Lovers/Intimate Partners
- Emotional Identification with Children
- Hostility toward Women
- General Social Rejection/Loneliness
- Lack of Concern for Others
- Sexual Self-regulation
- Sex Drive/Pre-occupation
- Sex as Coping
- Deviant Sexual Interests
- Attitudes Supportive of Sexual Assault
- Sexual Entitlement
- Rape Attitudes
- Child Molester Attitudes
- Co-operation with Supervision
- General Self-regulation
- Impulsive Acts
- Poor Cognitive Problem Solving Skills
- Negative Emotionality/Hostility
_________/12
Total the six large boxes for Total Score
Appendix 2: Rules for combining static and stable factors
| Initial rules proposed | Empirically informed rules | |||
|---|---|---|---|---|
| Static-99 risk category | Stable-2000 need category | Static/stable priority rating | Stable-2000 or Stable-2007 need category | Static/stable priority rating |
| Low | Low | Low | Low | Low |
| Moderate | Low | Moderate | Low | |
| High | Moderate-low | High | Moderate-low | |
| Moderate-low | Zero risk factors | Low | ||
| Low | Moderate-low | Low | Low | |
| Moderate | Moderate-low | Moderate | Moderate-low | |
| High | Moderate-high | High | Moderate-high | |
| Moderate-high | Low | Moderate-low | Low | Moderate-low |
| Moderate | Moderate-high | Moderate | Moderate-high | |
| High | High | High | High | |
| High | Low | Moderate-high | Low | High |
| Moderate | Moderate-high | Moderate | High | |
| High | High | High | Very high | |
Original (proposed) need categories:
Stable-2000 – Low (0-4), Moderate (5 – 8), High (9 – 12).
Empirically informed need categories:
Stable-2000 - Low (0-2), Moderate (3-7), High (8 – 12).
Stable-2007 – Low (0-3), Moderate (4 – 11), High (12 – 26).
Appendix 3: Distribution of stable risk factors (first assessment)
| Stable-2000 items | % scoring a “0” in this area (sample size) | % scoring a “1” in this area (sample size) | % scoring a “2” in this area (sample size) |
|---|---|---|---|
| 1) Significant social influences* (Section average score = .56, SD = .74) | 58.6% (472) | 26.6% (214) | 14.7% (118) |
| 2) Intimacy deficits (Section average score = 1.50, SD = .69) | 11.2% (90) | 27.6% (222) | 61.2% (493) |
|
26.1% (210) | 20.4% (164) | 53.5% (431) |
|
70.4% (567) | 24.7% (199) | 4.7% (38) |
|
70.1% (564) | 23.9% (192) | 5.8% (47) |
|
40.2% (324) | 40.5% (326) | 19.3% (155) |
|
57.1% (460) | 32.2% (259) | 10.6% (85) |
| 3) Sexual self-regulation (Section average score = .92, SD = .78) | 34.9% (281) | 38.6% (311) | 26.5% (213) |
|
55.0% (443) | 33.5% (270) | 11.3% (91) |
|
64.1% (516) | 22.4% (180) | 13.4% (108) |
|
59.4% (478) | 25.6% (206) | 15.0% (121) |
| 4) Attitudes supportive of sexual assault (Section average score = .79, SD = .66) | 34.3% (276) | 52.4% (422) | 13.3% (107) |
|
57.4% (462) | 34.2% (275) | 8.3% (67) |
|
67.5% (543) | 29.6% (238) | 3.0% (24) |
|
64.6% (520) | 29.6% (238) | 5.7% (46) |
| 5) Cooperation with supervision (Section average score = .39, SD = .65) | 69.8% (562) | 21.2% (171) | 8.9% (72) |
| 6) General self-regulation (Section average score = 1.02, SD = .75) | 27.0% (217) | 44.0% (354) | 29.1% (234) |
|
56.8% (457) | 28.4% (229) | 14.8% (119) |
|
43.2% (348) | 38.4% (309) | 18.4% (148) |
|
64.0% (515) | 26.8% (216) | 9.2% (74) |
| Revised items for Stable-2007 | |||
|
23.0% (182) | 43.1% (342) | 33.9% (269) |
|
80.8% (645) | 15.4% (123) | 3.8% (30) |
|
42.9% (339) | 40.7% (322) | 16.4% (130) |
Percentages may not sum to 100 due to rounding
*NOTE: contains missing information
Appendix 4: STABLE-2007 Tally Sheet
Subject Name: ____________________________________________________
Place of Scoring: __________________________________________________
Date of Scoring:____________ Name of Assessor: ___________________
| Scoring Item | Notes | Section Total | |
|---|---|---|---|
| Significant Social Influences | |||
| Capacity for Relationship Stability | |||
| Emotional ID with Children | (Only score this item for offenders with victims age 13 or younger) | ||
| Hostility toward women | |||
| General Social Rejection | |||
| Lack of concern for others | |||
| Impulsive | |||
| Poor Problem Solving Skills | |||
| Negative Emotionality | |||
| Sex Drive Sex Preoccupation | |||
| Sex as Coping | |||
| Deviant Sexual Preference | |||
| Deviant Sexual Interests in Possible Remission An offender who has scored a “2” based upon historical facts can have their Deviant Sexual Interest score reduced by one point if the following is present: The offender is involved in an age appropriate, consensual, satisfying sexual relationship of at least one year's duration while “at risk” in the community with the absence of behavioural indicators of Deviant Sexual Interest for 2 years. If the presence of this relationship has been confirmed by a credible, independent, collateral contact and the above condition applies you may enter and count a “negative 1” in this score box – reducing the offender's overall score by “1” | |||
| Co-operation with Supervision | |||
| Sum for Final Total (Out of 24 for those without a child victim) | _________ 26 | ||
Interpretive Ranges: 0 – 3 = Low, 4 – 11 = Moderate, 12+ = High
Appendix 5: Three year recidivism rates for Static/Stable-2000 – original version
| Type of recidivism | ||||||||||||||||||||
|---|---|---|---|---|---|---|---|---|---|---|---|---|---|---|---|---|---|---|---|---|
| Sexual | Sexual (including sexual breaches) | Violent | Any crime | Any (incl. breaches) | ||||||||||||||||
| Risk level | n (%) | % | 95% C. I. | % | 95% C. I. | % | 95% C. I. | % | 95% C. I. | % | 95% C. I. | |||||||||
| 1 | 200 (25.3) | 2.4 | 0.0 | 4.7 | 4.6 | 1.5 | 7.8 | 5.8 | 2.3 | 9.3 | 8.4 | 4.2 | 12.5 | 15.6 | 10.2 | 21.0 | ||||
| 2 | 359 (45.4) | 5.0 | 2.7 | 7.4 | 6.8 | 4.1 | 9.5 | 10.2 | 6.9 | 13.4 | 15.8 | 11.8 | 19.8 | 24.5 | 19.8 | 29.2 | ||||
| 3 | 176 (22.3) | 15.1 | 9.5 | 20.8 | 19.9 | 13.6 | 26.1 | 26.5 | 19.5 | 33.5 | 37.2 | 29.6 | 44.9 | 53.3 | 45.4 | 61.2 | ||||
| 4 | 55 (7.0) | 18.7 | 8.2 | 29.2 | 22.4 | 11.2 | 33.6 | 35.7 | 22.8 | 48.7 | 39.4 | 26.2 | 52.6 | 49.7 | 36.3 | 63.0 | ||||
| Total | 790 (100) | 7.6 | 5.6 | 9.5 | 10.3 | 8.0 | 12.5 | 14.5 | 12.0 | 17.1 | 20.4 | 17.4 | 23.4 | 30.4 | 27.0 | 33.8 | ||||
Appendix 6: Three year recidivism rates for Static/Stable-2000 – revised version
| Type of recidivism | ||||||||||||||||||||
|---|---|---|---|---|---|---|---|---|---|---|---|---|---|---|---|---|---|---|---|---|
| Sexual | Sexual (including sexual breaches) | Violent | Any crime | Any (incl. breaches) | ||||||||||||||||
| Risk level | n (%) | % | 95% C. I. | % | 95% C. I. | % | 95% C. I. | % | 95% C. I. | % | 95% C. I. | |||||||||
| 1 | 250 (31.5) | 1.9 | 0.0 | 3.7 | 3.6 | 1.2 | 6.2 | 4.6 | 1.8 | 7.4 | 9.1 | 5.2 | 12.9 | 15.2 | 10.4 | 20.0 | ||||
| 2 | 245 (30.9) | 4.3 | 1.7 | 7.0 | 6.4 | 3.3 | 9.6 | 10.5 | 6.5 | 14.5 | 14.5 | 9.9 | 19.1 | 24.4 | 18.8 | 30.0 | ||||
| 3 | 169 (21.3) | 9.8 | 5.0 | 14.5 | 14.9 | 9.2 | 20.6 | 20.7 | 14.1 | 27.3 | 30.7 | 23.2 | 38.2 | 43.4 | 35.3 | 51.4 | ||||
| 4 | 84 (10.6) | 22.2 | 12.7 | 31.7 | 23.4 | 13.8 | 33.1 | 29.3 | 19.0 | 39.5 | 36.9 | 26.0 | 47.8 | 48.2 | 36.9 | 59.6 | ||||
| 5 | 45 (5.7) | 20.7 | 8.6 | 32.8 | 25.2 | 13.0 | 38.1 | 39.8 | 24.9 | 54.6 | 44.3 | 29.2 | 59.4 | 63.3 | 49.0 | 77.7 | ||||
| Total | 793 (100) | 7.5 | 5.6 | 9.5 | 10.2 | 8.0 | 12.4 | 14.5 | 11.9 | 17.1 | 20.4 | 17.4 | 23.3 | 30.3 | 26.9 | 33.7 | ||||
Appendix 7: Three year recidivism rates for Static/Stable-2007
| Type of recidivism | ||||||||||||||||||||
|---|---|---|---|---|---|---|---|---|---|---|---|---|---|---|---|---|---|---|---|---|
| Sexual | Sexual (including sexual breaches) | Violent | Any crime | Any (incl. breaches) | ||||||||||||||||
| Risk level | n (%) | % | 95% C. I. | % | 95% C. I. | % | 95% C. I. | % | 95% C. I. | % | 95% C. I. | |||||||||
| 1 | 278 (35.1) | 2.0 | 0.3 | 3.8 | 3.6 | 1.3 | 6.0 | 4.8 | 2.1 | 7.5 | 9.2 | 5.6 | 12.8 | 15.1 | 10.6 | 19.6 | ||||
| 2 | 224 (28.3) | 4.3 | 1.5 | 7.1 | 6.2 | 2.9 | 9.4 | 10.7 | 6.4 | 14.9 | 14.8 | 9.8 | 19.7 | 25.2 | 19.2 | 31.2 | ||||
| 3 | 157 (19.8) | 9.2 | 4.4 | 14.0 | 14.1 | 8.3 | 19.9 | 20.0 | 13.2 | 26.7 | 30.6 | 22.9 | 38.2 | 44.5 | 36.1 | 52.9 | ||||
| 4 | 84 (10.6) | 22.0 | 12.6 | 31.3 | 25.8 | 15.9 | 35.6 | 31.9 | 21.4 | 42.4 | 36.8 | 25.9 | 47.6 | 47.4 | 36.2 | 58.6 | ||||
| 5 | 49 (6.2) | 23.2 | 11.1 | 35.3 | 27.3 | 14.6 | 40.0 | 38.7 | 24.5 | 52.8 | 47.2 | 32.6 | 61.7 | 64.5 | 50.8 | 78.2 | ||||
| Total | 792 (100) | 7.6 | 5.6 | 9.5 | 10.2 | 8.0 | 12.5 | 14.5 | 11.9 | 17.1 | 20.4 | 17.4 | 23.3 | 30.4 | 27.0 | 33.7 | ||||
Appendix 8: Sexual recidivism rates for Static/Stable-2007 risk categories
| Sexual recidivism | Sexual recidivism (including sexual breaches) | |||||||||
|---|---|---|---|---|---|---|---|---|---|---|
| Risk category | Sample size (%) | 1 year | 2 years | 3 years | 4 years | 1 year | 2 years | 3 years | 4 years | |
| 1 | 278 (35.1) | 0.7 | 1.1 | 2.0 | 2.0 | 1.5 | 2.2 | 3.6 | 3.6 | |
| 2 | 224 (28.3) | 2.2 | 3.7 | 4.3 | 4.3 | 4.1 | 5.5 | 6.2 | 6.2 | |
| 3 | 157 (19.8) | 3.8 | 6.6 | 9.2 | 9.2 | 5.7 | 10.5 | 14.1 | 14.1 | |
| 4 | 84 (10.6) | 13.2 | 17.1 | 22.0 | 22.0 | 15.6 | 20.8 | 25.8 | 25.8 | |
| 5 | 49 (6.2) | 14.3 | 20.8 | 23.2 | 26.6 | 18.4 | 24.8 | 27.3 | 30.6 | |
| Overall | 792 (100) | 4.0 | 5.9 | 7.6 | 7.8 | 5.6 | 8.2 | 10.2 | 10.5 | |
Appendix 9: Violent and general recidivism rates for Static/Stable-2007 risk categories
| Violent recidivism | Any crime | Any recidivism (including breaches) | |||||||||||||
|---|---|---|---|---|---|---|---|---|---|---|---|---|---|---|---|
| Risk category | Sample size (%) | 1 yr | 2 yrs | 3 yrs | 4 yrs | 1 yr | 2 yrs | 3 yrs | 4 yrs | 1 yr | 2 yrs | 3 yrs | 4 yrs | ||
| 0 | 278 (35.1) | 1.5 | 3.4 | 4.8 | 4.8 | 3.7 | 6.4 | 9.2 | 9.2 | 7.3 | 10.9 | 15.1 | 15.1 | ||
| 1 | 224 (28.3) | 5.4 | 8.8 | 10.7 | 12.6 | 8.1 | 11.1 | 14.8 | 14.8 | 14.4 | 20.8 | 25.2 | 27.3 | ||
| 2 | 157 (19.8) | 7.6 | 13.8 | 20.0 | 20.0 | 14.6 | 24.4 | 30.6 | 31.9 | 24.2 | 34.6 | 44.5 | 47.3 | ||
| 3 | 84 (10.6) | 16.7 | 25.6 | 31.9 | 31.9 | 21.4 | 30.4 | 36.8 | 39.0 | 31.0 | 42.5 | 47.4 | 47.4 | ||
| 4 | 49 (6.2) | 20.4 | 31.2 | 38.7 | 42.0 | 26.5 | 37.3 | 47.2 | 47.2 | 44.9 | 57.6 | 64.5 | 67.4 | ||
| Overall | 792 (100) | 6.6 | 11.2 | 14.5 | 15.3 | 10.4 | 15.8 | 20.4 | 20.9 | 17.6 | 24.8 | 30.4 | 31.7 | ||
Appendix 10: Predictive accuracy across sub-groups
| Type of recidivism | |||||||||||||||
|---|---|---|---|---|---|---|---|---|---|---|---|---|---|---|---|
| Sexual | Sexual (incl. sex breach) | Violent | Any crime | Any crime (incl. breaches) | |||||||||||
| ROC | 95% C.I. | ROC | 95% C.I. | ROC | 95% C.I. | ROC | 95% C.I. | ROC | 95% C.I. | ||||||
| Overall | |||||||||||||||
| Recidivism rates | 7.2% (57 / 793) | 9.7% (77 / 793) | 13.7% (109 / 793) | 19.3% (153 / 793) | 29.2% (232 / 793) | ||||||||||
| Static-99 (n = 972) | .74 | .67 | .80 | .69 | .63 | .74 | .71 | .66 | .76 | .70 | .66 | .74 | .69 | .66 | .73 |
| Stable-2000 (n = 799) | .64 | .56 | .71 | .66 | .59 | .72 | .65 | .59 | .70 | .64 | .59 | .69 | .67 | .63 | .71 |
| Stable-2007 (n = 792) | .67 | .59 | .74 | .69 | .63 | .75 | .66 | .61 | .72 | .66 | .61 | .71 | .69 | .65 | .73 |
| Static-Stable-2000 (n = 793) | .71 | .64 | .78 | .69 | .62 | .75 | .70 | .64 | .75 | .69 | .64 | .74 | .69 | .65 | .73 |
| Static-Stable-2000R (n = 793) | .75 | .68 | .81 | .71 | .65 | .77 | .72 | .67 | .77 | .70 | .65 | .74 | .70 | .66 | .74 |
| Static-Stable-2007 (n = 792) | .76 | .69 | .82 | .73 | .67 | .79 | .72 | .67 | .77 | .70 | .66 | .75 | .70 | .66 | .74 |
| Extra-familial CM | |||||||||||||||
| Recidivism rates | 7.4% (15 / 202) | 11.9% (24 / 202) | 13.9% (28 / 202) | 17.3% (35 / 202) | 31.2% (63 / 202) | ||||||||||
| Static-99 (n = 252) | .74 | .62 | .87 | .68 | .57 | .79 | .75 | .66 | .84 | .74 | .65 | .82 | .71 | .64 | .78 |
| Stable-2000 (n = 203) | .70 | .55 | .86 | .69 | .57 | .81 | .72 | .61 | .82 | .70 | .61 | .80 | .70 | .62 | .78 |
| Stable-2007 (n = 202) | .74 | .60 | .89 | .76 | .65 | .86 | .76 | .66 | .86 | .74 | .65 | .84 | .74 | .67 | .81 |
| Static-Stable-2000 (n = 202) | .75 | .60 | .89 | .73 | .61 | .84 | .77 | .66 | .88 | .76 | .66 | .85 | .74 | .66 | .82 |
| Static-Stable-2000R (n = 202) | .75 | .62 | .88 | .73 | .62 | .84 | .77 | .68 | .87 | .77 | .68 | .85 | .76 | .69 | .83 |
| Static-Stable-2007 (n = 202) | .77 | .64 | .90 | .76 | .65 | .86 | .77 | .67 | .86 | .76 | .68 | .85 | .76 | .69 | .83 |
| Incest | |||||||||||||||
| Recidivism rates | 1.7% (3 / 180) | 5.0% (9 / 180) | 4.4% (8 / 180) | 8.3% (15 / 180) | 18.3% (33 / 180) | ||||||||||
| Static-99 (n = 206) | .48 | .16 | .80 | .59 | .42 | .75 | .66 | .49 | .82 | .61 | .47 | .75 | .65 | .56 | .74 |
| Stable-2000 (n = 180) | .64 | .34 | .94 | .71 | .51 | .92 | .74 | .59 | .89 | .64 | .50 | .77 | .67 | .58 | .77 |
| Stable-2007 (n = 180) | .57 | .43 | .71 | .70 | .53 | .86 | .70 | .56 | .83 | .62 | .50 | .75 | .64 | .55 | .74 |
| Static-Stable-2000 (n = 180) | .58 | .29 | .86 | .63 | .44 | .82 | .73 | .58 | .89 | .61 | .47 | .76 | .65 | .55 | .75 |
| Static-Stable-2000R (n = 180) | .58 | .30 | .85 | .62 | .44 | .81 | .73 | .58 | .88 | .58 | .43 | .72 | .64 | .54 | .74 |
| Static-Stable-2007 (n = 180) | .58 | .31 | .85 | .65 | .46 | .84 | .73 | .58 | .87 | .58 | .44 | .73 | .64 | .54 | .74 |
| Rapists | |||||||||||||||
| Recidivism rates | 9.0% (24 / 267) | 10.5% (28 / 267) | 19.1% (51 / 267) | 28.1% (75 / 267) | 37.4% (100 / 267) | ||||||||||
| Static-99 (n = 340) | .70 | .60 | .80 | .69 | .59 | .78 | .66 | .58 | .73 | .66 | .60 | .73 | .69 | .63 | .75 |
| Stable-2000 (n = 267) | .65 | .53 | .76 | .66 | .55 | .77 | .61 | .53 | .70 | .64 | .56 | .71 | .67 | .61 | .74 |
| Stable-2007 (n = 267) | .68 | .56 | .80 | .69 | .58 | .80 | .63 | .55 | .71 | .65 | .58 | .72 | .69 | .63 | .75 |
| Static-Stable-2000 (n = 267) | .68 | .57 | .79 | .67 | .56 | .78 | .61 | .52 | .69 | .65 | .58 | .72 | .67 | .60 | .73 |
| Static-Stable-2000R (n = 267) | .73 | .62 | .83 | .71 | .61 | .81 | .65 | .57 | .73 | .66 | .59 | .73 | .67 | .60 | .74 |
| Static-Stable-2007 (n = 267) | .73 | .62 | .84 | .72 | .61 | .82 | .66 | .58 | .74 | .67 | .60 | .74 | .68 | .62 | .75 |
| Non-contact | |||||||||||||||
| Recidivism rates | 5.7% (4 / 70) | 5.7% (4 / 70) | 8.6% (6 / 70) | 12.8% (9 / 70) | 17.1% (12 / 70) | ||||||||||
| Static-99 (n = 89) | .74 | .54 | .94 | .67 | .46 | .88 | .66 | .50 | .83 | .65 | .52 | .79 | .71 | .58 | .84 |
| Stable-2000 (n = 71) | .40 | .18 | .61 | .40 | .18 | .61 | .48 | .30 | .67 | .57 | .40 | .74 | .67 | .51 | .82 |
| Stable-2007 (n = 70) | .51 | .24 | .78 | .51 | .24 | .78 | .53 | .33 | .74 | .64 | .46 | .81 | .73 | .58 | .89 |
| Static-Stable-2000 (n = 71) | .63 | .40 | .86 | .63 | .40 | .86 | .67 | .50 | .85 | .68 | .52 | .86 | .74 | .60 | .88 |
| Static-Stable-2000R (n = 71) | .76 | .61 | .92 | .76 | .61 | .92 | .70 | .55 | .84 | .65 | .50 | .80 | .76 | .62 | .90 |
| Static-Stable-2007 (n = 70) | .80 | .63 | .98 | .80 | .63 | .98 | .72 | .55 | .89 | .70 | .56 | .84 | .80 | .68 | .92 |
| Exceptional * | |||||||||||||||
| Recidivism rates | 13.2% (15 / 114) | 18.4% (21 / 114) | 18.4% (21 / 114) | 27.2% (31 / 114) | 36.0% (41 / 114) | ||||||||||
| Static-99 (n = 148) | .73 | .62 | .84 | .68 | 58 | .78 | .74 | .64 | .84 | .70 | .61 | .79 | .71 | .63 | .80 |
| Stable-2000 (n = 115) | .50 | .34 | .66 | .56 | .42 | .70 | .56 | .43 | .70 | .59 | .47 | .70 | .62 | .52 | .73 |
| Stable-2007 (n = 114) | .56 | .40 | .72 | .62 | .48 | .75 | .60 | .46 | .73 | .63 | .52 | .75 | .66 | .55 | .76 |
| Static-Stable-2000 (n = 115) | .65 | .50 | .80 | .65 | .52 | .77 | .67 | .54 | .80 | .68 | .57 | .79 | .71 | .61 | .81 |
| Static-Stable-2000R (n = 115) | .70 | .56 | .84 | .67 | .54 | .79 | .71 | .58 | .84 | .68 | .56 | .79 | .70 | .60 | .80 |
| Static-Stable-2007 (n = 114) | .71 | .56 | .86 | .70 | .58 | .82 | .71 | .59 | .84 | .69 | .57 | .80 | .71 | .61 | .81 |
| Aboriginal | |||||||||||||||
| Recidivism rates | 10.3% (16 / 155) | 12.9% (20 / 155) | 24.5% (38 / 155) | 31.6% (49 / 155) | 51.6% (80 / 155) | ||||||||||
| Static-99 (n = 184) | .65 | .52 | .78 | .64 | .52 | .76 | .61 | .51 | .71 | .62 | .53 | .71 | .70 | .62 | .77 |
| Stable-2000 (n = 155) | .58 | .44 | .72 | .57 | .44 | .70 | .55 | .44 | .66 | .59 | .49 | .69 | .61 | .52 | .70 |
| Stable-2007 (n = 155) | .54 | .38 | .70 | .54 | .40 | .68 | .52 | .41 | .63 | .56 | .47 | .66 | .61 | .52 | .70 |
| Static-Stable-2000 (n = 155) | .55 | .40 | .70 | .54 | .40 | .68 | .57 | .47 | .68 | .62 | .52 | .71 | .65 | .56 | .74 |
| Static-Stable-2000R (n = 155) | .58 | .42 | .74 | .57 | .42 | .71 | .57 | .46 | .68 | .60 | .51 | .70 | .67 | .58 | .75 |
| Static-Stable-2007 (n = 155) | .61 | .45 | .77 | .59 | .45 | .73 | .58 | .47 | .69 | .62 | .52 | .71 | .68 | .60 | .76 |
| Non-Aboriginal | |||||||||||||||
| Recidivism rates | 6.6% (41 / 622) | 8.8% (55 / 622) | 11.2% (70 / 622) | 16.2% (101 / 622) | 22.8% (142 / 622) | ||||||||||
| Static-99 (n = 768) | .76 | .69 | .83 | .70 | .64 | .77 | .74 | .69 | .80 | .72 | .67 | .77 | .69 | .64 | .73 |
| Stable-2000 (n = 622) | .65 | .56 | .74 | .67 | .59 | .75 | .67 | .60 | .74 | .65 | .60 | .71 | .68 | .63 | .73 |
| Stable-2007 (n = 621) | .70 | .61 | .79 | .72 | .65 | .79 | .71 | .64 | .77 | .69 | .63 | .74 | .71 | .66 | .75 |
| Static-Stable-2000 (n = 622) | .76 | .68 | .83 | .73 | .66 | .80 | .74 | .67 | .80 | .71 | .65 | .76 | .69 | .63 | .74 |
| Static-Stable-2000R (n = 622) | .80 | .73 | .86 | .76 | .69 | .82 | .77 | .71 | .83 | .72 | .67 | .78 | .70 | .65 | .75 |
| Static-Stable-2007 (n = 621) | .80 | .73 | .86 | .76 | .70 | .83 | .77 | .71 | .83 | .72 | .67 | .78 | .70 | .65 | .76 |
| Canada | |||||||||||||||
| Recidivism rates | 7.6% (47 / 614) | 9.3% (57 / 614) | 15.1% (93 / 614) | 21.2% (130 / 614) | 26.9% (165 / 614) | ||||||||||
| Static-99 (n = 767) | .76 | .70 | .83 | .73 | .67 | .80 | .73 | .68 | .78 | .71 | .67 | .76 | .72 | .68 | .76 |
| Stable-2000 (n = 618) | .64 | .56 | .72 | .66 | .58 | .74 | .68 | .62 | .74 | .67 | .62 | .72 | .69 | .65 | .74 |
| Stable-2007 (n = 613) | .68 | .60 | .76 | .71 | .63 | .78 | .70 | .64 | .75 | .69 | .64 | .74 | .72 | .68 | .76 |
| Static-Stable-2000 (n = 614) | .73 | .66 | .80 | .72 | .65 | .79 | .72 | .66 | .77 | .71 | .66 | .76 | .71 | .66 | .76 |
| Static-Stable-2000R (n = 614) | .78 | .72 | .85 | .76 | .70 | .83 | .75 | .70 | .80 | .72 | .67 | .77 | .73 | .68 | .77 |
| Static-Stable-2007 (n = 613) | .79 | .72 | .85 | .78 | .71 | .84 | .75 | .70 | .80 | .72 | .67 | .77 | .73 | .69 | .78 |
| Alaska/Iowa | |||||||||||||||
| Recidivism rates | 5.6% (10 / 179) | 11.2% (20 / 179) | 8.9% (16 / 179) | 12.8% (23 / 179) | 37.4% (67 / 179) | ||||||||||
| Static-99 (n = 205) | .56 | .41 | .71 | .50 | .38 | .62 | .61 | .49 | .73 | .63 | .53 | .74 | .59 | .51 | .67 |
| Stable-2000 (n = 181) | .68 | .52 | .85 | .63 | .50 | .77 | .58 | .42 | .74 | .57 | .44 | .70 | .55 | .46 | .63 |
| Stable-2007 (n = 179) | .65 | .47 | .84 | .61 | .48 | .74 | .55 | .39 | .72 | .55 | .42 | .68 | .52 | .44 | .61 |
| Static-Stable-2000 (n = 179) | .62 | .45 | .80 | .57 | .44 | .71 | .63 | .50 | .77 | .63 | .52 | .74 | .60 | .51 | .68 |
| Static-Stable-2000R (n = 179) | .56 | .40 | .72 | .52 | .39 | .64 | .57 | .44 | .70 | .59 | .48 | .70 | .57 | .48 | .66 |
| Static-Stable-2007 (n = 179) | .60 | .42 | .76 | .54 | .41 | .67 | .59 | .46 | .72 | .62 | .50 | .73 | .58 | .49 | .67 |
| Conscientious | |||||||||||||||
| Recidivism rates | 6.8% (23 / 336) | 8.6% (29 / 336) | 14.3% (48 / 336) | 19.9% (67 / 336) | 25.0% (84 / 336) | ||||||||||
| Static-99 (n = 336) | .81 | .71 | .90 | .77 | .69 | .86 | .77 | .70 | .84 | .73 | .66 | .80 | .73 | .67 | .80 |
| Stable-2000 (n = 336) | .74 | .64 | .84 | .75 | .66 | .84 | .74 | .66 | .81 | .73 | .66 | .80 | .74 | .68 | .80 |
| Stable-2007 (n = 336) | .77 | .67 | .87 | .80 | .72 | .89 | .75 | .68 | .82 | .75 | .69 | .82 | .77 | .71 | .82 |
| Static-Stable-2000 (n = 336) | .81 | .72 | .90 | .78 | .69 | .87 | .78 | .71 | .85 | .76 | .70 | .83 | .75 | .69 | .81 |
| Static-Stable-2000R (n = 336) | .83 | .75 | .92 | .80 | .72 | .89 | .79 | .72 | .86 | .74 | .67 | .81 | .74 | .68 | .81 |
| Static-Stable-2007 (n = 336) | .84 | .76 | .93 | .83 | .75 | .91 | .80 | .73 | .87 | .76 | .69 | .83 | .76 | .70 | .82 |
*Exceptional cases are offenders who are developmentally delayed, or have a history of severe mental illness
Appendix 11: Distribution of acute risk factors (all assessments)
| Descriptive statistics | Frequencies n (%) | |||||||
| Score: | 0 - No | 1 – Maybe | 2 - Yes | 3 – Int. Now | ||||
| Acute risk factor | n | M | SD | Change: | +1 Better | 0 | -1 Worse | |
| Victim access | ||||||||
| Score | 7028 | .38 | .57 | 4592 (65.3) | 2210 (31.4) | 190 (2.7) | 36 (0.5) | |
| Change | 4675 | .01 | .32 | 253 (5.4) | 4205 (89.9) | 217 (4.6) | ||
| Emotional collapse | ||||||||
| Score | 7016 | .32 | .55 | 5043 (71.9) | 1714 (24.4) | 235 (3.3) | 24 (0.3) | |
| Change | 4711 | .02 | .46 | 544 (11.5) | 3702 (78.6) | 465 (9.9) | ||
| Collapse of social supports | ||||||||
| Score | 7019 | .21 | .47 | 5700 (81.2) | 1145 (16.3) | 170 (2.4) | 4 (0.1) | |
| Change | 4714 | .01 | .37 | 345 (7.3) | 4061 (86.1) | 308 (6.5) | ||
| Hostility | ||||||||
| Score | 7012 | .19 | .45 | 5842 (83.3) | 1019 (14.5) | 136 (1.9) | 15 (0.2) | |
| Change | 4688 | .01 | .34 | 297 (6.3) | 4133 (88.2) | 258 (5.5) | ||
| Substance abuse | ||||||||
| Score | 7014 | .16 | .46 | 6156 (87.8) | 641 (9.1) | 191 (2.7) | 26 (0.4) | |
| Change | 4681 | .01 | .30 | 224 (4.8) | 4264 (91.1) | 193 (4.1) | ||
| Sexual preoccupations | ||||||||
| Score | 6999 | .21 | .50 | 5822 (83.2) | 936 (13.4) | 217 (3.1) | 24 (0.3) | |
| Change | 4689 | .00 | .28 | 194 (4.1) | 4320 (92.1) | 175 (3.7) | ||
| Rejection of supervision | ||||||||
| Score | 7012 | .21 | .51 | 5809 (82.8) | 977 (13.9) | 175 (2.5) | 51 (0.7) | |
| Change | 4700 | -.01 | .37 | 308 (6.6) | 4060 (86.4) | 332 (7.1) | ||
| Other factor | ||||||||
| Score | 5301 | .15 | .44 | 4660 (87.9) | 502 (9.5) | 123 (2.3) | 16 (0.2) | |
| Change | 3197 | -.01 | .30 | 124 (3.9) | 2914 (91.1) | 159 (5.0) | ||
Appendix 12: ACUTE-2007 Tally Sheet
Subject Name: ____________________________________________
Place of Scoring: __________________________________________
Date of Scoring: ____________ Name of Assessor: ___________
| Sex/Violence Score (Sum four factors) | Score | General Recidivism Score (Sum all seven factors) | Scoring |
|---|---|---|---|
|
-> -> -> Copy these scores over -> -> -> |
||
|
-> -> -> Copy these scores over -> -> -> | ||
|
-> -> -> Copy these scores over -> -> -> | ||
|
-> -> -> Copy these scores over -> -> -> | ||
|
|||
|
|||
|
|||
| Sex/Violence Total (Sum of four factors) | General Recidivism Risk Total (Sum of all seven factors) | ||
| Sex/Violence Nominal Categories (Sum of four risk factors) | General Recidivism Risk Nominal Categories (Sum of all seven risk factors) | |||
|---|---|---|---|---|
| Low Priority | 0 | Low Priority | 0 | |
| Moderate Priority | 1 | Moderate Priority | 1 - 2 | |
| High Priority | 2+ (plus) | High Priority | 3+ (plus) | |
Appendix 13: Rules for combining static, stable and acute risk factors
| Static/Stable-2007 priority category | Acute score | Current priority |
|---|---|---|
| Low | Low | Low |
| Moderate | Low | |
| High | Moderate | |
| Moderate-low or Moderate-high | Low | Low |
| Moderate | Moderate | |
| High | High | |
| High or very high | Low | Moderate |
| Moderate | High | |
| High | High | |
Note: Sexual and violence priority calculated using sex/violence factors.
General priority calculated using all acute factors.
Acute priority categories:
Sex/violence factors: Low (0), Moderate (1), High (2 or more).
All acute factors: Low (0), Moderate (1-2), High (3 or more).
Appendix 14: Relative risk for recidivism within 45 days based on combined Static-99, Stable-2007 and acute scores
| Low | Moderate | High | ||||
|---|---|---|---|---|---|---|
| Risk ratio | n (recid /total) | Risk ratio | n (recid/total) | Risk ratio | n (recid/total) | |
| Sexual crimes | 1.0 | 2/347 | 2.4 | 2/146 | 14.9 | 13/151 |
| Any sexual | 1.0 | 7/333 | 2.3 | 7/145 | 4.6 | 15/156 |
| Violent or sexual | 1.0 | 7/331 | 1.8 | 5/130 | 7.0 | 22/149 |
| Any crime | 1.0 | 10/271 | 1.9 | 11/158 | 4.5 | 26/158 |
| Any (including breaches) | 1.0 | 23/275 | 1.6 | 20/149 | 4.3 | 48/134 |
Note: Sexual and violent recidivism priority calculated using sex/violence factors. Any crime and any recidivism risk calculated using all acute factors.
Footnotes
- 1
The reviewers were R. K. Hanson, Andrew J. R. Harris, Randy Cole, Lisa Ginter, Uwe Jansen, Randel Fletcher, and Carla Ground.
- 2
This change resulted from the feedback received from an expert panel reviewing the revisions to the measures.
- 3
For one offender, there was only the second assessment; the first assessment went missing due to an officer changing jobs.
- 4
Although not shown in Table 6, the 45 days averages showed essentially the same results as the 90 days averages.
- Date modified: