Annual National Data Report to Inform Trends and Patterns in Drug-Impaired Driving
Erratum
Date: March 10, 2021
Location: Figure 3 and accompanying text.
Revision: The decrease in the proportion of THC positive total fatal collisions between 2017 and 2018 was 7% rather that 14%
Rationale for the revision: Nova Scotia pointed out to Public Safety Canada that there was a mistake in the data and accompanying figure.
 Annual National Data Report to Inform Trends and Patterns in Drug-Impaired Driving - PDF Version (975 KB)
 December 2020
Executive Summary
In the context of cannabis legalization, the Government of Canada introduced legislation to create new offences and provide additional tools to law enforcement to detect and deter drug-impaired driving (DID). Furthermore, to support the implementation of this new legislative framework, the Government invested $161M over five years to enhance training of frontline law enforcement officers in how to recognize the signs and symptoms of drug-impaired driving, build law enforcement capacity across the country, provide access to approved drug screening equipment (ADSE), develop policy, bolster research, and raise public awareness about the dangers of drug-impaired driving. An important part of this initiative is to inform Canadians on activities undertaken to address DID and their results. It is the purpose of this first annual report.
The report brings together available data on: (1) trends and patterns in DID measured through self-reported behavior among Canadians (National Cannabis Survey; Canadian Cannabis Survey), roadside surveys conducted in five jurisdictions prior to cannabis legalization, police-reported data (Statistics Canadas’ Uniform Crime Report, 2019), and coroners’ data from fatally injured drivers; (2) prevention measures (e.g., national and regional public awareness campaigns); (3) law enforcement capacity building (e.g., training of frontline officers); (4) criminal justice system interventions (e.g., charges laid or recommended by police); and (5) outcomes (e.g., convictions, penalties).
The report’s findings show that the federal initiative has significantly contributed to increasing law enforcement capacity since 2018. The initiative also appears to have positively changed Canadians’ attitudes towards driving after cannabis use. Furthermore, data from police-reported incidents as well as toxicological analyses from coroners and medical examiners indicate that the number of incidents involving drivers with drugs in their system has been constantly increasing since 2008 as a proportion of all impaired driving incidents. However, available data do not to allow to establish the role of cannabis.
The report also notes that there remain a number of outstanding data gaps (e.g., lack of law enforcement or toxicology data) as well as issues with the completeness and comparability of data. Work will continue in 2020 to address these data gaps.
Introduction
In spite of significant and continued declines over the past 30 years, impaired driving, whether by alcohol or drugs, continues to kill or injure more Canadians than any other crime (Perreault, 2016). It also remains the single most important factor contributing to serious road crashes (CCSUA, 2019). Furthermore, recent statistics show that the number of police reported drug-impaired driving (DID) incidents have increased by 43 percent from 2018 to 2019 (Statistics Canada, UCR data, 2019).
It is no surprise then that with the legalization of cannabis, Canadians expressed concerns over road safety. Public opinion surveys showed that well over 80 percent of Canadians believed that drug-impaired driving would likely increase as a result of cannabis legalizationFootnote 1. This is why new Criminal Code provisions were enacted in 2018 to criminalize driving with prohibited levels of certain drugs, strengthen penalties and provide additional tools and means to law enforcement to detect and deter impaired driving, including DID. Furthermore, in September 2017, the federal government announced $161 million for training frontline officers in how to recognize the signs and symptoms of drug-impaired driving, building law enforcement capacity across the country, providing access to approved drug screening equipment (ADSE), developing policy, bolstering research, and raising public awareness about the dangers of drug-impaired driving.
Part of this initiative included a commitment to report to Canadians on activities undertaken to address the issue of DID and their results; it is the purpose of this report.
The report focuses on three broad questions:
- What can we say about trends and patterns in DID?
- What is being done to address DID?
- What are the results of these actions?
This report is the result of a collective effort undertaken in 2018 by the Federal/Provincial and Territorial (FPT) working group (WG) on DID. Comprised of representatives from all jurisdictions, as well as key stakeholders from the Department of Justice Canada, the Royal Canadian Mounted Police (RCMP) and the Canada Border Services Agency (CBSA), the WG set out to work on identifying a series of indicators to help address these questions. The WG also engaged with key expert organizations such as Statistics Canada (STC) and the Canadian Centre on Substance Use and Addictions (CCSUA) as well as, selected academics, to assess the relevance, reliability, availability and accessibility of data for these various indicators. In conducting this analysis, the WG benefitted in particular from a comprehensive exercise undertaken by the CCSUA to identify a set of national indicators on DID. The WG agreed on a preliminary set of indicators in spring 2019, which was further refined in September 2019. Subsequently, jurisdictions were asked to collect, collate and report data on as many of these indicators as possible for calendar years 2018 and 2019. Jurisdictions were asked to provide their reports to Public Safety Canada in early winter 2020.
This report synthesizes the data provided by jurisdictions in their annual reports, as well as data from the RCMP and the CBSA. Data from reports and research studies from other sources (e.g., STC; CCSUA) is also used.
The first section of this report, sets the context by describing the new legislative regime on DID and the accompanying federal initiative. The following section presents available data on trends and patterns in DID. The final two sections present data on what is being done to address DID and results achieved. The conclusion summarizes the key findings and discusses next steps.
Given that implementation of the new legislative regime only started in late 2018, and that developing and implementing data collection tools take time, it is important to stress that this first national report is based on available information. Public Safety Canada continues to work with its provincial, territorial, and law enforcement partners to address key outstanding data gaps in order to improve future reports.
The Legislative and Programmatic Context
Driving while impaired by a drug has been a criminal offence since 1925, but this offence has always been challenging to prove.
Detecting and proving impairment caused by drugs is different and more complex than detecting and proving impairment caused by alcohol. Alcohol is a simple molecule with predictable impairing effects. As alcohol is consumed, blood alcohol concentration (BAC) rises; and the higher the BAC, the more profound the impairment and the greater the risk of a serious road crash. The same correlation does not always exist for other drugs since their impairing effects and impacts on driving behavior may vary depending on the substance, method of ingestion, and characteristics of the person and its consumption habits. In the case of cannabis, it is generally agreed that it can impair ability to drive. However, there is no scientific consensus on the relationship between the concentration of THC, its main psychoactive substance, in blood and the degree of impairment.Footnote 2
In 2008, new tools were authorized to facilitate the investigation of drug-impaired driving. These include the Standardized Field Sobriety Tests (SFST) used at the roadside (a three-pronged test consisting of walk and turn, one leg stand and horizontal gaze nystagmus) and the Drug Recognition Evaluation conducted at the police station by a certified drug recognition expert (DRE), a 12–step evaluation which is designed to determine if the individual is under the influence of an impairing drug. In order to use either of these tools, the officer has to be specially trained in accordance with standards developed by the International Association of Chiefs of Police (IACP).
Nevertheless, in the context of cannabis legalization, it was determined that more needed to be done to strengthen the criminal law regime with respect to drug-impaired driving. This was done as part of An Act to amend the Criminal Code (offences relating to conveyances) and to make consequential amendments to other Acts, which enacted new offences, and authorized new tools to enhance the detection and prosecution of drug-impaired drivers.
Specifically, the new measures:
- Authorize the police to use “approved drug screening equipment” (e.g., oral fluid drug screeners) at the roadside;
- Enact three new offences of having a prohibited blood drug concentration (BDC) within two hours of driving;
- Facilitate the ability of a police officer to demand a blood sample from a driver; and
- Permit a DRE to testify without requiring them to be qualified as an expert in every case, consistent with the 2017 Supreme Court of Canada decision in R v Bingley.
With the addition of the new offences, the text of the Criminal Code impaired driving offences currently reads as follows:
320.14 (1) Everyone commits an offence who
(a) operates a conveyance while the person’s ability to operate it is impaired to any degree by alcohol or a drug or by a combination of alcohol and a drug;
(b) subject to subsection (5), has, within two hours after ceasing to operate a conveyance, a blood alcohol concentration that is equal to or exceeds 80 mg of alcohol in 100 mL of blood;
(c) subject to subsection (6), has, within two hours after ceasing to operate a conveyance, a blood drug concentration that is equal to or exceeds the blood drug concentration for the drug that is prescribed by regulation; or
(d) subject to subsection (7), has, within two hours after ceasing to operate a conveyance, a blood alcohol concentration and a blood drug concentration that is equal to or exceeds the blood alcohol concentration and the blood drug concentration for the drug that are prescribed by regulation for instances where alcohol and that drug are combined.
320.14 (4) Subject to subsection (6), everyone commits an offence who has, within two hours after ceasing to operate a conveyance, a blood drug concentration that is equal to or exceeds the blood drug concentration for the drug that is prescribed by regulation and that is less than the concentration prescribed for the purposes of paragraph (1)(c).
The prohibited BDC levels are not found in the Criminal Code, but instead, are set by regulation.Footnote 3 For paragraph 320.14(c), the prohibited BDC levels are 5 ng or more of THC/ml of blood, 5 mg GHB per L of blood, and any detectable level of LSD, 6- 6-Monoacetylmorphine (a metabolite of heroin), Ketamine, Phencyclidine (PSP), Cocaine, Psilocybin. Psilocin and Methamphetamine in blood. For paragraph 320.14(d), the prohibited levels are blood alcohol concentration of 50 mg of alcohol per 100 Ml of blood in combination with 2.5 ng of THC per mL of blood. Finally, for subsection 320.14(4), the prohibited blood drug concentration (BDC) level is between 2 ng and 5 ng THC/ml of blood.
It is interesting to know that after THC and alcohol, cocaine and methamphetamine are the most commonly detected drugs in Canadian drivers.
As noted, the Government authorized the use of oral fluid drug screeners at the roadside.
Oral fluid drug screeners can be used by police to detect the presence of some drugs in oral fluid, including THC. The police can demand an oral fluid sample, if they reasonably suspect a drug is in a driver's body. Reasonable suspicion that the driver has drugs in their body can be developed based on objective facts, such as:
- red eyes
- muscle tremors
- agitation
- abnormal speech patterns
If a driver tests positive on an oral fluid drug screener the positive result confirms the presence of the drug and, combined with other signs of impairment or drug use observed by the police at the roadside,
may provide grounds for the investigation to proceed further by making a demand for a blood sample. Similar screeners are used in other countries including the UK and Australia.
Currently, there are two approved oral fluid drug screening devices available for use by law enforcement in Canada: the Dräger DrugTest® 5000 and a Dräger DrugTest® 5000 STK-CA, when used together, and SoToxa™, an Abbott SoToxa™ Test Cartridge and an Abbott SoToxa™ Oral Fluid Collection Device. They will be referred to as the Dräger and SoToxa approved drug screening equipment (ADSE) in the remainder of this report.
The Federal Initiative
In September 2017, the Government of Canada announced that it was investing $161 million over five years to support the implementation of the new legislative regime on DID and build law enforcement capacity across Canada to recognize the signs and symptoms of DID, provide access to ADSE, develop policy, bolster research, and raise public awareness about the dangers of DID.
Of this funding envelope, $81 million was set aside specifically for Provinces and Territories (PTs) to ensure that they would be able to provide police officers with the training and tools they need. In particular, this funding was designed to enhance training on the Standard Field Sobriety Test (SFST) and the Drug Recognition Expert (DRE) program; support the acquisition of ADSE; and collect standardized national data on DID trends and patterns.
At the time when the federal initiative was launched, there were approximately 13,000 SFST trained law enforcement officers and close to 600 DREs across the country. The initiative’s objective is that by 2023, 33% of front-line law enforcement officers will have been trained in SFST, and 250 DREs will have been added. Currently available statistics indicate that there are now over 14,400 SFST trained officers and almost 1200 DREs. Public Safety Canada continues to work with PTs to help meet their training and capacity needs; over $16 million in funding was available in FY 2019-2020.
A significant part of this initiative, in the context of cannabis legalization, is to monitor trends and patterns in DID. As such, Public Safety Canada (PS) is expected to:
- Produce annual reports on the scope and trends in DID, law enforcement capacity and action, impacts on public safety, successes and challenges, and impacts of cannabis legalization on road safety;
- Conduct research, including on the impairing effects of smoked and edible cannabis;
- Lead a horizontal evaluation of the initiative; and
- Contribute data on DID for the mandatory three-year review of the new impaired driving legislation led by Justice Canada.
As noted earlier, a FPT DID working group (DID WG) comprised of data analysts hired by PTs with the contribution program funding, PS representatives, and key stakeholders (e.g., RCMP, CBSA, Justice) has been created. The DID WG has met a number of times in 2019 to develop a common framework for the annual report on DID, and share information on current data collection practices, gaps and challenges.
Provincial and Territorial Initiatives
All provinces and territories modified their existing legislation, including on drug-impaired driving, in accordance with the new federal cannabis and drug-impaired driving regime. Most jurisdictions have adopted some form of zero tolerance policy for some categories of drivers: young, novice and commercial motor vehicle drivers. Sanctions are generally graduated and can include administrative license suspensions (e.g. immediate, 30, 45, or 60 days), fines, ignition interlock requirements, and vehicle impoundment. The Canadian Centre on Substance Use and Addiction (CCSUA) has prepared an overview of administrative sanctions in provinces and territories which can be consulted online.
Trends and Patterns In Drug-Impaired Driving
There are various ways of measuring DID occurrences and incidents: population surveys asking a sample of Canadians to report on their driving behaviour after drug use; roadside surveys collecting oral fluid samples from a sample of voluntary drivers generally at night time and during summer months; police reported incidents; and toxicological analyses of fatally injured drivers by coroners and medical examiners.
No single source is sufficient on its own and each has its limitations. Self-reported behaviour is hampered by accuracy and/or unwillingness to disclose behaviour. Roadside surveys’ limitations include: the drug detection method (oral fluid) only indicates presence or absence of drugs; they are conducted in a small number of locations and at very specific and limited points in time; and they only involve voluntary drivers. Police-reported incidents only include incidents detected by or which come to the attention of law enforcement and may significantly under-estimate the true prevalence of impaired driving. Finally, coroners’ toxicological data are limited by factors such as the level of toxicological analyses conducted (e.g., in many cases analyses will stop if alcohol is found), variable methodology between jurisdictions, and insofar as cannabis specifically, issues related to the unique characteristics of THC in blood.
The following sections present available data from each of these various sources.
Self-Reported Behaviour
Conducted by Health Canada, the Canadian Cannabis Survey measures a variety of indicators related to cannabis, including self-reported driving behaviour following cannabis use among a sample of Canadians. The latest figures show that some 26% of users with a valid driver’s license reported driving a vehicle within two hours of cannabis use.Footnote 4 Results by jurisdiction are as follows:Footnote 5
| Province and Territories | Total respondents | % of people who drove within 2 hours of smoking cannabis | How long ago did this happen? | ||
|---|---|---|---|---|---|
| Within the past 30 days | Within the past 12 months | More than 12 months ago | |||
| BC | 3,905 | 32% | 41.3% | 33.8% | 24.9% |
| AB | 3,240 | 30.5% | 43% | 34.5% | |
| SK | 869 | 34.6% | |||
| MB | 1,018 | ||||
| ON | 11,078 | 22.3% | 38.7% | 28.8% | 32.5% |
| QC | 6,745 | 26.5% | 54.9% | 26.9% | |
| NB | 628 | 24.8% | |||
| NS | 780 | 25.1% | |||
| PEI | 118 | 27.9% | |||
| NL | 440 | 27.3% | |||
| Territories | 85 | ||||
| Canada | 28,907 | 26.4% | 43.5% | 31.3% | 25.2% |
Some provinces have conducted their own surveys of self-reported behaviour.
- In British Columbia, a survey conducted in 2018 showed that 43% of those who use cannabis reported driving within two hours of cannabis use. Those who do not use cannabis were more likely than cannabis users (87% vs 60%) to think that cannabis impairs driving abilities.
- In Ontario, the Centre on Addictions and Mental Health (CAMH) conducts a bi-annual survey of students’ drug use and related behaviour. In 2019, the percentage of drivers in grades 10-12 reporting driving after using cannabis at least once in the past year was 7% compared to 9% in 2017. It should be noted that driving after cannabis use is reported as being more frequent among this population than driving after drinking (about 4%). Nevertheless, the proportion is much lower than in the 2000s, when it was between 16%-20%.
- In Québec, the Enquête québécoise sur le cannabis 2019 conducted on a sample of over 10,000 respondents found that 16.8% of past-year cannabis users aged 15 years and over had declared conducting a motor vehicle within two hours of use. This compares to 23.8% in 2018, possibly indicating that some public education and awareness messages have been effective. This reduction is found among men and women as well as in terms of the frequency of driving behavior after use (1, 2 or 3 or more times). Driving after cannabis use is strongly associated with type of user, with daily users being significantly more likely to have driven a vehicle at least three times or more within two hours of use (42%) than regular users (18.6%), occasional users (4.7%) or those who have used less than one day per month (0.2%).
- In the Northwest Territories, a survey of drivers conducted as part of a roadside survey found that of the 21% of drivers who indicated cannabis use in the past 12 months, 29 % believed that cannabis impaired their ability to drive and 31% indicated that they had driven a vehicle within two hours of consuming cannabis.
Roadside Surveys
No province or territory conducted a roadside survey in 2019. However, surveys were conducted in five jurisdictions in 2018, prior to cannabis legalization, providing a baseline against which to measure post-legalization change. These include: Manitoba (2016), Ontario (2017), British Columbia (2018), Yukon (2018) and Northwest Territories (2018). The Canadian Council of Motor Vehicle Administrators (CCMTA) has produced a synthesis of these surveys’ findings.Footnote 6
Of the total 7,265 drivers randomly selected, 80.7% accepted to participate, 97.7% provided a breath sample to detect alcohol and 90.2% an oral fluid sample to detect the presence of drugs.
Key findings include:
- 10.2% of drivers tested positive for drugs (compared to 4.4% for alcoholFootnote 7);
- 7.6% of drivers were positive for cannabis (THC);
- Overall, 12.9% of drivers were positive for alcohol, drugs or both;
- Drug use was most prevalent among drivers aged 20 to 24 (14.0%) and decreased with increasing age;
- Only 2.1% of drivers aged 16 to 19 tested positive for alcohol; however, 10.4% of this age group tested positive for cannabis;
- Alcohol use was most common on Friday and Saturday nights (4.6% and 6.2%, respectively); cannabis use did not differ across survey nights, varying between 6.9% and 9.0%.
Compared to data from previous surveys, there has been a significant reduction in the prevalence of alcohol use among drivers, but a significant increase in the prevalence of drug use, cannabis in particular. Similar to other types of prevalence data, roadside surveys show that male drivers are more likely than female drivers (12% and 7.4% respectively) to test positive for drugs.
“Most interestingly, over half (57.4%) of THC-positive drivers had a THC concentration sufficient to have triggered a positive result on ADSE – i.e., at least 25 ng/ml. In an enforcement setting, a positive ADSE result could lead to further investigation such as a demand to participate in a Standardized Field Sobriety Test (SFST), evaluation by a Drug Recognition Expert, and/or a blood test. Extremely high oral fluid THC concentrations are often indicative of very recent use, possibly just prior to – or during -- driving.” (CCMTA, 2019: 14)
Figure 1 - Distribution of THC concentration (ng/ml) among participating drivers in roadside surveys
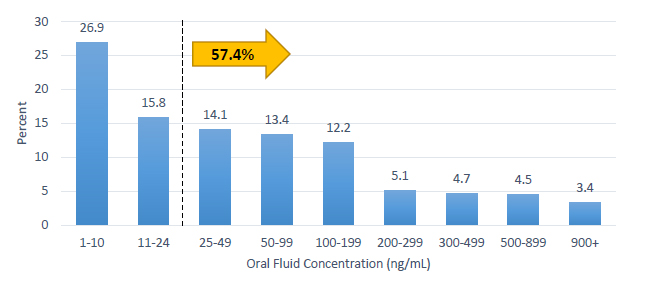
Image description
This bar graph shows that over half (57.4%) of the participating drivers in roadside surveys were THC-positive drivers who had a THC concentration sufficient to have triggered a positive result on ADSE – i.e., at least 25 ng/ml
The most recent survey in BC was conducted in spring 2018.Footnote 8 It used a similar methodology to the 2008, 2010 and 2012 surveys, thus facilitating comparisons over time. It also used a similar methodology to the Ontario roadside surveys so as to facilitate inter-jurisdictional comparisons.
A total of 2,510 vehicles in 5 different communities (Vancouver, Abbotsford, Prince George, Kelowna and Saanich) were randomly sampled at night time in May and June. Consenting drivers (n= 1878; 75%) provided a breath (94%) and an oral fluid sample (89%). Overall, 13.7% of drivers tested positive for alcohol, drugs, or both, whereas 4.9% tested positive for alcohol and 8.5% for drugs. Among drug-positive drivers, 70% tested positive for alcohol. Comparisons with previous surveys show that the percentage of drivers testing positive for alcohol has reduced, while those who tested positive for cannabis increased.
| Year | Alcohol (% Positive)* | Cannabis (% Positive) |
|---|---|---|
| 1995 | 18.7 | -- |
| 1998 | 13.8 | -- |
| 2003 | 12.3 | -- |
| 2006 | 11.7 | -- |
| 2008 | 7.8 | 4.6 |
| 2010 | 10.7 | 4.5 |
| 2012 | 5.8 | 3.7 |
| 2018 | 4.0 | 5.3 |
In 2016, Manitoba Public Insurance commissioned the Manitoba Drug and Alcohol Roadside Survey. The survey was conducted in September 2016 in five communities (Winnipeg, Brandon, Steinbach, Portage La Prairie, and Thompson). Of the 1,706 drivers, 72% (n=1,230) agreed to participate. The survey found that less than 1% showed positive results for alcohol, while 10% tested positive for drugs (n= 124). Of those who tested positive for drugs, 53% were for cannabis, 31% for cocaine, and 12% for opioids. The survey captured any level of drug detected, therefore only indicating presence of a drug and did not speak to driver impairment. Discussions on a post-legalization survey have occurred between Manitoba Public Insurance and police agencies, however a formal plan has not been developed to date.
Ontario’s most recent roadside survey was conducted in October 2017. Data were collected in 11 communities in five regions of the province, using a similar methodology as the previous 2014 survey to facilitate comparison. Similar to the 2014 survey and to BC’s survey, it collected breath and oral fluid samples. Among the 2,252 vehicles selected in the 11 survey sites, 2,022 (89.8%) agreed to participate; close to 93% agreed to provide a breath sample, and almost 86% an oral fluid sample. Among the participants, 10.5% tested positive for drugs; 82% of those who tested positive for drugs tested positive for cannabis. This compares to 4.4% who had been drinking (0.8% had a BAC over 80mg/dl). Males were twice as likely as females to test positive for drugs, and interestingly, 10.3% of the 16-18-year-olds tested positive for drugs, and none for alcohol. Drivers 19-24 years of age accounted for 32.6% of those who tested positive for drugs. The proportion of drug positive drivers was generally similar to the 2014 survey, except in Northern communities where it had increased significantly.
In Yukon, a roadside survey was conducted in Whitehorse in 2018. Of the 463 vehicles selected, 392 (84.7%) agreed to participate in the survey, with 362 providing a breath sample, and 336 an oral fluid sample. Overall, 22% tested positive for some type of substance: 5.1% for alcohol (0.4% had a BAC over 80 mg/dl), and 17.8% testing positive for drugs, 77% of which were positive attributed to cannabis. Males and those in the 20-24 age category were more likely to test positive for drugs.
The Northwest Territories conducted a roadside survey in fall 2018. The survey location was in Yellowknife and included 334 selected vehicles, with 313 accepting to participate. 18% of drivers who provided a sample of breath or oral fluid tested positive for some form of alcohol, drug or a mixture; and 13% of those who provided an oral fluid sample (n= 296) tested positive for a psychoactive substance, 70% of whom for THC and 49% for stimulants.
All these jurisdictions, as well as Quebec, have indicated that they are considering conducting roadside surveys post-legalization.
Police-Reported Incidents
Law enforcement officers typically come in contact with impaired drivers through a lawful traffic stop. Officers are also called to the scene of a traffic collision and conduct roadside checks randomly at various times during the year (e.g., Christmas and New Year). In coming into contact with a driver suspected of having alcohol or drugs in their body, police officers may do a number of things: demand a breath sample, conduct a standardized field sobriety test (SFST), or collect a sample of oral fluid using ADSE. If the officer has reasonable grounds to believe that the operator of the vehicle has committed an offence, the person can be immediately arrested and required to provide a blood sample or submit to a DRE, or imposed an administrative penalty (e.g. fine or license suspension) under the relevant provincial/territorial legislation.
Various data may be collected at each of these stages, but whether and how it is collected varies significantly both between jurisdictions and type of tool used. Data on police-reported reported incidents are collected systematically and reported annually through Statistics Canada’s Uniform Crime Reporting Survey. Similarly, data is systematically collected when a DRE or blood analyses are conducted. However, data is not systematically collected when SFST is conducted or when ADSE is used.
In addition to being limited to incidents that come to their attention, police data on drug-impaired driving incidents under-represent their occurrence for a variety of reasons. In particular, whenever the presence of alcohol is established, officers will typically pursue the alcohol-related charge and will not further investigate for the presence of drugsFootnote 9. Other factors that may explain under-detection and under-reporting may be related to an insufficient number or availability of SFST or DRE trained officers, or the fact that information may be lost since it is mostly manually entered.
Available data tend to indicate that the proportion of drug-impaired driving incidents reported by police has significantly increased relative to alcohol-impaired driving incidents over time. This is likely due to a combination of factors including a significant increase in law enforcement awareness raising and training on how to detect and investigate DID, while at the same time a number of jurisdictions have been strengthening their administrative sanctions regime (e.g., BC’s immediate roadside prohibition policy) and using it more frequently than the criminal law route.
Figure 2 – Trends in police reported impaired driving incidents in Canada (total, alcohol and drugs)Footnote 10
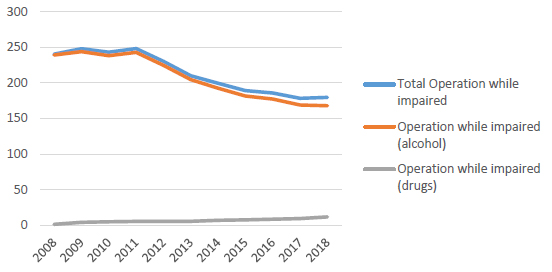
Image description
The graph illustrates that the proportion of drug-impaired driving incidents reported by police has significantly increased over time relative to alcohol-impaired driving incidents, while the total number of impaired driving incidents and alcohol impaired driving incidents was significantly decreasing. all incidents of impaired driving over that same period.
Statistics Canada’s report focusing specifically on impaired driving (Perreault, 2016) had shown that impaired-driving incidents reported by police in 2015 (210 per 100,000 population) were at their lowest level since 1986 (577 per 100,000 population) when the data was first collected, corresponding to a 65% decline. The number of incidents causing death (n= 122) or bodily harm (n=596) was also lower in 2015 than in 2014 (130 and 605 respectively). Conversely, drug-impaired driving incidents reported by police over the same period have increased. In 2009, the first full-year when drug-impaired driving incidents were reported on their own, there were 1,455 such incidents, representing 2% of all impaired driving incidents. Their number had almost doubled to 2,786 by 2015, representing 4% of all impaired driving incidents, and in 2019 they now represent 8% of all impaired driving incidents. In 2019 there were 6,453 incidents of driving while impaired by drugs, an increase of 43% from 2018. It should be noted that the rate of overall impaired driving incidents (alcohol, drugs, and combination) has increased by 19% from 2018, and that alcohol-related incidents represent 85% of all reported incidents.
Among provinces, Ontario and Quebec had the lowest rates of all impaired driving incidents, and Saskatchewan and Alberta the highest. For drug-impaired driving incidents, the Atlantic provinces reported the highest rates among provinces, Ontario, BC and Quebec the lowest. It is also interesting to note that the proportion of impaired driving cases cleared by charge has declined from 89% in 1998 to 71% in 2015. Drug-impaired driving incidents are even less likely to be cleared by charge: 59% in 2015 compared 71% of alcohol-impaired driving incidents.
Coroners’ Toxicological Data
Coroners and medical examiners report data from toxicological analyses of different body specimens (e.g., blood, urine, hair, etc.) in fatally injured drivers. However, similar to police investigations, many coroners will not conduct further analyses if alcohol is present and can clearly be established as a probable cause of death. Furthermore, if the cause of death is obvious, many will not conduct toxicological analyses; this decision is, in part, related to the time and costs of conducting such analyses. Furthermore, methods may vary between jurisdictions, making it difficult to compare data.
A study conducted by researchers from the Traffic Injuries Research Foundation in 2017 (Robertson et.al. 2017) found a 16.9% increase in the percentage of fatally injured drivers testing positive for drugs between 2000 and 2012 (from 33.56% to 39.24%). Cocaine-positive fatally injured drivers increased from 3.6% in 2000 to 6.2% in 2012. Similarly, cannabis-positive fatally injured drivers increased from 12.8% in 2000 to 19.7% in 2012. Note however that changes in the ways drugs are measured may in part explain these findings.
| Fatalities | Injuries | No injury reported | Total | |
|---|---|---|---|---|
| Bicyclists | 71 | 1 | 2 | 74 |
| Drivers | 259 | 494 | 491 | 1,244 |
| Impaired Drivers | 2,082 | 773 | 374 | 3,229 |
| Motorcyclists | 42 | 19 | 4 | 65 |
| Impaired motorcyclists | 251 | 22 | 6 | 279 |
| Motor Vehicle Passengers | 1,055 | 1,874 | 381 | 3,310 |
| Pedestrians | 207 | 30 | 38 | 275 |
| Unknown | 206 | 64 | 397 | 667 |
| Total | 4,173 | 3,277 | 1,693 | 9,143 |
| Fatalities | Injuries | No injury reported | Total | |
|---|---|---|---|---|
| Bicyclists | 18 | 1 | 0 | 19 |
| Drivers | 55 | 227 | 252 | 534 |
| Impaired Drivers | 504 | 83 | 34 | 621 |
| Motorcyclists | 5 | 10 | 10 | 25 |
| Impaired motorcyclists | 110 | 6 | 0 | 116 |
| Motor Vehicle Passengers | 137 | 349 | 111 | 597 |
| Pedestrians | 14 | 6 | 7 | 27 |
| Unknown | 15 | 7 | 53 | 75 |
| Total | 858 | 689 | 467 | 2,014 |
Toxicology data has been provided by the Saskatchewan Coroners Service for 2018 and 2019. The data is preliminary as not all death investigations had been concluded at the time of data extraction.
In 2018, 67% of the 49 driver fatalities had toxicology reports that were positive for alcohol, 22% for THC, 17% for cocaine, 6% for methamphetamine, and 47% had prescription drugs that could cause intoxication in their toxicology examination. In 2019, 39% of the 44 driver fatalities had toxicology reports that were positive for alcohol, 27% for THC, 16% for cocaine, 7% for methamphetamines, and 48% had prescription that could cause intoxication in their toxicology examination. THC alone was rarely found. Most often it was in combination with alcohol or with other substances. Males represent the vast majority of fatally injured drivers with positive toxicology reports (76% in 2018 and 88% in 2019).
While each of these fatally injured drivers did have a substance in their toxicology report that could create impairment, it is unknown if the person was impaired at the time of the accident or if the use of the substance was directly related to the motor vehicle accident. Additionally, toxicology results do not identify the quantity of substance taken; may not consider drugs that have been given to the deceased during transport to, or upon arrival at, a hospital for treatment prior to their death; or may have been taken therapeutically.
In Yukon, data related to fatally injured drivers were obtained from the Coroner Inquest records about incidents that occurred in 2017 and 2018. During this time, there were 14 deaths, four of which were not the result of motor vehicle accidents. The remaining 10 deaths all included drivers of motor vehicles and/or aircraft. Thirty per cent (three drivers) included toxicological findings where drugs were present and two of these drivers tested positive for cannabis. There were also three drivers (30%) where no toxicology was performed or no alcohol and/or drugs was present. The remaining four drivers all had toxicological results that demonstrated the presence of alcohol but no drugs.
A report from the Chief Medical Officer of HealthFootnote 11 includes comparative data from the motor vehicle collision incident reports (2011-2015), and hospitalizations and emergency room visits linked to motor vehicle collision reports. The top five contributing factors to motor vehicle crash injuries were distracted/inattentive driving, speed, road condition, weather conditions, and alcohol. The rate of drug positive drivers (17.8%) was found to be significantly higher in Yukon than in other jurisdictions but was not necessarily a significant contributing factor.
In Quebec, the Société de l’assurance automobile published in 2016 a profile of key facts and statistics on driving under the influence of alcohol and drugs. The report shows that 32% of the 172 fatally injured drivers tested showed positive results for drugsFootnote 12.
In Nova Scotia, the number of total fatal collisions, dropped by 54% between 2012 and 2017; however, the proportion of total fatal collisions that were THC positive increased nearly every year (with the exception of 2013 and 2015), until it reached its peak in 2017. There was a 7% decrease in the proportion of fatal collisions that were THC positive between 2017 and 2018. Another important observation to make from this data is that while there was a spike in total fatal collisions in 2018 (n=53), the percentage of total THC positive fatal collisions (26%) comprises a much greater proportion than seen in other years with high total fatalities. From 2010 to 2013 there was an average of 55 total fatal collisions and the average proportion of THC positive total fatal collisions was 16%.
Figure 3 - Proportion of total fatal collisions attributed to THC, by type of toxicology result and number of total fatal collisions in Nova Scotia from 2010 to 2018
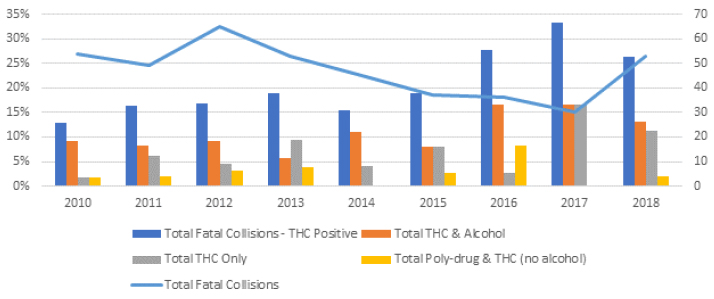
Image description
This graph illustrates that in Nova Scotia, the number of total fatal collisions, dropped by 54% between 2012 and 2017; however, the proportion of total fatal collisions that were THC positive increased nearly every year (with the exception of 2013 and 2015), until it reached its peak in 2017. There was a 7% decrease in the proportion of fatal collisions that were THC positive between 2017 and 2018.
What is Being Done to Address Drug-Impaired Driving
Similar to other crimes, DID can be addressed through a gradation of interventions including prevention, detection and deterrence. Upstream, efforts will be made to prevent its very occurrence, in particular through awareness raising and education which can be universal or targeted to specific at-risk groups of the population. Detection will be done through traditional policing methods including road checks and the use of tools such as ADSE and SFST. When impaired driving behaviour is detected, additional investigation may be conducted through requesting a DRE and/or blood samples. If the officer has reasonable grounds to believe that the driver is impaired, criminal charges can be laid and/or administrative sanctions imposed, in order to deter future similar behaviour, either of a specific individual or of the larger community (general deterrence). This section presents activities undertaken by the jurisdictions under these various approaches.
Preventative Interventions
Most jurisdictions have conducted various forms of preventative interventions both before and after cannabis legalization. These interventions included public awareness campaigns on all types of media but mostly on social media channels, as well as targeted education campaigns in high schools, directed at drivers or at cannabis users in cannabis retail stores.
- The BC government released information on the province’s retail framework in December 2017, followed by conditions of use and cultivation, as well as on its regulatory framework on drug-impaired driving in February 2018.
- Prior to cannabis legalization, Alberta developed and ran in 2018 an ‘info2know’ campaign. In November/December 2018, the province also launched a general awareness campaign against drug-impaired driving. In addition, several police services (Edmonton, Calgary, Medicine Hat) developed website pages dedicated to cannabis laws, including on drug-impaired driving.
- In Saskatchewan, the Saskatchewan Government Insurance (SGI), Students against Drinking and Driving, and MADD have developed and aired various public education and awareness campaigns. SGI has produced seven media campaigns to address concerns for impaired driving. While not all focus strictly on drug-impaired driving, they do address impaired driving. For example, Impaired Driving Laws Are Changing and Driving High is a DUI, were informational campaigns created to inform the public of drug-impaired driving laws. Impaired Driving Laws Are Changing was released in August 2018 before the legalization of cannabis. Driving High is a DUI was created to expand the understanding of what constitutes a DUI. The campaigns stressed that driving under the influence of any substance, whether legal or illegal, is against the law and will result in the same consequences as driving while under the influence of alcohol. SGI does not have an evaluation in place for their media or educational campaigns. The full campaigns can be viewed online.
- In May 2019, Manitoba Public Insurance launched an extensive “Don’t drive high!” campaign which is estimated to have reached approximately four in 10 Manitobans and almost half of Winnipeggers. Television was the most cited source of seeing the ad (83% of those who saw the ad), followed by outdoor billboards (48%). Online sources followed, which includes online while browsing, social media and YouTube (27%). In a survey of the public, the campaign was found to have performed well in terms of delivering the intended message that you should not drive when high, with 72% of Manitoban viewers agreeing the ad delivered the message. Also, 65% of viewers agreed they were convinced that it is not safe to drive while high.
- Ontario conducted awareness and education campaigns in collaboration with the Canadian Automobile Association (CAA), and with MADD Canada focusing in particular on youth and high school students.
- In Quebec the Société de l’Assurance automobile du Québec conducts an annual campaign on drug and driving since 2013. Each year’s campaign is evaluated. In 2019, two campaigns were conducted on the Web, social media, television and radio on the themes: “Cannabis is stronger than you think” and “Alcohol or Drugs while Driving: Same Consequences”
- The Government of New Brunswick maintains an on-line presence that provides links to the GOC website on impaired driving.
- A Government of Nova Scotia campaign started in July 2018 and included an adult focused cannabis-impaired driving campaign that acts on social norms and encourages people to put themselves in a potential situation with legalized cannabis and evaluate their choices. All ad executions drove people to the Government’s website
The website is fully bilingual, with all content available in French and English, and when possible, content aligns with that of other trusted sources, like Health Canada. Recent public opinion research revealed that Nova Scotians continue to consider impaired driving a major concern related to the legalization of recreational cannabis, therefore advertising for this area of focus will continue as part of the province’s 2020 “Phase 2” public education campaign for cannabis.
- Prince Edward Island produced two 15 second videos on the legalization of cannabis, and what that means to Islanders, and another two 30 second videos that covered drug-impaired driving, called, “Impaired is Impaired” and “Distracted Driving”. They can be found at the Government of Prince Edward Island’s YouTube page under Commercials and Public Service Announcements. Spots on Google and YouTube ads were purchased, as well as local radio and television. In addition, PEI benefited from the national campaigns, and purchased the post card style mail outs to every PEI address. The province collaborated with Education and Early Childhood to enhance the health curriculum concerning cannabis education.
- The Government of Newfoundland and Labrador and the Royal Canadian Constabulary offer an online presence on cannabis related issues, including on impaired driving laws and regulations.
In addition, in most jurisdictions, local and regional law enforcement organizations also conduct very targeted awareness and education campaigns at selected periods of the year such as Christmas and the New Year, and highly publicized roadside checks operations, such as the Reduced Impaired Driving Everywhere (R.I.D.E.) operations conducted by the OPP.
Public Safety Canada’s own campaign, Don’t Drive High has been very successful and was awarded international recognition. Some of the campaign metrics for 2019 include:
- Over 218 million digital ad impressions including: 103M on Facebook and Instagram, 23M on YouTube, 54M on Snapchat and Spotify, 38M in other digital tactics (Google Display, Bell Media, Mobile)
- Over 394 million Out-of-Home and Print impressions in restaurants and bars, university campuses, public transit shelters and Cineplex magazines
- 223 million impressions on TV and Cinema, Online video | Cinemas | TV Leverage video
- 913K impressions through 2018 summer festival partnerships
- 308K visits to the Don’t Drive High campaign landing page
Eighty-four percent (84%) of young Canadians aged 16-24 surveyed in May 2019 stated that they agreed with the statement “Marijuana has a negative impact on a person's ability to drive,” an increase of 12% since February 2018.
In addition to this social media campaign, PS held the third annual National Impaired Driving Prevention Week (NIDPW) from March 15-21, 2020.
Law Enforcement Capacity Building
As previously mentioned, key tools available to law enforcement include using the approved drug screening equipment (ADSE) and the SFST to detect DID, and DRE and blood draws to support the prosecution of DID offences. The federal government’s initiative to support the implementation of the new DID legislative regime by law enforcement provides the opportunity for enhanced training in SFST and DRE, increased capacity to procure ADSE, and increased funding for the RCMP laboratory to conduct toxicological analyses.
Standardized Field Sobriety Test (SFST) Training
Originally designed for the detection of alcohol-impaired driving, SFST is an observational test consisting of three key components: Walk and Turn, One Leg Stand, and Horizontal Gaze Nystagmus. While used to detect drug-impaired driving in the USA since 1981, SFST’s validity for drugs has not been firmly established thus far (Porath & Beirness, 2014). In Canada, SFST was formally authorized as a screening tool for law enforcement to detect impaired driving in 2008, and training offered on its use in all provinces and territories.
SFST training takes different forms. In some jurisdictions, it is only delivered in police colleges (e.g., Quebec), but in most cases it is delivered by a combination of colleges and local law enforcement organizations (e.g., BC, Ontario). In Quebec, training on SFST is a mandatory part of the training of all future police officers. It is part of the initial training program for police officers at the police school (7 hour course). Also, SFST training is available to the police officers on duty (course lasting 24 hours).
As part of the federal initiative to support the implementation of the new drug-impaired driving legislative regime, the national target is that 33% (or approximately 21,000) of all frontline law enforcement officers will have been trained in SFST over five years.Footnote 13 Excluding Quebec which trains 100% of its police officers in SFSTFootnote 14, there were approximately 10,500 SFST trained officers overall across the country at the end of 2019, representing almost 20% of all police officers in the country. The distribution across jurisdictions is as follows:
| Province and Territories | # of SFST officers trained in | Total # of officers trained in SFST as of 2019 | % frontline police officers trained in SFST | Average cost per officer | |
|---|---|---|---|---|---|
| 2018 | 2019 | ||||
| BC | 329 | 402 | 1,445 | 30% | |
| AB | 356 | 348 | 1,435 | 25% | |
| SK | 46 | 83 | 251 | 21% | 1,709.75 |
| MB | 98 | 101 | 455 | 25% | |
| ON | 2,124 | 1,036 | 5,332 | 35% | $1,149.71 |
| QC | 15,884 | 100% | |||
| NB | 279 | 419 | 430 | 41% | |
| NS | 350 | 106 | 609 | 90% | $750.00 |
| PEI | 38 | 344 | 108 | 50% | |
| NL | 45 | 13 | 244 | % | $131.79 |
| YT | 19 | 18 | - | - | |
| NT | 32 | 37 | - | - | $3,000.00 |
| NU | 6 | 7 | 12 | % | |
| Canada | 3,722 | 2,512 | 10,321 excl. QC 26,205 with QC |
||
The average cost of SFST training varies significantly across jurisdictions from a few hundred dollars to a few thousands. This may depend on such factors as the method of course delivery, geographical location (e.g., need to travel), course duration, etc.
Drug Recognition Expert (DRE) Training and Certification
Drug Recognition Experts (DRE) receive training on how to use the Drug Evaluation Classification (DEC) Program. The DEC is a systematic and standardized 12-step procedure used by trained officers to recognize and evaluate behaviors and physiological indicators associated with the seven different drug categories: central nervous system depressants and stimulants, inhalants, dissociative anesthetics, cannabis, hallucinogens, and narcotic analgesics. The results of the 12-steps evaluation, when corroborated by toxicological evidence of drug use, provide sufficient evidence to proceed with drug-impaired driving charges (Porath & Beirness, 2019).
The Canadian Association of Chiefs of Police recognizes the DEC Program as the sole approved training provider for drug-impaired driving for Canadian police and, since 2005, the program has been under the stewardship of the Royal Canadian Mounted Police National Traffic Services. The national DEC program is managed by the RCMP which collects yearly statistics on training, certification and re-certification of officers across Canada. Data from the RCMP national office indicate that 385 officers were trained in DRE in 2018 and 387 in 2019, bringing the national total of DRE officers to 1,321. This represents 72% of the 5-year target (n=1,824) established by the provinces and territories as part of the funding agreements under the federal initiative.
| Provinces and Territories | DREs Trained in 2018 | DREs Trained in 2019 | Active DREs as of January 1, 2020Footnote 15 |
|---|---|---|---|
| BC | 55 | 63 | 186 |
| AB | 53 (13.77%) | 76 (19.64%) | 172 (14.38%) |
| SK | 17 (4.42%) | 32 (9.27%) | 80 (8.02%) |
| MB | 9 (2.34%) | 12 (3.1%) | 43 (4.69%) |
| ON | 123 (31.95%) | 127 (32.82%) | 395 (31.95%) |
| QC | 56 (14.55%) | 34 (8.79%) | 160 (10.6%) |
| NB | 23 (5.97%) | 11 (2.84%) | 51 (3.86%) |
| NS | 31 (8.05%) | 15 (3.88%) | 78(6.96%) |
| PEI | 7 (1.82%) | 1 (0.26%) | 12 (1.21%) |
| NL | 9 (2.34%) | 14 (3.62%) | 41 (3.03%) |
| YT | 0 | 1 (0.26%) | 2 (0.15%) |
| NT | 2 (0.52%) | 1 (0.26%) | 4 (0.30%) |
| NU | 0 | 0 | 0 (0.08%) |
| Canada | 385 | 387 | 1,221 (72%) |
The Royal Canadian Mounted Police (RCMP) has rolled-out a national master “train-the-trainer” curriculum on the approved drug screeners for police services across the country.
Seven provinces have purchased and deployed ADSE as follows:
| Provinces and Territories | 2018 | 2019 | Total |
|---|---|---|---|
| BC | 16 | 16 | |
| AB | 6 | 6 | |
| SK | 30 | 30 | |
| MB | 20 | 0 | 20 |
| ON | 154 | 1 | 155 |
| NS | 5 | 0 | 5Footnote 16 |
| PEI | 3 | 3 |
Law Enforcement Interventions
Collecting data on law enforcement interventions to address DID has been challenging for all jurisdictions for a variety of reasons. To begin with, this was a new requirement in most instances for all law enforcement organizations across the country. As such, there was a need to work closely with provinces and territories to ascertain the feasibility and capacity to collect data on law enforcement interventions in DID cases. Started in late 2018, further to the enactment of cannabis legalization, this work continued well into 2019. Agreement was reached with all jurisdictions in December 2019 on the list of national indicators and data sources. Once agreement was reached on the list of indicators and data sources, jurisdictions needed to develop data collection tools and establish protocols with law enforcement agencies. Given that data collection takes time, and law enforcement priority responsibility is to respond to calls and conduct investigations, discussions with law enforcement agencies on appropriate and efficient ways to collect the required data are ongoing.
SFST
Historically, data has not been collected by police on the use (e.g., frequency, circumstances such as day of the week or time of day, and results) of SFST. However, some jurisdictions have started testing the implementation of a log of SFST results in 2019.
Data on the frequency of use and results of SFST by law enforcement for 2019 was reported by four provinces (Alberta, Saskatchewan, Manitoba, and Newfoundland and Labrador), with only four reporting on the proportion of positive results (ranging from 40% to 75%), and by the RCMP national database which covers all jurisdictions except Quebec and Ontario.
However, given that few law enforcement agencies across the country, and certainly not all officers within a given agency systematically collect data on the use of SFST, and that even when collected data may not always be complete or timely, this report does not present any data on the use of SFST.
DRE
The RCMP National DEC program and the Sûreté du Québec in cooperation with the École nationale de police in Quebec collect DRE data. Certified drug recognition experts complete a drug influence evaluation sheet (known as the facesheet), a narrative report, and the DRE report (the tracking form). The facesheet may contain large amounts of qualitative information, but none is systematically captured in electronic records. Furthermore, the database is still largely paper-based, and likely incomplete as DRE facesheets may only be transmitted to the data collectors once toxicology reports are completed and collected, which can take months.
| BC | AB | SK | MB | ON | QCFootnote 18 | NB | NS | PEI | NFLD | YK | NWT | NU | Total | |
|---|---|---|---|---|---|---|---|---|---|---|---|---|---|---|
| Depressants | 111 | 76 | 34 | 18 | 100 | NRFootnote 19 | 22 | 32 | 7 | 29 | 0 | 0 | 0 | 429 |
| Stimulants | 247 | 66 | 25 | 9 | 87 | NR | 15 | 15 | 5 | 15 | 0 | 0 | 0 | 484 |
| Hallucinogens | 0 | 0 | 2 | 0 | 4 | NR | 0 | 1 | 0 | 1 | 0 | 0 | 0 | 8 |
| Dissociative Anesthetics | 4 | 1 | 1 | 1 | 4 | NR | 0 | 0 | 0 | 0 | 0 | 0 | 0 | 11 |
| Narcotic Analgesics | 199 | 69 | 32 | 6 | 100 | NR | 28 | 20 | 15 | 13 | 1 | 0 | 0 | 483 |
| Cannabis | 113 | 95 | 28 | 12 | 120 | NR | 22 | 35 | 7 | 18 | 0 | 1 | 0 | 451 |
| Inhalants | 1 | 0 | 0 | 0 | 1 | NR | 0 | 0 | 0 | 0 | 1 | 0 | 0 | 3 |
| Medical | 9 | 1 | 2 | 0 | 6 | NR | 1 | 4 | 1 | 2 | 0 | 0 | 0 | 26 |
| Alcohol | 14 | 8 | 7 | 1 | 15 | NR | 4 | 9 | 0 | 7 | 0 | 0 | 0 | 65 |
| Not Impaired | 25 | 40 | 6 | 6 | 66 | NR | 16 | 16 | 6 | 9 | 1 | 0 | 0 | 191 |
| Refusal | 28 | 36 | 1 | 4 | 8 | NR | 1 | 3 | 0 | 1 | 0 | 0 | 0 | 82 |
| Total | 751 | 392 | 138 | 57 | 511 | - | 109 | 135 | 41 | 95 | 3 | 1 | 0 | 2,333 |
| BC | AB | SK | MB | ON | QC | NB | NS | PEI | NFLD | YK | NWT | NU | Total | |
|---|---|---|---|---|---|---|---|---|---|---|---|---|---|---|
| Depressants | 167 | 84 | 12 | 15 | 222 | 388 | 12 | 24 | 3 | 18 | 0 | 0 | 0 | 945 |
| Stimulants | 329 | 86 | 19 | 7 | 260 | 499 | 13 | 12 | 2 | 10 | 1 | 0 | 0 | 1,238 |
| Hallucinogens | 4 | 0 | 0 | 0 | 1 | 7 | 0 | 0 | 0 | 0 | 0 | 0 | 0 | 12 |
| Dissociative Anesthetics | 6 | 0 | 0 | 0 | 10 | 13 | 1 | 2 | 0 | 0 | 0 | 0 | 0 | 32 |
| Narcotic Analgesics | 279 | 68 | 15 | 1 | 346 | 90 | 21 | 21 | 7 | 17 | 1 | 0 | 0 | 866 |
| Cannabis | 187 | 79 | 17 | 6 | 277 | 299 | 28 | 51 | 8 | 16 | 0 | 0 | 0 | 968 |
| Inhalants | 1 | 1 | 1 | 1 | 3 | 7 | 0 | 0 | 0 | 0 | 1 | 0 | 0 | 15 |
| Medical | 8 | 4 | 3 | NR | 34 | NR | 3 | NR | 1 | 2 | 0 | 0 | 0 | 55 |
| Alcohol | 33 | 7 | 4 | 1 | 27 | NR | 1 | NR | NR | 0 | 0 | 0 | 0 | 73 |
| Not Impaired | 28 | 29 | 9 | 8 | 278 | 227 | 19 | 60 | 7 | 11 | 0 | 1 | 0 | 677 |
| Refusal | 20 | 29 | 3 | NR | 45 | 32 | 5 | 11 | NR | 0 | 0 | 0 | 0 | 145 |
| Total | 1,062 | 387 | 83 | 39 | 1,503 | 1,562 | 103 | 181 | 28 | 74 | 3 | 1 | 0 | 5,026 |
| Poly Category | 356 | 28 | 12 | NR | 433 | 247 | 21 | 23 | 6 | 17 | 1 | 0 | 0 | 1,144 |
Overall, there is no clear pattern emerging between jurisdictions, years and results. Some conducted many more DRE evaluations in 2019 than in 2018 (e.g., BC, ON), others many fewer (e.g., SK, MB) which may in fact be due to delays in returning information to the RCMP national DRE program.
ADSE
As mentioned earlier, seven jurisdictions have procured ADSE since their approval, but not all have actually used them. Data on the use of ADSE by law enforcement for 2019 was reported by six provinces (British Columbia, Alberta, Saskatchewan, Manitoba, Nova Scotia and Prince Edward Island) with only three reporting on the proportion of positive results ranging from 41% to 86%.
The Nova Scotia experience with the use of ADSE is interesting. According to the jurisdiction report, ADSE were used in 30% of DID interactions in 2019, yielding positive results for THC or cocaine in 86% of the cases (36 of 42). The use of ADSE led to further investigation in all cases (blood draw=16, DRE=9, or both=17). Furthermore, an ADSE was used as a screening tool in 83% of times when charges were recommended (n= 35).
Blood Analyses
Data on the number of times blood samples were demanded in cases involving suspected DID was provided by the RCMP where it delivers provincial or municipal police services (all but Ontario and Quebec). Table 8 below provides the number and percentage of requests by jurisdiction.
| Alcohol and Drug | Drug Only | Total | ||||
|---|---|---|---|---|---|---|
| N | % | N | % | N | % | |
| BC | 47 | 24.87% | 61 | 18.43% | 108 | 20.77% |
| AB | 53 | 28.04% | 114 | 34.44% | 167 | 32.12% |
| SK | 31 | 16.40% | 26 | 7.85% | 57 | 10.96% |
| MB | 22 | 11.64% | 54 | 16.31% | 76 | 14.62% |
| NB | 14 | 7.41% | 6 | 1.81% | 20 | 3.85% |
| NS | 9 | 4.76% | 50 | 15.11% | 59 | 11.35% |
| PE | 5 | 2.65% | 11 | 3.32% | 16 | 3.08% |
| NL | 6 | 3.17% | 9 | 2.72% | 15 | 2.88% |
| YT | 1 | 0.53% | 0 | 0.00% | 1 | 0.19% |
| NU | 1 | 0.53% | 0 | 0.00% | 1 | 0.19% |
| Total | 189 | 100.00% | 331 | 100.00% | 520 | 100.00% |
The low number of results is due to the length of time required to conduct the blood analyses. Early data indicate that it may take up to 6 months to receive results from the RCMP national toxicological laboratories.
ChargesFootnote 21
Statistics Canada’s 2016 Juristat on Impaired Driving (Perreault, 2016) had indicated that the rate of impaired driving incidents cleared by charge was generally declining: it was almost 90% in 1989, and about 71% in 2015. Data from 2018 confirm the trend with approximately 63% of impaired driving incidents cleared by charge. Furthermore, 2015 data show that fewer drug-impaired driving incidents led to criminal charges (59%) than alcohol-impaired driving incidents; the proportion was 57% in 2018. This may be due in part to increased use of administrative sanctions as opposed to criminal charges, as well as the challenges associated with investigating and prosecuting a drug-impaired driving offence, as previously discussed.
Given that the legislation was only adopted in the later part of 2018 and that bringing charges to prosecution is a timely process, the data presented below may not reflect the true extent of the DID charges. Data provided by jurisdictions relating specifically to 2019 included the following:Footnote 22
- In BC, RCMP data (which exclude municipal police forces) indicate that 2,848 impaired driving investigations led to Criminal Code charges being recommended in 2019; of those, 374 (7.6%) were specific to drug-impaired driving or drug and alcohol in combination, an increase from 267 (40%) from 2018.
- In Alberta, between June 2018 and February 2020, there were 5,112 charges of impaired driving under s.320.14(1)(a); 49 charges under s.320.14(1)(c); and 2 under section 320.14(1)(d).
- In Saskatchewan, there we 2,739 charges under 320.14(1)(a) and 11 under 320.11(1)(c) in 2019.
- Manitoba did not present criminal charges data for 2019.
- In Ontario 162 charges we laid under 320.14(1)(c) in 2019.
- In New Brunswick, 36 (56%) of the 64 reported DRE had no documented outcome, as some may still be before the courts. In the remaining cases, 13 (20%) were deemed not impaired, 4 (6%) cases were not approved for charge, 10 (16%) cases are before the court, and 1 (2%) case resulted in the imposition of a provincial administrative sanction.
- In Nova Scotia, 34 charges for drug-impaired driving (s.320.14(1)(c)) were laid in the period from December 2018 to December 2019.
- In Newfoundland & Labrador, 10 drug-impaired driving charges were laid for the first 6 months of 2019.
- In Yukon 9 impaired driving charges involving drugs and/or drugs and alcohol in combination were laid in 2019.
- In NWT, in 2019, 3 of the 44 incidents of operating while impaired by drugs, and 22 of the 80 cases involving a combination of alcohol and drugs were cleared by charge.
In 2019, in jurisdictions where it provides provincial or municipal policing, the RCMP laid 23,097 charges for impaired driving, of which 450 were for DID only, and 695 for drugs and alcohol in combination.
Convictions
Over the 5-year period examined in Statistics Canada’s 2016 Juristat on impaired driving (Perreault, 2016) drug-impaired driving cases (61%) were less likely to result in a guilty finding (whether by plea or decision) than alcohol-impaired driving incidents (81%).Footnote 23
Given the length of time required to process drug-impaired driving charges in court (estimated at 227 days in 2015; Perreault, 2016:15), few jurisdictions presented data on convictions for drug-impaired driving cases in their annual report, and they were incomplete in most cases.
In order to avoid confusion with the previous legislative regime, only jurisdictions which presented data for 2019 are listed below:
- In BC, five of the 948 impaired driving criminal charges involved operation at or above the BDC (CC s.320.14(1)(c)), and one case for operating with excessive BAC and BDC in combination (320.14(1)(d). Of the 948 cases, 33% (n=315) were concluded, with 295 resulting in a conviction. The data do not specify whether the five drug-impaired driving cases have been concluded. Furthermore, of the remaining 943 cases, some may have involved drugs under section 320.14(1)(a) but it is not possible to tell if the individual was impaired by drugs or alcohol.
- In Alberta, there were 59 convictions in 2019 under s320.14(1)(a) and 1 under 320.14(1)(c).
- In Saskatchewan, of the 2,739 charges under s.320.14(1)(a) there were 610 convictions representing a 22% conviction rate, and 3 of the 11 cases under s.320.14(1)(c) led to convictions, representing a conviction rate of 27%.
- In Nova Scotia, there were 2 convictions for having a prohibited BDC within two hours of driving, specifically (s.320.14(1)(c)).
- In Yukon, 98 of the 214 impaired driving charges were before the courts in 2019 and 68 (70%) of those resulted in a conviction; the data do not distinguish between alcohol and drug-impaired driving.
- In NWT, of the 264 charges laid where alcohol, drugs or a combination was involved (s.320.14(1)(a)), 177 were still pending at the time of providing the data and 10 led to a conviction.
Penalties and Sentences
The Juristat on impaired driving (Perreault, 2016: 19) indicates that over the 5-year period from 2010 to 2015, the sentences most often imposed for impaired driving were fines or driving prohibition, with the amount of fines for drug-impaired driving cases being slightly higher than for alcohol-impaired driving cases on average. Custodial sentences for periods of less than 31 days were imposed in 58% of the drug-impaired driving cases, compared to 51% of the alcohol-impaired driving cases.
The following jurisdictions provided data on penalties and sentences imposed under either the criminal or administrative regime:
- In BC, penalties for criminal charges related to impaired driving included a fine in 36% of the cases, a driving prohibition in 31%, probation in 7% and jail in 4% of the cases. The administrative sanctions regime for impaired driving is very well-established and widely used. It includes immediate roadside prohibitions (IRP) if a driver’s BAC is above 0.05 or fails or refuses to provide a sample; a 90-day administrative driving prohibition (ADP) if the driver is impaired by drugs or alcohol (which may be coupled with a criminal charge); and a 24-hour prohibition if the officer has reasonable grounds to believe that the person is affected by drugs and/or alcohol. A total of 17,474 IRPs and ADPs were served in 2019, although the data cannot isolate cases involving drugs.
- In Alberta, criminal sanctions imposed in 2019 under 320.12(1)(a) were as follows: 105 fines for an average amount of $1,224, 51 incarceration sentences for an average of 36 days, and 32 probation sentences; there were 2 convictions under 320.14(a)(c), one receiving a fine in the amount of $1,500 and the other a 30-day prison sentence. Alberta has four types of administrative sanctions: license suspension when the driver is above the set limits, is reasonably believed to be impaired, or fails or refuses to provide a sample; zero tolerance program in the Graduated Driver’s Licensing Program; immediate roadside suspension applicable to drivers with a BAC between 0.05 and 0.79; and a 24-hour suspension program for drivers suspected of being impaired. In 2019, there were 611 24-hour suspensions and 217 license suspensions for drug-impaired driving cases (22 and 76 respectively in cases where drugs and alcohol were combined).
- In Saskatchewan, 1467 (30%) of cases convicted under s.320.14(1)(a)(b)or(c) (n= 4905) received a fine, including 2 out of 11 specifically under s.320.14(1)(c), 241 received probation under (a)(b)or(c), of which 77 under subsection (c) specifically. There were 3,960 roadside suspensions in 2019, 76 of which specifically for drug-impaired driving. In addition to roadside suspension, these 76 drivers also received an educational component on impaired driving.
- In Ontario, the following administrative penalties were imposed in cases involving drugs: 864 90-day suspension further to a DRE; 165 short-term suspension (3, 7 or 30 days) for a failed SFST; 6 short-term suspension for novice drivers with drugs detected using ADSE; 6 short-term suspensions for drivers under age 22 with drugs detected using ADSE; and 4 three-day suspension for commercial drivers with drugs detected using ADSE.
- In Nova Scotia, the two convicted drivers under 320.14(1)(c) received a sentence of 1 year suspension and $1000 fine. DID administrative sanctions imposed from December 2018 to December 2019 included: a 90 day suspension in 51% of the cases (n=91), a 24 hour suspension in 14% of the cases (n=25), and a 7 day suspension for failing SFST in 13% of the cases (n=23).
- In Newfoundland & Labrador, of the 18 convicted drivers, a fine was imposed in 14 cases, and jail in 4 cases, and a driving prohibition in all 18 cases.
- In Yukon, in 2019, the most common sentence for alcohol impaired/drug driving convictions under s.320 of the Canadian Criminal Code was a 1 to 2 year driving prohibition and a fine of $1,000 - $2,500. This sentence (driving prohibition and fine) accounted for 47 files or approximately 70% of all alcohol impaired/drug impaired driving convictions. The remaining 21 convictions consisted of 13 conditional sentence orders that are typically paired with a driving prohibition, 6 custodial (jail) sentences, and two which resulted in probation. The average sentence length of these 21 files is as follows: 1) custodial sentences averaged 56 days; 2) conditional sentences averaged 52 days; and 3) other/probation averaged 6 months.
- In NWT, there were 298 administrative sanctions for impaired driving in 2019, including 10 for drugs or drugs and alcohol in combination; these included 5 24-hour license suspension, and the others included 30-day and 90 day suspensions. Information provided on criminal sanctions could not be used because it did not distinguish between cases under the previous and the new legislation.
Analysis and Conclusions
Overall, data presented in this report indicate that:
- In most jurisdictions across Canada, all data sources (population surveys, roadside surveys, police-reported incidents, as well as coroners’ toxicological analyses) tend to indicate an ongoing trend over the past 10-12 years of drug-impaired driving incidents increasing as a proportion of all impaired-driving incidents, with cannabis being the most frequently detected drug among drivers. The increase in the proportion of police-reported drug-impaired incidents may be related more to the availability of enhanced awareness, training and new detection and investigation capacities among law enforcement personnel than to trends in drug and cannabis use which have tended to decline over the 10-year period before legalization.
- Survey data tend to indicate that public education and awareness campaigns conducted nationally by Public Safety Canada and in provinces and territories appear to effectively change Canadians’ perceptions around driving after cannabis use, with an increasing number of respondents agreeing that cannabis use impairs driving abilities. However, cannabis users, especially daily or almost daily users, are more likely to think that it does not impair driving.
- Despite increased public awareness campaigns and new and enhanced tools for police to enforce drug-impaired driving laws, only 25% of Canadians believe that it is extremely likely that they will get caught if they drive under the influence of cannabis.
- Capacity building among law enforcement personnel is increasing, with the number of officers trained in SFST, DRE and the use of ADSE significantly increasing since 2018.
- While limited data is collected on the use of SFST by law enforcement, it appears to be increasing. Furthermore, when a DRE and/or blood sample are requested further to a failed SFST, there tends to be a high level of correlation (i.e., a failed SFST tends to be confirmed by a DRE and/or blood analysis).
- Use of DRE by law enforcement is clearly increasing in most jurisdictions, at a rate faster than the increase in the number of trained officers: use of DRE has doubled since 2018, while the number of certified DRE officers has increased by approximately 51% from 775 in 2018 to 1174 in 2019. The proportion of positive results from DREs is variable but tends to be higher for “drugs” in general than for cannabis specifically.
- Uptake of the ADSE being limited among law enforcement, it was not possible at this time to report results of ADSE use.
- There is a long-standing and continuing trend where charges are laid more frequently and lead to higher levels of convictions for alcohol than for drug-impaired driving cases.
- There also appear to be a trend where administrative penalties under provincial/territorial legislation are used more often than proceeding with criminal charges.
- Processing time for drug-impaired driving cases by police and courts tends to be significantly longer and more complex than in cases of alcohol-impaired driving.
As was mentioned earlier, data presented in this report is incomplete, and work is continuing to improve the data. Some of the key issues that will be addressed in 2020-2021 by the FPT WG include:
- Developing and implementing a data collection tool on SFST;
- Working to ensure that more law enforcement agencies within jurisdictions (e.g., municipal police forces) provide relevant and required data;
- Collecting data on charges and convictions;
- Exploring possibilities of undertaking roadside surveys in more jurisdictions in 2021.
Despite its limitations, this report provides the foundation for longer-term monitoring of the evolution in public opinions, attitudes and behaviour related to drug use and driving, law enforcement capacity and interventions, and outcomes of various actions to prevent, detect and deter driving after drug use. The next national report will build on this foundation. Over time, the data presented in these reports will constitute a solid evidence base to measure the impacts of the drug-impaired driving legislative regime and cannabis legalization on road safety.
References
- Brubacher, J.R., et. al. (2019) Cannabis use as a risk factor for causing motor vehicle crashes: a prospective study
- Conseil canadien des administrateurs en transport motorisé (2019) A Compilation of Jurisdictional Roadside Surveys Conducted prior to Cannabis Legalization. (anglais seulement) Ottawa.
- Compton, R. (2017) Marijuana-impaired driving: A report to Congress. Washington, National Highway Traffic Safety Administration.
- Perreault, S. (2016) Impaired Driving in Canada. Statistics Canada, Canadian Centre for Justice Statistics.
- Porath-Waller, A.J. et D.J. Beirness (2014) « An examination of the validity of the Standardized Field Sobriety Test in detecting drug impairment using data from the Drug Evaluation and Classification Program. » Traffic Injury Prevention, 15, 125-131.
- Porath, A.J. et D.J. Beirness (2019) « Predicting categories of drugs used by suspected drug-impaired drivers using the Drug Evaluation and Classification Program Tests. » Traffic Injury Prevention.
- Robertson, R.D. et coll. (2017) « Prevalence and Trends of Drugged Driving in Canada. » Accident Analysis and Prevention. Vol.99, partie A
- Date modified: