2018 Corrections and Conditional Release Statistical Overview
 2018 Corrections and Conditional Release Statistical Overview - PDF Version (2.24 MB)
Public Works and Government Services Canada
Cat. No.: PS1-3E-PDF
ISSN: 1713-1073
This document was produced by the Public Safety Canada Portfolio Corrections Statistics Committee which is composed of representatives of Public Safety Canada, Correctional Service Canada, Parole Board of Canada, the Office of the Correctional Investigator and the Canadian Centre for Justice Statistics (Statistics Canada).
Table of contents
- Preface
- Contributing Partners
- Section A. Context - Crime and the Criminal Justice System
- Police-reported crime rate has been decreasing since 1998
- Crime rates are higher in the west and highest in the north
- Canada’s Incarceration Rate Relative to Other Western European Countries
- The rate of adults charged has declined
- Administration of Justice Cases, Crimes Against the Person Cases and Crimes Against Property Cases Each Account for 23% of Cases in Adult Courts
- Most adult custodial sentences ordered by the court are short
- Relatively few crimes result in sentences to federal penitentiaries
- The rate of youth charged has declined over the past ten years
- The most common youth court case is theft
- The most common sentence for youth is probation
- Section B. Corrections Administration
- Expenditures on corrections
- CSC employees are concentrated in custody centres
- The cost of keeping an inmate incarcerated
- The number of Parole Board of Canada employees
- The number of employees in the Office of the Correctional Investigator
- Health care is the most common area of offender complaint received by the Office of the Correctional Investigator
- Section C. Offender Population
- Offenders under the responsibility of Correctional Service Canada
- The number of offenders in custody in a CSC facility decreased in the last four years
- The number of admissions to federal jurisdiction has decreased
- The number of women admitted from the courts to federal jurisdiction decreased
- About half of the total offender population in CSC facilities is serving a sentence of less than five years
- Admission of older offenders to federal jurisdiction is increasing
- The average age at admission is lower for Indigenous offenders than for non-Indigenous offenders
- 25% of the in-custody offender population is age 50 or over
- 56% of offenders are Caucasian
- The religious identification of the offender population is diverse
- The proportion of Indigenous offenders in custody is higher than for non-Indigenous offenders
- The majority of in-custody offenders are classified as medium security risk
- Admissions with a life or indeterminate sentence are increasing
- Offenders with life or indeterminate sentences represent 24% of the total offender population
- 69.7% of offenders are serving a sentence for a violent offence
- The number of Indigenous offenders has increased
- The total number of admissions to administrative segregation has decreased
- 76% of admissions to administrative segregation stay for less than 30 days
- The number of offender deaths while in custody
- The number of escapees has remained stable since 2013-2014
- The population of offenders in the community under supervision has increased in the past five years
- Provincial/territorial community corrections population decreased
- The number of offenders on provincial parole increased
- Section D. Conditional Release
- The percentage of offenders released from federal penitentiaries at statutory release decreased in the past five years
- The percentage of offenders released from federal penitentiaries on day and full parole increased in the past six years
- Federal day and full parole grant rates increased
- Federal day parole grant rate for Indigenous offenders increased
- The number of Elder Assisted federal parole hearings increased
- Proportion of sentence served prior to being released on parole decreased
- Indigenous offenders serve a higher proportion of their sentences before being released on parole
- Successful completion of federal day parole increased
- Successful completion of federal full parole increased
- Successful completion of statutory release increased
- Over the past decade, the rate of violent conviction for offenders while under supervision has declined
- The number of offenders granted temporary absence
- Section E. Statistics on Special Applications of Criminal Justice
- Section F. Victims of Crime
- Victimization rates for theft of personal property and assault decreased in 2014
- The majority of victims of violent crime are under age 30
- The majority of victims receiving services are victims of violent crime
- The number of victims registered with the federal correctional system has increased
- Offences causing death are the most common type of offence that harmed the victims registered with Correctional Service Canada
- Temporary absence information is the most common type of information provided during notification to victims registered with Correctional Service Canada
- Parole Board of Canada contact with victims has increased
- Victims presenting a statement at Parole Board of Canada hearings
- Victims requesting access to the decision registry
Preface
This document provides a statistical overview of corrections and conditional release within a context of trends in crime and criminal justice. A primary consideration in producing this overview was to present general statistical information in a "user friendly" way that will facilitate understanding by a broad audience. Accordingly, there are a number of features of this document that make it different from typical statistical reports.
- First, the visual representation of the statistics is simple and uncluttered, and under each chart there are a few key points that will assist the reader in extracting the information from the chart.
- Second, for each chart there is a table of numbers corresponding to the visual representation. In some instances, the table includes additional numbers, e.g., a five-year series, even though the chart depicts the data for the most recent year (e.g., Figure A2).
- Third, rather than using the conventional headings for statistics (e.g., "Police-reported crime rate by year by type of crime") the titles for each chart and table inform the reader about the matter at hand (e.g., "Police-reported crime rate has decreased since 1998").
- Fourth, notes have been kept to a minimum, that is, only where they were judged to be essential for the reader to understand the statistics.
- Finally, the source of the statistics is indicated under each chart so that the interested reader can easily access more information if desired.
The Corrections and Conditional Release Statistical Overview (CCRSO) has been published annually since 1998. Readers are advised that in some instances figures have been revised from earlier publications. Also, the total number of offenders will vary slightly depending on the characteristics of the data set.
It is hoped that this document will serve as a useful source of statistical information on corrections and conditional release and assist the public in gaining a better understanding of these important components of the criminal justice system.
Regarding police crime data from Statistics Canada, until the late 1980s, the Uniform Crime Reporting (UCR) survey provided aggregate counts of the number of incidents reported to police and the number of persons charged by type of offence. With the advent of microdata reporting, the UCR has become an "incident-based" survey (UCR2), collecting in-depth information about each criminal incident. The update to this new survey, as well as revisions to the definitions of violent crime, property crime, and other Criminal Code offences has resulted in data only being available from 1998 to the present. It is worth noting that the Total Crime Rates presented in the CCRSO differ from those reported by Statistics Canada in their publications. The Total Crime Rates reported in the CCRSO include offences (i.e., traffic offences in the Canadian Criminal Code and violations of federal statutes) that are excluded in the rates published by Statistics Canada.
Contributing Partners
- Public Safety Canada
- Public Safety Canada is Canada's lead federal department for public safety, which includes emergency management, national security and community safety. Its many responsibilities include developing legislation and policies that govern corrections, implementing innovative approaches to community justice, and providing research expertise and resources to the corrections community.
- Correctional Service Canada
- The Correctional Service of Canada (CSC) is the federal government agency responsible for administering sentences of a term of two years or more, as imposed by the courts. CSC is responsible for managing institutions of various security levels and supervising offenders under conditional release in the community.
- Parole Board of Canada
- The Parole Board of Canada is an independent administrative tribunal responsible for making decisions about the timing and conditions of release of offenders into the community on various forms of conditional release. The Board also makes pardon decisions and recommendations respecting clemency through the Royal Prerogative of Mercy.
- Office of the Correctional Investigator
- The Office of the Correctional Investigator is an ombudsman for federal offenders. It conducts investigations into the problems of offenders related to decisions, recommendations, acts or omissions of the Correctional Service of Canada that affect offenders individually or as a group.
- Canadian Centre for Justice Statistics (Statistics Canada)
- The Canadian Centre for Justice Statistics (CCJS) is a division of Statistics Canada. The CCJS is the focal point of a federal-provincial-territorial partnership, known as the National Justice Statistics Initiative, for the collection of information on the nature and extent of crime and the administration of civil and criminal justice in Canada.
Section A. Context - Crime and the Criminal Justice System
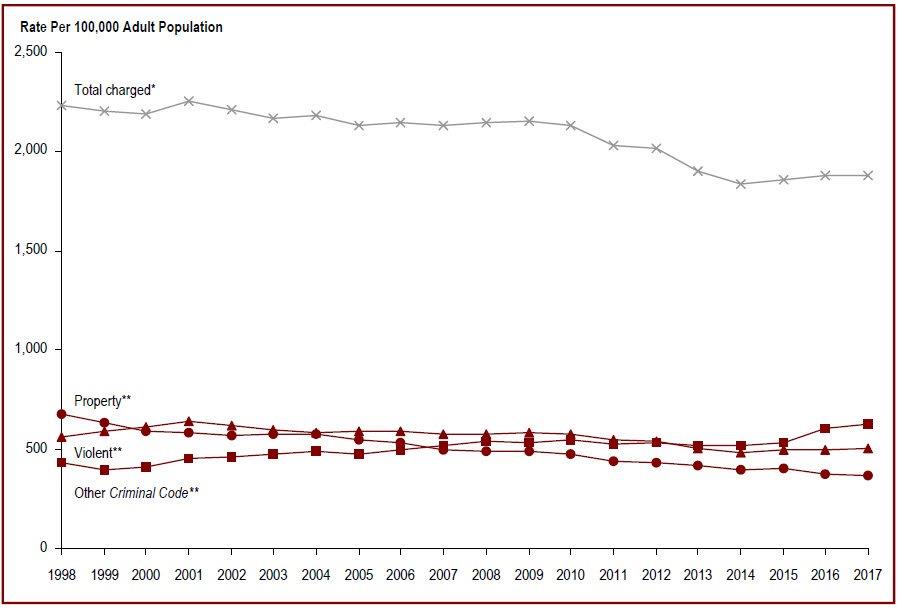
Police-reported crime rate has been decreasing since 1998
Figure A1
Source: Table 35-10-0177-01, Uniform Crime Reporting Survey, Canadian Centre for Justice Statistics, Statistics Canada.
- The overall crime rate has decreased 36.3% since 1998, from 8,915 per 100,000 to 6,006 in 2017.
- Over the same period, there was a 43.0% decrease in the property crime rate, from 5,696 per 100,000 to 3,245 in 2017. In contrast, the crime rate for drug offences has increased 5.1% since 1998, from 235 per 100,000 population to 247.
- The rate of violent crime has fluctuated over the last 19 years, peaking in 2000 at 1,494 per 100,000 population. Since 2000, the rate of violent crimes had decreased by 26.5% to 1,098 in 2017.
- In general, the crime rates for traffic offences and other Criminal Code offences have fluctuated since 1998.
Note:
*Unlike Statistics Canada, the Total Crime Rate in the Corrections and Conditional Release Statistical Overview includes traffic offences and violations of federal statutes to provide a measure of all criminal offences. As a result, the Total Crime Rate reported here is higher than that reported by Statistics Canada.
**The definitions for Violent, Property and Other Criminal Code offences have been revised by Statistics Canada to better reflect definitions used by the policing community. As a result of these changes, comparable data are only available starting in 1998 and the data presented in this year's report are not comparable to the data reported in previous versions of the Corrections and Conditional Release Statistical Overview.
These crime statistics are based on crimes that are reported to the police. Since not all crimes are reported to the police, these figures underestimate actual crime. See Figure F1 for rates based on victimization surveys (drawn from the General Social Survey), an alternative method of measuring crime.
Police-reported crime rate has been decreasing since 1998
| Year | Type of Offence | ||||||
|---|---|---|---|---|---|---|---|
| Violent** | Property** | Traffic | Other CC** | Drugs | Total Other Fed. Stat- | Total* | |
| 1998 | 1,345 | 5,696 | 496 | 1,051 | 235 | 40 | 8,915 |
| 1999 | 1,440 | 5,345 | 388 | 910 | 264 | 44 | 8,474 |
| 2000 | 1,494 | 5,189 | 370 | 924 | 287 | 43 | 8,376 |
| 2001 | 1,473 | 5,124 | 393 | 989 | 288 | 62 | 8,390 |
| 2002 | 1,441 | 5,080 | 379 | 991 | 296 | 55 | 8,315 |
| 2003 | 1,435 | 5,299 | 373 | 1,037 | 274 | 46 | 8,532 |
| 2004 | 1,404 | 5,123 | 379 | 1,072 | 306 | 50 | 8,391 |
| 2005 | 1,389 | 4,884 | 378 | 1,052 | 290 | 60 | 8,090 |
| 2006 | 1,387 | 4,809 | 376 | 1,050 | 295 | 57 | 8,004 |
| 2007 | 1,354 | 4,525 | 402 | 1,029 | 308 | 59 | 7,707 |
| 2008 | 1,334 | 4,258 | 437 | 1,039 | 308 | 67 | 7,475 |
| 2009 | 1,322 | 4,122 | 435 | 1,017 | 291 | 57 | 7,281 |
| 2010 | 1,292 | 3,838 | 420 | 1,029 | 321 | 62 | 6,996 |
| 2011 | 1,236 | 3,536 | 424 | 1,008 | 330 | 60 | 6,627 |
| 2012 | 1,198 | 3,435 | 406 | 1,000 | 317 | 67 | 6,459 |
| 2013 | 1,093 | 3,147 | 386 | 954 | 310 | 52 | 5,971 |
| 2014 | 1,041 | 3,090 | 364 | 915 | 294 | 49 | 5,777 |
| 2015 | 1,066 | 3,218 | 351 | 926 | 278 | 50 | 5,913 |
| 2016 | 1,052 | 3,207 | 345 | 965 | 263 | 59 | 5,962 |
| 2017 | 1,098 | 3,245 | 342 | 991 | 247 | 69 | 6,006 |
Source: Table 35-10-0177-01, Uniform Crime Reporting Survey, Canadian Centre for Justice Statistics, Statistics Canada.
Note:
*Unlike Statistics Canada, the Total Crime Rate in the Corrections and Conditional Release Statistical Overview includes traffic offences and violations of federal statutes to provide a measure of all criminal offences. As a result, the Total Crime Rate reported here is higher than that reported by Statistics Canada.
**The definitions for Violent, Property and Other Criminal Code offences, and Total Other Federal Statutes have been revised by Statistics Canada to better reflect definitions used by the policing community. As a result of these changes, comparable data are only available starting in 1998 and the data presented in this year's report are not comparable to the data reported in previous versions of the Corrections and Conditional Release Statistical Overview.
Rates are based on incidents reported per 100,000 population.
Due to rounding, rates may not add up to totals.
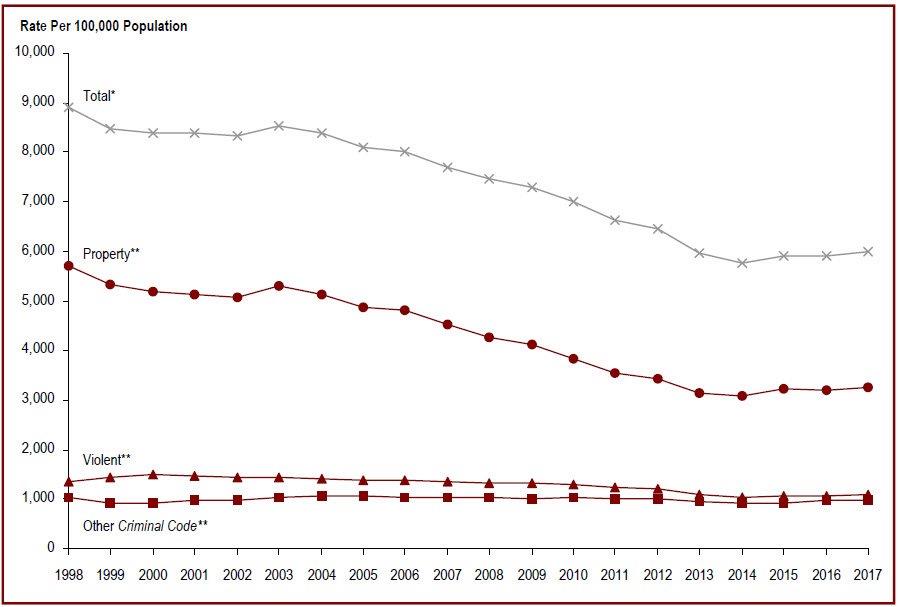
Crime rates are higher in the west and highest in the north
Figure A2
Source: Table 35-10-0177-01, Uniform Crime Reporting Survey, Canadian Centre for Justice Statistics, Statistics Canada.
- Crime rates are higher in the west and highest in the territories. This general pattern has been stable over time.
- The Canadian crime rate* slightly increased from 5,970 in 2013 to 6,006 in 2017.
Note:
Rates are based on 100,000 population.
Unlike Statistics Canada, the Crime Rate in the Corrections and Conditional Release Statistical Overview includes traffic offences and violations of federal statutes to provide a measure of all criminal offences. As a result, the Crime Rate reported here is higher than that reported by Statistics Canada. In addition, the definitions for Violent, Property and Other Criminal Code offences have been revised by Statistics Canada to better reflect definitions used by the policing community. As a result of these changes, comparable data are only available starting in 1998 and the data presented in this year’s report are not comparable to the data reported in previous versions of the Corrections and Conditional Release Statistical Overview.
Crime rates are higher in the west and highest in the north
| Province/Territory | Crime Rate* | ||||
|---|---|---|---|---|---|
| 2013 | 2014 | 2015 | 2016 | 2017 | |
| Newfoundland & Labrador | 6,677 | 6,216 | 6,362 | 6,490 | 6,010 |
| Prince Edward Island | 6,541 | 5,304 | 4,677 | 4,929 | 4,620 |
| Nova Scotia | 6,414 | 6,229 | 5,697 | 5,555 | 5,694 |
| New Brunswick | 5,476 | 5,072 | 5,514 | 5,318 | 5,780 |
| Quebec | 4,701 | 4,317 | 4,212 | 4,184 | 4,269 |
| Ontario | 4,182 | 4,003 | 3,998 | 4,061 | 4,119 |
| Manitoba | 8,720 | 8,399 | 8,904 | 9,479 | 9,708 |
| Saskatchewan | 12,545 | 12,138 | 12,803 | 13,362 | 12,785 |
| Alberta | 7,962 | 7,986 | 8,846 | 8,940 | 9,198 |
| British Columbia | 8,535 | 8,602 | 8,758 | 8,670 | 8,263 |
| Yukon Territories | 26,150 | 26,430 | 26,072 | 23,828 | 22,866 |
| Northwest Territories | 48,550 | 46,677 | 47,254 | 43,351 | 44,524 |
| Nunavut | 34,650 | 32,628 | 34,370 | 35,740 | 36,485 |
| Canada | 5,970 | 5,777 | 5,913 | 5,961 | 6,006 |
Source: Table 35-10-0177-01, Uniform Crime Reporting Survey, Canadian Centre for Justice Statistics, Statistics Canada.
Note:
*Rates are based on 100,000 population.
Unlike Statistics Canada, the Crime Rate in the Corrections and Conditional Release Statistical Overview includes traffic offences and violations of federal statutes to provide a measure of all criminal offences. As a result, the Crime Rate reported here is higher than that reported by Statistics Canada. In addition, the definitions for Violent, Property and Other Criminal Code offences have been revised by Statistics Canada to better reflect definitions used by the policing community. As a result of these changes, comparable data are only available starting in 1998 and the data presented in this year's report are not comparable to the data reported in previous versions of the Corrections and Conditional Release Statistical Overview.
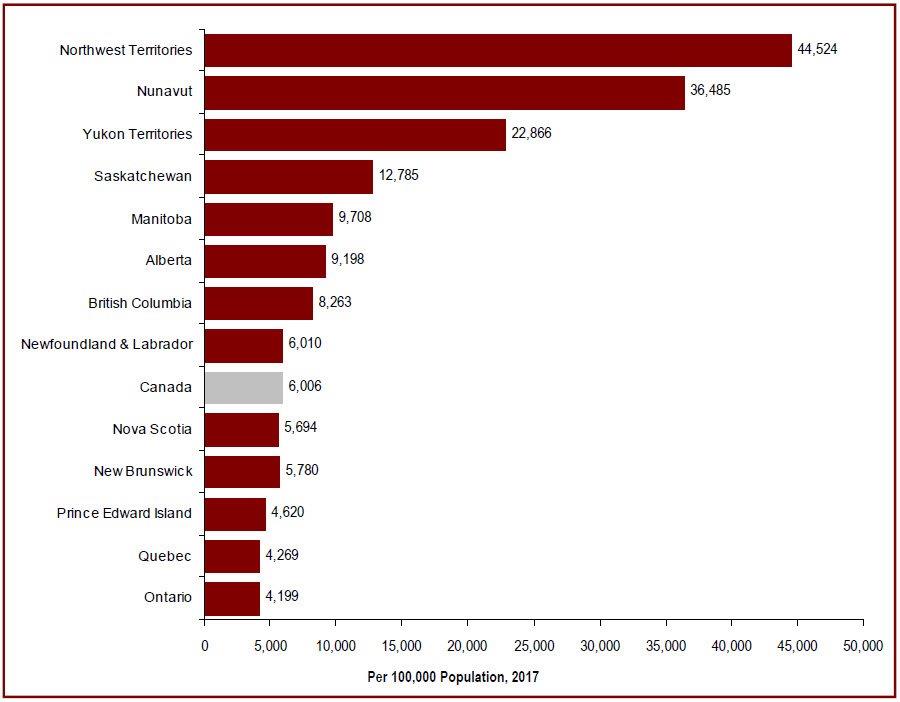
Canada’s Incarceration Rate Relative to Other Western European Countries
Figure A3
Source: World Prison Population List online (retrieved February 12, 2019 at https://www.prisonstudies.org/highest-to-lowest/prison-population-total).
- Canada's incarceration rate is higher than the rates in most western European countries but much lower than the United States, where the most recent incarceration rate was 655 per 100,000 general population.
- Based on the most up-to-date information available from the International Centre for Prison Studies, Canada's incarceration rate was 114 per 100,000. When ranked from highest to lowest, Canada's prison population rate was ranked 138 of 223 countries.
Note:
The incarceration rate, in this figure, is a measure of the number of people (i.e., adults and youth) in custody per 100,000 people in the general population. Incarceration rates from the World Prison Population List are based on the most recently available data at the time the list was compiled. Due to variations in the availability of information, the 2006 and 2008 dates reported in Figure A3 refer to when the World Prison Population Lists (Seventh and Eighth Editions respectively) were published, but may not necessarily correspond to the date the data were obtained. For 2018, the data was retrieved online on February 12, 2019 from https://www.prisonstudies.org which contains the most up-to-date information available. These data reflect incarceration rates based on the country's population. Additionally, different practices and variations in measurement in different countries limit the comparability of these figures.
Canada’s Incarceration Rate Relative to Other Western European Countries
| 20061* | 20082* | 20113* | 20124* | 20135* | 20146* | 20157* | 20168* | 20179* | 201810* | |
|---|---|---|---|---|---|---|---|---|---|---|
| United States | 738 | 756 | 743 | 730 | 716 | 707 | 698 | 693 | 666 | 655 |
| New Zealand | 186 | 185 | 199 | 194 | 192 | 190 | 190 | 203 | 214 | 214 |
| England & Wales | 148 | 153 | 155 | 154 | 148 | 149 | 148 | 147 | 146 | 140 |
| Scotland | 139 | 152 | 155 | 151 | 147 | 144 | 144 | 142 | 138 | 143 |
| Australia | 126 | 129 | 133 | 129 | 130 | 143 | 151 | 152 | 168 | 172 |
| Canada | 107 | 116 | 117 | 114 | 118 | 118 | 106 | 114 | 114 | 114 |
| Italy | 104 | 92 | 110 | 109 | 106 | 88 | 86 | 90 | 95 | 98 |
| Austria | 105 | 95 | 104 | 104 | 98 | 99 | 95 | 93 | 94 | 98 |
| France | 85 | 96 | 102 | 102 | 101 | 102 | 100 | 103 | 103 | 100 |
| Germany | 95 | 89 | 87 | 83 | 79 | 81 | 78 | 78 | 77 | 75 |
| Switzerland | 83 | 76 | 79 | 76 | 82 | 87 | 84 | 83 | 82 | 81 |
| Sweden | 82 | 74 | 78 | 70 | 67 | 57 | 60 | 53 | 57 | 59 |
| Denmark | 77 | 63 | 74 | 74 | 73 | 67 | 61 | 58 | 59 | 63 |
| Norway | 66 | 69 | 73 | 73 | 72 | 75 | 71 | 74 | 74 | 63 |
| Finland | 75 | 64 | 59 | 59 | 58 | 55 | 57 | 55 | 57 | 51 |
Source: International Centre for Prison Studies: 1World Prison Population List (Seventh Edition); 2World Prison Population List (Eighth Edition); 3World Prison Population List online (retrieved October 7, 2011 at https://www.prisonstudies.org/info/worldbrief/index.php), 4World Prison Population List online (retrieved October 15, 2012 at https://www.prisonstudies.org/info/worldbrief/index.php). 5World Prison Population List online (retrieved November 20, 2013 at https://www.prisonstudies.org/info/worldbrief/index.php). 6World Prison Population List online (retrieved December 8, 2014 at https://www.prisonstudies.org/world-prison-brief). 7World Prison Population List (retrieved November 20, 2015 at https://www.prisonstudies.org/highest-to-lowest/prison-population-total). 8World Prison Population List online (retrieved December 6, 2016 at https://www.prisonstudies.org/highest-to-lowest/prison-population-total). 9World Prison Population List online (retrieved November 10, 2017 at https://www.prisonstudies.org/highest-to-lowest/prison-population-total). 10World Prison Population List (Twelfth Edition) online (retrieved February 12, 2019 at https://www.prisonstudies.org/highest-to-lowest/prison-population-total).
Note:
*Incarceration rates from the World Prison Population List are based on the most recently available data at the time the list was compiled. Due to variations in the availability of information, the 2006 and 2008 dates reported in Table A3 refer to when the World Prison Population Lists (Seventh and Eighth Editions respectively) were published, but may not necessarily correspond to the date the data were obtained. For 2018, the data was retrieved online on February 12, 2019 at https://www.prisonstudies.org which contains the most up to date information available. Additionally, different practices and variations in measurement in different countries limit the comparability of these figures. Rates are based on 100,000 population.
The rate of adults charged has declined
Figure A4
Source: Table 35-10-0177-01, Uniform Crime Reporting Survey, Canadian Centre for Justice Statistics, Statistics Canada.
- Since 1998, the rate of adults charged has decreased from 2,236 adults per 100,000 to 1,881 in 2017, a decrease of 15.9%.
- Over the same period, the rate of adults charged with violent crimes decreased by 10.1%, such that in 2017, 506 adults were charged per 100,000, whereas the rate of adults charged for property offences decreased by 45.2% from 677 adults per 100,000 to 371 in 2017.
Note:
*Unlike Statistics Canada, the Total Crime Rate in the Corrections and Conditional Release Statistical Overview includes traffic offences and violations of federal statutes to provide a measure of all criminal offences. As a result, the Total Crime Rate reported here is higher than that reported by Statistics Canada.
**The definitions for Violent, Property and Other Criminal Code offences have been revised by Statistics Canada to better reflect definitions used by the policing community. As a result of these changes, comparable data are only available starting in 1998 and the data presented in this year's report are not comparable to the data reported in previous versions of the Corrections and Conditional Release Statistical Overview.
Violent crimes include homicide, attempted murder, assault, sexual offences, abduction, extortion, robbery, firearms, and other violent offences such as uttering threats and criminal harassment.
Property crimes include break and enter, motor vehicle thefts, other thefts, possession of stolen property, fraud, mischief and arson.
The rate of adults charged has declined
| Year | Type of Offence | ||||||
|---|---|---|---|---|---|---|---|
| Violent** | Property** | Traffic | Other CCC** | Drugs | Total Other Fed. Stat- | Total Charged* | |
| 1998 | 563 | 677 | 374 | 430 | 168 | 12 | 2,236 |
| 1999 | 590 | 632 | 371 | 396 | 185 | 18 | 2,203 |
| 2000 | 615 | 591 | 349 | 411 | 198 | 16 | 2,190 |
| 2001 | 641 | 584 | 349 | 451 | 202 | 18 | 2,256 |
| 2002 | 617 | 569 | 336 | 460 | 199 | 18 | 2,211 |
| 2003 | 598 | 573 | 326 | 476 | 172 | 15 | 2,168 |
| 2004 | 584 | 573 | 314 | 490 | 187 | 22 | 2,180 |
| 2005 | 589 | 550 | 299 | 479 | 185 | 22 | 2,131 |
| 2006 | 594 | 533 | 300 | 498 | 198 | 20 | 2,150 |
| 2007 | 577 | 499 | 298 | 521 | 208 | 20 | 2,132 |
| 2008 | 576 | 487 | 307 | 540 | 207 | 22 | 2,149 |
| 2009 | 585 | 490 | 311 | 532 | 201 | 20 | 2,152 |
| 2010 | 576 | 473 | 295 | 545 | 211 | 22 | 2,132 |
| 2011 | 548 | 441 | 271 | 527 | 213 | 23 | 2,034 |
| 2012 | 540 | 434 | 268 | 535 | 202 | 25 | 2,016 |
| 2013 | 504 | 415 | 242 | 518 | 200 | 18 | 1,904 |
| 2014 | 486 | 397 | 232 | 518 | 190 | 13 | 1,840 |
| 2015 | 498 | 401 | 228 | 531 | 180 | 15 | 1,859 |
| 2016 | 506 | 378 | 220 | 603 | 169 | 17 | 1,900 |
| 2017 | 506 | 371 | 206 | 636 | 155 | 12 | 1,881 |
Source: Table 35-10-0177-01, Uniform Crime Reporting Survey, Canadian Centre for Justice Statistics, Statistics Canada.
Note:
*Unlike Statistics Canada, the Total Crime Rate in the Corrections and Conditional Release Statistical Overview includes traffic offences and violations of federal statutes to provide a measure of all criminal offences. As a result, the Total Crime Rate reported here is higher than that reported by Statistics Canada.
**The definitions for Violent, Property and Other Criminal Code offences, and Total Other Federal Statutes have been revised by Statistics Canada to better reflect definitions used by the policing community. As a result of these changes, comparable data are only available starting in 1998 and the data presented in this year's report are not comparable to the data reported in previous versions of the Corrections and Conditional Release Statistical Overview.
Rates are based on 100,000 population, 18 years of age and older.
Due to rounding, rates may not add up to totals.
Violent crimes include homicide, attempted murder, assault, sexual offences, abduction, extortion, robbery, firearms, and other violent offences such as uttering threats and criminal harassment.
Property crimes include break and enter, motor vehicle theft, other theft, possession of stolen property, fraud, mischief and arson.
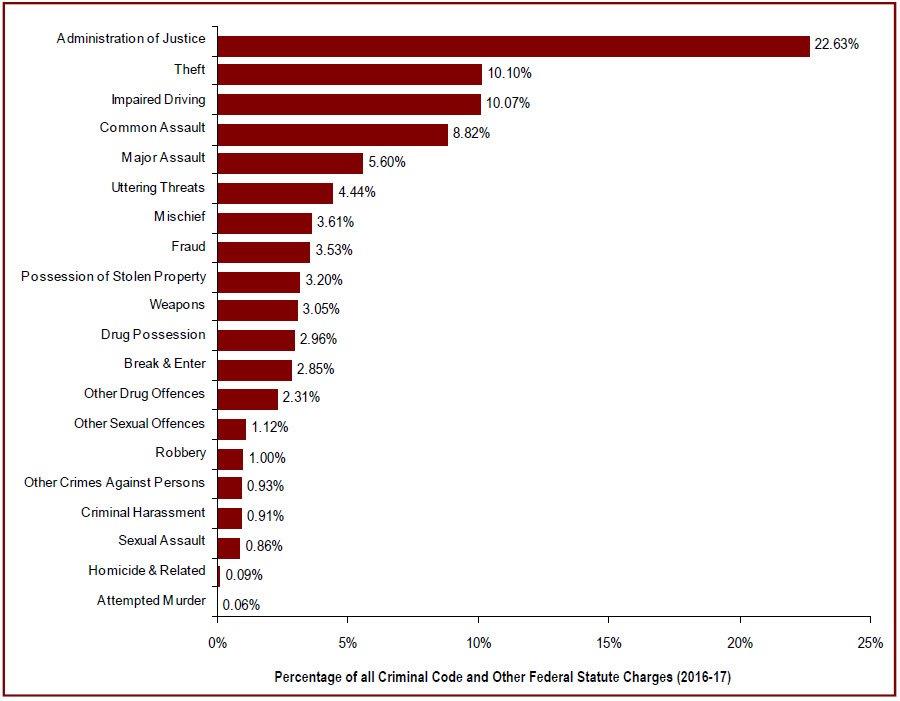
Administration of Justice Cases, Crimes Against the Person Cases and Crimes Against Property Cases Each Account for 23% of Cases* in Adult Courts
Figure A5
Source: Table 35-10-0027-01, Integrated Criminal Court Survey, Canadian Centre for Justice Statistics, Statistics Canada.
- Administration of justice cases (offences related to case proceedings such as failure to appear in court, failure to comply with a court order, breach of probation, and unlawfully at large) account for more than one fifth of cases completed in adult criminal courts.
- Apart from administration of justice cases, theft and impaired driving are the most frequent cases in adult courts.
Note:
*Cases completed in adult criminal courts.
The concept of a case has changed to more closely reflect court processing. Statistics from the Integrated Criminal Court Survey used in this report should not be compared to editions of the Corrections and Conditional Release Statistical Overview prior to 2007. A case is one or more charges against an accused person or corporation, processed by the courts at the same time, and where all of the charges in the case received a final disposition. Where a case has more than one charge, it is necessary to select a charge to represent the case. An offence is selected by applying two rules. First, the "most serious decision" rule is applied. In cases where two or more offences have the same decision, the "most serious offence" rule is applied. All charges are ranked according to an offence seriousness scale.
Superior Court data are not reported to the Integrated Criminal Court Survey for Prince Edward Island, Quebec, Ontario, Manitoba and Saskatchewan. In addition, information from Quebec's municipal courts is not collected.
The Canadian Centre for Justice Statistics continues to make updates to the offence library used to classify offence data sent by the provinces and territories. These improvements have resulted in minor changes in the counts of charges and cases as well as the distributions by type of offence. Data presented have been revised to account for these updates.
Due to rounding, percentages may not add up to 100 percent.
Administration of Justice Cases, Crimes Against the Person Cases and Crimes Against Property Cases Each Account for 23% of Cases* in Adult Courts
| Type of Charge | Criminal Code and Other Federal Statute Charges | |||||||
|---|---|---|---|---|---|---|---|---|
| 2014-15 | 2015-16 | 2016-17 | ||||||
| # | % | # | % | # | % | |||
| Crimes Against the Person | 80,994 | 23.01 | 82,387 | 23.47 | 85,270 | 23.84 | ||
| Homicide and Related | 262 | 0.07 | 247 | 0.07 | 328 | 0.09 | ||
| Attempted Murder | 158 | 0.04 | 195 | 0.06 | 197 | 0.06 | ||
| Robbery | 3,318 | 0.94 | 3,512 | 1.00 | 3,594 | 1.00 | ||
| Sexual Assault | 2,753 | 0.78 | 2,925 | 0.83 | 3,086 | 0.86 | ||
| Other Sexual Offences | 3,564 | 1.01 | 3,823 | 1.09 | 4,015 | 1.12 | ||
| Major Assault (Levels 2 & 3) | 18,644 | 5.30 | 19,164 | 5.46 | 20,034 | 5.60 | ||
| Common Assault (Level 1) | 30,517 | 8.67 | 30,748 | 8.76 | 31,554 | 8.82 | ||
| Uttering Threats | 15,849 | 4.50 | 15,677 | 4.47 | 15,897 | 4.44 | ||
| Criminal Harassment | 3,006 | 0.85 | 3,114 | 0.89 | 3,251 | 0.91 | ||
| Other Crimes Against Persons | 2,923 | 0.83 | 2,982 | 0.85 | 3,314 | 0.93 | ||
| Crimes Against Property | 80,467 | 22.86 | 81,959 | 23.35 | 85,125 | 23.80 | ||
| Theft | 35,195 | 10.00 | 35,537 | 10.12 | 36,112 | 10.10 | ||
| Break and Enter | 9,458 | 2.69 | 9,830 | 2.80 | 10,207 | 2.85 | ||
| Fraud | 11,371 | 3.23 | 11,623 | 3.31 | 12,634 | 3.53 | ||
| Mischief | 12,418 | 3.53 | 12,471 | 3.55 | 12,921 | 3.61 | ||
| Possession of Stolen Property | 10,441 | 2.97 | 10,872 | 3.10 | 11,460 | 3.20 | ||
| Other Property Crimes | 1,584 | 0.45 | 1,626 | 0.46 | 1,791 | 0.50 | ||
| Administration of Justice | 78,365 | 22.26 | 79,312 | 22.59 | 80,950 | 22.63 | ||
| Fail to Appear | 3,892 | 1.11 | 4,111 | 1.17 | 4,305 | 1.20 | ||
| Breach of Probation | 30,716 | 8.73 | 31,047 | 8.84 | 31,337 | 8.76 | ||
| Unlawfully at Large | 2,616 | 0.74 | 2,607 | 0.74 | 2,734 | 0.76 | ||
| Fail to Comply with Order | 33,159 | 9.42 | 33,546 | 9.56 | 34,341 | 9.60 | ||
| Other Admin. Justice | 7,982 | 2.27 | 8,001 | 2.28 | 8,233 | 2.30 | ||
| Other Criminal Code | 15,419 | 4.38 | 16,162 | 4.60 | 16,590 | 4.64 | ||
| Weapons | 9,693 | 2.75 | 10,545 | 3.00 | 10,906 | 3.05 | ||
| Prostitution | 388 | 0.11 | 198 | 0.06 | 425 | 0.12 | ||
| Disturbing the Peace | 1,136 | 0.32 | 1,056 | 0.30 | 938 | 0.26 | ||
| Residual Criminal Code | 4,202 | 1.19 | 4,363 | 1.24 | 4,321 | 1.21 | ||
| Criminal Code Traffic | 49,346 | 14.02 | 46,728 | 13.31 | 45,812 | 12.81 | ||
| Impaired Driving | 39,585 | 11.25 | 36,825 | 10.49 | 36,000 | 10.07 | ||
| Other CC Traffic | 9,761 | 2.77 | 9,903 | 2.82 | 9,812 | 2.74 | ||
| Other Federal Statutes | 47,428 | 13.47 | 44,513 | 12.68 | 43,895 | 12.27 | ||
| Drug Possession | 13,677 | 3.89 | 12,515 | 3.56 | 10,571 | 2.96 | ||
| Other Drug Offences | 9,228 | 2.62 | 8,547 | 2.43 | 8,273 | 2.31 | ||
| Residual Federal Statutes | 23,621 | 6.71 | 22,554 | 6.42 | 24,330 | 6.80 | ||
| Total Offences | 352,019 | 100.00 | 351,061 | 100.00 | 357,642 | 100.00 | ||
Source: Table 35-10-0027-01, Integrated Criminal Court Survey, Canadian Centre for Justice Statistics, Statistics Canada.
Note:
*Cases completed in adult criminal courts.
The concept of a case has changed to more closely reflect court processing. Statistics from the Integrated Criminal Court Survey used in this report should not be compared to editions of the Corrections and Conditional Release Statistical Overview prior to 2007. Superior Court data are not reported to the Integrated Criminal Court Survey for Prince Edward Island, Quebec, Ontario, Manitoba and Saskatchewan. In addition, information from Quebec's municipal courts is not collected. The Canadian Centre for Justice Statistics continues to make updates to the offence library used to classify offence data sent by the provinces and territories. These improvements have resulted in minor changes in the counts of charges and cases as well as the distributions by type of offence. Data presented have been revised to account for these updates.
Due to rounding, percentages may not add up to 100 percent.
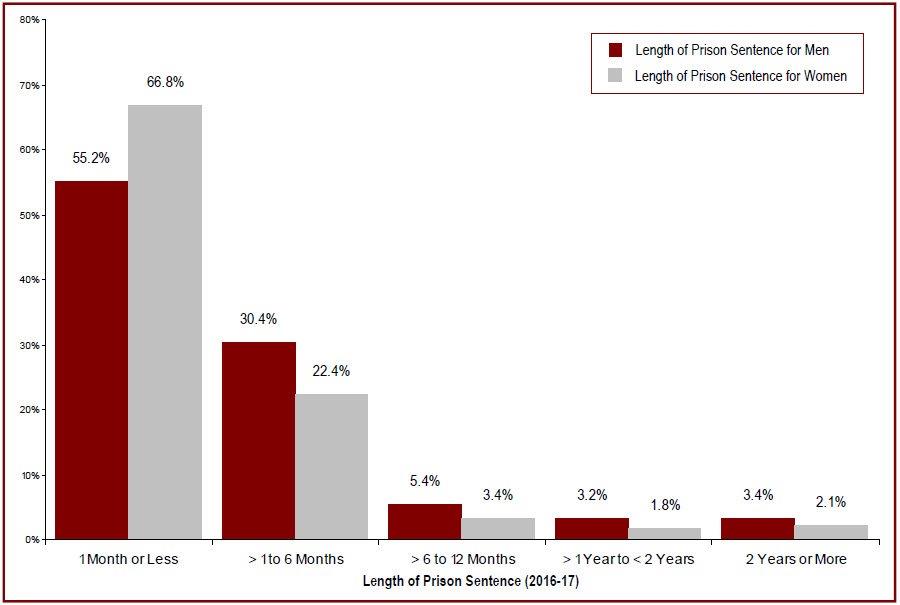
Most adult custodial sentences ordered by the court are short
Figure A6
Source: Table 35-10-0032-01, Integrated Criminal Court Survey, Canadian Centre for Justice Statistics, Statistics Canada.
- Over half (52.6%) of all custodial sentences imposed by adult criminal courts are one month or less.
- Prison sentences for men tend to be longer than for women. About two-thirds (66.8%) of women and just over half of men (55.2%) who are incarcerated following a guilty*finding receive a sentence of one month or less, and 89.2% of women and 85.6% of men receive a sentence of six months or less.
- Of all guilty findings that result in custody, only 3.1% result in federal jurisdiction (i.e., a sentence of two years or more).
Note:
*The decision type guilty" includes guilty of the offence, of an included offence, of an attempt of the offence, or of an attempt of an included offence. This category also includes cases where an absolute or conditional discharge has been imposed
The concept of a case has changed to more closely reflect court processing. Statistics from the Integrated Criminal Court Survey used in this report should not be compared to editions of the Corrections and Conditional Release Statistical Overview prior to 2007.
Excludes cases where length of prison sentence and/or sex was not known, data for Manitoba as information on sentence length was not available.
Superior Court data are not reported to the Integrated Criminal Court Survey for Prince Edward Island, Quebec, Ontario, Manitoba and Saskatchewan. In addition, information from Quebec's municipal courts is not collected.
The Canadian Centre for Justice Statistics continues to make updates to the offence library used to classify offence data sent by the provinces and territories. These improvements have resulted in minor changes in the counts of charges and cases as well as the distributions by type of offence. Data presented have been revised to account for these updates.
Due to rounding, totals may not add up to 100 percent.
Most adult custodial sentences ordered by the court are short
| Length of Prison Sentence | 2012-13 | 2013-14 | 2014-15 | 2015-16 | 2016-17 |
|---|---|---|---|---|---|
| % | % | % | % | % | |
| 1 Month or Less | |||||
| Women | 67.1 | 65.4 | 65.4 | 66.6 | 66.8 |
| Men | 52.9 | 52.6 | 53.8 | 54.2 | 55.2 |
| Total | 50.6 | 50.0 | 51.1 | 51.6 | 52.6 |
| More Than 1 Month up to 6 Months | |||||
| Women | 23.9 | 24.9 | 24.1 | 25.0 | 22.4 |
| Men | 32.4 | 32.6 | 31.5 | 30.9 | 30.4 |
| Total | 29.5 | 29.6 | 28.8 | 28.2 | 27.7 |
| More Than 6 Months up to 12 Months | |||||
| Women | 4.2 | 4.1 | 4.0 | 4.0 | 3.4 |
| Men | 6.3 | 6.2 | 6.2 | 5.8 | 5.4 |
| Total | 5.8 | 5.7 | 5.6 | 5.3 | 4.9 |
| More Than 1 Year up to Less Than 2 Years | |||||
| Women | 2.0 | 2.2 | 2.1 | 2.1 | 1.8 |
| Men | 3.9 | 3.9 | 3.6 | 3.6 | 3.2 |
| Total | 3.6 | 3.6 | 3.3 | 3.2 | 3.0 |
| 2 Years or More | |||||
| Women | 1.8 | 2.0 | 2.2 | 2.5 | 2.1 |
| Men | 3.8 | 3.9 | 3.6 | 3.7 | 3.4 |
| Total | 3.4 | 3.4 | 3.2 | 3.3 | 3.1 |
Source: Table 35-10-0032-01, Integrated Criminal Court Survey, Canadian Centre for Justice Statistics, Statistics Canada.
Note:
The concept of a case has changed to more closely reflect court processing. Statistics from the Integrated Criminal Court Survey used in this report should not be compared to editions of the Corrections and Conditional Release Statistical Overview prior to 2007.
Excludes cases where length of prison sentence and/or sex was not known, data for Manitoba as information on both sentence length was not available.
Superior Court data are not reported to the Integrated Criminal Court Survey for Prince Edward Island, Quebec, Ontario, Manitoba and Saskatchewan. In addition, information from Quebec's municipal courts is not collected.
The Canadian Centre for Justice Statistics continues to make updates to the offence library used to classify offence data sent by the provinces and territories. These improvements have resulted in minor changes in the counts of charges and cases as well as the distributions by type of offence. Data presented have been revised to account for these updates.
Due to rounding, totals may not add up to 100 percent.
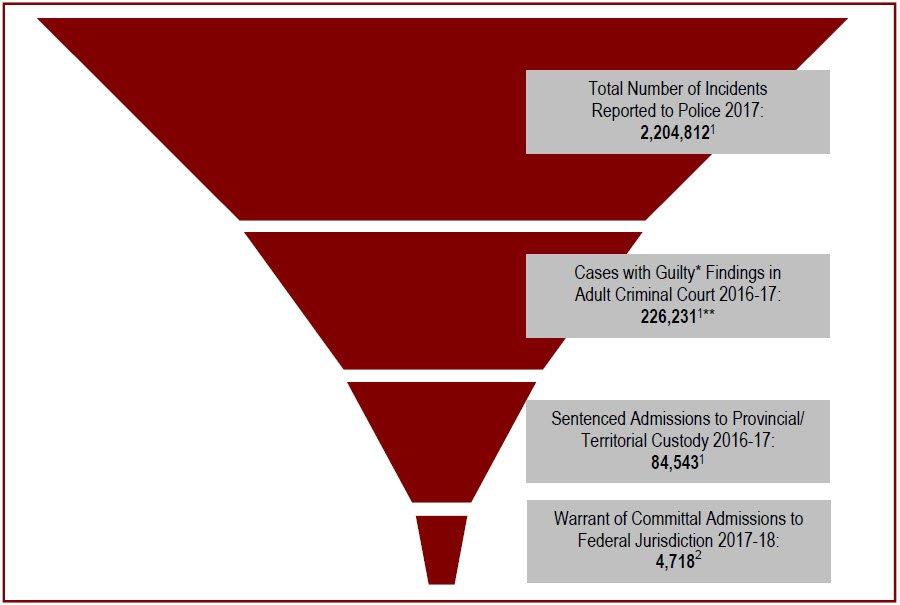
Relatively few crimes result in sentences to federal penitentiaries
Figure A7
Source: 1Table 35-10-0177-01, Uniform Crime Reporting Survey-2, Table 35-10-0027-01, Integrated Criminal Court Survey; and Table 35-10-0018-01, Adult Correctional Services Survey, all Canadian Centre for Justice Statistics, Statistics Canada; 2Correctional Service Canada.
- There were about 2.2 million incidents reported to police in 2017.
- In 2017-18, there were 4,718 warrant of committal admissions for offenders sentenced to a federal institution or Healing Lodge.
Note:
*The decision type "guilty" includes guilty of the offence, of an included offence, of an attempt of the offence, or of an attempt of an included offence. This category also includes cases where an absolute or conditional discharge has been imposed.
**This figure only includes cases in provincial court and partial data from Superior Court. Superior Court data are not reported to the Integrated Criminal Court Survey for Prince Edward Island, Quebec, Ontario, Manitoba and Saskatchewan. Information from Quebec's municipal courts is not collected.
The concept of a case has changed to more closely reflect court processing. Statistics from the Integrated Criminal Court Survey used in this report should not be compared to editions of the Corrections and Conditional Release Statistical Overview prior to 2007. A case is one or more charges against an accused person or corporation, processed by the courts at the same time, and where all of the charges in the case received a final disposition.
Police data are reported on a calendar year basis whereas court and prison data are reported on a fiscal year basis (April 1 through March 31).
Relatively few crimes result in sentences to federal penitentiaries
| 2013-14 | 2014-15 | 2015-16 | 2016-17 | 2017-18 | |
|---|---|---|---|---|---|
| Total Number of Incidents Reported to Police1 | 2,098,776 | 2,052,925 | 2,118,681 | 2,161,927 | 2,204,812 |
| Cases With Guilty*Findings in Adult Criminal Court1** | 244,742 | 227,031 | 227,279 | 226,231 | Not available*** |
| Sentenced Admissions to Provincial/Territorial Custody1 | 64,604 | 62,279 | 62,771 | 84,543 | Not available*** |
| Warrant of Committal Admissions to Federal Facilities2 | 5,071 | 4,818 | 4,891 | 4,908 | 4,718 |
Source: 1Table 35-10-0177-01, Uniform Crime Reporting Survey-2, Table 35-10-0027-01, Integrated Criminal Court Survey; and Table 35-10-0018-01, Adult Correctional Services Survey, all Canadian Centre for Justice Statistics, Statistics Canada; 2Correctional Service Canada.
Note:
*The decision type "guilty" includes guilty of the offence, of an included offence, of an attempt of the offence, or of an attempt of an included offence. This category also includes cases where an absolute or conditional discharge has been imposed.
**This figure only includes cases in provincial court and partial data from Superior Court. Superior Court data are not reported to the Integrated Criminal Court Survey for Prince Edward Island, Quebec, Ontario, Manitoba and Saskatchewan. Information from Quebec's municipal courts is not collected.
The concept of a case has changed to more closely reflect court processing. Statistics from the Integrated Criminal Court Survey used in this report should not be compared to editions of the Corrections and Conditional Release Statistical Overview prior to 2007. A case is one or more charges against an accused person or corporation, processed by the courts at the same time, and where all of the charges in the case received a final disposition.
Police data are reported on a calendar year basis whereas court and prison data are reported on a fiscal year basis (April 1 through March 31).
***Data from 2017-2018 were not yet released during the preparation of this report.
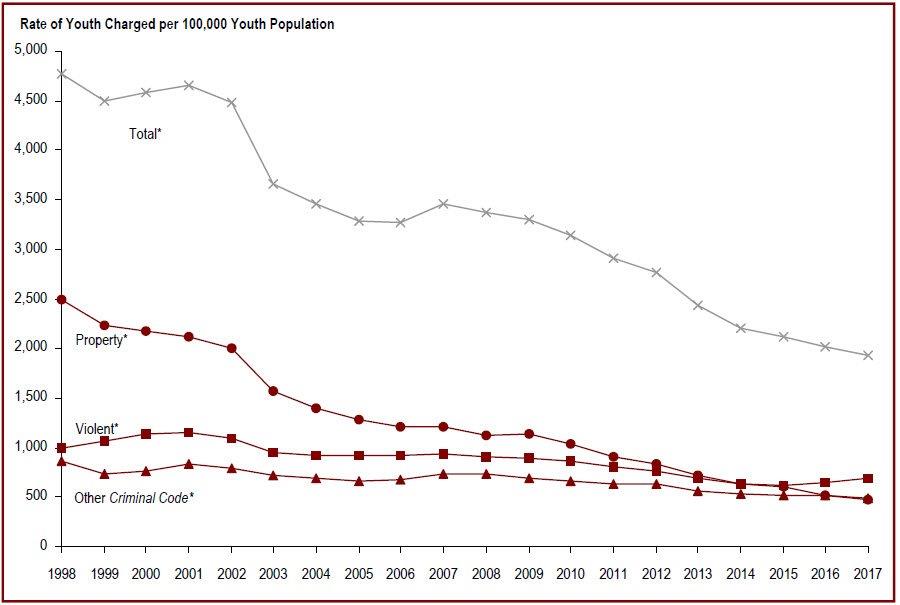
The rate of youth charged has declined over the past ten years
Figure A8
Source: Table 35-10-0177-01, Uniform Crime Reporting Survey, Canadian Centre for Justice Statistics, Statistics Canada.
- The rate of youth**charged has declined over the past ten years.
- In 2003, there was a notable decrease in all major crime categories, in part attributable to the implementation of the Youth Criminal Justice Act (YCJA) in April 2003, which places greater emphasis on diversion.
- The rate of youth charged with property crimes has decreased since 1998 by 81.0%, dropping from 2,500 per 100,000 youth to 474 in 2017.
- The rate of youth charged with violent crimes has decreased by 40.7% since reaching its peak in 2001, dropping from 1,157 per 100,000 youth to 686 in 2017.
Note:
*Unlike Statistics Canada, the Total Crime Rate in the Corrections and Conditional Release Statistical Overview includes traffic offences and violations of federal statutes to provide a measure of all criminal offences. As a result, the Total Crime Rate reported here is higher than that reported by Statistics Canada. In addition, the definitions for Violent, Property and Other Criminal Code offences have been revised by Statistics Canada to better reflect definitions used by the policing community. As a result of these changes, comparable data are only available starting in 1998 and the data presented in this year's report are not compa rable to the data reported in previous versions of the Corrections and Conditional Release Statistical Overview.
**For criminal justice purposes, youth are defined under Canadian law as persons age 12 to 17.
Rates are based on 100,000 youth population (12 to 17 years old).
Violent crimes include homicide, attempted murder, assault, sexual offences, abduction, extortion, robbery, firearms, and other violent offences such as uttering threats and criminal harassment.
Property crimes include break and enter, motor vehicle theft, other theft, possession of stolen property, fraud, mischief and arson.
The rate of youth charged has declined over the past ten years
| Year | Type of Offence | ||||||
|---|---|---|---|---|---|---|---|
| Violent* | Property* | Traffic** | Other CCC* | Drugs | Total Other Fed. Stat- | Total Charged* | |
| 1998 | 994 | 2,500 | -- | 870 | 226 | 4 | 4,775 |
| 1999 | 1,060 | 2,237 | -- | 728 | 266 | 2 | 4,500 |
| 2000 | 1,136 | 2,177 | -- | 760 | 317 | 4 | 4,589 |
| 2001 | 1,157 | 2,119 | -- | 840 | 343 | 6 | 4,656 |
| 2002 | 1,102 | 2,009 | -- | 793 | 337 | 6 | 4,476 |
| 2003 | 953 | 1,570 | -- | 726 | 208 | 5 | 3,662 |
| 2004 | 918 | 1,395 | -- | 691 | 230 | 5 | 3,457 |
| 2005 | 924 | 1,276 | -- | 660 | 214 | 10 | 3,287 |
| 2006 | 917 | 1,216 | -- | 680 | 240 | 16 | 3,269 |
| 2007 | 943 | 1,211 | 75 | 732 | 260 | 17 | 3,461 |
| 2008 | 909 | 1,130 | 74 | 730 | 267 | 19 | 3,369 |
| 2009 | 888 | 1,143 | 68 | 698 | 238 | 30 | 3,294 |
| 2010 | 860 | 1,035 | 62 | 669 | 255 | 31 | 3,147 |
| 2011 | 805 | 903 | 58 | 635 | 263 | 31 | 2,915 |
| 2012 | 764 | 841 | 58 | 629 | 240 | 20 | 2,768 |
| 2013 | 692 | 723 | 45 | 555 | 229 | 10 | 2,437 |
| 2014 | 629 | 629 | 43 | 530 | 200 | 6 | 2,199 |
| 2015 | 623 | 612 | 44 | 525 | 161 | 10 | 2,125 |
| 2016 | 648 | 514 | 41 | 523 | 138 | 12 | 2,003 |
| 2017 | 686 | 474 | 37 | 492 | 121 | 6 | 1,930 |
Source: Table 35-10-0177-01, Uniform Crime Reporting Survey, Canadian Centre for Justice Statistics, Statistics Canada.
Note:
*Unlike Statistics Canada, the Total Crime Rate in the Corrections and Conditional Release Statistical Overview includes traffic offences and violations of federal statutes to provide a measure of all criminal offences. As a result, the Total Crime Rate reported here is higher than that reported by Statistics Canada. In addition, the definitions for Violent, Property and Other Criminal Code offences, and Total Other Federal Statutes have been revised by Statistics Canada to better reflect definitions used by the policing community. As a result of these changes, comparable data are only available starting in 1998 and the data presented in this year's report are not compa rable to the data reported in previous versions of the Corrections and Conditional Release Statistical Overview.
**Data for Youth Charged and Youth Not Charged for Impaired Driving are not available prior to 2007. As a result, comparisons to Total Charged and Other CCC (including traffic) over time should be made with caution.
For criminal justice purposes, youth are defined under Canadian law as persons age 12 to 17.
Rates are based on 100,000 youth population (12 to 17 years old).
Violent crimes include homicide, attempted murder, assault, sexual offences, abduction, extortion, robbery, firearms, and other violent offences such as uttering threats and criminal harassment.
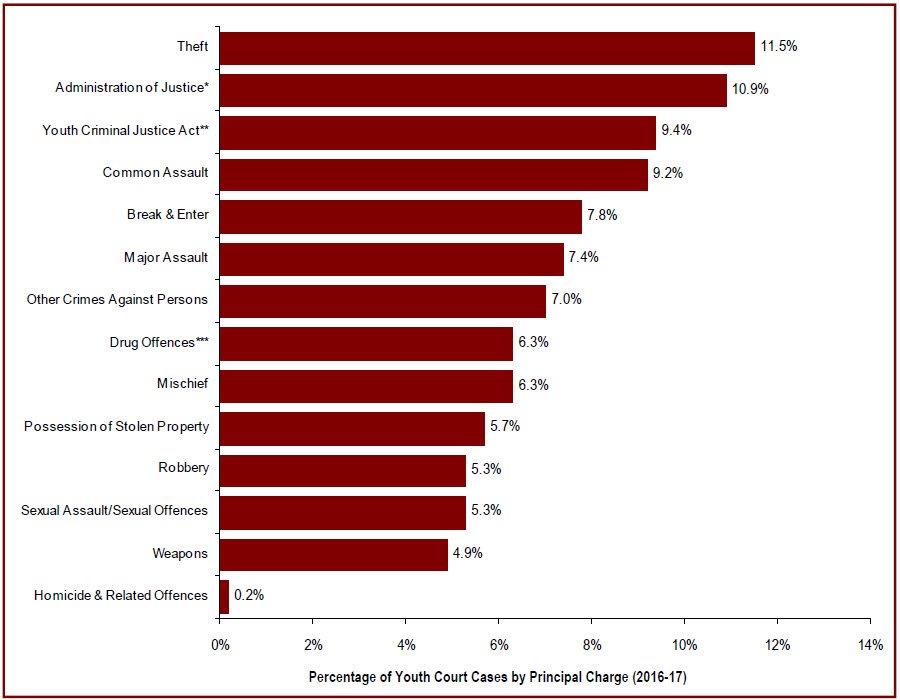
The most common youth court case is theft
Figure A9
Source: Table 35-10-0038-01, Integrated Criminal Court Survey, Canadian Centre for Justice Statistics, Statistics Canada.
- Following the enactment of the Youth Criminal Justice Act in 2003, fewer youth appear in court.
- Theft is the most common case in youth court.
- Homicides and related offences account for 0.2% of all youth cases.
- Females account for 20% of all cases, but they account for 33% of common assaults.
Note:
*"Administration of Justice" includes the offences failure to appear, failure to comply, and breach of recognizance.
**Youth Criminal Justice Act offences include failure to comply with a disposition or undertaking, contempt against youth court, assisting a youth to leave a place of custody and harbouring a youth unlawfully at large. Also included are similar offences under the Young Offenders Act, which preceded the Youth Criminal Justice Act.
***Drug Offences" includes possession and other drug offences.
The concept of a case has changed to more closely reflect court processing. Statistics from the Integrated Criminal Court Survey used in this report should not be compared to editions of the Corrections and Conditional Release Statistical Overview prior to 2007. A case is one or more charges against an accused person or corporation, processed by the courts at the same time, and where all of the charges in the case received a final disposition. Where a case has more than one charge, it is necessary to select a charge to represent the case. An offence is selected by applying two rules. First, the "most serious decision" rule is applied. In cases where two or more offences have the same decision, the "most serious offence" rule is applied. All charges are ranked according to an offence seriousness scale.
The Canadian Centre for Justice Statistics continues to make updates to the offence library used to classify offence data sent by the provinces and territories. These improvements have resulted in minor changes in the counts of charges and cases as well as the distributions by type of offence. Data presented have been revised to account for these updates.
The most common youth court case is theft
| Type of Case | Number of Youth Court Cases | |||||
|---|---|---|---|---|---|---|
| 2012-2013 | 2013-2014 | 2014-2015 | 2015-2016 | 2016-2017 | ||
| Crimes Against the Person | 12,792 | 11,883 | 9,959 | 9,635 | 9,709 | |
| Homicide and Attempted Murder | 52 | 53 | 49 | 55 | 54 | |
| Robbery | 2,336 | 1,937 | 1,487 | 1,482 | 1,498 | |
| Sexual Assault/Other Sexual Offences | 1,331 | 1,449 | 1,325 | 1,440 | 1,489 | |
| Major Assault | 2,715 | 2,427 | 2,128 | 2,084 | 2,096 | |
| Common Assault | 3,878 | 3,637 | 2,771 | 2,567 | 2,593 | |
| Other Crimes Against Person* | 2,480 | 2,380 | 2,199 | 2,007 | 1,979 | |
| Crimes Against Property | 15,723 | 13,526 | 11,014 | 10,654 | 9,482 | |
| Theft | 5,476 | 4,692 | 3,660 | 3,658 | 3,234 | |
| Break and Enter | 3,606 | 3,153 | 2,603 | 2,419 | 2,200 | |
| Fraud | 474 | 470 | 377 | 380 | 418 | |
| Mischief | 2,948 | 2,514 | 2,155 | 2,087 | 1,788 | |
| Possession of Stolen Property | 2,779 | 2,322 | 1,913 | 1,832 | 1,600 | |
| Other Property Crimes | 440 | 375 | 306 | 278 | 242 | |
| Administration of Justice | 4,893 | 4,336 | 3,659 | 3,421 | 3,065 | |
| Failure to Comply With Order | 3,230 | 2,902 | 2,414 | 2,229 | 2,039 | |
| Other Administration of Justice** | 1,357 | 1,172 | 1,028 | 983 | 822 | |
| Other Criminal Code | 2,424 | 2,193 | 2,078 | 1,933 | 1,834 | |
| Weapons/Firearms | 1,555 | 1,463 | 1,421 | 1,401 | 1,368 | |
| Prostitution | 6 | 11 | 17 | 8 | 19 | |
| Disturbing the Peace | 132 | 86 | 64 | 65 | 49 | |
| Residual Criminal Code | 731 | 633 | 576 | 459 | 398 | |
| Criminal Code Traffic | 828 | 656 | 569 | 570 | 550 | |
| Other Federal Statutes | 8,781 | 7,780 | 6,395 | 5,505 | 4,532 | |
| Drug Possession | 1,840 | 1,571 | 1,784 | 1,551 | 1,122 | |
| Other Drug Offences | 710 | 666 | 917 | 724 | 640 | |
| Youth Criminal Justice Act*** | 4,542 | 3,870 | 3,524 | 3,096 | 2,648 | |
| Residual Federal Statutes | 163 | 150 | 170 | 134 | 122 | |
| Total Offences | 45,441 | 40,374 | 33,674 | 31,718 | 28,172 | |
Source: Table 35-10-0038-01, Integrated Criminal Court Survey, Canadian Centre for Justice Statistics, Statistics Canada.
Note:
*"Other Crimes Against the Person" includes the offences uttering threats and criminal harassment.
**"Other Administration of Justice" includes the offences failure to appear and breach of recognizance.
***Youth Criminal Justice Act offences include failure to comply with a disposition or undertaking, contempt against youth court, assisting a youth to leave a place of custody and harbouring a youth unlawfully at large. Also included are similar offences under the Young Offenders Act, which preceded the Youth Criminal Justice Act.
The concept of a case has changed to more closely reflect court processing. Statistics from the Integrated Criminal Court Survey used in this report should not be compared to editions of the Corrections and Conditional Release Statistical Overview prior to 2007. A case is one or more charges against an accused person or corporation, processed by the courts at the same time, and where all of the charges in the case received a final disposition. Where a case has more than one charge, it is necessary to select a charge to represent the case. An offence is selected by applying two rules.
First, the "most serious decision" rule is applied. In cases where two or more offences have the same decision, the "most serious offence" rule is applied. All charges are ranked according to an offence seriousness scale.
The Canadian Centre for Justice Statistics continues to make updates to the offence library used to classify offence data sent by the provinces and territories. These improvements have resulted in minor changes in the counts of charges and cases as well as the distributions by type of offence. Data presented have been revised to account for these updates.
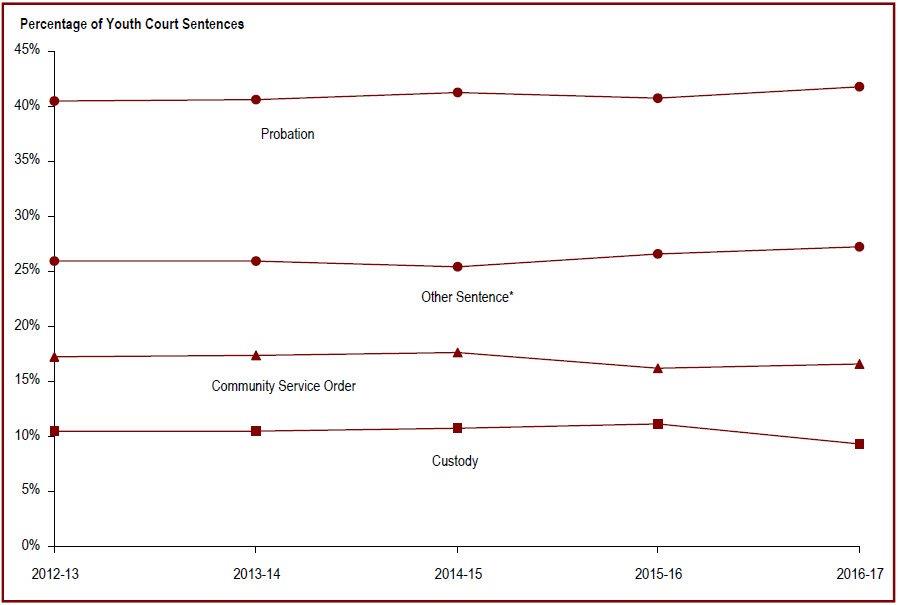
The most common sentence for youth is probation
Figure A10
Source: Table 35-10-0041-01, Integrated Criminal Court Survey, Canadian Centre for Justice Statistics, Statistics Canada.
- Consistent with the objectives of the YCJA, fewer youth are sentenced to custody. In 2016-17, 12.9% of all guilty cases resulted in the youth being sentenced to custody.
- In 2016-17, 57.2% of youth found guilty were given probation as the most serious sentence. This rate has remained relatively stable since the implementation of the YCJA in April 2003.
- Of the new YCJA sentences, deferred custody and supervision orders were handed down least frequently. In 2016-17, 4.5% of all guilty cases received such an order as the most serious sentence.
Note:
*"Other Sentence" includes absolute discharge, restitution, prohibition, seizure, forfeiture, compensation, pay purchaser, essays, apologies, counselling programs and conditional discharge, conditional sentence, intensive support and supervision, attendance at non-residential program(s) and reprimand. This category also includes deferred custody and supervision, intensive support and supervision, attendance at non-residential program(s) and reprimand where sentencing data under the Youth Criminal Justice Act (YCJA) are not available.
Unlike previous years, this data represents the most serious sentence and therefore, sanctions are mutually exclusive. However, each case may receive more than one sentence.
The concept of a case has changed to more closely reflect court processing. Statistics from the Integrated Criminal Court Survey used in this report should not be compared to editions of the Corrections and Conditional Release Statistical Overview prior to 2007.
The most common sentence for youth is probation
| Type of Sentence | Gender | Year | |||||
|---|---|---|---|---|---|---|---|
| 2012-2013 | 2013-2014 | 2014-2015 | 2015-2016 | 2016-2017 | |||
| % | % | % | % | % | |||
| Probation | Female | 41.9 | 41.4 | 41.1 | 41.2 | 42.6 | |
| Male | 39.2 | 39.4 | 40.1 | 40.0 | 40.9 | ||
| Total | 40.4 | 40.6 | 41.2 | 40.7 | 41.7 | ||
| Custody | Female | 8.4 | 8.0 | 9.0 | 9.0 | 5.8 | |
| Male | 10.9 | 10.8 | 10.8 | 11.2 | 9.3 | ||
| Total | 10.5 | 10.5 | 10.8 | 11.2 | 9.4 | ||
| Community Service Order | Female | 18.0 | 17.6 | 18.0 | 15.9 | 17.0 | |
| Male | 17.4 | 17.9 | 18.3 | 16.6 | 17.0 | ||
| Total | 17.2 | 17.4 | 17.6 | 16.2 | 16.6 | ||
| Fine | Female | 2.0 | 2.0 | 2.2 | 2.2 | 1.9 | |
| Male | 2.7 | 2.2 | 1.9 | 2.0 | 1.8 | ||
| Total | 2.6 | 2.2 | 2.0 | 2.1 | 1.8 | ||
| Deferred Custody and Supervision | Female | 3.0 | 3.3 | 2.5 | 3.0 | 2.6 | |
| Male | 3.3 | 3.2 | 2.9 | 3.2 | 3.3 | ||
| Total | 3.3 | 3.3 | 3.0 | 3.2 | 3.3 | ||
| Other Sentence* | Female | 26.7 | 27.6 | 27.2 | 28.7 | 30.1 | |
| Male | 26.5 | 26.5 | 25.9 | 27.0 | 27.8 | ||
| Total | 26.0 | 25.9 | 25.4 | 26.6 | 27.2 | ||
Source: Table 35-10-0041-01, Integrated Criminal Court Survey, Canadian Centre for Justice Statistics, Statistics Canada.
Note:
*"Other Sentence" includes absolute discharge, restitution, prohibition, seizure, forfeiture, compensation, pay purchaser, essays, apologies, counselling programs and conditional discharge, conditional sentence, intensive support and supervision, attendance at non-residential program(s) and reprimand. This category also includes deferred custody and supervision, intensive support and supervision, attendance at non-residential program(s) and reprimand where sentencing data under the Youth Criminal Justice Act (YCJA) are not available.
Unlike previous years, this data represents the most serious sentence and therefore, sanctions are mutually exclusive. However, each case may receive more than one sentence.
The concept of a case has changed to more closely reflect court processing. Statistics from the Integrated Criminal Court Survey used in this report should not be compared to editions of the Corrections and Conditional Release Statistical Overview prior to 2007.
Section B - Corrections Administration
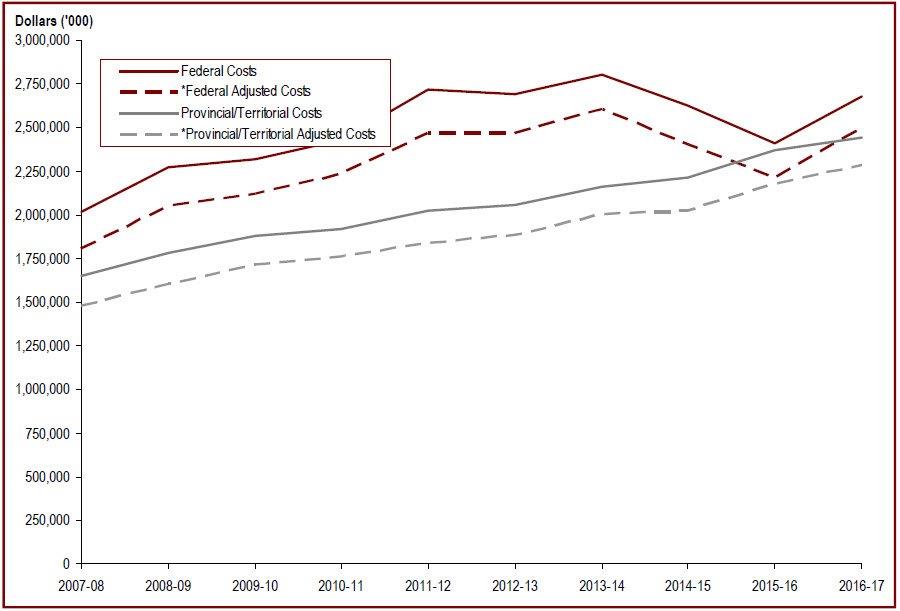
Expenditures on Corrections
Figure B1
Source: Correctional Service Canada; Parole Board of Canada; Office of the Correctional Investigator; Statistics Canada Consumer Price Index. Provincial figures derived from the Adult Correctional Services Survey, Canadian Center for Justice Statistics, Statistics Canada.
- In 2016-17, expenditures on federal corrections in Canada totaled approximately $2.41 billion, an 0.2% increase from 2015-16.
- Provincial/territorial expenditures totaled about $2.45 billion in 2016-17, an increase of 3.2% from 2015-16.
- Since 2007-08, expenditures on federal corrections have increased by 19.8%, from $2.02 billion to $2.41 billion. In constant dollars, this represents an increase of 24.8%.
- Over the same time period, provincial/territorial expenditures increased by 48.5% from $1.65 billion to $2.45 billion. In constant dollars, this represents an increase of 54.6%.
Note:
*Adjusted costs are reported in constant dollars. Constant dollars (2002) represent dollar amounts calculated on a one-year base that adjusts for inflation, allowing the yearly amounts to be directly comparable. Changes in the Consumer Price Index were used to calculate constant dollars.
Federal expenditures on corrections include spending by Correctional Service Canada (CSC), the Parole Board of Canada (PBC), and the Office of the Correctional Investigator (OCI). Total expenditures represent gross expenditures and exclude revenues. Operating costs include Employee benefit Plan expenditures. CSC expenditures exclude CORCAN (a Special Operating Agency that conducts industrial operations within penitentiaries). Provincial/Territorial expenditures do not include capital costs.
Expenditures on Corrections
| Year | Current Dollars | Constant 2002 Dollars | ||||||
|---|---|---|---|---|---|---|---|---|
| Operating |
Capital | Total | Per capita |
Operating |
Capital | Total | Per capita |
|
| $'000 | $ | $'000 | $ | |||||
| 2012-13 | ||||||||
| CSC | 2,204,005 | 437,736 | 2,641,742 | 76.01 | 2,019,281 | 401,048 | 2,420,331 | 69.64 |
| PBC | 46,500 | - - | 46,500 | 1.34 | 42,603 | - - | 42,603 | 1.23 |
| OCI | 4,801 | - - | 4,801 | 0.14 | 4,399 | - - | 4,399 | 0.13 |
| Total | 2,255,306 | 437,736 | 2,693,043 | 77.49 | 2,066,283 | 401,048 | 2,467,332 | 70.99 |
| 2013-14 | ||||||||
| CSC | 2,371,700 | 378,372 | 2,750,072 | 78.22 | 2,203,672 | 351,566 | 2,555,238 | 72.68 |
| PBC | 50,400 | - - | 50,400 | 1.43 | 46,829 | - - | 46,829 | 1.33 |
| OCI | 4,946 | - - | 4,946 | 0.14 | 4,596 | - - | 4,596 | 0.13 |
| Total | 2,427,046 | 378,372 | 2,805,418 | 79.79 | 2,255,097 | 351,566 | 2,606,663 | 74.14 |
| 2014-15 | ||||||||
| CSC | 2,373,604 | 200,606 | 2,574,210 | 72.42 | 2,168,852 | 183,301 | 2,352,154 | 66.17 |
| PBC | 50,100 | - - | 50,100 | 1.41 | 45,778 | - - | 45,778 | 1.29 |
| OCI | 4,659 | - - | 4,659 | 0.13 | 4,257 | - - | 4,257 | 0.12 |
| Total | 2,428,363 | 200,606 | 2,628,969 | 73.96 | 2,218,888 | 183,301 | 2,402,189 | 67.58 |
| 2015-16 | ||||||||
| CSC | 2,189,101 | 168,684 | 2,357,785 | 65.77 | 2,014,457 | 155,227 | 2,169,684 | 60.52 |
| PBC | 46,300 | - - | 46,300 | 1.29 | 42,606 | - - | 42,606 | 1.19 |
| OCI | 4,656 | - - | 4,656 | 0.13 | 4,285 | - - | 4,285 | 0.12 |
| Total | 2,240,057 | 168,684 | 2,408,741 | 67.19 | 2,061,348 | 155,227 | 2,216,574 | 61.83 |
| 2016-17 | ||||||||
| CSC | 2,209,048 | 153,757 | 2,362,804 | 65.12 | 2,062,810 | 143,578 | 2,206,388 | 60.80 |
| PBC | 46,800 | - - | 46,800 | 1.29 | 43,702 | - - | 43,702 | 1.20 |
| OCI | 4,693 | - - | 4,693 | 0.13 | 4,382 | - - | 4,382 | 0.12 |
| Total | 2,260,541 | 153,757 | 2,414,297 | 66.53 | 2,110,895 | 143,578 | 2,254,472 | 62.13 |
Source: Correctional Service Canada; Parole Board of Canada; Office of the Correctional Investigator; Statistics Canada Consumer Price Index.
Note:
Due to rounding, constant dollar amounts may not add up to "Total".
Per capita cost is calculated by dividing the total expenditures by the total Canadian population and thus represents the cost per Canadian for federal correctional services.
Constant dollars represent dollar amounts calculated on a one-year base (2002) that adjusts for inflation allowing the yearly amounts to be directly comparable.
Changes in the Consumer Price Index were used to calculate constant dollars.
CSC employees are concentrated in custody centres
Figure B2
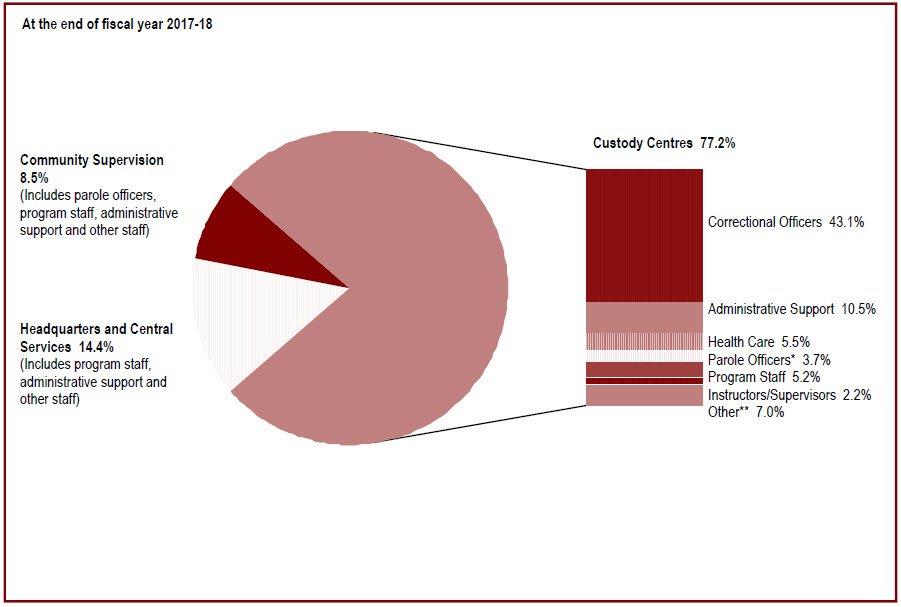
Source: Correctional Service Canada.
- Correctional Service Canada (CSC) has a total of 16,898 staff.***
- Approximately 77% of CSC staff work in institutions.
- Staff employed in community supervision account for 9% of the total.
Note:
Due to changes in policy, Correctional Officers no longer occupy positions in the community.
*These parole officers are situated within institutions, with the responsibility of preparing offenders for release.
**The "Other" category represents job classifications such as trades and food services.
***CSC has changed its definition of employee. Previously the total number of employees included casual employees, employees on leave without pay and suspended employees. These categories have been removed from the total as of 2005-06. These numbers represent Indeterminate and Term equal to, or more than 3 months substantive employment; and Employee Status of Active and Paid Leave current up to March 31, 2018.
Due to rounding, percentage may not add to 100.
CSC employees are concentrated in custody centres
| Service Area | March 31, 2006 | March 31, 2018 | ||
|---|---|---|---|---|
| # | % | # | % | |
| Headquarters and Central Services | 2,087 | 14.5 | 2,427 | 14.4 |
| Administration | 1,699 | 11.8 | 2,065 | 12.2 |
| Health Care | 111 | 0.8 | 80 | 0.5 |
| Program Staff | 120 | 0.8 | 62 | 0.4 |
| Correctional Officers | 28 | 0.2 | 39 | 0.2 |
| Instructors/Supervisors | 10 | 0.1 | 10 | 0.1 |
| Parole Officers/Parole Supervisors | 1 | <0.1 | ||
| Other** | 119 | 0.8 | 170 | 1.0 |
| Custody Centres | 11,229 | 77.8 | 13,039 | 77.2 |
| Correctional Officers | 5,965 | 41.3 | 7,285 | 43.1 |
| Administration | 1,914 | 13.3 | 1,771 | 10.5 |
| Health Care | 779 | 5.4 | 921 | 5.5 |
| Program Staff | 534 | 3.7 | 875 | 5.2 |
| Parole Officers/Parole Supervisors* | 648 | 4.5 | 619 | 3.7 |
| Instructors/Supervisors | 387 | 2.7 | 377 | 2.2 |
| Other** | 1,002 | 6.9 | 1,191 | 7.0 |
| Community Supervision | 1,125 | 7.8 | 1,432 | 8.5 |
| Parole Officers/Parole Supervisors | 581 | 4.0 | 715 | 4.2 |
| Administration | 315 | 2.2 | 354 | 2.1 |
| Program Staff | 172 | 1.2 | 273 | 1.6 |
| Health Care | 34 | 0.2 | 87 | 0.5 |
| Correctional Officers | 22 | 0.2 | 0 | 0.0 |
| Other** | 1 | <0.1 | 3 | <0.1 |
| Total*** | 14,441 | 100.0 | 16,898 | 100.0 |
Source: Correctional Service Canada.
Note:
Due to changes in policy, Correctional Officers no longer occupy positions in the community.
*These parole officers are situated within institutions, with the responsibility of preparing offenders for release.
**The "Other" category represents job classifications such as trades and food services.
***CSC has changed its definition of employee. Previously the total number of employees included casual employees, employees on leave without pay and suspended employees. These categories have been removed from the total as of 2005-06. These numbers represent Indeterminate and Term equal to, or more than 3 months substantive employment; and Employee Status of Active and Paid Leave current up to March 31, 2018.
Due to rounding, percentage may not add up to 100.
The cost of keeping an inmate incarcerated
Figure B3
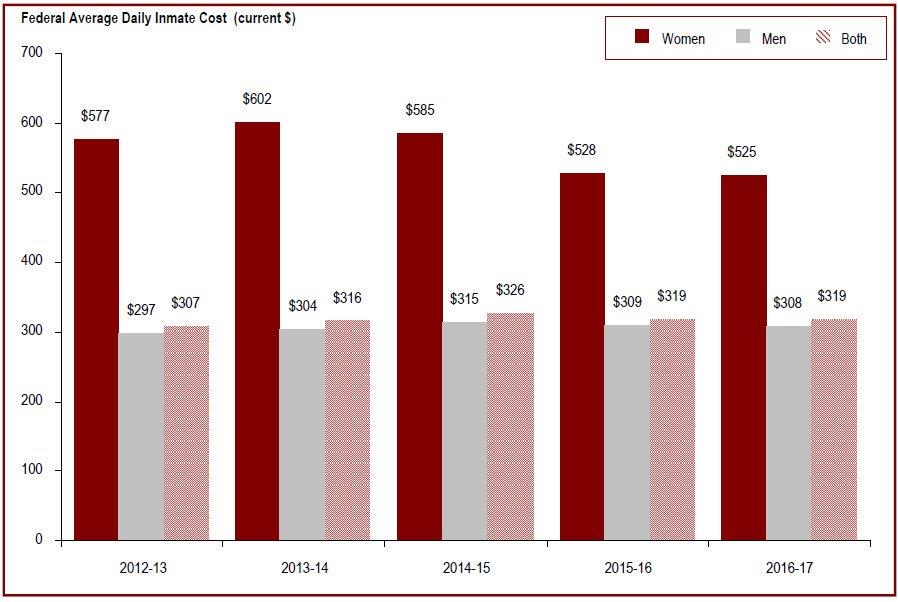
Source: Correctional Service Canada.
- The federal average daily inmate cost has increased from $307 in 2012-13 to $319 in 2016-17.
- In 2016-17, the annual average cost of keeping an inmate incarcerated was $116,473 per year, an increase from $112,197 per year in 2012-13. In 2016-17, the annual average cost of keeping a man incarcerated was $112,640 per year, whereas the annual average cost for incarcerating a woman was $191,843.
- The cost associated with maintaining an offender in the community is 74% less than the costs of maintaining an offender in custody ($30,639 per year versus $116,473 per year).
Note:
The average daily inmate cost includes those costs associated with the operation of the institutions such as salaries and employee benefit plan contributions, but excludes capital expenditures and expenditures related to CORCAN (a Special Operating Agency that conducts industrial operations within federal institutions). Total incarcerated and community includes additional NHQ & RHQ administrative costs which are not part of the Institutional and/or Community calculations. Offenders in the Community includes: Offenders on conditional release, statutory release or with Long-Term Supervision Order, under CSC supervision.
Figures may not add due to rounding.
The cost of keeping an inmate incarcerated
| Categories | Annual Average Costs per Offender (current $) | ||||
|---|---|---|---|---|---|
| 2012-13 | 2013-14 | 2014-15 | 2015-16 | 2016-17 | |
| Incarcerated Offenders | |||||
| Maximum Security (men only) | 148,330 | 156,768 | 160,094 | 155,848 | 158,113 |
| Medium Security (men only) | 99,207 | 101,583 | 105,750 | 106,868 | 105,349 |
| Minimum Security (men only) | 83,910 | 83,182 | 86,613 | 81,528 | 83,450 |
| Women's Facilities | 210,695 | 219,884 | 213,800 | 192,742 | 191,843 |
| *Exchange of Services Agreements (both) | 104,828 | 108,388 | 111,839 | 114,974 | 122,998 |
| Incarcerated Average | 112,197 | 115,310 | 119,152 | 116,364 | 116,473 |
| Offenders in the Community | 33,799 | 34,432 | 33,067 | 31,052 | 30,639 |
| Total Incarcerated and Community | 95,504 | 99,923 | 99,982 | 94,545 | 95,654 |
Source: Correctional Service Canada.
Note:
*The intent of an Exchange of Service Agreement is to detail the roles and responsibilities of each jurisdiction and include specific protocols regarding per diem rates, offender information sharing, and invoicing pertaining to the reciprocal exchange of offenders between jurisdictions.
The average daily inmate cost includes those costs associated with the operation of the institutions such as salaries and employee benefit plan contributions, but excludes capital expenditures and expenditures related to CORCAN (a Special Operating Agency that conducts industrial operations within federal institutions). Total incarcerated and community includes additional NHQ & RHQ administrative costs which are not part of the Institutional and/or Community calculations. Offenders in the Community includes: Offenders on conditional release, statutory release or with Long-Term Supervision Order, under CSC supervision.
Figures may not add due to rounding.
The number of Parole Board of Canada employees
Figure B4
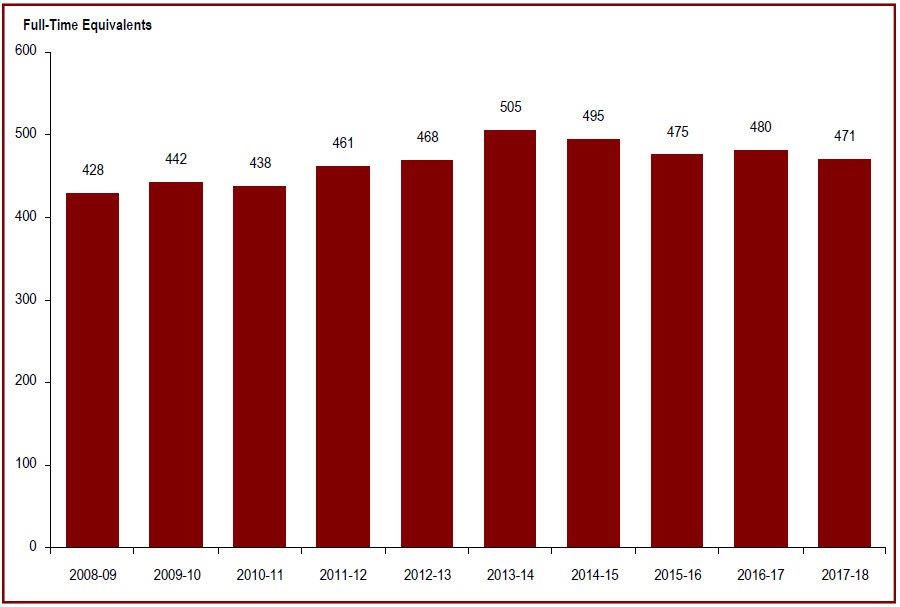
Source: Parole Board of Canada.
- The higher number of full-time equivalents used by the Parole Board of Canada in 2013-14 and 2014-15 were related to temporary human resources hired to work on clearing the Pardons backlog which accumulated prior to the application fee increase.
Note:
A full-time equivalent is a measure of the extent to which an employee represents a full person-year charge against a departmental budget.
Section 103 of the Corrections and Conditional Release Act limits the Parole Board of Canada to 60 full-time members.
The number of Parole Board of Canada employees
| Full-Time Equivalents | ||||||
|---|---|---|---|---|---|---|
| 2013-14 | 2014-15 | 2015-16 | 2016-17 | 2017-18 | ||
| Program Activity | ||||||
| Conditional Release Decisions | 325 | 325 | 322 | 321 | 317 | |
| Conditional Release Openness and Accountability | 53 | 54 | 42 | 44 | 42 | |
| Record Suspension and Clemency Recommendations | 79 | 69 | 52 | 59 | 48 | |
| Internal Services | 48 | 47 | 59 | 56 | 64 | |
| Total | 505 | 495 | 475 | 480 | 471 | |
| Types of Employees | ||||||
| Full-time Board Members | 42 | 42 | 41 | 39 | 38 | |
| Part-time Board Members | 20 | 18 | 18 | 17 | 20 | |
| Staff | 443 | 435 | 416 | 424 | 413 | |
| Total | 505 | 495 | 475 | 480 | 471 | |
Source: Parole Board of Canada.
Note:
A full-time equivalent is a measure of the extent to which an employee represents a full person-year charge against a departmental budget.
Section 103 of the Corrections and Conditional Release Act limits the Parole Board of Canada to 60 full-time members.
The number of employees in the Office of the Correctional Investigator
Figure B5
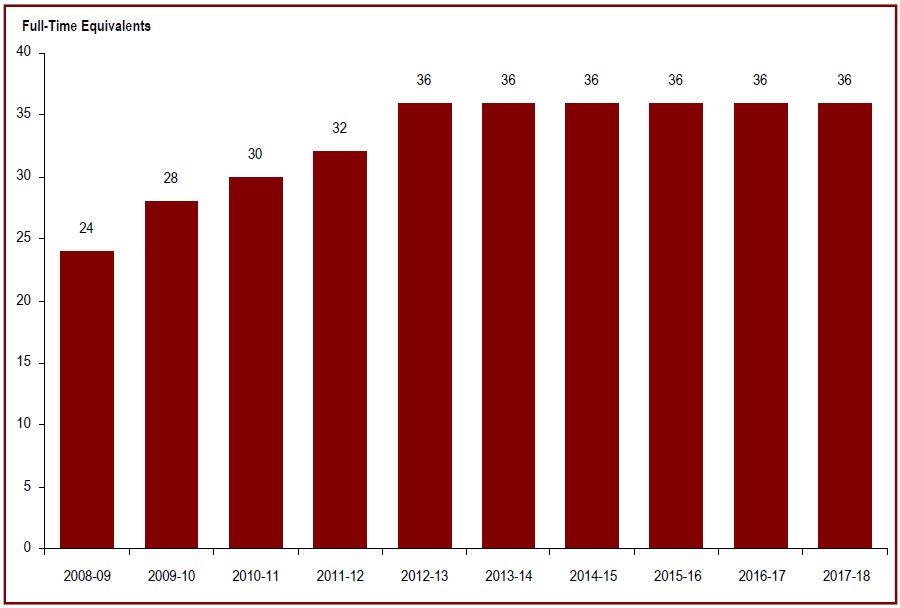
Source: Office of the Correctional Investigator.
- The total number of full-time equivalents at the Office of the Correctional Investigator has been stable over the last six years.
Note:
*The Office of the Correctional Investigator (OCI) may commence an investigation on receipt of a complaint by or on behalf of an offender or on its own initiative. Complaints are made by telephone, letter and during interviews with the OCI's investigative staff at federal correctional facilities. The dispositions in response to complaints involve a combination of internal responses (where the information or assistance sought by the offender can generally be provided by the OCI's investigative staff) and investigations (where, further to a review/analysis of law, policies and documentation, OCI investigative staff make an inquiry or several interventions with Correctional Service Canada and submit recommendations to address the complaint). Investigations vary considerably in terms of scope, complexity, duration and resources required.
The number of employees in the Office of the Correctional Investigator
| Full-Time Equivalents | |||||
|---|---|---|---|---|---|
| 2013-14 | 2014-15 | 2015-16 | 2016-17 | 2017-18 | |
| Types of Employees | |||||
| Correctional Investigator | 1 | 1 | 1 | 1 | 1 |
| Senior Management and Legal Counsel/Advisor | 5 | 5 | 5 | 5 | 5 |
| Investigative Services | 25 | 25 | 25 | 26 | 26 |
| Administrative Services | 5 | 5 | 5 | 4 | 4 |
| Total | 36 | 36 | 36 | 36 | 36 |
Source: Office of the Correctional Investigator.
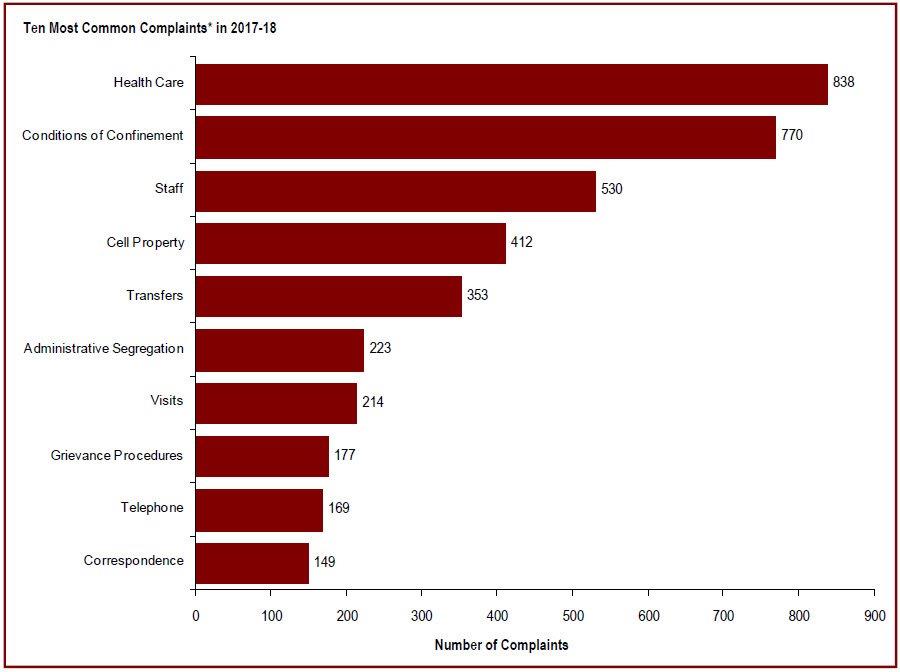
Health care is the most common area of offender complaint received by the Office of the Correctional Investigator
Figure B6
Source: Office of the Correctional Investigator.
- There were 5,846 complaints/enquiries received at the Office of the Correctional Investigator (OCI) in 2017-18.
- Health care (14.3%), conditions of confinement (13.1%), staff (9.0%), and cell effects (7.0%), accounted for 43.5% of all complaints.
Note:
*Excludes complaints received on issues outside the OCIs jurisdiction.
The Office of the Correctional Investigator (OCI) may commence an investigation on receipt of a complaint by or on behalf of an offender or on its own initiative. Complaints are made by telephone, letter and during interviews with the OCI's investigative staff at federal correctional facilities. The dispositions in response to complaints involve a combination of internal responses (where the information or assistance sought by the offender can generally be provided by the OCI's investigative staff) and investigations (where, further to a review/analysis of law, policies and documentation, OCI investigative staff make an inquiry or several interventions with Correctional Service Canada and submit recommendations to address the complaint). Investigations vary considerably in terms of scope, complexity, duration and resources required.
Health care is the most common area of offender complaint received by the Office of the Correctional Investigator
| Category of Complaint* | Number of Complaints | ||||
|---|---|---|---|---|---|
| 2013-14 | 2014-15 | 2015-16 | 2016-17 | 2017-18 | |
| Health Care | 649 | 816 | 911 | 903 | 838 |
| Conditions of Confinement | 699 | 616 | 808 | 761 | 770 |
| Staff | 427 | 422 | 429 | 408 | 530 |
| Cell Property | 335 | 360 | 426 | 497 | 412 |
| Transfers | 409 | 474 | 370 | 439 | 353 |
| Administrative Segregation | 369 | 383 | 272 | 269 | 223 |
| Visits | 236 | 244 | 290 | 285 | 214 |
| Outside OCI Jurisdiction | 270 | 238 | 245 | 259 | 193 |
| Telephone | 245 | 278 | 224 | 187 | 169 |
| Grievance Procedures | 163 | 195 | 188 | 173 | 177 |
| Request for Information | 147 | 181 | 152 | 213 | 126 |
| Financial Matters | 139 | 143 | 197 | 208 | 127 |
| Safety/Security of Offender(s) | 98 | 180 | 199 | 170 | 107 |
| Correspondence | 88 | 149 | 165 | 167 | 149 |
| Security Classification | 100 | 104 | 49 | 35 | 31 |
| Programs/Services | 93 | 145 | 143 | 135 | 129 |
| Decisions (General) | 95 | 101 | 117 | 170 | 128 |
| Case Preparation | 75 | 137 | 102 | 115 | 55 |
| Temporary Absence | 90 | 98 | 100 | 93 | 74 |
| Mental Health | 51 | 77 | 133 | 122 | 76 |
| Total of all Categories** | 5,557 | 6,382 | 6,651 | 6,844 | 5,846 |
Source: Office of the Correctional Investigator.
Note:
*These top categories of complaints are based on the sum totals for the five reported fiscal years between 2013-14 and 2017-18. The remaining categories, in order of total complaints received between 2013-14 and 2017-18, are as follows: Employment, Release Procedures, Food Services, Search and Seizure, Harassment, UNCATEGORIZED, Use of Force, Discipline, Legal Counsel, Claims, Cell Placement, Diets, Other, Religious/spiritual, Community Programs/Supervision, Inmate Requests, Programmes/Services, Operation/Decisions of the OCI, Sentence Administration, Death or Serious Injury, Discrimination, and Conditional Release.
**These totals represent all complaint categories.
The Office of the Correctional Investigator (OCI) may commence an investigation on receipt of a complaint by or on behalf of an offender or on its own initiative. Complaints are made by telephone, letter and during interviews with the OCI's investigative staff at federal correctional facilities. The dispositions in response to complaints involve a combination of internal responses (where the information or assistance sought by the offender can generally be provided by the OCI's investigative staff) and investigations (where, further to a review/analysis of law, policies and documentation, OCI investigative staff make an inquiry or several interventions with Correctional Service Canada and submit recommendations to address the complaint). Investigations vary considerably in terms of scope, complexity, duration and resources required.
Due to ongoing efforts at the OCI to streamline our administrative database and ensure accuracy in reporting, the numbers in this table will not always match those of past Corrections and Conditional Release Statistical Overviews, or OCI Annual Reports.
Section C - Offender Population
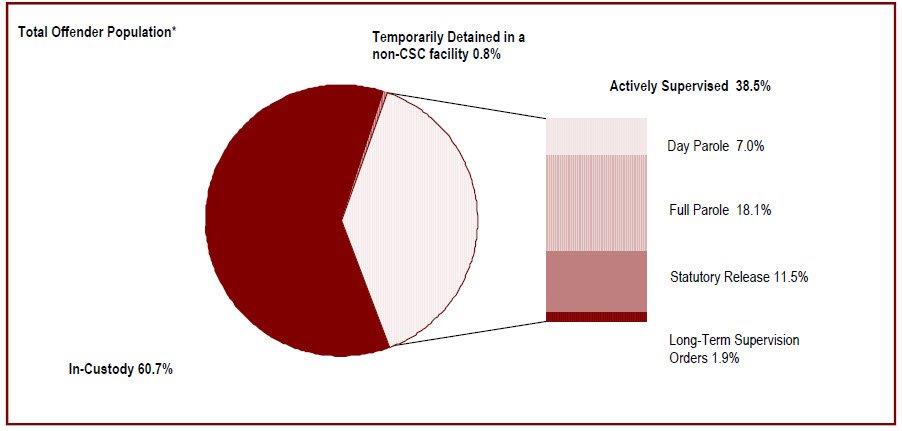
Offenders under the responsibility of Correctional Service Canada
Figure C1
Source: Correctional Service Canada.
Definitions:
CSC Facilities include all federal institutions, federally funded healing lodges, and healing lodges operated under Section 81 of the Corrections and Conditional Release Act.
Total Offender Population includes all active offenders, who are incarcerated in a CSC facility, offenders on temporary absence from a CSC facility, offenders who are temporarily detained, offenders who are actively supervised and offenders who are unlawfully at large for less than 90 days.
In-Custody includes all active offenders incarcerated in a CSC facility, offenders on temporary absence from a CSC facility, offenders who are temporarily detained in a CSC facility and offenders on remand in a CSC facility.
Temporarily Detained includes offenders who are physically held in a CSC facility or a non-CSC facility after being suspended for a breach of a parole condition or to prevent a breach of parole conditions.
Actively Supervised includes all active offenders on day parole, full parole or statutory release, as well as those who are in the community on long-term supervision orders.
In Community Under Supervision includes all active offenders on day parole, full parole, or statutory release, or in the community supervised on a long-term supervision order, offenders who are temporarily detained in a non-CSC facility, offenders who are unlawfully at large for less than 90 days, offenders on remand in a non-CSC facility, and offenders supervised and subject to an immigration hold by the Canada Border Services Agency.
In addition to Total Offender Population, there are excluded groups such as:
Federal jurisdiction offenders incarcerated in a Community Correctional Centre or in a non-CSC facility. Federal jurisdiction offenders deported/extradited including offenders for whom a deportation order has been enforced by the Canada Border Services Agency. Federal offenders on bail which includes offenders on judicial interim release; they have appealed their conviction or sentence and have been released to await results of a new trial. Escaped includes offenders who have absconded from either a correctional facility or while on a temporary absence and whose whereabouts are unknown. Unlawfully at Large for 90 days or more. This includes offenders who have been released to the community on day parole, full parole, statutory release, or a long-term supervision order for whom a warrant of suspension has been issued at least 90 days ago but has not yet been executed.
Note:
*In addition to this total offender population, 224 offenders were on bail, 126 offenders had escaped, 230 offenders serving a federal sentence were in custody in a non-CSC facility, 336 offenders were unlawfully at large for 90 days or more, and 422 offenders were deported. The definition of "Offender Population" changed from previous editions of the Corrections and Conditional Release Statistical Overview (CCRSO). As such, comparisons to editions of the CCRSO prior to 2016 should be done with caution.
Offenders under the responsibility of Correctional Service Canada
| Status | Offenders under the responsibility of Correctional Service Canada | |||||
|---|---|---|---|---|---|---|
| # | # | # | % | % | % | |
| In-Custody Population (CSC Facility) | 14,092 | 60.7 | ||||
| Incarcerated in CSC Facility | 13,264 | 57.1 | ||||
| Temporarily Detained in CSC Facility | 828 | 3.6 | ||||
| In Community under Supervision | 9,131 | 39.3 | ||||
| Temporarily Detained in Non-CSC Facility | 192 | 0.8 | ||||
| Actively Supervised | 8,939 | 38.5 | ||||
| Day Parole | 1,615 | 7.0 | ||||
| Full Parole | 4,209 | 18.1 | ||||
| Statutory Release | 2,672 | 11.5 | ||||
| Long Term Supervision Order | 443 | 1.9 | ||||
| Total | 23,223* | 100.0 | ||||
Source: Correctional Service Canada.
Note:
*In addition to this total offender population, 224 offenders were on bail, 126 offenders had escaped, 230 offenders serving a federal sentence were in custody in a non-CSC facility, 336 offenders were unlawfully at large for 90 days or more, and 422 offenders were deported.
The definition of "Offender Population" changed from previous editions of the Corrections and Conditional Release Statistical Overview (CCRSO). As such, comparisons to editions of the CCRSO prior to 2016 should be done with caution.
The number of offenders in custody in a CSC facility decreased in the last four years
Figure C2
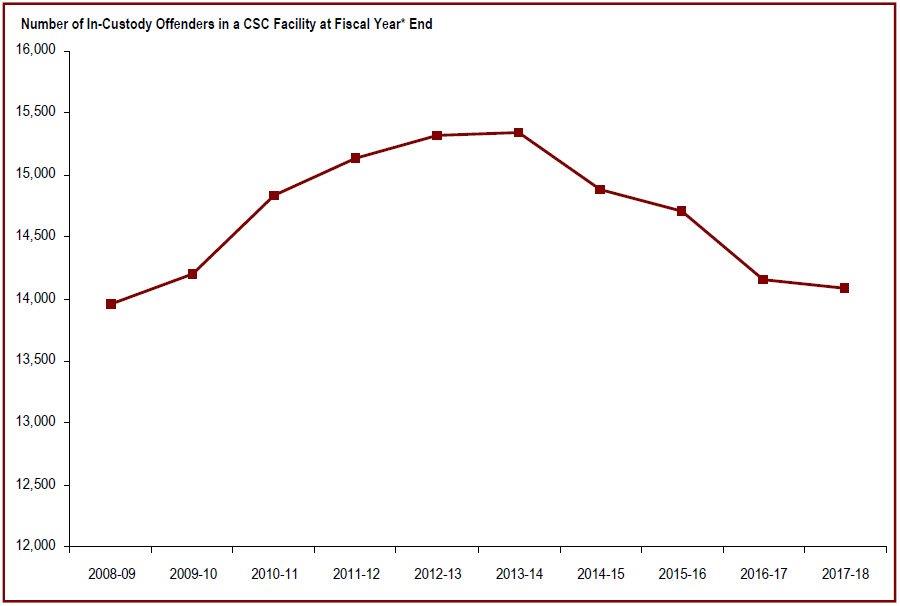
Source: Correctional Service Canada.
- From 2008-2009 to 2013-2014, the in-custody population increased consistently but started to decline in 2014-2015 and has been declining since then.
- From 2013-14 to 2015-16, the average provincial/territorial in-custody offender population increased by 4.1% from 24,455 to 25,448. The remand population increased by 13.0%, from 13,650 to 15,417 during this period. Since 2006-07, the number of remanded inmates has exceeded the number of sentenced inmates in provincial/territorial custody**.
Note:
*The data reflect the number of offenders in custody at the end of each fiscal year. A fiscal year runs from April 1 to March 31 of the following year.
The term "In-Custody in a CSC Facility" includes all active offenders incarcerated in a CSC facility, offenders on temporary absence from a CSC facility, offenders who are temporarily detained in a CSC facility and offenders on remand in a CSC facility.
**Source: Corrections Key Indicator Report for Adults and Youth, Canadian Centre for Justice Statistics, Statistics Canada.
The number of offenders in custody in a CSC facility decreased in the last four years
| Year | In Custody Offenders | |||||
|---|---|---|---|---|---|---|
| In-Custody in a CSC Facility*1 | Provincial/Territorial2 | Total | ||||
| Sentenced | Remand | Other/Temporary Detention | Total | |||
| 2008-09 | 13,960 | 9,931 | 13,548 | 311 | 23,790 | 37,750 |
| 2009-10 | 14,197 | 10,045 | 13,739 | 308 | 24,092 | 38,289 |
| 2010-11 | 14,840 | 10,922 | 13,086 | 427 | 24,435 | 39,275 |
| 2011-12 | 15,131 | 11,138 | 13,369 | 308 | 24,814 | 39,945 |
| 2012-13 | 15,318 | 11,138 | 13,739 | 308 | 25,185 | 40,503 |
| 2013-14 | 15,342 | 9,888 | 11,494 | 322 | 21,704 | 37,046 |
| 2014-15 | 14,886 | 10,364 | 13,650 | 441 | 24,455 | 39,341 |
| 2015-16 | 14,712 | 10,091 | 14,899 | 415 | 25,405 | 40,117 |
| 2016-17 | 14,159 | 9,710 | 15,417 | 321 | 25,448 | 39,607 |
| 2017-18 | 14,092 | -- | -- | -- | -- | -- |
Source: 1Correctional Service Canada.; 2Table 35-10-0154-01, Corrections Key Indicator Report for Adults and Youth, Canadian Centre for Justice Statistics, Statistics Canada.
Note:
*The data reflect the number of offenders in custody at the end of each fiscal year. A fiscal year runs from April 1 to March 31 of the following year.
The term "In Custody in a CSC Facility" includes all active offenders incarcerated in a CSC facility, offenders on temporary absence from a CSC facility, offend-ers who are temporarily detained in a CSC facility, and offenders on remand in a CSC facility.
The figures for provincial and territorial offenders reflect annual average counts.
--Data not available.
The number of admissions to federal jurisdiction has decreased
Figure C3
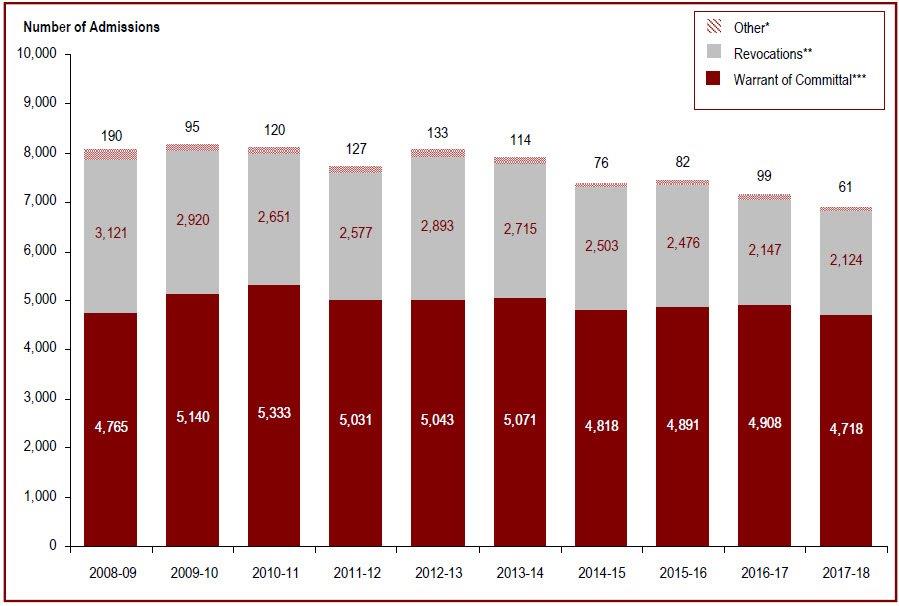
Source: Correctional Service Canada.
- After peaking at 8,155 in 2009-10, the number of admissions decreased by 15.4% to 6,903 in 2017-18.
- The number of warrant of committal admissions has fluctuated over the past decade but has declined by 11.5% compared to the highest point which occurred in fiscal year 2010-11.
- The number of women admitted to federal jurisdiction under warrants of committal increased by 14.1% from 312 in 2013-14 to 356 in 2017-18.
Note:
*"Other" includes transfers from other jurisdictions (exchange of services), terminations, transfers from foreign countries, and admissions where a release is interrupted as a consequence of a new conviction.
These numbers refer to the total number of admissions to a federal institution or Healing Lodge during each fiscal year and may be greater than the actual number of offenders admitted, since an individual offender may be admitted more than once in a given year. A fiscal year runs from April 1 to March 31 of the following year.
**Revocation is when an offender is admitted to federal custody after conditional release and before reaching warrant expiry. ***Warrant of Committal is a new admission to federal jurisdiction from the courts.
The number of admissions to federal jurisdiction has decreased
| 2013-14 | 2014-15 | 2015-16 | 2016-17 | 2017-18 | ||||||
|---|---|---|---|---|---|---|---|---|---|---|
| Women | Men | Women | Men | Women | Men | Women | Men | Women | Men | |
| Warrant of Committal | ||||||||||
| 1stFederal Sentence | 273 | 3,467 | 302 | 3,309 | 348 | 3,321 | 378 | 3,357 | 315 | 3,186 |
| 2ndor Subsequent Federal Sentence | 38 | 1,269 | 41 | 1,153 | 39 | 1,176 | 36 | 1,130 | 41 | 1,172 |
| Provincial Sentence | 1 | 23 | 0 | 13 | 1 | 6 | 0 | 7 | 0 | 4 |
| Subtotal | 312 | 4,759 | 343 | 4,475 | 388 | 4,503 | 414 | 4,494 | 356 | 4,362 |
| Total | 5,071 | 4,818 | 4,891 | 4,908 | 4,718 | |||||
| Revocations | 111 | 2,604 | 124 | 2,379 | 149 | 2,327 | 132 | 2,015 | 148 | 1,976 |
| Total | 2,715 | 2,503 | 2,476 | 2,147 | 2,124 | |||||
| Other* | 6 | 108 | 5 | 71 | 4 | 78 | 3 | 96 | 7 | 54 |
| Total | 114 | 76 | 82 | 99 | 61 | |||||
| 429 | 7,471 | 472 | 6,925 | 541 | 6,908 | 549 | 6,605 | 511 | 6,392 | |
| Total Admissions | 7,900 | 7,397 | 7,449 | 7,154 | 6,903 | |||||
Source: Correctional Service Canada.
Note:
*"Other" includes transfers from other jurisdictions (exchange of services), terminations, transfers from foreign countries, and admissions where a release is interrupted as a consequence of a new conviction.
These numbers refer to the total number of admissions to a federal institution or Healing Lodge during each fiscal year and may be greater than the actual number of offenders admitted, since an individual offender may be admitted more than once in a given year. A fiscal year runs from April 1 to March 31 of the following year.
The number of women admitted from the courts to federal jurisdiction decreased
Figure C4
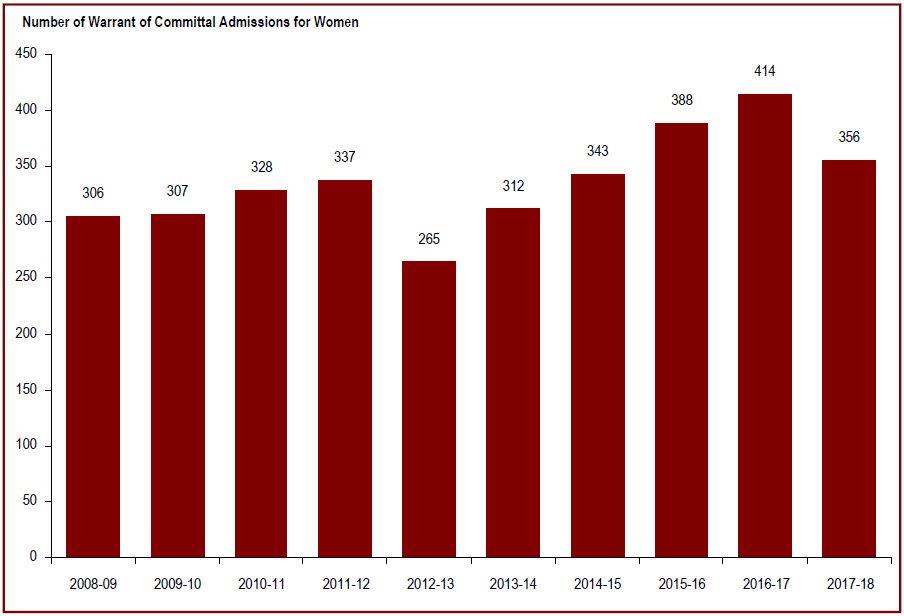
Source: Correctional Service Canada.
- In the last ten years, the number of women admitted to federal jurisdiction on a warrant of committal increased 16.3% from 306 in 2008-09 to 356 in 2017-18. During the same time period, there was a small decrease in the number of men admitted to federal jurisdiction on a warrant of committal from 4,459 in 2008-09 to 4,362 in 2017-18.
- Overall, women continue to represent a small proportion of the total number of warrant of committal admissions (i.e., 7.5% in 2017-18).
- At the end of fiscal year 2017-18, there were 676 women in custody within Correctional Service Canada facilities.
Note:
A warrant of committal is a new admission to federal jurisdiction from the courts.
The number of women admitted from the courts to federal jurisdiction decreased
| Year | Warrant of Committal Admissions | Total | |||
|---|---|---|---|---|---|
| Women | Men | ||||
| # | % | # | % | ||
| 2008-09 | 306 | 6.4 | 4,459 | 93.6 | 4,765 |
| 2009-10 | 307 | 6.0 | 4,833 | 94.0 | 5,140 |
| 2010-11 | 328 | 6.2 | 5,005 | 93.8 | 5,333 |
| 2011-12 | 337 | 6.7 | 4,694 | 93.3 | 5,031 |
| 2012-13 | 265 | 5.3 | 4,778 | 94.7 | 5,043 |
| 2013-14 | 312 | 6.2 | 4,759 | 93.8 | 5,071 |
| 2014-15 | 343 | 7.1 | 4,475 | 92.9 | 4,818 |
| 2015-16 | 388 | 7.9 | 4,503 | 92.1 | 4,891 |
| 2016-17 | 414 | 8.4 | 4,494 | 91.6 | 4,908 |
| 2017-18 | 356 | 7.5 | 4,362 | 92.5 | 4,718 |
Source: Correctional Service Canada.
Note:
A warrant of committal is a new admission to federal jurisdiction from the courts.
About half of the total offender population in CSC facilities is serving a sentence of less than five years
Figure C5
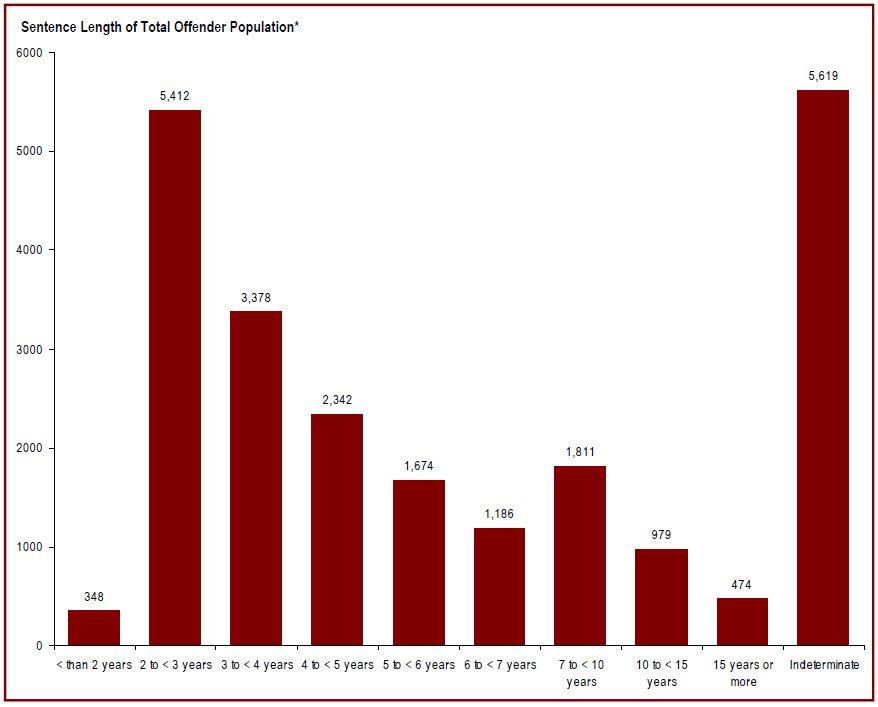
Source: Correctional Service Canada.
- In 2017-18, almost half (49.4%) of the total offender population was serving a sentence of less than 5 years with 23.3% serving a sentence between two years and less than three years.
- Almost one quarter (24.2%) of the total offender population was serving an indeterminate sentence. The total number of offenders with indeterminate sentences**has increased 7.0% since 2013-14 from 5,253 to 5,619 in 2017-18.
Note:
*Total Offender Population includes all active offenders who are incarcerated in a CSC facility, offenders on temporary absence from a CSC facility, offenders who are temporarily detained, offenders who are actively supervised, and offenders who are unlawfully at large for less than 90 days.
Offenders serving a sentence less than two years includes offenders transferred from foreign countries or offenders under a long-term supervision order who received a new sentence of less than two years.
**Indeterminate means that the offender's term of imprisonment does not have an end date. The Parole Board of Canada reviews the case after seven years and every two years after that.
About half of the total offender population in CSC facilities is serving a sentence of less than five years
| Sentence Length | 2013-14 | 2014-15 | 2015-16 | 2016-17 | 2017-18 | |||||
|---|---|---|---|---|---|---|---|---|---|---|
| # | % | # | % | # | % | # | % | # | % | |
| < than 2 years | 291 | 1.3 | 287 | 1.2 | 306 | 1.3 | 307 | 1.3 | 348 | 1.5 |
| 2 years to < 3 years | 5,296 | 22.9 | 5,241 | 22.8 | 5,367 | 23.3 | 5,391 | 23.4 | 5,412 | 23.3 |
| 3 years to < 4 years | 3,771 | 16.3 | 3,631 | 15.8 | 3,503 | 15.2 | 3,377 | 14.7 | 3,378 | 14.5 |
| 4 years to < 5 years | 2,447 | 10.6 | 2,422 | 10.5 | 2,393 | 10.4 | 2,382 | 10.3 | 2,342 | 10.1 |
| 5 years to < 6 years | 1,638 | 7.1 | 1,672 | 7.3 | 1,692 | 7.3 | 1,691 | 7.3 | 1,674 | 7.2 |
| 6 years to < 7 years | 1,100 | 4.8 | 1,104 | 4.8 | 1,136 | 4.9 | 1,143 | 5.0 | 1,186 | 5.1 |
| 7 years to < 10 years | 1,793 | 7.7 | 1,788 | 7.8 | 1,805 | 7.8 | 1,810 | 7.9 | 1,811 | 7.8 |
| 10 years to < 15 years | 954 | 4.1 | 936 | 4.1 | 940 | 4.1 | 951 | 4.1 | 979 | 4.2 |
| 15 years or more | 612 | 2.6 | 564 | 2.5 | 522 | 2.3 | 501 | 2.2 | 474 | 2.0 |
| Indeterminate | 5,253 | 22.7 | 5,316 | 23.2 | 5,393 | 23.4 | 5,492 | 23.8 | 5,619 | 24.2 |
| Total | 23,155 | 100 | 22,961 | 100 | 23,057 | 100 | 23,045 | 100 | 23,223 | 100 |
Source: Correctional Service Canada.
Note:
Total Offender Population includes all active offenders, who are incarcerated in a CSC facility, offenders on temporary absence from a CSC facility, offenders who are temporarily detained, offenders who are actively supervised, and offenders who are unlawfully at large for less than 90 days.
The group of offenders serving a sentence less than two years includes offenders transferred from foreign countries or offenders under a long-term supervision order who received a new sentence of less than two years.
Admission of older offenders to federal jurisdiction is increasing
Figure C6
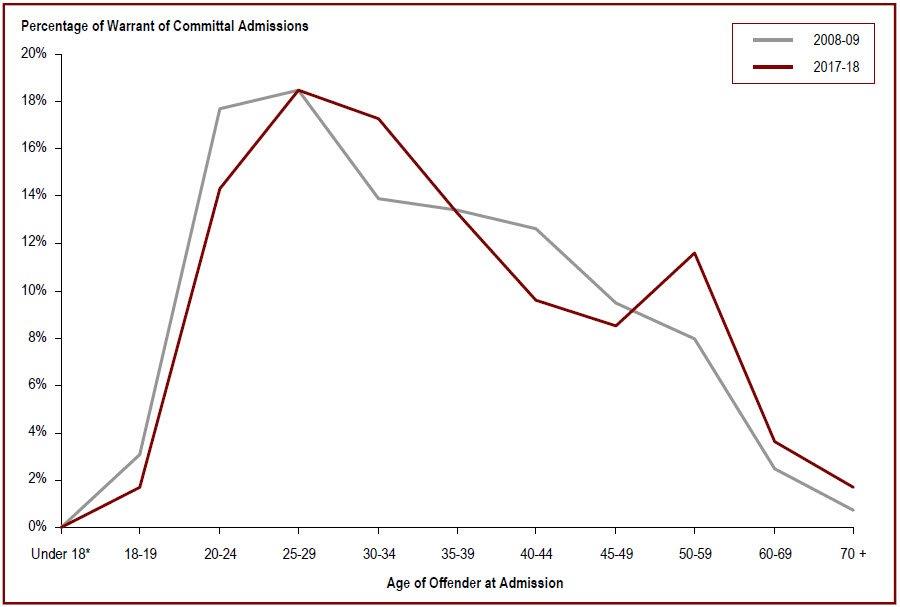
Source: Correctional Service Canada.
- In 2017-18, 32.8% of offenders admitted on a warrant of committal to federal jurisdiction were between the ages of 20 and 29, and 30.6% were between 30 and 39 years of age.
- The distribution of age upon admission is similar for both men and women.
- The median age of the population upon admission in 2017-18 was 34, compared to a median age of 33 in 2008-09.
- The number of offenders between the ages of 40 and 49 at admission decreased from 1,055 in 2008-09 to 850 in 2017-18, representing a 19.4% decrease.
- The number of offenders between the ages of 50 and 59 at admission increased from 382 in 2008-09 to 548 in 2017-18, representing a 43.5% increase.
Note:
*This offender was admitted to federal jurisdiction by the courts.
A warrant of committal is a new admission to federal jurisdiction from the courts.
Due to rounding, percentages may not add up to 100 percent.
Admission of older offenders to federal jurisdiction is increasing
| Age at Admission | 2008-2009 | 2017-18 | ||||||||||
|---|---|---|---|---|---|---|---|---|---|---|---|---|
| Women | Men | Total | Women | Men | Total | |||||||
| # | % | # | % | # | % | # | % | # | % | # | % | |
| Under 18 | 0 | 0.0 | 1* | 0.0 | 1* | 0.0 | 0 | 0.0 | 0 | 0.0 | 0 | 0.0 |
| 18 and 19 | 10 | 3.3 | 139 | 3.1 | 149 | 3.1 | 4 | 1.1 | 74 | 1.7 | 78 | 1.7 |
| 20 to 24 | 39 | 12.7 | 804 | 18.0 | 843 | 17.7 | 49 | 13.8 | 628 | 14.4 | 677 | 14.3 |
| 25 to 29 | 47 | 15.4 | 834 | 18.7 | 881 | 18.5 | 76 | 21.3 | 795 | 18.2 | 871 | 18.5 |
| 30 to 34 | 60 | 19.6 | 602 | 13.5 | 662 | 13.9 | 68 | 19.1 | 750 | 17.2 | 818 | 17.3 |
| 35 to 39 | 42 | 13.7 | 598 | 13.4 | 640 | 13.4 | 50 | 14.0 | 576 | 13.2 | 626 | 13.3 |
| 40 to 44 | 51 | 16.7 | 551 | 12.4 | 602 | 12.6 | 38 | 10.7 | 413 | 9.5 | 451 | 9.6 |
| 45 to 49 | 27 | 8.8 | 426 | 9.6 | 453 | 9.5 | 26 | 7.3 | 373 | 8.6 | 399 | 8.5 |
| 50 to 59 | 26 | 8.5 | 356 | 8.0 | 382 | 8.0 | 35 | 9.8 | 513 | 11.8 | 548 | 11.6 |
| 60 to 69 | 4 | 1.3 | 115 | 2.6 | 119 | 2.5 | 9 | 2.5 | 163 | 3.7 | 172 | 3.6 |
| 70 and over | 0 | 0.0 | 33 | 0.7 | 33 | 0.7 | 1 | 0.3 | 77 | 1.8 | 78 | 1.7 |
| Total | 306 | 4,459 | 4,765 | 365 | 4,362 | 4,718 | ||||||
Source: Correctional Service Canada.
Note:
*This offender was admitted to a youth correctional centre.
A warrant of committal is a new admission to federal jurisdiction from the courts.
Due to rounding, percentages may not add up to 100 percent.
The average age at admission is lower for Indigenous offenders than for non-Indigenous offenders
Figure C7
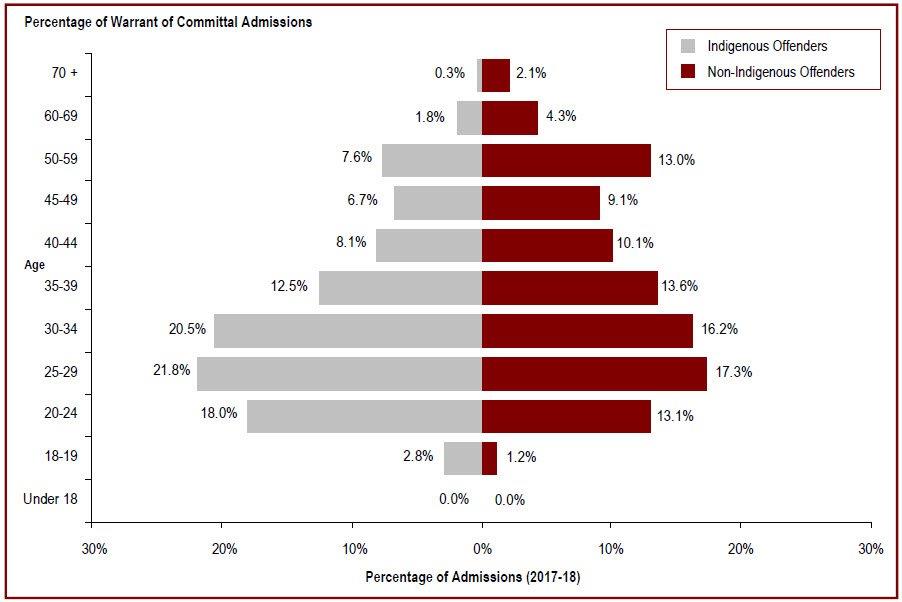
Source: Correctional Service Canada.
- Of those offenders admitted on a warrant of committal to federal jurisdiction in 2017-18, 42.6% of Indigenous offenders were under the age of 30, compared to 31.6% of non-Indigenous offenders.
- The median age of Indigenous offenders at admission was 31, compared to a median age of 35 for non-Indigenous offenders.
- The median age of Indigenous women offenders at admission was 30, compared to a median age of 35 for non-Indigenous women offenders.
Note:
A warrant of committal is a new admission to federal jurisdiction from the courts.
Due to rounding, percentages may not add up to 100 percent.
The average age at admission is lower for Indigenous offenders than for non-Indigenous offenders
| Age at Admission | 2008-2009 | 2017-18 | ||||||||||
|---|---|---|---|---|---|---|---|---|---|---|---|---|
| Indigenous | Non-Indigenous | Total | Indigenous | Non-Indigenous | Total | |||||||
| # | % | # | % | # | % | # | % | # | % | # | % | |
| Under 18 | 1* | 0.1 | 0 | 0.0 | 1* | 0.0 | 0 | 0.0 | 0 | 0.0 | 0 | 0.0 |
| 18 and 19 | 43 | 4.5 | 106 | 2.8 | 149 | 3.1 | 35 | 2.8 | 43 | 1.2 | 78 | 1.7 |
| 20 to 24 | 199 | 20.7 | 644 | 16.9 | 843 | 17.7 | 223 | 18.0 | 454 | 13.1 | 677 | 14.3 |
| 25 to 29 | 187 | 19.4 | 694 | 18.3 | 881 | 18.5 | 271 | 21.8 | 600 | 17.3 | 871 | 18.5 |
| 30 to 34 | 164 | 17.0 | 498 | 13.1 | 662 | 13.9 | 254 | 20.5 | 564 | 16.2 | 818 | 17.3 |
| 35 to 39 | 124 | 12.9 | 516 | 13.6 | 640 | 13.4 | 155 | 12.5 | 471 | 13.6 | 626 | 13.3 |
| 40 to 44 | 113 | 11.7 | 489 | 12.9 | 602 | 12.6 | 100 | 8.1 | 351 | 10.1 | 451 | 9.6 |
| 45 to 49 | 78 | 8.1 | 375 | 9.9 | 453 | 9.5 | 83 | 6.7 | 316 | 9.1 | 399 | 8.5 |
| 50 to 59 | 47 | 4.9 | 335 | 8.8 | 382 | 8.0 | 95 | 7.6 | 453 | 13.0 | 548 | 11.6 |
| 60 to 69 | 6 | 0.6 | 113 | 3.0 | 119 | 2.5 | 22 | 1.8 | 150 | 4.3 | 172 | 3.6 |
| 70 and over | 1 | 0.1 | 32 | 0.8 | 33 | 0.7 | 4 | 0.3 | 74 | 2.1 | 78 | 1.7 |
| Total | 963 | 3,802 | 4,765 | 1,242 | 3,476 | 4,718 | ||||||
Source: Correctional Service Canada.
Note:
*This offender was admitted to a youth correctional centre.
A warrant of committal is a new admission to federal jurisdiction from the courts.
Due to rounding, percentages may not add up to 100 percent.
25% of the in-custody offender population is age 50 or over
Figure C8
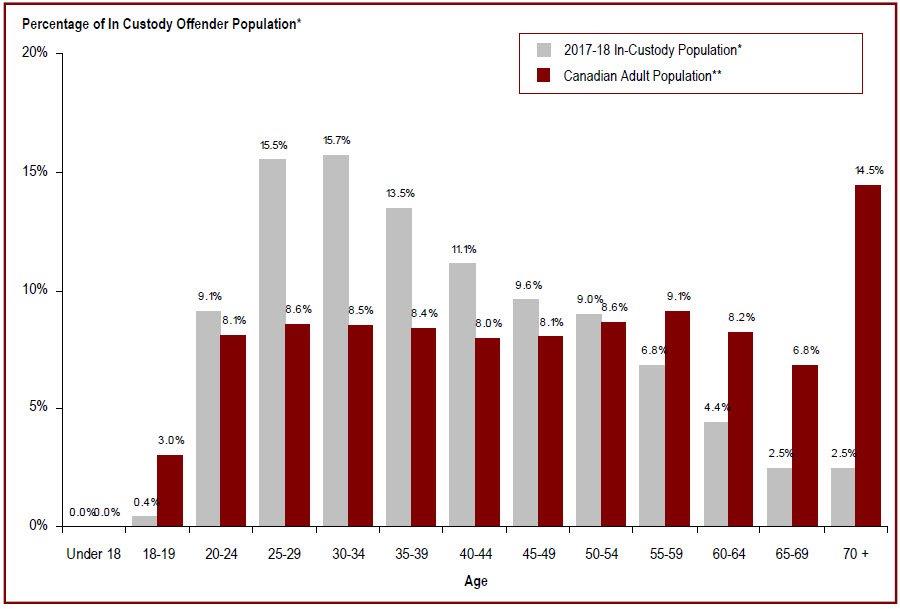
Source: Correctional Service Canada; Statistics Canada.
- In 2017-18, 54.1% of in-custody offenders were under the age of 40.
- In 2017-18, 25.2% of the in-custody offender population was age 50 and over.
- ***The community offender population was older than the in-custody population; 38.0% of offenders in the community were age 50 and over, compared to 25.2% of the in-custody offenders in this age group.
Note:
*In-custody population includes all active offenders incarcerated in a CSC facility, offenders on temporary absence from a CSC facility, offenders who are temporarily detained in a CSC facility, and offenders on remand in a CSC facility.
**2014 Postcensal Estimates, Demography Division, and Statistics Canada and include only those age 18 and older.
***In community under supervision includes all active offenders on day parole, full parole, statutory release, or in the community supervised on a long-term supervision order, offenders who are temporarily detained in a non-CSC facility, offenders who are unlawfully at large for less than 90 days, offenders on remand in a non-CSC facility, and offenders supervised and subject to an immigration hold by the Canada Border Services Agency.
Due to rounding, percentage may not add up to 100 percent.
25% of the in-custody offender population is age 50 or over
| Age | In-Custody* | In Community Under Supervision** | Total | % of Canadian Adult Population*** | |||
|---|---|---|---|---|---|---|---|
| # | % | # | % | # | % | % | |
| Under 18 | 0 | 0.0 | 0 | 0.0 | 0 | 0.0 | 0.0 |
| 18 and 19 | 55 | 0.4 | 5 | 0.1 | 60 | 0.3 | 3.0 |
| 20 to 24 | 1,282 | 9.1 | 462 | 5.1 | 1,744 | 7.5 | 8.1 |
| 25 to 29 | 2,179 | 15.5 | 1,030 | 11.3 | 3,209 | 13.8 | 8.6 |
| 30 to 34 | 2,211 | 15.7 | 1,156 | 12.7 | 3,367 | 14.5 | 8.5 |
| 35 to 39 | 1,900 | 13.5 | 1,145 | 12.5 | 3,045 | 13.1 | 8.4 |
| 40 to 44 | 1,560 | 11.1 | 930 | 10.2 | 2,490 | 10.7 | 8.0 |
| 45 to 49 | 1,357 | 9.6 | 935 | 10.2 | 2,292 | 9.9 | 8.1 |
| 50 to 54 | 1,275 | 9.0 | 900 | 9.9 | 2,175 | 9.4 | 8.6 |
| 55 to 59 | 961 | 6.8 | 810 | 8.9 | 1,771 | 7.6 | 9.1 |
| 60 to 64 | 615 | 4.4 | 646 | 7.1 | 1,261 | 5.4 | 8.2 |
| 65 to 69 | 349 | 2.5 | 472 | 5.2 | 821 | 3.5 | 6.8 |
| 70 and over | 348 | 2.5 | 640 | 7.0 | 988 | 4.3 | 14.5 |
| Total | 14,092 | 100.0 | 9,131 | 100.0 | 23,223 | 100.0 | 100.0 |
Source: Correctional Service Canada; Statistics Canada.
Note:
*In-custody population includes all active offenders incarcerated in a CSC facility, offenders on temporary absence from a CSC facility, offenders who are tem-porarily detained in a CSC facility, and offenders on remand in a CSC facility.
**In community under supervision includes all active offenders on day parole, full parole, statutory release, or in the community supervised on a long-term super-vision order, offenders who are temporarily detained in a non-CSC facility, offenders who are unlawfully at large for less than 90 days, offenders on remand in a non-CSC facility, and offenders supervised and subject to an immigration hold by the Canada Border Services Agency.
Due to rounding, percentage may not add up to 100 percent.
***2014 Postcensal Estimates, Demography Division, and Statistics Canada and include only those age 18 and older.
56% of offenders are Caucasian
Figure C9
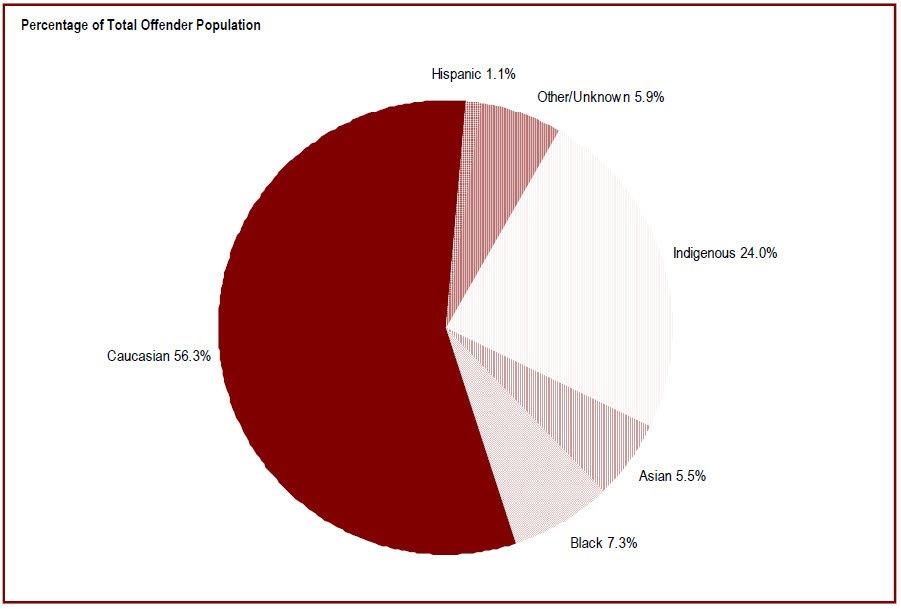
Source: Correctional Service Canada.
- The federal offender population is becoming more diverse, as evidenced by the decrease in the proportion of Caucasian offenders (from 60.8% in 2013-14 to 56.3% in 2017-18).
- Between 2013-14 and 2017-18, the Indigenous population has increased by 14.7% (from 4,856 to 5,572).
- Indigenous offenders represented 24.0% of the 2017-18 total federal offender population and 26.3% of 2017-18 warrant of committal admissions to federal jurisdiction.
Note:
The offenders themselves identify to which race they belong. The list of categories may not fully account for all races and the race groupings information has changed starting in 2012-13; therefore, the comparisons before and after 2012-13 should be done with caution.
According to Correctional Service of Canada, "Indigenous" includes offenders who are Inuit, Innu, Métis and North American Indian. "Asian" includes offenders who are Arab, Arab/West Asian, Asian-East and Southeast, Asian-South, Asian West, Asiatic, Chinese, East Indian, Filipino, Japanese, Korean, South Asian, South East Asian. "Asiatic" includes offenders who are Asian-East and Southeast, Asian-South, Asian West, and Asiatic. "Hispanic" includes offenders who are Hispanic and Latin American. "Black" includes offenders who are Black. "Other/Unknown" includes offenders who are European French, European-Eastern, European-Northern, European-Southern, European-Western, Multiracial/Ethnic, Oceania, British Isles, Caribbean, Sub-Sahara African, offenders unable to identify to one race, other and unknown.
The data reflect all active offenders, who are incarcerated in a CSC facility, offenders on temporary absence from a CSC facility, offenders who are temporarily detained, offenders who are actively supervised, and offenders who are unlawfully at large for less than 90 days.
The data reflect the number of offenders active at the end of each fiscal year. A fiscal year runs from April 1 to March 31 of the following year.
Due to rounding, percentages may not add up to 100 percent.
56% of offenders are Caucasian
| Total Offender Population | ||||
|---|---|---|---|---|
| 2013-14 | 2017-18 | |||
| # | % | # | % | |
| Indigenous | 4,856 | 21.0 | 5,572 | 24.0 |
| Inuit | 218 | 0.9 | 203 | 0.9 |
| Métis | 1,317 | 5.7 | 1,619 | 7.0 |
| North American Indian | 3,321 | 14.3 | 3,750 | 16.1 |
| Asian | 1,349 | 5.8 | 1,268 | 5.5 |
| Arab/West Asian | 352 | 1.5 | 360 | 1.6 |
| Asiatic* | 197 | 0.9 | 377 | 1.6 |
| Chinese | 143 | 0.6 | 97 | 0.4 |
| East Indian | 15 | 0.1 | 13 | 0.1 |
| Filipino | 66 | 0.3 | 75 | 0.3 |
| Japanese | 6 | 0.0 | 8 | 0.0 |
| Korean | 19 | 0.1 | 16 | 0.1 |
| South East Asian | 326 | 1.4 | 196 | 0.8 |
| South Asian | 225 | 1.0 | 126 | 0.5 |
| Black | 1,904 | 8.2 | 1,700 | 7.3 |
| Caucasian | 14,084 | 60.8 | 13,072 | 56.3 |
| Hispanic | 249 | 1.1 | 245 | 1.1 |
| Hispanic | 7 | 0.0 | 7 | 0.0 |
| Latin American | 242 | 1.0 | 238 | 1.0 |
| Other/Unknown | 713 | 3.1 | 1,366 | 5.9 |
| Total | 23,155 | 100.0 | 23,223 | 100.0 |
Source: Correctional Service Canada.
Note:
*Total for Asiatic includes Asian-East and Southeast, Asian South, Asian West, and Asiatic.
The offenders themselves identify to which race they belong. The list of categories may not fully account for all races and the race groupings information has changed starting in 2012-13; therefore, the comparisons before and after 2012-13 should be done with caution.
According to Correctional Service of Canada, "Indigenous" includes offenders who are Inuit, Innu, Métis and North American Indian. "Asian" includes offenders who are Arab, Arab/West Asian, Asian-East and Southeast, Asian-South, Asian West, Asiatic, Chinese, East Indian, Filipino, Japanese, Korean, South Asian, South East Asian. “Asiatic” includes offenders who are Asian-East and Southeast, Asian-South, Asian West, and Asiatic. "Hispanic" includes offenders who are Hispanic and Latin American. "Black" includes offenders who are Black. "Other/Unknown" includes offenders who are European French, European-Eastern, European-Northern, European-Southern, European-Western, Multiracial/Ethnic, Oceania, British Isles, Caribbean, Sub-Sahara African, offenders unable to identify to one race, other and unknown.
The data reflect all active offenders, who are incarcerated in a CSC facility, offenders on temporary absence from a CSC facility, offenders who are temporarily detained, offenders who are actively supervised, and offenders who are unlawfully at large for less than 90 days.
The data reflect the number of offenders active at the end of each fiscal year. A fiscal year runs from April 1 to March 31 of the following year.
Due to rounding, percentages may not add up to 100 percent.
The religious identification of the offender population is diverse
Figure C10
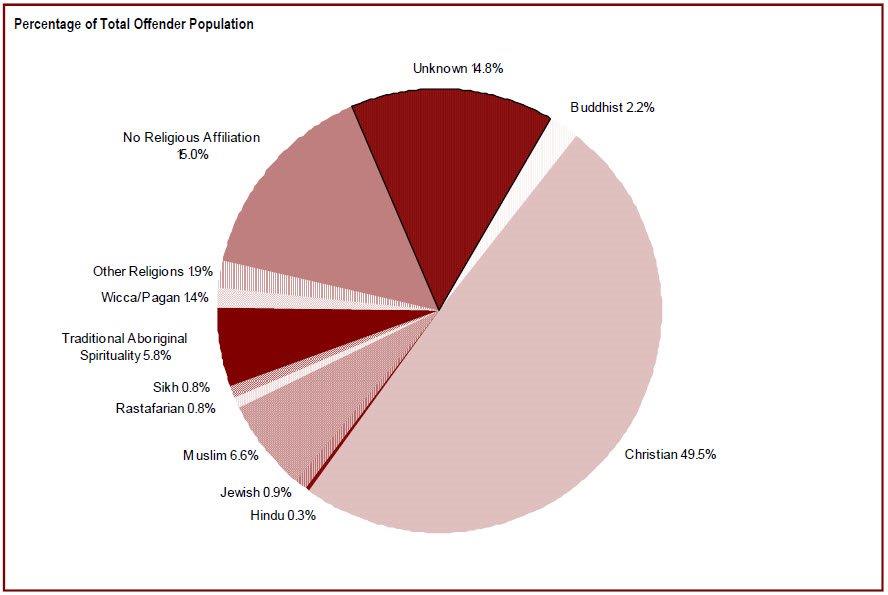
Source: Correctional Service Canada.
- The religious identification of the Offender population is diverse. While the proportion of offenders who identified as Christian still represented the majority, their proportions decreased from 56.1% in 2013-2014 to 49.5% in 2017-2018.
- Religious identification was unknown for 14.8% of offenders, and 15.0% stated they had no religion.
- Religion groupings have changed from previous publication to reflect the same groupings as Statistics Canada.
Note:
Religious identification is self-declared by offenders while they are incarcerated, and the categories are not comprehensive; therefore, the reader should interpret these data with caution. Buddhist includes offenders who are Buddhist, Mahayana Buddhist, Theravadan Buddhist and Vajrayana Buddhist. Christian includes offenders who are Amish, Anglican (Episcopal Church of England), Antiochian Orthodox, Apostolic Christian Church, Armenian Orthodox/Apostolic, Associated Gospel, Assyrian Chaldean Catholic, Baptist, Brethren In Christ, Bulgarian Orthodox, Canadian Reformed Church, Catholic- Greek, Catholic-Roman, Catholic-Ukranian, Catholic Non-Specific, Churches of Christ/Christian Churches, Charismatic, Christadelphian, Christian & Missionary Alliance, Christian Congregational, Christian Non Specific, Christian Or Plymouth Brethren, Christian Orthodox, Christian Reformed, Christian Reformed Church, Christian Science, Church of Christ Scientist, Church of God, Church of Jesus Christ of Latter-Day Saint, Community of Christ, Coptic Orthodox, Doukhobor, Dutch Reformed Church, Ethiopian Orthodox, Evangelical, Evangelical Free Church , Evangelical Missionary Church, Free Methodist, Free Reformed Church, Grace Communion International, Greek Orthodox, Hutterite, Iglesia Ni Cristo, Jehovah's Witnesses, Lutheran, Macedonian Orthodox, Maronite, Melkite, Mennonite, Methodist Christian, Metropolitan Community Church, Mission de l'Esprit Saint, Moravian, Mormon (Latter Day Saints), Nazarene Christian, Netherlands Reformed, New Apostolic, Pentecostal (4-Square), Pentecostal Assembly of God, Pentecôtiste, Philadelphia Church of God, Presbyterian, Protestant Non-Specific, Quaker (Society of Friends), Reformed Christian, Romanian Orthodox, Russian Orthodox, Salvation Army, Serbian Orthodox, Seventh Day Adventist, Shaker, Swedenborgian (New Church), Syrian/Syriac Orthodox, Ukrainian Catholic, Ukrainian Orthodox, United Church, United Reformed Church, Vineyard Christian Fellowship, Wesleyan Christian and Worldwide Church of God. Hindu includes offenders who are Hindu and Siddha Yoga. Jewish includes offenders who are Jewish Orthodox, Jewish Reformed and Judaism. Muslim includes offenders who are Muslim and Sufism. Rastafarian includes offenders who are Rastafarian. Sikh includes offenders who are Sikh. Traditional Aboriginal Spirituality includes offenders who are Aboriginal Spirituality Catholic, Aboriginal Spirituality Protestant, Native Spirituality, Catholic - Native Spirituality, Native Spirituality Protestant and Aboriginal Spirituality. Wiccan/Pagan includes offenders who are Asatru Paganism, Druidry Paganism, Pagan and Wicca. Other Religion includes offenders who are Baha'i, Eckankar, Gnostic, Independent Spirituality, Jain, Krishna, New Age, New Thought-Unity-Religious Science, Other, Pantheist, Rosicrucian, Satanist, Scientology, Shintoïste, Spiritualist, Taoism, Transcendental Meditation, Unification Church, Unitarian, Visnabha and Zoroastrian. No religion Affiliation includes offenders who are Agnostic, Atheist, Humanist and offenders who have no religion affiliation. The data reflect all active offenders, who are incarcerated in a CSC facility, offenders on temporary absence from a CSC facility, offenders who are temporarily detained, offenders who are actively supervised, and offenders who are unlawfully at large for less than 90 days. The data reflect the number of offenders active at the end of each fiscal year. A fiscal year runs from April 1 to March 31 of the following year.
Due to rounding, percentages may not add to 100 percent.
The religious identification of the offender population is diverse
| Total Offender Population | ||||
|---|---|---|---|---|
| 2013-14 | 2017-18 | |||
| # | % | # | % | |
| Buddhist | 477 | 2.1 | 508 | 2.2 |
| Christian | 12,986 | 56.1 | 11,503 | 49.5 |
| Hindu | 47 | 0.2 | 63 | 0.3 |
| Jewish | 177 | 0.8 | 220 | 0.9 |
| Muslim | 1,264 | 5.5 | 1,539 | 6.6 |
| Rastafarian | 171 | 0.7 | 178 | 0.8 |
| Sikh | 180 | 0.8 | 188 | 0.8 |
| Traditional Aboriginal Spirituality | 1,305 | 5.6 | 1,338 | 5.8 |
| Wicca/Pagan | 138 | 0.6 | 318 | 1.4 |
| Other Religions | 521 | 2.3 | 442 | 1.9 |
| No Religion Affiliation | 3,816 | 16.5 | 3,480 | 15.0 |
| Unknown | 2,073 | 9.0 | 3,446 | 14.8 |
| Total | 23,155 | 100.0 | 23,223 | 100.0 |
Source: Correctional Service Canada.
Note:
Religious identification is self-declared by offenders while they are incarcerated, and the categories are not comprehensive; therefore, the reader should interpret these data with caution. Buddhist includes offenders who are Buddhist, Mahayana Buddhist, Theravadan Buddhist and Vajrayana Buddhist. Christian includes offenders who are Amish, Anglican (Episcopal Church of England), Antiochian Orthodox, Apostolic Christian Church, Armenian Orthodox/Apostolic, Associated Gospel, Assyrian Chaldean Catholic, Baptist, Brethren In Christ, Bulgarian Orthodox, Canadian Reformed Church, Catholic- Greek, Catholic-Roman, Catholic-Ukranian, Catholic Non-Specific, Churches of Christ/Christian Churches, Charismatic, Christadelphian, Christian & Missionary Alliance, Christian Congregational, Christian Non Specific, Christian Or Plymouth Brethren, Christian Orthodox, Christian Reformed, Christian Reformed Church, Christian Science, Church of Christ Scientist, Church of God, Church of Jesus Christ of Latter-Day Saint, Community of Christ, Coptic Orthodox, Doukhobor, Dutch Reformed Church, Ethiopian Orthodox, Evangelical, Evangelical Free Church , Evangelical Missionary Church, Free Methodist, Free Reformed Church, Grace Communion International, Greek Orthodox, Hutterite, Iglesia Ni Cristo, Jehovah's Witnesses, Lutheran, Macedonian Orthodox, Maronite, Melkite, Mennonite, Methodist Christian, Metropolitan Community Church, Mission de l'Esprit Saint, Moravian, Mormon (Latter Day Saints), Nazarene Christian, Netherlands Reformed, New Apostolic, Pentecostal (4-Square), Pentecostal Assembly of God, Pentecôtiste, Philadelphia Church of God, Presbyterian, Protestant Non-Specific, Quaker (Society of Friends), Reformed Christian, Romanian Orthodox, Russian Orthodox, Salvation Army, Serbian Orthodox, Seventh Day Adventist, Shaker, Swedenborgian (New Church), Syrian/Syriac Orthodox, Ukrainian Catholic, Ukrainian Orthodox, United Church, United Reformed Church, Vineyard Christian Fellowship, Wesleyan Christian and Worldwide Church of God. Hindu includes offenders who are Hindu and Siddha Yoga. Jewish includes offenders who are Jewish Orthodox, Jewish Reformed and Judaism. Muslim includes offenders who are Muslim and Sufism. Rastafarian includes offenders who are Rastafarian. Sikh includes offenders who are Sikh. Traditional Aboriginal Spirituality includes offenders who are Aboriginal Spirituality Catholic, Aboriginal Spirituality Protestant, Native Spirituality, Catholic - Native Spirituality, Native Spirituality Protestant and Aboriginal Spirituality. Wiccan/Pagan includes offenders who are Asatru Paganism, Druidry Paganism, Pagan and Wicca. Other Religion includes offenders who are Baha'i, Eckankar, Gnostic, Independent Spirituality, Jain, Krishna, New Age, New Thought-Unity-Religious Science, Other, Pantheist, Rosicrucian, Satanist, Scientology, Shintoïste, Spiritualist, Taoism, Transcendental Meditation, Unification Church, Unitarian, Visnabha and Zoroastrian. No religion Affiliation includes offenders who are Agnostic, Atheist, Humanist and offenders who have no religion affiliation. The data reflect all active offenders, who are incarcerated in a CSC facility, offenders on temporary absence from a CSC facility, offenders who are temporarily detained, offenders who are actively supervised, and offenders who are unlawfully at large for less than 90 days. The data reflect the number of offenders active at the end of each fiscal year. A fiscal year runs from April 1 to March 31 of the following year.
Due to rounding, percentages may not add to 100 percent.
The proportion of Indigenous offenders in custody is higher than for non-Indigenous offenders
Figure C11
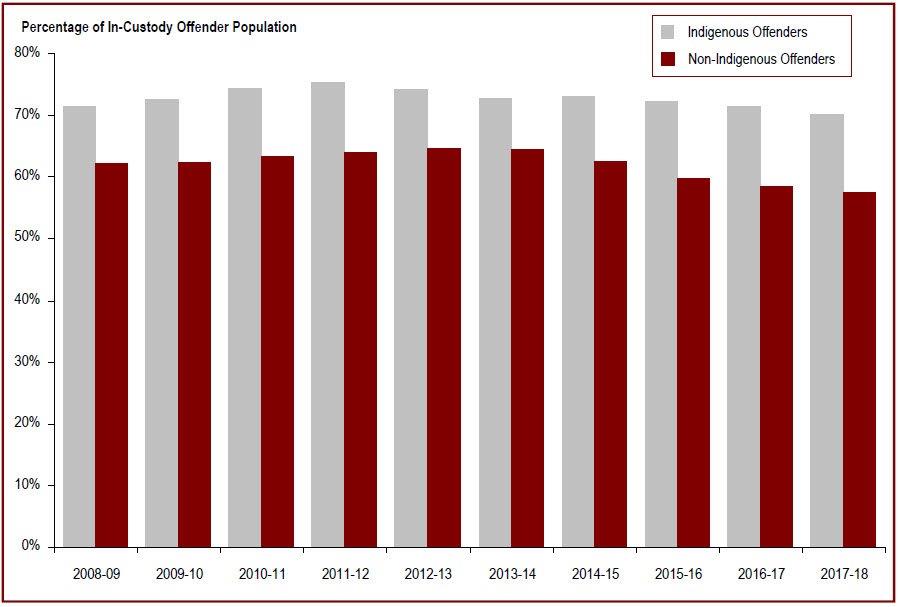
Source: Correctional Service Canada.
- At the end of fiscal year 2017-18, the proportion of offenders in custody was about 12.7% greater for Indigenous offenders (70.3%) than for non-Indigenous offenders (57.6%).
- Indigenous women in custody represent 39.9% of all in-custody women while Indigenous men who were in custody represented 27.2% of all men in custody.
- In 2017-18, Indigenous offenders represented 24.0% of the total offender population.
- Indigenous offenders accounted for 27.8% of the in-custody population and 18.1% of the community population in 2017-18.
Note:
Total Offender Population includes all active offenders, who are incarcerated in a CSC facility, offenders on temporary absence from a CSC facility, offenders who are temporarily detained, offenders who are actively supervised, and offenders who are unlawfully at large for less than 90 days.
In Custody includes all active offenders incarcerated in a CSC facility, offenders on temporary absence from a CSC facility, offenders who are temporarily detained in a CSC facility and offenders on remand in a CSC facility.
In Community Under Supervision includes all active offenders on day parole, full parole, statutory release, or in the community supervised on a long-term supervision order, offenders who are temporarily detained in a non-CSC facility, offenders who are unlawfully at large for less than 90 days, offenders on remand in a non-CSC facility, and offenders supervised and subject to an immigration hold by the Canada Border Services Agency.
The data reflect the number of offenders active at the end of each fiscal year. A fiscal year runs from April 1 to March 31 of the following year.
The proportion of Indigenous offenders in custody is higher than for non-Indigenous offenders
| In-Custody Population | In Community Under Supervision | Total | ||||
|---|---|---|---|---|---|---|
| # | % | # | % | |||
| Men | ||||||
| 2014-15 | Indigenous | 3,417 | 73.4 | 1,238 | 26.6 | 4,655 |
| Non-Indigenous | 10,788 | 63.0 | 6,327 | 37.0 | 17,115 | |
| Total | 14,205 | 65.3 | 7,565 | 34.7 | 21,770 | |
| 2015-16 | Indigenous | 3,532 | 73.2 | 1,293 | 26.8 | 4,825 |
| Non-Indigenous | 10,485 | 61.8 | 6,468 | 38.2 | 16,953 | |
| Total | 14,017 | 64.4 | 7,761 | 35.6 | 21,778 | |
| 2016-17 | Indigenous | 3,545 | 72.2 | 1,362 | 27.8 | 4,907 |
| Non-Indigenous | 9,922 | 59.0 | 6,885 | 41.0 | 16,807 | |
| Total | 13,467 | 62.0 | 8,247 | 38.0 | 21,714 | |
| 2017-18 | Indigenous | 3,647 | 71.4 | 1,464 | 28.6 | 5,111 |
| Non-Indigenous | 9,769 | 58.4 | 6,946 | 41.6 | 16,715 | |
| Total | 13,416 | 61.5 | 8,410 | 38.5 | 21,826 | |
| Women | ||||||
| 2014-15 | Indigenous | 240 | 67.8 | 114 | 32.2 | 354 |
| Non-Indigenous | 441 | 52.7 | 396 | 47.3 | 837 | |
| Total | 681 | 57.2 | 510 | 42.8 | 1,191 | |
| 2015-16 | Indigenous | 251 | 62.4 | 151 | 37.6 | 402 |
| Non-Indigenous | 444 | 50.6 | 433 | 49.4 | 877 | |
| Total | 695 | 54.3 | 584 | 45.7 | 1,279 | |
| 2016-17 | Indigenous | 253 | 61.0 | 162 | 39.0 | 415 |
| Non-Indigenous | 439 | 47.9 | 477 | 52.1 | 916 | |
| Total | 692 | 52.0 | 639 | 48.0 | 1,331 | |
| 2017-18 | Indigenous | 270 | 58.6 | 191 | 41.4 | 461 |
| Non-Indigenous | 406 | 43.4 | 530 | 56.6 | 936 | |
| Total | 676 | 48.4 | 721 | 51.6 | 1,397 | |
Source: Correctional Service Canada.
Note:
Total Offender Population includes all active offenders, who are incarcerated in a CSC facility, offenders on temporary absence from a CSC facility, offenders who are temporarily detained, offenders who are actively supervised, and offenders who are unlawfully at large for less than 90 days.
In Custody includes all active offenders incarcerated in a CSC facility, offenders on temporary absence from a CSC facility, offenders who are temporarily detained in a CSC facility and offenders on remand in a CSC facility.
In Community Under Supervision includes all active offenders on day parole, full parole, statutory release, or in the community supervised on a long-term supervision order, offenders who are temporarily detained in a non-CSC facility, offenders who are unlawfully at large for less than 90 days, offenders on remand in a non-CSC facility, and offenders supervised and subject to an immigration hold by the Canada Border Services Agency.
The data reflect the number of offenders active at the end of each fiscal year. A fiscal year runs from April 1 to March 31 of the following year.
The majority of in-custody offenders are classified as medium security risk
Figure C12
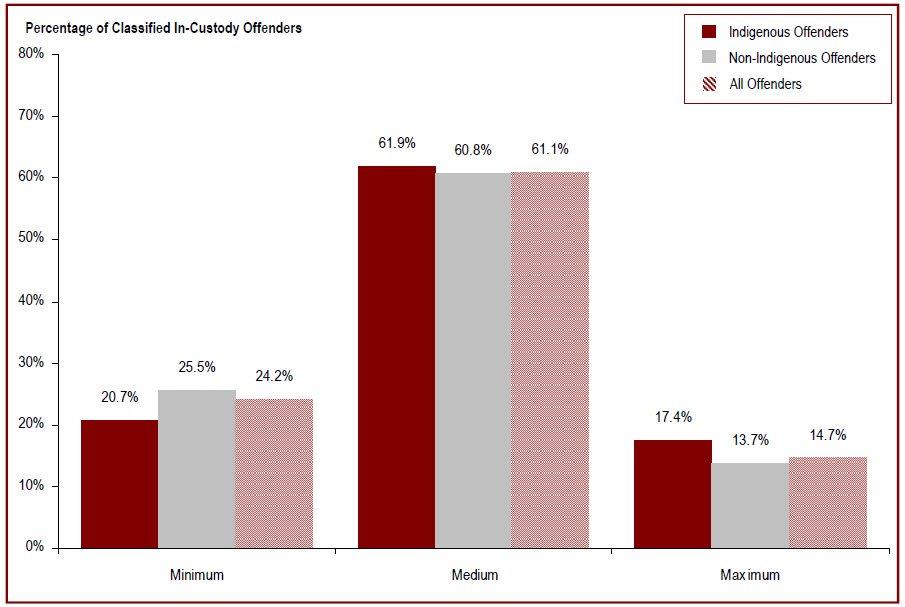
Source: Correctional Service Canada.
- Approximately two-thirds (61.1%) of offenders were classified as medium security risk.
- Indigenous offenders were more likely to be classified to a medium or maximum security risk compared to non-Indigenous.
- Compared to non-Indigenous offenders, a lower percentage of Indigenous offenders were classified as minimum security risk (20.7% vs. 25.5%) and a higher percentage was classified as medium (61.9% vs. 60.8%) and maximum (17.4% vs. 13.7%) security risk.
Note:
The data represent the offender security level decision as ofend of fiscal year 2017-18.
In Custody includes all active offenders incarcerated in a CSC facility offenders on temporary absence from a CSC facility, offenders who are temporarily detained in a CSC facility, and offenders on remand in a CSC facility.
The majority of in-custody offenders are classified as medium security risk
| Security Risk Level | Indigenous | Non-Indigenous | Total | |||
|---|---|---|---|---|---|---|
| # | % | # | % | # | % | |
| Minimum | 742 | 20.7 | 2,328 | 25.5 | 3,070 | 24.2 |
| Medium | 2,224 | 61.9 | 5,546 | 60.8 | 7,770 | 61.1 |
| Maximum | 625 | 17.4 | 1,245 | 13.7 | 1,870 | 14.7 |
| Total | 3,591 | 100.0 | 9,119 | 100.0 | 12,710 | 100.0 |
| Not Yet Determined* | 326 | 1,056 | 1,382 | |||
| Total | 3,917 | 10,175 | 14,092 | |||
Source: Correctional Service Canada.
Note:
The data represent the offender security level decision as of end of fiscal year 2017-2018.
The "Not yet determined" category includes offenders who have not yet been classified.
Admissions with a life or indeterminate sentence are increasing
Figure C13
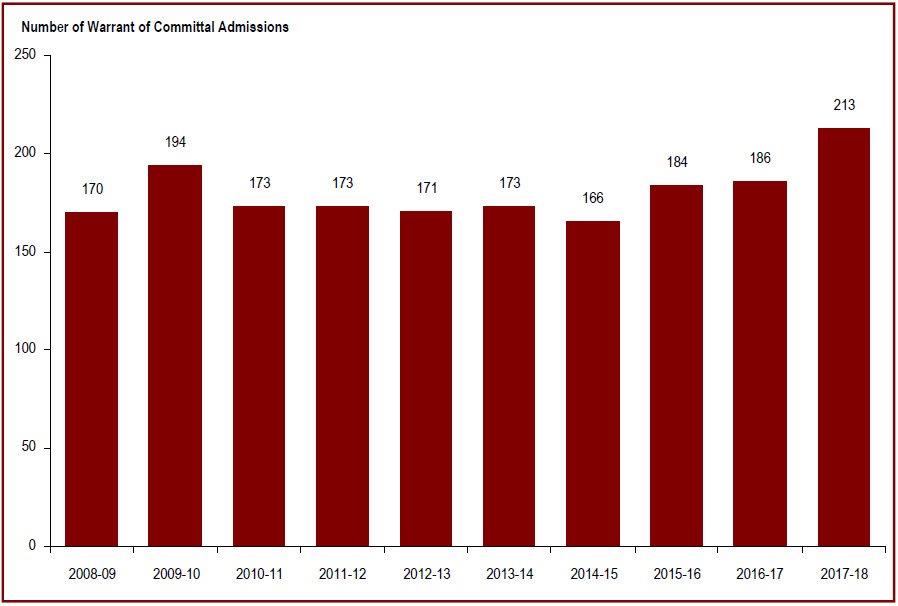
Source: Correctional Service Canada.
- From 2008-09 to 2017-18, there was an increase of 25.3% in the number of warrant of committal admissions to federal jurisdiction with a life/indeterminate* sentence from 170 to 213.
- At the end of fiscal year 2017-18, there were a total of 3,672 offenders in custody with a life/indeterminate sentence. Of these, 3,539 (96.4%) were men and 133 (3.6%) were women; 972 (26.5%) were Indigenous and 2,700 (73.5%) were non-Indigenous.
- At the end of fiscal year 2017-18, 24.2% of the total population was serving a life/indeterminate sentence. Of these offenders, 65.3% were in custody and 34.7% were in the community under supervision.
Note:
*Although life sentences and indeterminate sentences both may result in imprisonment for life, they are different. A life sentence is a sentence of life imprisonment, imposed by a judge at the time of sentence, for example for murder. An indeterminate sentence is a result of a designation, where an application is made to the court to declare an offender a Dangerous Offender, and the consequence of this designation is imprisonment for an indeterminate period.
A warrant of committal is a new admission to federal jurisdiction from the courts.
This table combines offenders serving life sentences and offenders serving indeterminate sentences.
Total Offender Population includes all active offenders, who are incarcerated in a CSC facility, offenders on temporary absence from a CSC facility, offenders who are temporarily detained, offenders who are actively supervised, and offenders who are unlawfully at large for less than 90 days.
Admissions with a life or indeterminate sentence are increasing
| Year | Indigenous Offenders | Non-Indigenous Offenders | Total | ||||||
|---|---|---|---|---|---|---|---|---|---|
| Women | Men | Total | Women | Men | Total | Women | Men | Total | |
| 2008-09 | 3 | 36 | 39 | 2 | 129 | 131 | 5 | 165 | 170 |
| 2009-10 | 5 | 48 | 53 | 8 | 133 | 141 | 13 | 181 | 194 |
| 2010-11 | 3 | 35 | 38 | 6 | 129 | 135 | 9 | 164 | 173 |
| 2011-12 | 6 | 46 | 52 | 11 | 110 | 121 | 17 | 156 | 173 |
| 2012-13 | 6 | 46 | 52 | 2 | 117 | 119 | 8 | 163 | 171 |
| 2013-14 | 7 | 40 | 47 | 7 | 119 | 126 | 14 | 159 | 173 |
| 2014-15 | 1 | 37 | 38 | 8 | 120 | 128 | 9 | 157 | 166 |
| 2015-16 | 5 | 50 | 55 | 6 | 123 | 129 | 11 | 173 | 184 |
| 2016-17 | 1 | 40 | 41 | 11 | 134 | 145 | 12 | 174 | 186 |
| 2017-18 | 5 | 66 | 71 | 10 | 132 | 142 | 15 | 198 | 213 |
Source: Correctional Service Canada.
Note:
This table combines offenders serving life sentences and offenders serving indeterminate sentences.
*Although life sentences and indeterminate sentences both may result in imprisonment for life, they are different. A life sentence is a sentence of life imprison-ment, imposed by a judge at the time of sentence, for example for murder. An indeterminate sentence is a result of a designation, where an application is made to the court to declare an offender a Dangerous Offender, and the consequence of this designation is imprisonment for an indeterminate period.
A warrant of committal is a new admission to federal jurisdiction from the courts.
Total Offender Population includes all active offenders, who are incarcerated in a CSC facility, offenders on temporary absence from a CSC facility, offenders who are temporarily detained, offenders who are actively supervised, and offenders who are unlawfully at large for less than 90 days.
Offenders with life or indeterminate sentences represent 24% of the total offender population
Figure C14
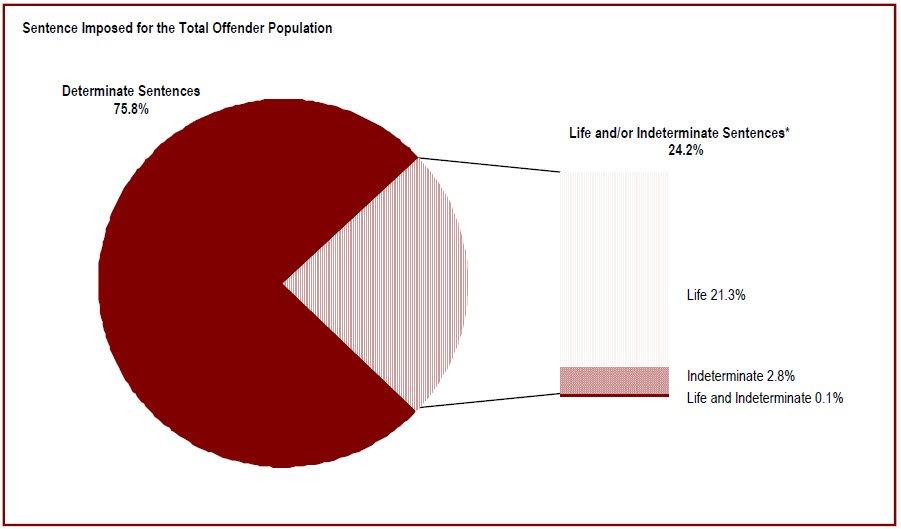
Source: Correctional Service Canada.
- At the end of fiscal year 2017-18, there were 5,619 offenders serving a life sentence and/or an indeterminate sentence. This represents 24.2% of the total offender population. The majority (65.3%) of these offenders were in custody. Of the 1,947 offenders who were in the community under supervision, the majority (80.9%) were serving a life sentence for 2nd Degree Murder.
- There were 21 offenders who were serving both a life sentence and an indeterminate sentence*.
- There were 641 offenders who were serving an indeterminate sentence as a result of a special designation. The remaining 4,957 offenders did not receive a special designation, but were serving a life sentence.
- 95.5% of the 623 Dangerous Offenders with indeterminate sentences were in custody and 4.5% were in the community under supervision.
- In contrast, 50.0% of the 16 Dangerous Sexual Offenders were in custody and all (2) of the offenders with an Habitual Offender designation were in the community under supervision (in this table there is one offender with an Habitual Offender designation included in the Designation and Life grouping, this offender was in the community under supervision as well).
Note:
*Although life sentences and indeterminate sentences may both result in imprisonment for life, they are different. A life sentence is a sentence of life imprisonment, imposed by a judge at the time of sentence, for example, for murder. An indeterminate sentence is a result of a designation, where an application is made to the court to declare an offender a Dangerous Offender, and the consequence of this designation is imprisonment for an indeterminate period. The Dangerous Sexual Offender and Habitual Offender designations were replaced with Dangerous Offender Legislation in 1977.
Total Offender Population includes all active offenders, who are incarcerated in a CSC facility, offenders on temporary absence from a CSC facility, offenders who are temporarily detained, offenders who are actively supervised, and offenders who are unlawfully at large for less than 90 days. In Custody includes all active offenders incarcerated in a CSC facility, offenders on temporary absence from a CSC facility, offenders who are temporarily detained in a CSC facility and offenders on remand in a CSC facility. In Community Under Supervision includes all active offenders on day parole, full parole, statutory release, in the community supervised on a long-term supervision order, offenders who are temporarily detained in a non-CSC facility, offenders who are unlawfully at large for less than 90 days, offenders on remand in a non-CSC facility, and offenders supervised and subject to an immigration hold by the Canada Border Services Agency.
Offenders with life or indeterminate sentences represent 24% of the total offender population
| Total Offender Population | Current Status | |||||
|---|---|---|---|---|---|---|
| In Custody in a CSC Facility | In Community Under Supervision | |||||
| Incarcerated | Day Parole | Full Parole | Other*** | |||
| # | % | |||||
| Offenders with a life sentence for: | ||||||
1stDegree Murder |
1,234 | 5.3 | 989 | 52 | 193 | 0 |
| 2ndDegree Murder | 3,525 | 15.2 | 1,950 | 222 | 1,353 | 0 |
| Other Offences* | 198 | 0.9 | 111 | 12 | 75 | 0 |
| Total | 4,957 | 21.3 | 3,050 | 286 | 1,621 | 0 |
| Offenders with indeterminate sentences resulting from the special designation of: | ||||||
| Dangerous Offender | 623 | 2.7 | 595 | 14 | 14 | 0 |
| Dangerous Sexual Offender | 16 | 0.1 | 8 | 2 | 6 | 0 |
| Habitual Offender | 2 | 0.0 | 0 | 0 | 2 | 0 |
| Total | 641 | 2.8 | 603 | 16 | 22 | 0 |
| Offenders serving an indeterminate sentence (due to a special designation) and a life sentence (due to an offence) |
21 | 0.1 | 19 | 0 | 2 | 0 |
| Total offenders with Life and/or Indeterminate sentence | 5,619 | 24.2 | 3,672 | 302 | 1,645 | 0 |
| Offenders Serving Determinate sentences** | 17,604 | 75.8 | 10,420 | 1,357 | 2,588 | 3,239 |
| Total | 23,223 | 100.0 | 14,092 | 1,659 | 4,233 | 3,239 |
Source: Correctional Service Canada.
Note:
*"Other offences" include Schedule I Schedule II and Non-Schedule types of offences.
**This includes 148 offenders designated as Dangerous Offenders who were serving determinate sentences.
***"Other" in the Community Under Supervision includes offenders on statutory release or on a long-term supervision order.
Among the 21 offenders serving an indeterminate sentence (due to a special designation) and a life sentence (due to an offence), there was one offender with an Habitual Offender designation.
Although life sentences and indeterminate sentences both may result in imprisonment for life, they are different. A life sentence is a sentence of life imprisonment, imposed by a judge at the time of sentence, for example for murder. An indeterminate sentence is a result of a designation, where an application is made to the court to declare an offender a Dangerous Offender, and the consequence of this designation is imprisonment for an indeterminate period. The Dangerous Sexual Offender and Habitual Offender designations were replaced with Dangerous Offender legislation in 1977.
Total Offender Population includes all active offenders, who are incarcerated in a CSC facility, offenders on temporary absence from a CSC facility, offenders who are temporarily detained, offenders who are actively supervised, and offenders who are unlawfully at large for less than 90 days. In Custody includes all active offenders incarcerated in a CSC facility, offenders on temporary absence from a CSC facility, offenders who are temporarily detained in a CSC facility and offenders on remand in a CSC facility. In Community Under Supervision includes all active offenders on day parole, full parole, statutory release, in the community supervised on a long-term supervision order, offenders who are temporarily detained in a non-CSC facility, offenders who are unlawfully at large for less than 90 days, offenders on remand in a non-CSC facility, and offenders supervised and subject to an immigration hold by the Canada Border Services Agency.
69.7% of offenders are serving a sentence for a violent offence*
Figure C15
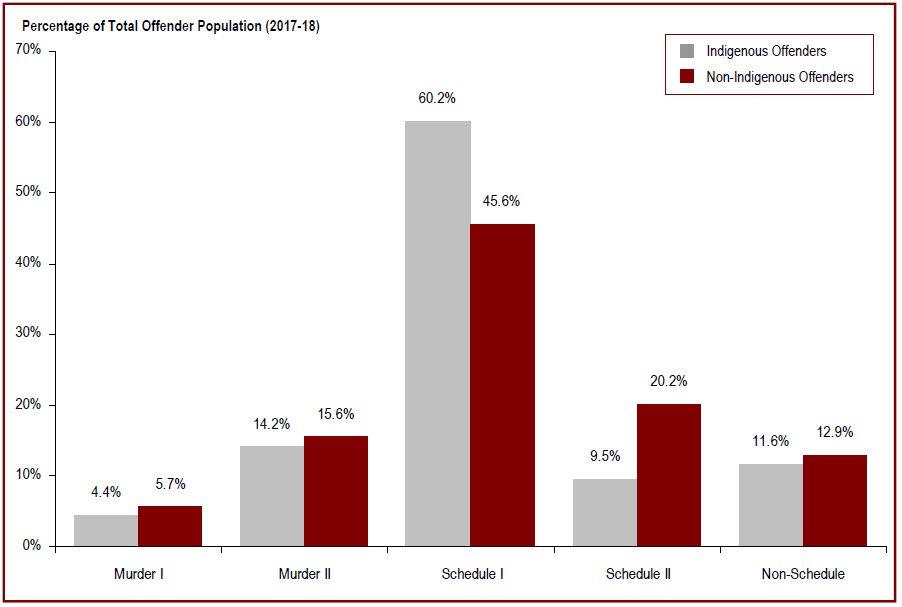
Source: Correctional Service Canada.
- At the end fiscal year 2017-18, Indigenous offenders were more likely to be serving a sentence for a violent offence (78.8% for Indigenous versus 66.9% for non-Indigenous offenders).
- 68.5% of Indigenous women offenders were serving a sentence for a violent offence compared to 44.3% of non-Indigenous women offenders.
- Of those offenders serving a sentence for Murder, 4.9% were women and 21.7% were Indigenous.
- A greater proportion of Indigenous offenders than non-Indigenous offenders were serving a sentence for a Schedule I offence (60.2% versus 45.6%, respectively).
- 9.5% of Indigenous offenders were serving a sentence for a Schedule II offence compared to 20.2% of non-Indigenous offenders.
- 29.7% of women were serving a sentence for a Schedule II offence compared to 16.9% of men.
Note:
*Violent offences include Murder I, Murder II and Schedule I offences.
Schedule I is comprised of sexual offences and other violent crimes excluding first and second degree murder (see the Corrections and Conditional Release Act).
Schedule II is comprised of serious drug offences or conspiracy to commit serious drug offences (see the Corrections and Conditional Release Act).
In cases where the offender is serving a sentence for more than one offence, the data reflect the most serious offence.
The data reflect all active offenders, who are incarcerated in a CSC facility, offenders on temporary absence from a CSC facility, offenders who are temporarily detained, offenders who are actively supervised, and offenders who are unlawfully at large for less than 90 days.
69.7% of offenders are serving a sentence for a violent offence*
| Offence Category | Indigenous | Non-Indigenous | Total | ||||||
|---|---|---|---|---|---|---|---|---|---|
| Women | Men | Total | Women | Men | Total | Women | Men | Total | |
| Murder I | 8 | 237 | 245 | 47 | 959 | 1,006 | 55 | 1,196 | 1,251 |
| % | 1.7 | 4.6 | 4.4 | 5.0 | 5.7 | 5.7 | 3.9 | 5.5 | 5.4 |
| Murder II | 60 | 734 | 794 | 119 | 2,635 | 2,754 | 179 | 3,369 | 3,548 |
| % | 13.0 | 14.4 | 14.2 | 12.7 | 15.8 | 15.6 | 12.8 | 15.4 | 15.3 |
| Schedule I | 248 | 3,105 | 3,353 | 249 | 7,792 | 8,041 | 497 | 10,897 | 11,394 |
| % | 53.8 | 60.8 | 60.2 | 26.6 | 46.6 | 45.6 | 35.6 | 49.9 | 49.1 |
| Schedule II | 82 | 449 | 531 | 333 | 3,233 | 3,566 | 415 | 3,682 | 4,097 |
| % | 17.8 | 8.8 | 9.5 | 35.6 | 19.3 | 20.2 | 29.7 | 16.9 | 17.6 |
| Non-Schedule | 63 | 586 | 649 | 188 | 2,096 | 2,284 | 251 | 2,682 | 2,933 |
| % | 13.7 | 11.5 | 11.6 | 20.1 | 12.5 | 12.9 | 18.0 | 12.3 | 12.6 |
| Total | 461 | 5,111 | 936 | 16,715 | 1,397 | 21,826 | |||
| 5,572 | 17,651 | 23,223 | |||||||
Source: Correctional Service Canada.
Note:
*Violent offences include Murder I, Murder II and Schedule I offences.
Schedule I is comprised of sexual offences and other violent crimes excluding first and second degree murder (see the Corrections and Conditional Release Act).
Schedule II is comprised of serious drug offences or conspiracy to commit serious drug offences (see the Corrections and Conditional Release Act).
In cases where the offender is serving a sentence for more than one offence, the data reflect the most serious offence.
The data reflect all active offenders, who are incarcerated in a CSC facility, offenders on temporary absence from a CSC facility, offenders who are temporarily detained, offenders who are actively supervised, and offenders who are unlawfully at large for less than 90 days.
The number of Indigenous offenders has increased
Figure C16
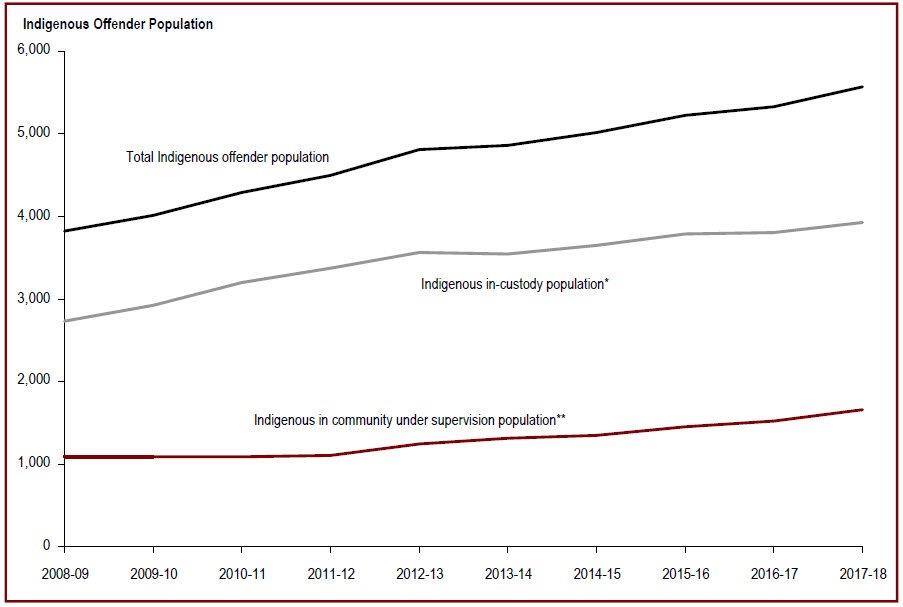
Source: Correctional Service Canada.
- From 2008-09 to 2017-18, the in-custody Indigenous offender population increased by 43.3%, while the total Indigenous offender population increased by 45.7% over the same time period.
- The number of in-custody Indigenous women offenders increased steadily from 168 in 2008-09 to 270 in 2017-18, for an increase of 60.7% in the last ten years. The increase for in-custody Indigenous men offenders was 42.2% for the same period, increasing from 2,565 to 3,647.
- From 2008-09 to 2017-18, the number of Indigenous offenders on community supervision increased by 51.6%, from 1,092 to 1,655. The Indigenous community population accounted for 18.1% of the total community population in 2017-18.
Note:
*In-Custody Population includes all active offenders incarcerated in a CSC facility, offenders on temporary absence from a CSC facility, offenders who are temporarily detained in a CSC facility, and offenders on remand in a CSC facility.
**In Community Under Supervision Population includes all active offenders on day parole, full parole, statutory release, or in the community supervised on a long-term supervision order, offenders who are temporarily detained in a non-CSC facility, offenders who are unlawfully at large for less than 90 days, offenders on remand in a non-CSC facility, and offenders supervised and subject to an immigration hold by the Canada Border Services Agency.
Regional statistics for Correctional Service Canada account for data relating to the northern territories in the following manner: data for Nunavut are reported in the Ontario Region, data for the Northwest Territories are reported in the Prairies Region, and data for Yukon are reported in the Pacific Region.
The number of Indigenous offenders has increased
| Indigenous Offenders | Gender | Fiscal Year | ||||
|---|---|---|---|---|---|---|
| 2013-14 | 2014-15 | 2015-16 | 2016-17 | 2017-18 | ||
| In-Custody | ||||||
| Atlantic Region | Men | 181 | 174 | 157 | 175 | 184 |
| Women | 14 | 11 | 12 | 8 | 14 | |
| Quebec Region | Men | 422 | 443 | 425 | 384 | 392 |
| Women | 15 | 19 | 24 | 14 | 11 | |
| Ontario Region | Men | 440 | 441 | 453 | 487 | 534 |
| Women | 36 | 34 | 39 | 37 | 43 | |
| Prairie Region | Men | 1,686 | 1,757 | 1,868 | 1,861 | 1,879 |
| Women | 110 | 139 | 133 | 155 | 163 | |
| Pacific Region | Men | 600 | 602 | 629 | 638 | 658 |
| Women | 38 | 37 | 43 | 39 | 39 | |
| National Total | Men | 3,329 | 3,417 | 3,532 | 3,545 | 3,647 |
| Women | 213 | 240 | 251 | 253 | 270 | |
| Total | 3,542 | 3,657 | 3,783 | 3,798 | 3,917 | |
| In Community Under Supervision | ||||||
| Atlantic Region | Men | 50 | 60 | 68 | 71 | 88 |
| Women | 11 | 12 | 10 | 11 | 9 | |
| Quebec Region | Men | 134 | 158 | 185 | 185 | 181 |
| Women | 7 | 12 | 18 | 10 | 6 | |
| Ontario Region | Men | 180 | 178 | 204 | 201 | 231 |
| Women | 20 | 21 | 24 | 31 | 29 | |
| Prairie Region | Men | 582 | 574 | 560 | 604 | 645 |
| Women | 63 | 52 | 77 | 78 | 111 | |
| Pacific Region | Men | 250 | 268 | 276 | 301 | 319 |
| Women | 17 | 17 | 22 | 32 | 36 | |
| National Total | Men | 1,196 | 1,238 | 1,293 | 1,362 | 1,464 |
| Women | 118 | 114 | 151 | 162 | 191 | |
| Total | 1,314 | 1,352 | 1,444 | 1,524 | 1,655 | |
| Total In-Custody & In Community Under Supervision | 4,856 | 5,009 | 5,227 | 5,322 | 5,572 | |
Source: Correctional Service Canada.
Note:
In-Custody Population includes all active offenders incarcerated in a CSC facility, offenders on temporary absence from a CSC facility, offenders who are temporarily detained in a CSC facility, and offenders on remand in a CSC facility.
In Community Under Supervision Population includes all active offenders on day parole, full parole, statutory release, or in the community supervised on a long-term supervision order, offenders who are temporarily detained in a non-CSC facility, offenders who are unlawfully at large for less than 90 days, offenders on remand in a non-CSC facility, and offenders supervised and subject to an immigration hold by the Canada Border Services Agency.
Regional statistics for Correctional Service Canada account for data relating to the northern territories in the following manner: data for Nunavut are reported in the Ontario Region, data for the Northwest Territories are reported in the Prairies Region, and data for Yukon are reported in the Pacific Region.
The total number of admissions to administrative segregation has decreased
Figure C17
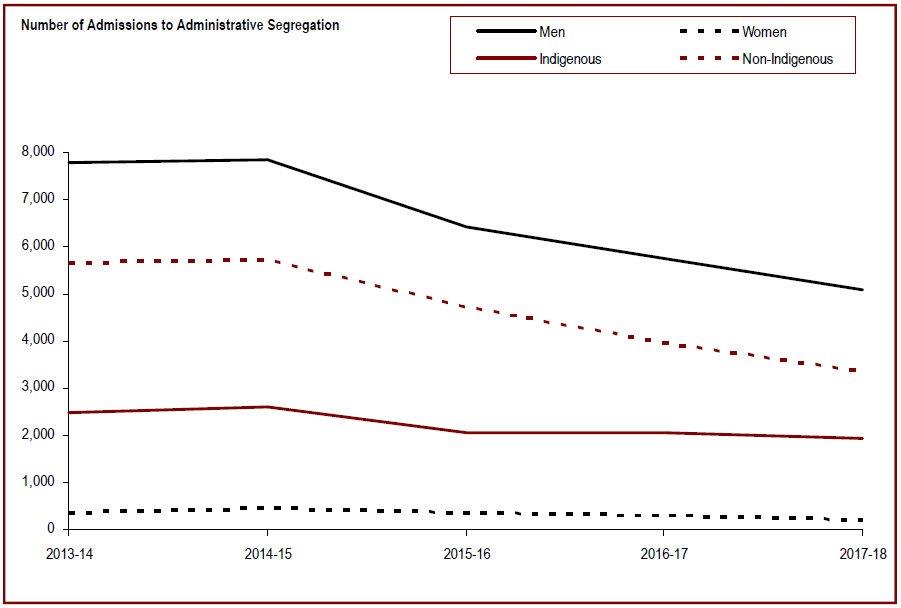
Source: Correctional Service Canada.
- In 2017-18, the total admissions to administrative segregation decreased by 12.3%, from 6,037 in 2016-17 to 5,295 in 2017-18.
- In 2017-18, 96.2% of the total admissions were men, and admissions of Indigenous offenders accounted for 36.5%.
- At the end of fiscal year 2017-18, there were 310 offenders in administrative segregation. Of these, 305 were men and five were women. A total of 136 Indigenous offenders were in administrative segregation.
Note:
These reports count admissions, not offenders. Offenders admitted multiple times to segregation are counted once for each admission. Offenders segregated under paragraph (f), subsection 44(1) of the Corrections and Conditional Release Act (Disciplinary Segregation) are not included.
Administrative segregation is the separation, when specific legal requirements are met, of an inmate from the general population, other than pursuant to a disciplinary decision. As per subsection 31(3) of the Corrections and Conditional Release Act: The institutional head may order that an inmate be confined in administrative segregation if the institutional head is satisfied that there is no reasonable alternative to administrative segregation and he or she believes on reasonable grounds that (a) the inmate has acted, has attempted to act or intends to act in a manner that jeopardizes the security of the penitentiary or the safety of any person and allowing the inmate to associate with other inmates would jeopardize the security of the penitentiary or the safety of any person; (b) allowing the inmate to associate with other inmates would interfere with an investigation that could lead to a criminal charge or a charge under subsection 41(2) of a serious disciplinary offence; or (c) allowing the inmate to associate with other inmates would jeopardize the inmate's safety.
The total number of admissions to administrative segregation has decreased
| Year and Type of Administrative Segregation |
By Gender | By Race | ||||
|---|---|---|---|---|---|---|
| Women | Men | Total | Indigenous | Non-Indigenous | Total | |
| 2013-14 | ||||||
| CCRA 31(3-A)* | 315 | 5,196 | 5,511 | 1,602 | 3,909 | 5,511 |
| CCRA 31(3-B)* | 5 | 320 | 325 | 95 | 230 | 325 |
| CCRA 31(3-C)* | 28 | 2,272 | 2,300 | 806 | 1,494 | 2,300 |
| Total | 348 | 7,788 | 8,136 | 2,482 | 5,654 | 8,136 |
| 2014-15 | ||||||
| CCRA 31(3-A) | 426 | 5,289 | 5,715 | 1,723 | 3,992 | 5,715 |
| CCRA 31(3-B) | 7 | 329 | 336 | 109 | 227 | 335 |
| CCRA 31(3-C) | 27 | 2,242 | 2,269 | 793 | 1,476 | 2,269 |
| Total | 460 | 7,860 | 8,320 | 2,595 | 5,724 | 8,320 |
| 2015-16 | ||||||
| CCRA 31(3-A) | 342 | 4,200 | 4,542 | 1,345 | 3,197 | 4,542 |
| CCRA 31(3-B) | 2 | 235 | 237 | 91 | 146 | 237 |
| CCRA 31(3-C) | 33 | 1,976 | 2,009 | 645 | 1,364 | 2,009 |
| Total | 377 | 6,411 | 6,788 | 2,056 | 4,732 | 6,788 |
| 2016-17 | ||||||
| CCRA 31(3-A) | 270 | 3,826 | 4,096 | 1,370 | 2,726 | 4,096 |
| CCRA 31(3-B) | 3 | 273 | 276 | 74 | 202 | 276 |
| CCRA 31(3-C) | 16 | 1,649 | 1,665 | 635 | 1,030 | 1,665 |
| Total | 289 | 5,748 | 6,037 | 2,058 | 3,979 | 6,037 |
| 2017-18 | ||||||
| CCRA 31(3-A) | 180 | 3,167 | 3,347 | 1,171 | 2,176 | 3,347 |
| CCRA 31(3-B) | 9 | 229 | 238 | 75 | 163 | 238 |
| CCRA 31(3-C) | 13 | 1,697 | 1,710 | 687 | 1,023 | 1,710 |
| Total | 202 | 5,093 | 5,295 | 1,933 | 3,362 | 5,295 |
Source: Correctional Service Canada.
Note:
These reports count admissions, not offenders. Offenders admitted multiple times to segregation are counted once for each admission. Offenders segregated under paragraph (f), subsection 44(1) of the Corrections and Conditional Release Act (Disciplinary Segregation) are not included.
*Administrative segregation is the separation, when specific legal requirements are met, of an inmate from the general population, other than pursuant to a disciplinary decision. As per subsection 31(3) of the Corrections and Conditional Release Act: The institutional head may order that an inmate be confined in administrative segregation if the institutional head is satisfied that there is no reasonable alternative to administrative segregation and he or she believes on reasonable grounds that (a) the inmate has acted, has attempted to act or intends to act in a manner that jeopardizes the security of the penitentiary or the safety of any person and allowing the inmate to associate with other inmates would jeopardize the security of the penitentiary or the safety of any person; (b) allowing the inmate to associate with other inmates would interfere with an investigation that could lead to a criminal charge or a charge under subsection 41(2) of a serious disciplinary offence; or (c) allowing the inmate to associate with other inmates would jeopardize the inmate's safety.
76% of admissions to administrative segregation stay for less than 30 days
Figure C18
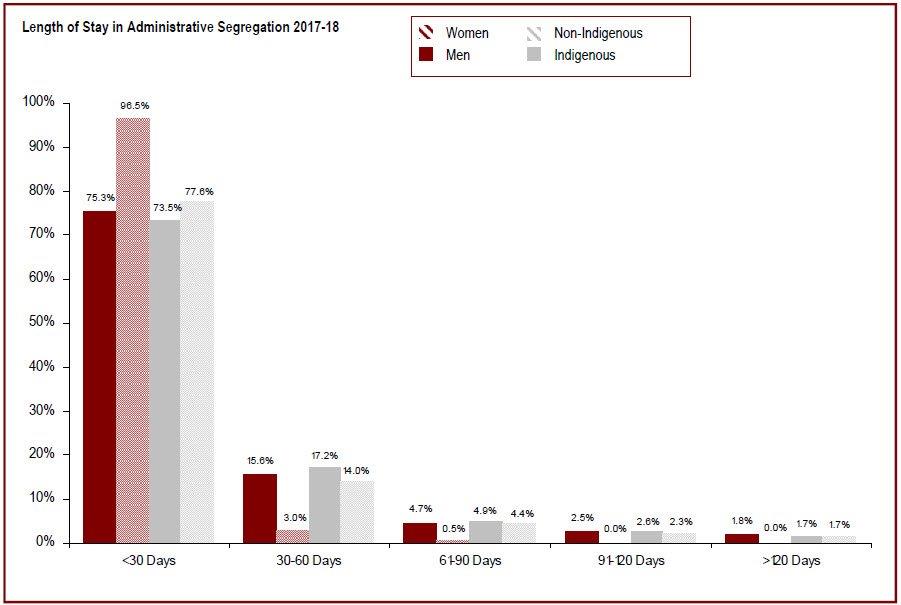
Source: Correctional Service Canada.
- Most (76.1%) placements in administrative segregation ended in less than 30 days, and 15.2% lasted between 30 and 60 days. 1.7% of placements in administrative segregation ended after more than 120 days.
- 96.5% of placements of women in administrative segregation ended in less than 30 days.
- The number of admissions to administrative segregation that resulted in placements lasting more than 120 days was the same for Indigenous offenders and non-Indigenous offenders (1.7%).
Note:
These reports count admissions, not offenders. Offenders admitted multiple times to segregation are counted once for each admission. Offenders segregated under paragraph (f), subsection 44(1) of the Corrections and Conditional Release Act (Disciplinary Segregation) are not included.
Administrative segregation is the involuntary or voluntary separation, when specific legal requirements are met, of an inmate from the general population, other than pursuant to a disciplinary decision. As per subsection 31(3) of the Corrections and Conditional Release Act: The institutional head may order that an inmate be confined in administrative segregation if the institutional head is satisfied that there is no reasonable alternative to administrative segregation and he or she believes on reasonable grounds that (a) the inmate has acted, has attempted to act or intends to act in a manner that jeopardizes the security of the penitentiary or the safety of any person and allowing the inmate to associate with other inmates would jeopardize the security of the penitentiary or the safety of any person; (b) allowing the inmate to associate with other inmates would interfere with an investigation that could lead to a criminal charge or a charge under subsection 41(2) of a serious disciplinary offence; or (c) allowing the inmate to associate with other inmates would jeopardize the inmate's safety.
76% of admissions to administrative segregation stay for less than 30 days
| Length of Stay in Administrative Segregation | By Gender | By Race | ||||||||
|---|---|---|---|---|---|---|---|---|---|---|
| Women | Men | Indigenous | Non-Indigenous | Total | ||||||
| # | % | # | % | # | % | # | % | # | % | |
| 2017-18 | ||||||||||
| < 30 days | 193 | 96.5 | 3,910 | 75.3 | 1,432 | 73.5 | 2,671 | 76.1 | 4,103 | 76.1 |
| 30-60 days | 6 | 3.0 | 812 | 15.6 | 336 | 17.2 | 482 | 15.2 | 818 | 15.2 |
| 61-90 days | 1 | 0.5 | 246 | 4.7 | 96 | 4.9 | 151 | 4.6 | 247 | 4.6 |
| 91-120 days | 0 | 0.0 | 130 | 2.5 | 51 | 2.6 | 79 | 2.4 | 130 | 2.4 |
| > 120 days | 0 | 0.0 | 92 | 1.8 | 34 | 1.7 | 58 | 1.7 | 92 | 1.7 |
| Total | 200 | 100.0 | 5,190 | 100.0 | 1,949 | 100.0 | 3,441 | 100.0 | 5,390 | 100.0 |
Source: Correctional Service Canada.
Note:
These reports count admissions, not offenders. Offenders admitted multiple times to segregation are counted once for each admission. Offenders segregated under paragraph (f), subsection 44(1) of the Corrections and Conditional Release Act (Disciplinary Segregation) are not included.
Administrative segregation is the involuntary or voluntary separation, when specific legal requirements are met, of an inmate from the general population, other than pursuant to a disciplinary decision. As per subsection 31(3) of the Corrections and Conditional Release Act:
The institutional head may order that an inmate be confined in administrative segregation if the institutional head is satisfied that there is no reasonable alterna-tive to administrative segregation and he or she believes on reasonable grounds that (a) the inmate has acted, has attempted to act or intends to act in a manner that jeopardizes the security of the penitentiary or the safety of any person and allowing the inmate to associate with other inmates would jeopardize the security of the penitentiary or the safety of any person; (b) allowing the inmate to associate with other inmates would interfere with an investigation that could lead to a criminal charge or a charge under subsection 41(2) of a serious disciplinary offence; or (c) allowing the inmate to associate with other inmates would jeopardize the inmate's safety.
The number of offender deaths while in custody
Figure C19
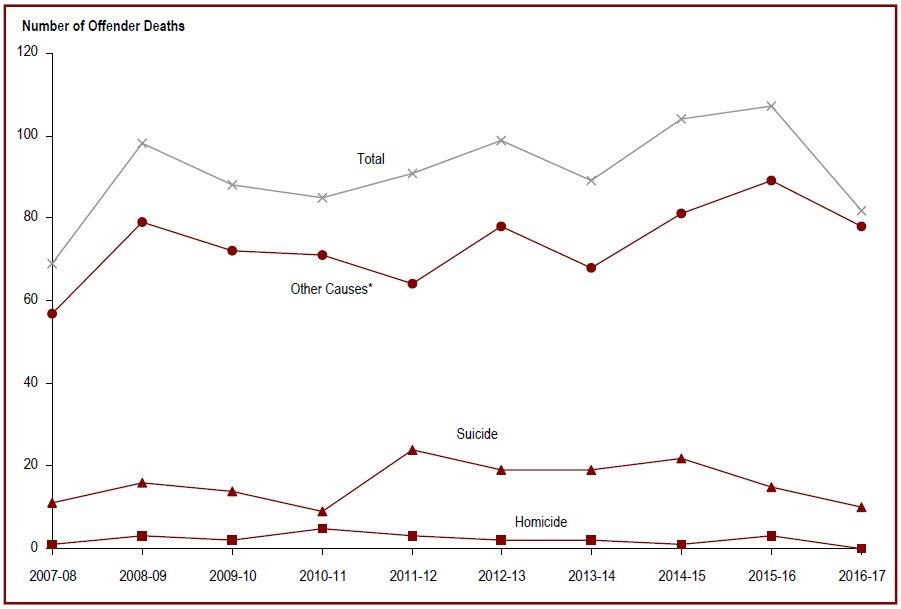
Source: Adult Correctional Services Survey, Canadian Centre for Justice Statistics, Statistics Canada
- In the ten-year period from 2006-07 to 2016-17, a total of 539 federal offenders and 379 provincial offenders died while in custody.
- During this time period, suicides accounted for 14.8% of federal offender deaths and 20.8% of provincial offender deaths. The suicide rate was approximately 56 per 100,000 for incarcerated federal offenders, and approximately 33 per 100,000 for incarcerated provincial offenders**. These rates are significantly higher than the 2009 rate of 11.5 suicides per 100,000 people in Canada.
- Between 2007-08 and 2016-17, 3.3% of federal offender deaths and 1.1% of provincial offender deaths were due to homicide. The homicide rate for incarcerated federal offenders was approximately 12.7 per 100,000 and 1.7 per 100,000 for incarcerated provincial offenders**. The federal rate is significantly higher than the national homicide rate of 1.8 per 100,000 people in 2017.
Note:
*Other causes of death include: natural causes, accidental deaths, death as a result of a legal intervention, other causes of death and where cause of death was unknown. Data for Alberta for 2013-14 and onward are now available.
**For the calculation of rates, the total actual in-count numbers between 2006-07 and 2016-17 was used as the denominator.
The data on cause of death are subject to change following an official review or investigation, and should be used/interpreted with caution. The data presented were provided by the Canadian Centre for Justice Statistics at Statistics Canada, and may not reflect the outcome of recent reviews or investigations on cause of death.
The number of offender deaths while in custody
| Year | Type of Death | |||||||
|---|---|---|---|---|---|---|---|---|
| Homicide | Suicide | Other* | Total | |||||
| # | % | # | % | # | % | # | ||
| Federal | ||||||||
| 2007-08 | 1 | 2.5 | 5 | 12.5 | 34 | 85.0 | 40 | |
| 2008-09 | 2 | 3.1 | 9 | 13.8 | 54 | 83.1 | 65 | |
| 2009-10 | 1 | 2.0 | 9 | 18.4 | 39 | 79.6 | 49 | |
| 2010-11 | 5 | 10.0 | 4 | 8.0 | 41 | 82.0 | 50 | |
| 2011-12 | 3 | 5.7 | 8 | 15.1 | 42 | 79.2 | 53 | |
| 2012-13 | 1 | 1.8 | 11 | 20.0 | 43 | 78.2 | 55 | |
| 2013-14 | 1 | 2.1 | 9 | 18.8 | 38 | 79.2 | 48 | |
| 2014-15 | 1 | 1.5 | 13 | 19.4 | 53 | 79.1 | 67 | |
| 2015-16 | 3 | 4.6 | 9 | 13.8 | 53 | 81.5 | 65 | |
| 2016-17 | 0 | 0.0 | 3 | 6.4 | 44 | 9.4 | 47 | |
| Total | 18 | 3.3 | 80 | 14.8 | 441 | 81.8 | 539 | |
| Provincial | ||||||||
| 2007-08 | 0 | 0.0 | 6 | 20.7 | 23 | 79.3 | 29 | |
| 2008-09 | 1 | 3.0 | 7 | 21.2 | 25 | 75.8 | 33 | |
| 2009-10 | 1 | 2.6 | 5 | 12.8 | 33 | 84.6 | 39 | |
| 2010-11 | 0 | 0.0 | 5 | 14.3 | 30 | 85.7 | 35 | |
| 2011-12 | 0 | 0.0 | 16 | 42.1 | 22 | 57.9 | 38 | |
| 2012-13 | 1 | 2.3 | 8 | 18.2 | 35 | 79.5 | 44 | |
| 2013-14 | 1 | 2.4 | 10 | 24.4 | 30 | 73.2 | 41 | |
| 2014-15 | 0 | 0.0 | 9 | 24.3 | 28 | 73.2 | 37 | |
| 2015-16 | 0 | 0.0 | 6 | 14.3 | 36 | 85.7 | 42 | |
| 2016-17 | 0 | 0.0 | 7 | 17.1 | 34 | 83.0 | 41 | |
| Total | 4 | 1.1 | 79 | 20.8 | 296 | 78.1 | 379 | |
| Total Federal and Provincial Offender Deaths | 22 | 2.4 | 159 | 17.3 | 737 | 80.3 | 918 | |
Source: Adult Correctional Services Survey, Canadian Centre for Justice Statistics, Statistics Canada
Note:
*Other causes of death include: natural causes, accidental deaths, death as a result of a legal intervention, other causes of death and where cause of death was unknown.
Data for Alberta for 2013-14 and onward are now available.
The data on cause of death are subject to change following an official review or investigation, and should be used/interpreted with caution. The data presented were provided by the Canadian Centre for Justice Statistics at Statistics Canada, and may not reflect the outcome of recent reviews or investigations on cause of death.
The number of escapees has remained stable since 2013-2014
Figure C20
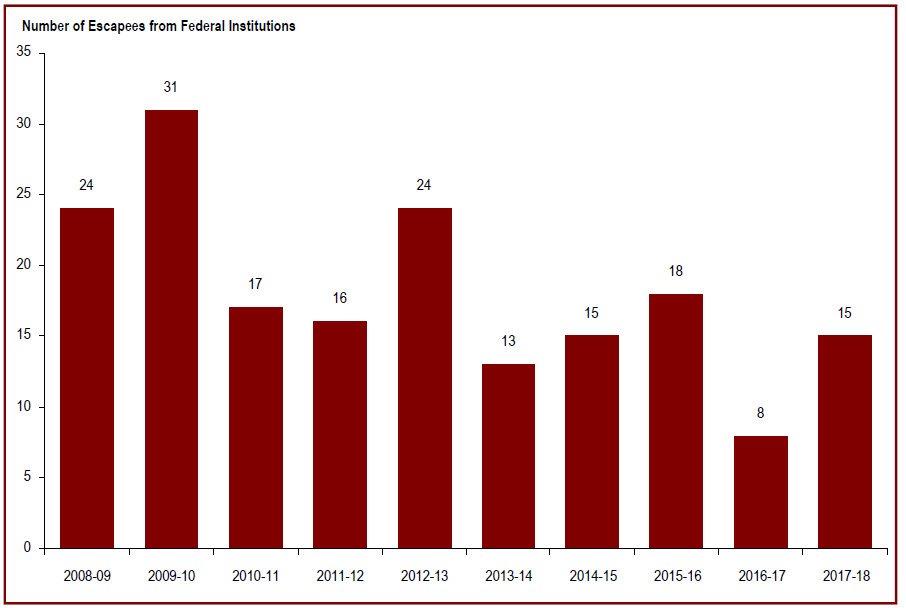
Source: Security, Correctional Service Canada.
- In In 2017-18, there were 11 escape incidents involving a total of 15 offenders. All of the 15 offenders were recaptured.
- Offenders who escaped from federal institutions in 2017-18 represented 0.1% of the in-custody population.
Note:
The data represents the number of escape incidents from federal facilities during each fiscal year. An escape can involve more than one offender. A fiscal year runs from April 1 to March 31 of the following year.
The number of escapees has remained stable since 2013-2014
| Escapes | 2013-14 | 2014-15 | 2015-16 | 2016-17 | 2017-18 |
|---|---|---|---|---|---|
| Total Number of Escape Incidents | 11 | 14 | 15 | 8 | 11 |
| Total Number of Escapees | 13 | 15 | 18 | 8 | 15 |
Source: Security, Correctional Service Canada.
Note:
The data represents the number of escape incidents from federal facilities during each fiscal year. An escape can involve more than one offender. A fiscal year runs from April 1 to March 31 of the following year.
The population of offenders in the community under supervision has increased in the past five years
Figure C21
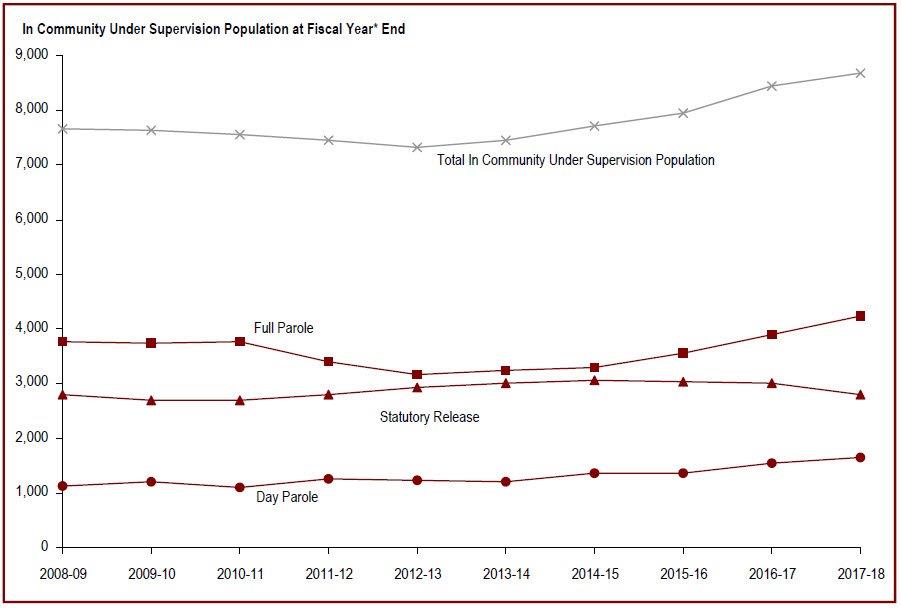
Source: Correctional Service Canada.
- Over the past five years, the total offender population supervised in the community increased by 16.3%. For the same period, the total number of offenders on full parole increased by 30.6% while the proportion of offenders on statutory release decreased by 7.4%.
- At the end of fiscal year 2017-18, there were 7,970 men and 711 women on active community supervision.
Note:
*These cases reflect the number of offenders on active supervision at fiscal year end. A fiscal year runs from April 1 to March 31 of the following year.
The data reflect the offender population in the community under supervision which includes all active offenders on day parole, full parole, statutory release, offenders who are temporarily detained in a non-CSC facility, offenders on remand in a non-CSC facility, offenders who are unlawfully at large for less than 90 days, and offenders supervised and subject to an immigration hold by the Canada Border Services Agency.
The data presented above do not include offenders who were on long-term supervision orders (see Figure/Table E4).
Day parole is a type of conditional release granted by the Parole Board of Canada whereby offenders are permitted to participate in community-based activities in preparation for full parole or statutory release. The conditions require offenders to return nightly to an institution or half-way house unless otherwise authorized by the Parole Board of Canada. Full parole is a type of conditional release granted by the Parole Board of Canada whereby the remainder of the sentence is served under supervision in the community. Statutory release refers to a conditional release that is subject to supervision after the offender has served two-thirds of the sentence.
The population of offenders in the community under supervision has increased in the past five years
| Year | Supervision Type of Offenders | |||||||||
|---|---|---|---|---|---|---|---|---|---|---|
| Day Parole | Full Parole | Statutory Release | Totals | % change* | ||||||
| Women | Men | Women | Men | Women | Men | Women | Men | Both | Both | |
| 2008-09 | 106 | 1,017 | 344 | 3,419 | 113 | 2,675 | 563 | 7,111 | 7,674 | |
| 2009-10 | 108 | 1,083 | 328 | 3,418 | 93 | 2,602 | 529 | 7,103 | 7,632 | -0.5 |
| 2010-11 | 79 | 1,017 | 314 | 3,441 | 109 | 2,598 | 502 | 7,056 | 7,558 | -1.0 |
| 2011-12 | 123 | 1,123 | 257 | 3,154 | 127 | 2,661 | 507 | 6,938 | 7,445 | -1.5 |
| 2012-13 | 116 | 1,106 | 225 | 2,932 | 136 | 2,801 | 477 | 6,839 | 7,316 | -1.7 |
| 2013-14 | 106 | 1,104 | 225 | 3,017 | 153 | 2,858 | 484 | 6,979 | 7,463 | 2.0 |
| 2014-15 | 115 | 1,236 | 239 | 3,065 | 150 | 2,909 | 504 | 7,210 | 7,714 | 3.4 |
| 2015-16 | 124 | 1,248 | 273 | 3,276 | 177 | 2,849 | 574 | 7,373 | 7,947 | 3.0 |
| 2016-17 | 158 | 1,392 | 316 | 3,587 | 154 | 2,856 | 628 | 7,835 | 8,463 | 6.5 |
| 2017-18 | 197 | 1,462 | 369 | 3,864 | 145 | 2,644 | 711 | 7,970 | 8,681 | 2.6 |
Source: Correctional Service Canada.
Note:
These cases reflect the number of offenders on active supervision at fiscal year end. A fiscal year runs from April 1 to March 31 of the following year.
The data reflect the offender population in the community under supervision which includes all active offenders on day parole, full parole, statutory release, offenders who are temporarily detained in a non-CSC facility, offenders on remand in a non-CSC facility, offenders who are unlawfully at large for less than 90 days, and offenders supervised and subject to an immigration hold by the Canada Border Services Agency.
The data presented above do not include offenders who were on long-term supervision orders (see Figure/Table E4).
Day parole is a type of conditional release granted by the Parole Board of Canada whereby offenders are permitted to participate in community-based activities in preparation for full parole or statutory release. The conditions require offenders to return nightly to an institution or half-way house unless otherwise authorized by the Parole Board of Canada. Full parole is a type of conditional release granted by the Parole Board of Canada whereby the remainder of the sentence is served under supervision in the community. Statutory release refers to a conditional release that is subject to supervision after the offender has served two-thirds of the sentence.
*Percent change is measured from the previous year.
Provincial/territorial community corrections population decreased
Figure C22
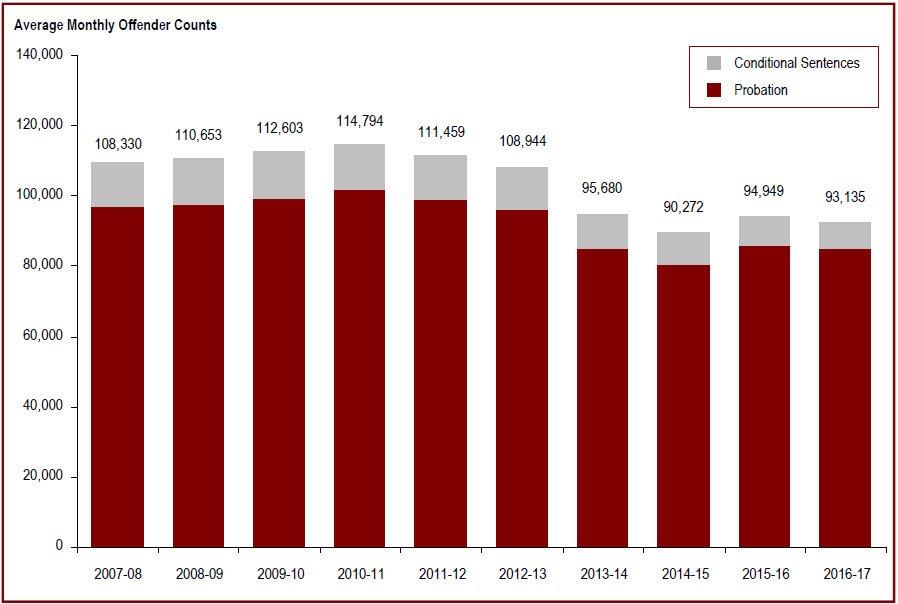
Source: Table 35-10-0154-01, Corrections Key Indicator Report for Adults and Youth, Canadian Centre for Justice Statistics, Statistics Canada.
- The provincial/territorial community corrections population decreased 1.9% in 2016-17, from 94,949 in 2015-16 to 93,135 in 2016-17.
- There has been a gradual decline in the number of offenders on conditional sentence orders over the past decade. It has decreased 42.2% from 12,535 in 2007-08 to 7,249 in 2016-17.
Note:
A conditional sentence is a disposition of the court where the offender serves a term of imprisonment in the community under specified conditions. This type of sentence can only be imposed in cases where the term of imprisonment would be less than two years. Conditional sentences have been a provincial and territorial sentencing option since September 1996.
Provincial/territorial community corrections population decreased
| Year | Average Monthly Offender Counts on Probation | Average Monthly Offender Counts on Conditional Sentence | Total |
|---|---|---|---|
| 2007-08 | 96,795 | 12,535 | 108,330 |
| 2008-09 | 97,529 | 13,124 | 110,653 |
| 2009-10 | 99,498 | 13,105 | 112,603 |
| 2010-11 | 101,825 | 12,969 | 114,794 |
| 2011-12 | 98,843 | 12,616 | 111,459 |
| 2012-13 | 96,116 | 12,202 | 108,944 |
| 2013-14 | 84,905 | 10,077 | 95,680 |
| 2014-15 | 80,705 | 8,746 | 90,272 |
| 2015-16 | 85,845 | 8,259 | 94,949 |
| 2016-17 | 84,978 | 7,249 | 93,135 |
Source: Table 35-10-0154-01, Corrections Key Indicator Report for Adults and Youth, Canadian Centre for Justice Statistics, Statistics Canada.
Note:
A conditional sentence is a disposition of the court where the offender serves a term of imprisonment in the community under specified conditions. This type of sentence can only be imposed in cases where the term of imprisonment would be less than two years. Conditional sentences have been a provincial and territorial sentencing option since September 1996.
The number of offenders on provincial parole increased
Figure C23
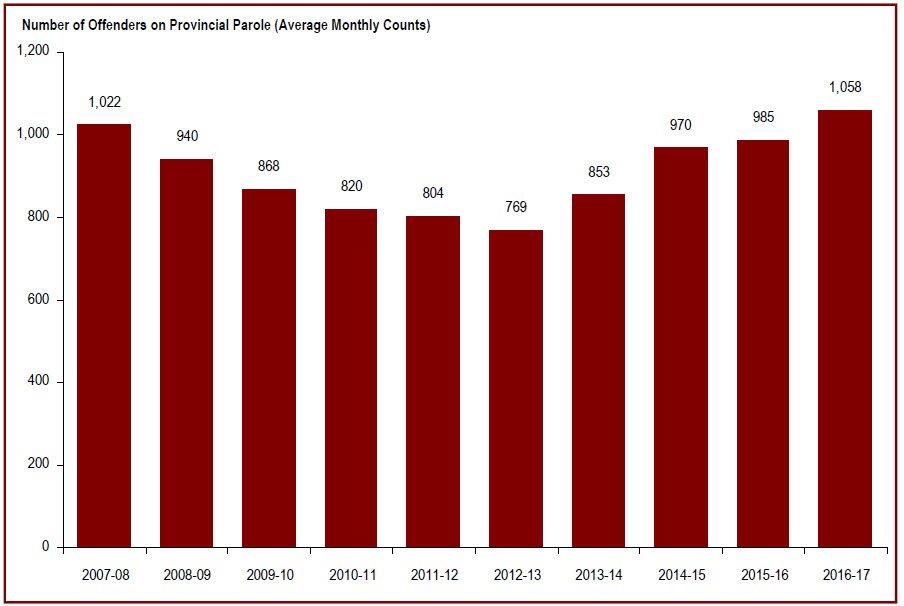
Source: Table 35-10-0154-01, Corrections Key Indicator Report for Adults and Youth, Canadian Centre for Justice Statistics, Statistics Canada.
- The number of offenders on provincial parole increased by 7.4% from 985 offenders in 2015-16 to 1,058 in 2016-17.
- Since 2013-14, there has been a 24.0% increase in the number of offenders on provincial parole, up from 853 in 2013-14 to 1,058 in 2016-17.
Note:
Provincial parole boards operate in Quebec and Ontario. On April 1, 2007, the Parole Board of Canada assumed responsibility for parole decisions relating to offenders serving sentences in British Columbia's provincial correctional facilities. The Parole Board of Canada has jurisdiction over granting parole to provincial offenders in the Atlantic and Prairie provinces, British Columbia, and to territorial offenders in Yukon, Nunavut and the Northwest Territories.
The number of offenders on provincial parole increased
| Year | Average Monthly Counts on Provincial Parole | ||||||
|---|---|---|---|---|---|---|---|
| Provincial Boards | Parole Board of Canada** | Total | Percent Change | ||||
| Quebec | Ontario | British Columbia* | Total | ||||
| 2007-08 | 581 | 205 | n/a | 785 | 237 | 1,022 | |
| 2008-09 | 533 | 217 | n/a | 750 | 190 | 940 | -8.0 |
| 2009-10 | 506 | 194 | n/a | 700 | 168 | 868 | -7.7 |
| 2010-11 | 482 | 171 | n/a | 653 | 167 | 820 | -5.6 |
| 2011-12 | 481 | 179 | n/a | 660 | 144 | 804 | -2.0 |
| 2012-13 | 462 | 164 | n/a | 626 | 143 | 769 | -4.4 |
| 2013-14 | 527 | 172 | n/a | 699 | 154 | 853 | 11.0 |
| 2014-15 | 612 | 207 | n/a | 821 | 151 | 970 | 13.7 |
| 2015-16 | 639 | 207 | n/a | 846 | 139 | 985 | 1.5 |
| 2016-17 | 701 | 205 | n/a | 907 | 151 | 1,058 | 7.4 |
Source: Table 35-10-0154-01, Corrections Key Indicator Report for Adults and Youth, Canadian Centre for Justice Statistics, Statistics Canada.
Note:
*On April 1, 2007, the Parole Board of Canada assumed responsibility for parole decisions relating to offenders serving sentences in British Columbia's provincial correctional facilities.
**The data represent the number of provincial offenders who are released from custody on the authority of the Parole Board of Canada and supervised by the Correctional Service of Canada.
Provincial parole boards operate in Quebec and Ontario. The Parole Board of Canada has jurisdiction over granting parole to provincial offenders in the Atlantic and Prairie provinces, British Columbia, and to territorial offenders in Yukon, Nunavut and the Northwest Territories.
Section D - Conditional Release
The percentage of offenders released from federal penitentiaries at statutory release decreased in the past five years
Figure D1
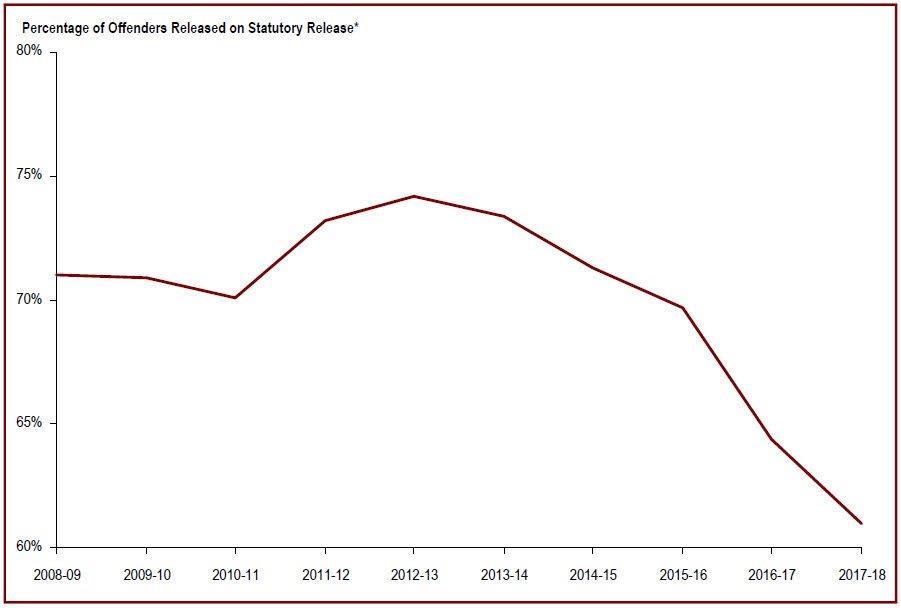
Source: Correctional Service Canada.
- In fiscal year 2017-18, 61.0% of all releases from federal institutions were at statutory release.
- In fiscal year 2017-18, 74.4% of releases for Indigenous offenders were at statutory release compared to 55.8% of releases for non-Indigenous offenders.
- Over the past ten years, the percentage of releases at statutory release has decreased from 71.0% to 61.0%.
Note:
*Percentage is calculated based on the number of statutory releases compared to the total releases for each offender group.
The data includes all releases from a federal institution or Healing Lodge in a given fiscal year excluding offenders with quashed sentences, offenders who died in custody, LTSO releases, offenders released at warrant expiry and offenders transferred to foreign countries. An offender may be released more than once a year in cases where a previous release was subject to revocation, suspension, temporary detention, or interruption.
Statutory release refers to a conditional release that is subject to supervision after the offender has served two-thirds of the sentence.
A fiscal year runs from April 1 to March 31 of the following year.
The percentage of offenders released from federal penitentiaries at statutory release decreased in the past five years
| Indigenous | Non-Indigenous | Total Offender Population | |||||||
|---|---|---|---|---|---|---|---|---|---|
| Year | Statutory Release | Total Releases | %* | Statutory Release | Total Releases | %* | Statutory Release | Total Releases | %* |
| 2008-09 | 1,437 | 1,719 | 83.6 | 4,278 | 6,331 | 67.6 | 5,715 | 8,050 | 71.0% |
| 2009-10 | 1,417 | 1,725 | 82.1 | 4,121 | 6,081 | 67.8 | 5,538 | 7,806 | 70.9% |
| 2010-11 | 1,327 | 1,589 | 83.5 | 3,753 | 5,657 | 66.3 | 5,080 | 7,246 | 70.1% |
| 2011-12 | 1,457 | 1,754 | 83.1 | 3,844 | 5,486 | 70.1 | 5,301 | 7,240 | 73.2% |
| 2012-13 | 1,603 | 1,923 | 83.4 | 3,985 | 5,610 | 71.0 | 5,588 | 7,533 | 74.2% |
| 2013-14 | 1,698 | 1,996 | 85.1 | 3,938 | 5,685 | 69.3 | 5,636 | 7,681 | 73.4% |
| 2014-15 | 1,712 | 2,029 | 84.4 | 3,661 | 5,504 | 66.5 | 5,373 | 7,533 | 71.3% |
| 2015-16 | 1,659 | 2,010 | 82.5 | 3,650 | 5,607 | 65.1 | 5,309 | 7,617 | 69.7% |
| 2016-17 | 1,569 | 2,017 | 77.8 | 3,315 | 5,560 | 59.6 | 4,844 | 7,577 | 64.5% |
| 2017-18 | 1,518 | 2,040 | 74.4 | 2,909 | 5,216 | 55.8 | 4,427 | 7,256 | 61.0 |
Source: Correctional Service Canada.
Note:
*Percentage is calculated based on the number of statutory releases compared to the total releases for each offender group.
The data includes all releases from a federal institution or Healing Lodge in a given fiscal year excluding offenders with quashed sentences, offenders who died in custody, LTSO releases, offenders released at warrant expiry and offenders transferred to foreign countries. An offender may be released more than once a year in cases where a previous release was subject to revocation, suspension, temporary detention, or interruption.
Statutory release refers to a conditional release that is subject to supervision after the offender has served two-thirds of the sentence.
A fiscal year runs from April 1 to March 31 of the following year.
The percentage of offenders released from federal penitentiaries on day and full parole increased in the past six years
Figure D2
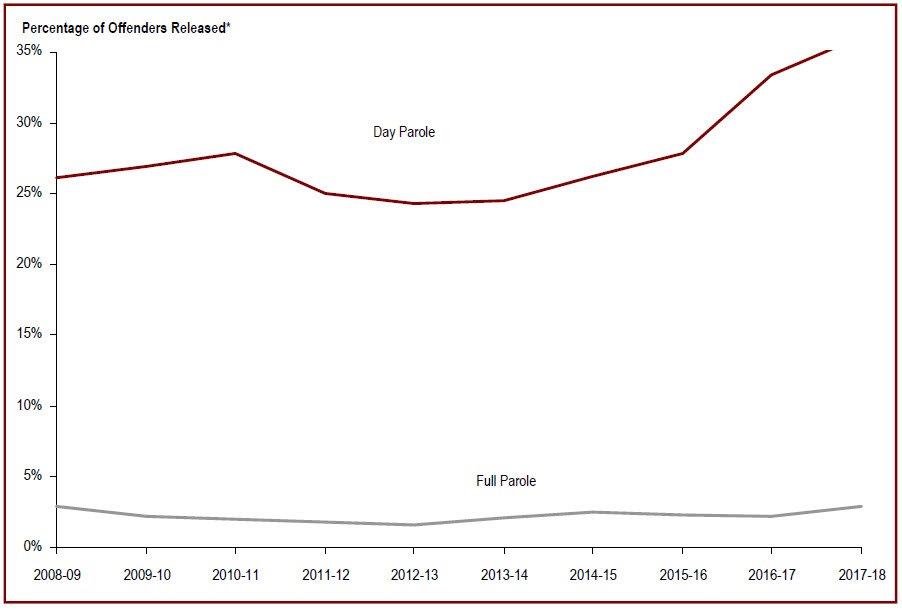
Source: Correctional Service Canada.
- In fiscal year 2017-18, 36.1% of all releases from federal institutions were on day parole and 2.9% were on full parole.
- In fiscal year 2017-18, 24.4% of releases for Indigenous offenders were on day parole and 1.2% were on full parole compared to 40.7% and 3.5%, respectively for non-Indigenous offenders.
- Over the past ten years, the percentage of releases on day parole has increased from 26.1% to 36.1% and the percentage of releases on full parole was the same at 2.9%.
Note:
*Percentage is calculated based on the number of day and full paroles compared to the total releases for each offender group.
The data includes all releases from federal penitentiaries in a given fiscal year excluding offenders with quashed sentences, offenders who died in custody, LTSO releases, offenders released at warrant expiry and offenders transferred to foreign countries. An offender may be released more than once a year in cases where a previous release was subject to revocation, suspension, temporary detention, or interruption.
Day parole is a type of conditional release granted by the Parole Board of Canada whereby offenders are permitted to participate in community-based activities in preparation for full parole or statutory release. The conditions require offenders to return nightly to an institution or half-way house unless otherwise authorized by the Parole Board of Canada.
Full parole is a type of conditional release granted by the Parole Board of Canada whereby the remainder of the sentence is served under supervision in the community.
A fiscal year runs from April 1 to March 31 of the following year.
The percentage of offenders released from federal penitentiaries on day and full parole increased in the past six years
| Indigenous | Non-Indigenous | Total Offender Population | ||||||||
|---|---|---|---|---|---|---|---|---|---|---|
| Year | Day Parole | Full Parole | Total Releases | Day Parole | Full Parole | Total Releases | Day Parole | Full Parole | Total Releases | |
| 2008-09 | # | 266 | 16 | 1,719 | 1,839 | 214 | 6,331 | 2,105 | 230 | 8,050 |
| % | 15.5 | 0.9 | 29.0 | 3.4 | 26.1 | 2.9 | ||||
| 2009-10 | # | 296 | 12 | 1,725 | 1,800 | 160 | 6,081 | 2,096 | 172 | 7,806 |
| % | 17.2 | 0.7 | 29.6 | 2.6 | 26.9 | 2.2 | ||||
| 2010-11 | # | 251 | 11 | 1,589 | 1,767 | 137 | 5,657 | 2,018 | 148 | 7,246 |
| % | 15.8 | 0.7 | 31.2 | 2.4 | 27.8 | 2.0 | ||||
| 2011-12 | # | 285 | 12 | 1,754 | 1,526 | 116 | 5,486 | 1,811 | 128 | 7,240 |
| % | 16.2 | 0.7 | 27.8 | 2.1 | 25.0 | 1.8 | ||||
| 2012-13 | # | 313 | 7 | 1,923 | 1,515 | 110 | 5,610 | 1,828 | 117 | 7,533 |
| % | 16.3 | 0.4 | 27.0 | 2.0 | 24.3 | 1.6 | ||||
| 2013-14 | # | 280 | 18 | 1,996 | 1,602 | 145 | 5,685 | 1,882 | 163 | 7,681 |
| % | 14.0 | 0.9 | 28.2 | 2.6 | 24.5 | 2.1 | ||||
| 2014-15 | # | 307 | 10 | 2,029 | 1,668 | 175 | 5,504 | 1,975 | 185 | 7,533 |
| % | 15.1 | 0.5 | 30.3 | 3.2 | 26.2 | 2.5 | ||||
| 2015-16 | # | 337 | 14 | 2,010 | 1,793 | 164 | 5,607 | 2,130 | 178 | 7,617 |
| % | 16.8 | 0.7 | 32.0 | 2.9 | 28.0 | 2.3 | ||||
| 2016-17 | # | 435 | 13 | 2,017 | 2,092 | 153 | 5,560 | 2,527 | 166 | 7,577 |
| % | 21.6 | 0.6 | 37.6 | 2.8 | 33.4 | 2.2 | ||||
| 2017-18 | # | 497 | 25 | 2,040 | 2,124 | 183 | 5,216 | 2,621 | 208 | 7,256 |
| % | 24.4 | 12 | 40.7 | 3.5 | 36.1 | 2.9 | ||||
Source: Correctional Service Canada.
Note:
The data includes all releases from a federal institution or Healing Lodge in a given fiscal year excluding offenders with quashed sentences, offenders who died in custody, LTSO releases, offenders released at warrant expiry and offenders transferred to foreign countries. An offender may be released more than once a year in cases where a previous release was subject to revocation, suspension, temporary detention, or interruption.
Day parole is a type of conditional release granted by the Parole Board of Canada whereby offenders are permitted to participate in community-based activities in preparation for full parole or statutory release. The conditions require offenders to return nightly to an institution or half-way house unless otherwise authorized by the Parole Board of Canada.
Full parole is a type of conditional release granted by the Parole Board of Canada whereby the remainder of the sentence is served under supervision in the community.
A fiscal year runs from April 1 to March 31 of the following year.
Percentage is calculated based on the number of day and full paroles compared to the total releases for each offender group. Due to rounding, percentages may not add up to 100 percent.
Federal day and full parole grant rates increased
Figure D3
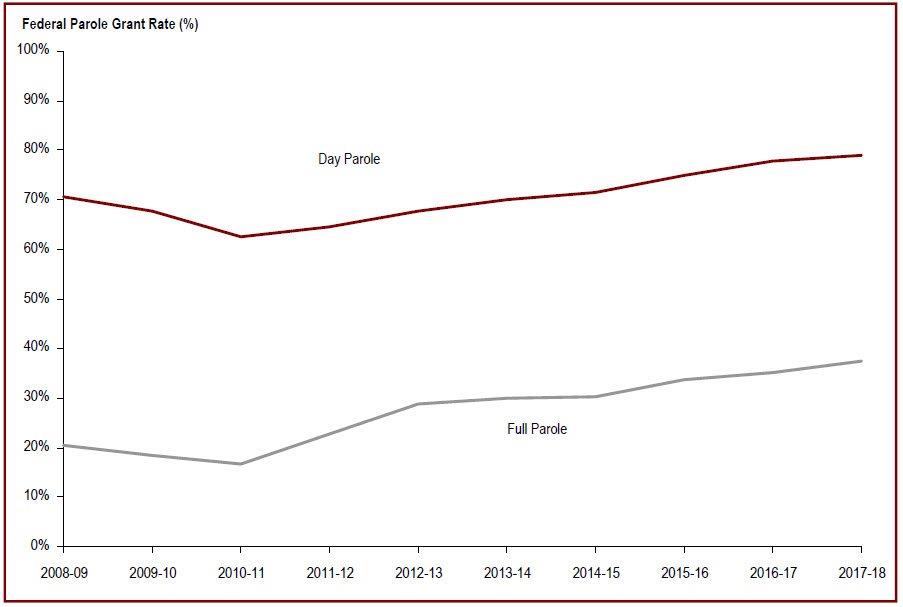
Source: Parole Board of Canada.
- In 2017-18, the federal day parole grant rate increased 1.2 percentage points to 79.1% compared to the previous year.
- In 2017-18, the federal full parole grant rate increased 2.3 percentage points to 37.5% compared to the previous year.
- Over the last 10 years, female offenders had a much higher grant rate for federal day parole (84.7%) and federal full parole (41.2%) than male offenders (70.1% and 27.5% respectfully).
Note:
The grant rate represents the percentage of pre-release reviews resulting in a grant by the Parole Board of Canada.
Day parole is a type of conditional release granted by the Parole Board of Canada in which offenders are permitted to participate in community-based activities in preparation for full parole or statutory release. The conditions require offenders to return nightly to an institution or half-way house unless otherwise authorized by the Parole Board of Canada. Not all offenders apply for day parole, and some apply more than once before being granted day parole.
Full parole is a type of conditional release granted by the Parole Board of Canada in which the remainder of the sentence is served under supervision in the community. The Parole Board of Canada must review the cases of all offenders for full parole at the time prescribed by legislation, unless the offender advises the Parole Board of Canada in writing that he/she does not wish to be considered for full parole.
On March 28, 2011, Bill C-59 (Abolition of Early Parole Act) eliminated the accelerated parole review (APR) process, affecting first-time non-violent offenders serving sentences for Schedule II and non-Schedule offences, who in 2011-12 were no longer eligible for an APR review. These offenders are now assessed on general reoffending as compared to the APR risk assessment, which considered the risk of committing a violent offence only. To better illustrate historical trends, APR decisions were excluded.
Even though comparisons were made between federal regular day parole and full parole grant rates only, they nevertheless contain an APR residual effect between 2011-12 and 2015-16 as a sufficiently large proportion of the APR-affected population was granted regular federal day parole and full parole, perhaps inflating the grant rates.
Federal day and full parole grant rates increased
| Type of Release | Year | Granted | Denied | Grant Rate (%) | APR* | |||||
|---|---|---|---|---|---|---|---|---|---|---|
| Women | Men | Women | Men | Women | Men | Total | Directed | Total | ||
| Day Parole | 2008-09 | 136 | 1,907 | 25 | 824 | 84.5 | 69.8 | 70.6 | 1,000 | 1,525 |
| 2009-10 | 153 | 1,957 | 40 | 967 | 79.3 | 66.9 | 67.7 | 947 | 1,491 | |
| 2010-11 | 136 | 1,854 | 42 | 1,149 | 76.4 | 61.7 | 62.6 | 970 | 1,591 | |
| 2011-12 | 249 | 2,491 | 65 | 1,442 | 79.3 | 63.3 | 64.5 | 0 | 0 | |
| 2012-13 | 289 | 2,821 | 72 | 1,416 | 80.1 | 66.6 | 67.6 | 14 | 21 | |
| 2013-14 | 248 | 2,824 | 52 | 1,273 | 82.7 | 68.9 | 69.9 | 39 | 47 | |
| 2014-15 | 298 | 3,023 | 51 | 1,282 | 85.4 | 70.2 | 71.4 | 38 | 45 | |
| 2015-16 | 291 | 3,093 | 52 | 1,077 | 84.8 | 74.2 | 75.0 | 86 | 90 | |
| 2016-17 | 399 | 3,445 | 47 | 1,042 | 89.5 | 76.8 | 77.9 | 80 | 83 | |
| 2017-18 | 436 | 3,612 | 30 | 1,039 | 93.6 | 77.7 | 79.1 | 100 | 106 | |
| Full Parole | 2008-09 | 44 | 495 | 62 | 2,016 | 41.5 | 19.7 | 20.6 | 1,097 | 1,100 |
| 2009-10 | 32 | 461 | 89 | 2,080 | 26.4 | 18.1 | 18.5 | 1,004 | 1,010 | |
| 2010-11 | 20 | 436 | 87 | 2,205 | 18.7 | 16.5 | 16.6 | 1,046 | 1,059 | |
| 2011-12 | 77 | 644 | 126 | 2,317 | 37.9 | 21.7 | 22.8 | 0 | 0 | |
| 2012-13 | 90 | 914 | 142 | 2,328 | 38.8 | 28.2 | 28.9 | 26 | 26 | |
| 2013-14 | 84 | 904 | 103 | 2,201 | 44.9 | 29.1 | 30.0 | 126 | 142 | |
| 2014-15 | 87 | 969 | 106 | 2,307 | 45.1 | 29.6 | 30.4 | 119 | 137 | |
| 2015-16 | 96 | 1,063 | 127 | 2,153 | 43.0 | 33.1 | 33.7 | 166 | 185 | |
| 2016-17 | 138 | 1,237 | 157 | 2,384 | 46.8 | 34.2 | 35.1 | 122 | 126 | |
| 2017-18 | 153 | 1,363 | 175 | 2,357 | 46.6 | 36.6 | 37.5 | 161 | 165 | |
Source: Parole Board of Canada.
Note:
The grant rate represents the percentage of pre-release reviews resulting in a grant by the Parole Board of Canada.
Day parole is a type of conditional release granted by the Parole Board of Canada in which offenders are permitted to partici pate in community-based activities in preparation for full parole or statutory release. The conditions require offenders to return nightly to an institution or half-way house unless otherwise authorized by the Parole Board of Canada. Not all offenders apply for day parole, and some apply more than once before being granted day parole.
Full parole is a type of conditional release granted by the Parole Board of Canada in which the remainder of the sentence is served under supervision in the community. The Parole Board of Canada must review the cases of all offenders for full parole at the time prescribed by legislation, unless the offender advi ses the Parole Board of Canada in writing that he/she does not wish to be considered for full parole. Grant rates should be read with caution.
*On March 28, 2011, Bill C-59 (Abolition of Early Parole Act) eliminated the accelerated parole review (APR) process, affecting first-time non-violent offenders serving sentences for Schedule II and non-Schedule offences, who in 2011-12 were no longer eligible for an APR review. These offenders are now assessed on general reoffending as compared to the APR risk assessment, which considered the risk of committing a violent offence only. To better illustrate historical trends, APR decisions were excluded. However, the information on APR (the number of paroles directed and the total number of APR decisions) is presented in a separate section of the table. Grant rates should be read with caution. Even though comparisons were made between federal regular day parole and full parole grant rates only, they nevertheless contain an APR residual effect between 2011-12 and 2015-16 as a sufficiently large proportion of the APR-affected population were granted regular federal day parole and full parole, perhaps inflating the grant rates.
*As a result of court challenges, the Pacific Region (in 2012) and the Quebec Region (in 2013) have been processing active APR cases for offenders sentenced or convicted prior to the abolition of APR. Following the Canada (Attorney General) v. Whaling decision on March 20, 2014, the accelerated parole review process was reinstated across all regions for offenders sentenced p rior to the abolition of APR.
Federal day parole grant rate for Indigenous offenders increased
Figure D4
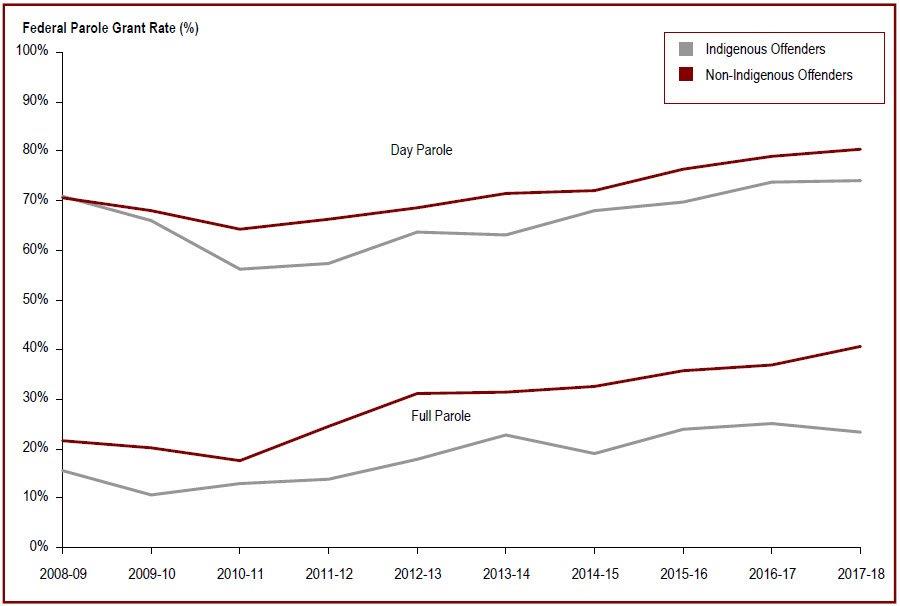
Source: Parole Board of Canada.
- In 2017-18, the federal day parole grant rate increased slightly for Indigenous offenders (to 74.0%; +0.2%) and increased by 1.6% for non-Indigenous offenders to 80.5% compared to 2016-17.
- In 2017-18, the federal full parole grant decreased for Indigenous offenders (to 23.2%; -2.0%) and increased for non-Indigenous offenders (to 40.7%; +3.7%) compared to 2016-17.
- Over the last 10 years, lower federal day and full parole grant rates were reported for Indigenous offenders (66.7%; 18.9%) than for non-Indigenous offenders (72.3%; 30.3%).
Note:
The grant rate represents the percentage of pre-release reviews resulting in a grant by the Parole Board of Canada.
Day parole is a type of conditional release granted by the Parole Board of Canada in which offenders are permitted to participate in community-based activities in preparation for full parole or statutory release. The conditions require offenders to return nightly to an institution or half-way house unless otherwise authorized by the Parole Board of Canada. Not all offenders apply for day parole, and some apply more than once before being granted day parole.
Full parole is a type of conditional release granted by the Parole Board of Canada in which the remainder of the sentence is served under supervision in the community. The Parole Board of Canada must review the cases of all offenders for full parole at the time prescribed by legislation, unless the offender advises the Parole Board of Canada in writing that he/she does not wish to be considered for full parole.
On March 28, 2011, Bill C-59 (Abolition of Early Parole Act) eliminated the accelerated parole review (APR) process, affecting first-time non-violent offenders serving sentences for Schedule II and non-Schedule offences, who in 2011-12 were no longer eligible for an APR review. These offenders are now assessed on general reoffending as compared to the APR risk assessment, which considered the risk of committing a violent offence only. To better illustrate historical trends, APR were excluded. Grant rates should be read with caution. Even though comparisons were made between federal regular day parole and full parole grant rates only, they nevertheless contain an APR residual effect between 2011-12 and 2015-16 as a sufficiently large proportion of the APR-affected population were granted regular federal day parole and full parole, perhaps inflating the grant rates.
Federal day parole grant rate for Indigenous offenders increased
| Type of Release | Year | Granted | Denied | Grant Rate (%) | Total Number Granted/Denied | ||||
|---|---|---|---|---|---|---|---|---|---|
| Indigenous | Non-Indigenous | Indigenous | Non-Indigenous | Indigenous | Non-Indigenous | Total | |||
| Day Parole | 2008-09 | 390 | 1,653 | 159 | 690 | 71.0 | 70.6 | 70.6 | 2,892 |
| 2009-10 | 407 | 1,703 | 211 | 796 | 65.9 | 68.1 | 67.7 | 3,117 | |
| 2010-11 | 373 | 1,617 | 289 | 902 | 56.3 | 64.2 | 62.6 | 3,181 | |
| 2011-12 | 466 | 2,274 | 347 | 1,160 | 57.3 | 66.2 | 64.5 | 4,247 | |
| 2012-13 | 556 | 2,554 | 318 | 1,170 | 63.6 | 68.6 | 67.6 | 4,598 | |
| 2013-14 | 520 | 2,552 | 303 | 1,022 | 63.2 | 71.4 | 69.9 | 4,397 | |
| 2014-15 | 563 | 2,758 | 266 | 1,067 | 67.9 | 72.1 | 71.4 | 4,654 | |
| 2015-16 | 605 | 2,779 | 264 | 865 | 69.6 | 76.3 | 75.0 | 4,513 | |
| 2016-17 | 714 | 3,130 | 253 | 836 | 73.8 | 78.9 | 77.9 | 4,933 | |
| 2017-18 | 819 | 3,229 | 288 | 781 | 74.0 | 80.5 | 79.1 | 5,117 | |
| Full Parole | 2008-09 | 73 | 466 | 395 | 1,683 | 15.6 | 21.7 | 20.6 | 2,617 |
| 2009-10 | 50 | 443 | 413 | 1,756 | 10.8 | 20.1 | 18.5 | 2,662 | |
| 2010-11 | 71 | 385 | 480 | 1,812 | 12.9 | 17.5 | 16.6 | 2,748 | |
| 2011-12 | 75 | 646 | 467 | 1,976 | 13.8 | 24.6 | 22.8 | 3,164 | |
| 2012-13 | 102 | 902 | 472 | 1,998 | 17.8 | 31.1 | 28.9 | 3,474 | |
| 2013-14 | 124 | 864 | 421 | 1,883 | 22.8 | 31.5 | 30.0 | 3,292 | |
| 2014-15 | 106 | 950 | 450 | 1,963 | 19.1 | 32.6 | 30.4 | 3,469 | |
| 2015-16 | 136 | 1,023 | 436 | 1,844 | 23.8 | 35.7 | 33.7 | 3,439 | |
| 2016-17 | 156 | 1,219 | 463 | 2,078 | 25.2 | 37.0 | 35.1 | 3,916 | |
| 2017-18 | 173 | 1,343 | 573 | 1,959 | 23.2 | 40.7 | 37.5 | 4,048 | |
Source: Parole Board of Canada.
Note:
The grant rate represents the percentage of pre-release reviews resulting in a grant by the Parole Board of Canada.
Day parole is a type of conditional release granted by the Parole Board of Canada in which offenders are permitted to participate in community-based activities in preparation for full parole or statutory release. The conditions require offenders to return nightly to an institution or half-way house unless otherwise authorized by the Parole Board of Canada. Not all offenders apply for day parole, and some apply more than once before being granted day parole.
Full parole is a type of conditional release granted by the Parole Board of Canada in which the remainder of the sentence is served under supervision in the community. The Parole Board of Canada must review the cases of all offenders for full parole at the time prescribed by legislation, unless the offender advises the Parole Board of Canada in writing that he/she does not wish to be considered for full parole.
On March 28, 2011, Bill C-59 (Abolition of Early Parole Act) eliminated the accelerated parole review (APR) process, affecting first-time non-violent offenders serving sentences for Schedule II and non-Schedule offences, who in 2011-12 were no longer eligible for an APR review. These offenders are now assessed on general reoffending as compared to the APR risk assessment, which considered the risk of committing a violent offence only. To better illustrate historical trends, APR were excluded. Grant rates should be read with caution. Even though comparisons were made between federal regular day parole and full parole grant rates only, they nevertheless contain an APR residual effect between 2011-12 and 2015-16 as a sufficiently large proportion of the APR-affected population were granted regular federal day parole and full parole, perhaps inflating the grant rates.
The number of federal parole hearings involving an Elder increased
Figure D5
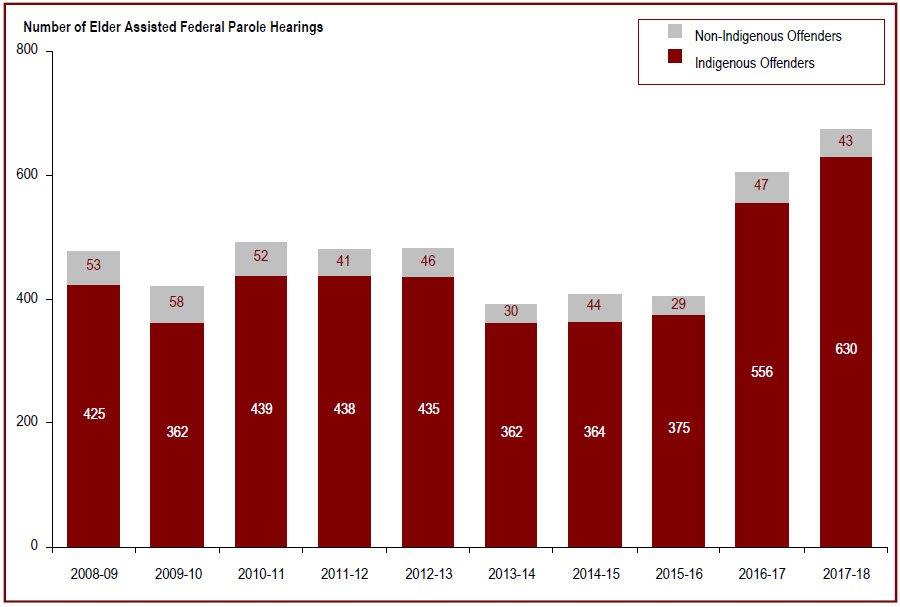
Source: Parole Board of Canada.
- The number of Elder Assisted federal parole hearings increased by 11.6% in 2017-18, following a 49.3% increase in 2016-17 (from 404 in 2015-16 to 603 in 2016-17, to 673 in 2017-18). The increase is associated with the in-reach conducted by the Board with Indigenous offenders.
- In 2017-18, 41.1% (630) of all federal hearings with Indigenous offenders, and 0.9% (43) of all federal parole hearings for offenders who did not self-identify as Indigenous were Elder Assisted Hearings.
Note:
The presence of an Indigenous Cultural Advisor is an alternative approach to the traditional parole hearing, and was introduced by the Parole Board of Canada to ensure that conditional release hearings are sensitive to Indigenous cultural values and traditions. This type of hearing is available to both Indigenous and non-Indigenous offenders.
The term “Elder” also refers to a Cultural Advisor as defined in section 11.1.1.5 of the Decision-Making Policy Manual”.
The number of federal parole hearings involving an Elder increased
| Year | Elder Assisted Hearings | ||||||||
|---|---|---|---|---|---|---|---|---|---|
| Indigenous Offenders | Non-Indigenous Offenders | All Offenders | |||||||
| Total Hearings | With an Elder | Total Hearings | With an Elder | Total Hearings | With an Elder | ||||
| # | # | % | # | # | % | # | # | % | |
| 2008-09 | 1,250 | 425 | 34.0 | 4,370 | 53 | 1.2 | 5,620 | 478 | 8.5 |
| 2009-10 | 1,209 | 362 | 29.9 | 4,471 | 58 | 1.3 | 5,680 | 420 | 7.4 |
| 2010-11 | 1,237 | 439 | 35.5 | 4,343 | 52 | 1.2 | 5,580 | 491 | 8.8 |
| 2011-12 | 1,266 | 438 | 34.6 | 4,645 | 41 | 0.9 | 5,911 | 479 | 8.1 |
| 2012-13 | 1,305 | 435 | 33.3 | 4,660 | 46 | 1.0 | 5,965 | 481 | 8.1 |
| 2013-14 | 922 | 362 | 39.3 | 3,678 | 30 | 0.8 | 4,600 | 392 | 8.5 |
| 2014-15 | 881 | 364 | 41.3 | 3,835 | 44 | 1.1 | 4,716 | 408 | 8.7 |
| 2015-16 | 957 | 375 | 39.2 | 3,972 | 29 | 0.7 | 4,929 | 404 | 8.2 |
| 2016-17 | 1,295 | 556 | 42.9 | 4,498 | 47 | 1.0 | 5,793 | 603 | 10.4 |
| 2017-18 | 1,534 | 630 | 41.1 | 4,855 | 43 | 0.9 | 6,389 | 673 | 10.5 |
Source: Parole Board of Canada.
Note:
The presence of an Indigenous Cultural Advisor is an alternative approach to the traditional parole hearing, and was introduced by the Parole Board of Canada to ensure that conditional release hearings are sensitive to Indigenous cultural values and traditions. This type of hearing is available to both Indigenous and non-Indigenous offenders.
The term “Elder” also refers to a Cultural Advisor as defined in section 11.1.1.5 of the Decision-Making Policy Manual”.
Proportion of sentence served prior to being released on parole decreased
Figure D6
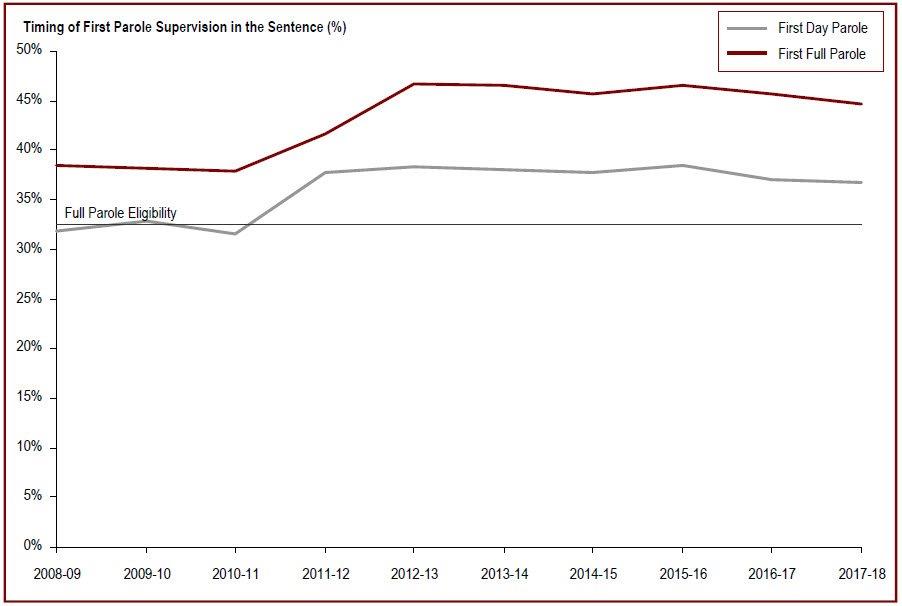
Source: Parole Board of Canada.
- In 2017-18, the average proportion of sentence served before the first federal day parole release for offenders serving determinate sentences decreased negligibly 0.3 of a percentage point (to 36.7%) from the previous year.
- The average proportion of sentence served before the first federal full parole release for offenders serving determinate sentences decreased 1 percentage point in 2017-18 (to 44.6%) when compared to the previous year.
- In 2017-18, male offenders served higher proportions of their sentences before being released on their first federal day parole and full parole (37.2%; 44.9%) than female offenders (33.4%; 42.4%).
- In 2017-18, female offenders and male offenders served an average of 5.2 and 4.8 percentage points more of their sentences before the first federal day parole release, and 5.9 and 6.2 percentage points more of their sentences before the first federal full parole release compared to 2008-09.
Note:
Timing of parole in the sentence refers to the percentage of the sentence served at the time the first day parole or full parole starts during the sentence. In most cases a full parole is preceded by a day parole. These calculations are based on sentences under federal jurisdiction, excluding life sentences and indeterminate sentences. Offenders (other than those serving life or indeterminate sentences or subject to judicial determination) normally become eligible for full parole after serving 1/3 of their sentence or seven years, whichever is less. Eligibility for day parole is normally at six months before full parole eligibility.
The increases in the average proportion of time served after 2010-11 are in part due to the effect of Bill C-59 and were driven primarily by offenders serving sentences for Schedule II and non-Schedule offences (some of whom were former APR-eligible offenders).
Proportion of sentence served prior to being released on parole decreased
| Year | Type of Supervision | |||||
|---|---|---|---|---|---|---|
| First Federal Day Parole | First Federal Full Parole | |||||
| Women | Men | Total | Women | Men | Total | |
| Percentage of Sentence Incarcerated | ||||||
| 2008-09 | 28.2 | 32.4 | 31.9 | 36.6 | 38.7 | 38.5 |
| 2009-10 | 29.5 | 33.2 | 32.8 | 36.1 | 38.5 | 38.2 |
| 2010-11 | 29.2 | 31.8 | 31.6 | 36.6 | 38.1 | 37.9 |
| 2011-12 | 35.0 | 38.1 | 37.8 | 40.3 | 41.7 | 41.6 |
| 2012-13 | 38.9 | 38.3 | 38.4 | 45.6 | 46.9 | 46.7 |
| 2013-14 | 34.9 | 38.3 | 38.0 | 44.2 | 46.8 | 46.6 |
| 2014-15 | 35.3 | 37.9 | 37.7 | 44.9 | 45.8 | 45.7 |
| 2015-16 | 36.9 | 38.7 | 38.5 | 45.2 | 46.6 | 46.5 |
| 2016-17 | 33.6 | 37.5 | 37.0 | 43.5 | 46.0 | 45.7 |
| 2017-18 | 33.4 | 37.2 | 36.7 | 42.4 | 44.9 | 44.6 |
Source: Parole Board of Canada.
Note:
Timing of parole in the sentence refers to the percentage of the sentence served at the time the first day parole or full parole starts during the sentence. In most cases a full parole is preceded by a day parole.
These calculations are based on sentences under federal jurisdiction, excluding life sentences and indeterminate sentences. Offenders (other than those serving life or indeterminate sentences or subject to judicial determination) normally become eligible for full parole after serving 1/3 of their sentence or seven years, whichever is less. Eligibility for day parole is normally at six months before full parole eligibility.
The increases in the average proportion of time served after 2010-11 are in part due to the effect of Bill C-59 and were driven primarily by offenders serving sentences for Schedule II and non-Schedule offences (some of whom were former APR-eligible offenders).
Indigenous offenders serve a higher proportion of their sentences before being released on parole
Figure D7
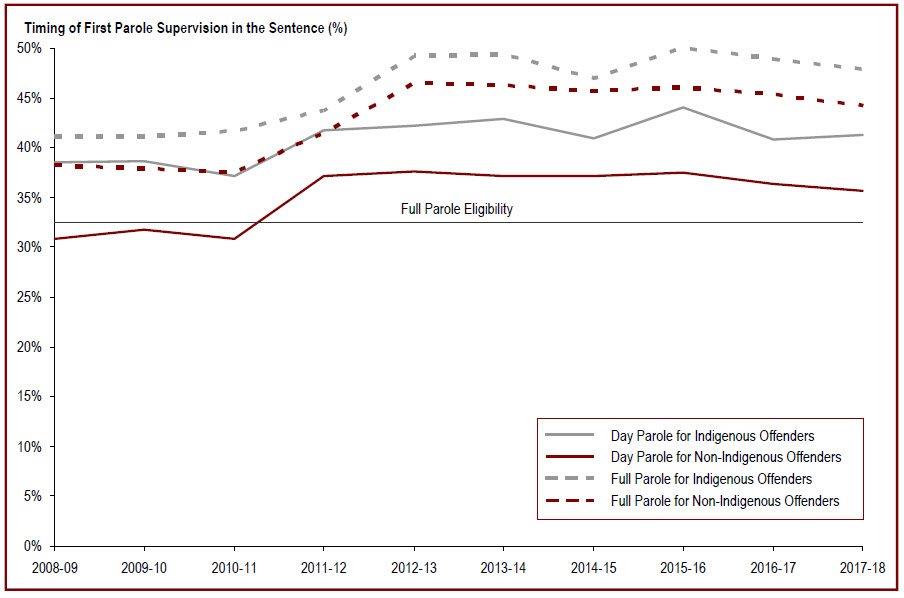
Source: Parole Board of Canada.
- In 2017-18, Indigenous offenders served higher proportions of their sentences before being released on their first federal day parole (41.3%) and full parole (47.8%, a decrease of one percentage point compared 2016-17), than non-Indigenous offenders (35.7%; 44.2%).
- Over the last ten years, Indigenous offenders served higher proportions of their sentences before their first federal day parole and full parole release (41.0%; 46.2%), than non-Indigenous offenders (35.1%; 42.6%).
Note:
Timing of parole in the sentence refers to the percentage of the sentence served at the time the first day parole or full parole starts during the sentence. In most cases a full parole is preceded by a day parole.
These calculations are based on sentences under federal jurisdiction, excluding life sentences and indeterminate sentences.
Offenders (other than those serving life or indeterminate sentences or subject to judicial determination) normally become eligible for full parole after serving 1/3 of their sentence or seven years, whichever is less. Eligibility for day parole is normally at six months before full parole eligibility.
The increases in the average proportion of time served after 2010-11 are in part due to the effect of Bill C-59 and were driven primarily by offenders serving sentences for Schedule II and non-Schedule offences (some of whom were former APR-eligible offenders).
Indigenous offenders serve a higher proportion of their sentences before being released on parole
| Year | Type of Supervision | |||||
|---|---|---|---|---|---|---|
| First Federal Day Parole | First Federal Full Parole | |||||
| Indigenous | Non-Indigenous | Total | Indigenous | Non-Indigenous | Total | |
| Percentage of Sentence Incarcerated | ||||||
| 2008-09 | 38.5 | 30.9 | 31.9 | 41.0 | 38.2 | 38.5 |
| 2009-10 | 38.7 | 31.8 | 32.8 | 41.0 | 37.9 | 38.2 |
| 2010-11 | 37.2 | 30.8 | 31.6 | 41.6 | 37.5 | 37.9 |
| 2011-12 | 41.7 | 37.1 | 37.8 | 43.7 | 41.4 | 41.6 |
| 2012-13 | 42.2 | 37.6 | 38.4 | 49.2 | 46.5 | 46.7 |
| 2013-14 | 42.9 | 37.1 | 38.0 | 49.3 | 46.2 | 46.6 |
| 2014-15 | 40.9 | 37.1 | 37.7 | 46.9 | 45.6 | 45.7 |
| 2015-16 | 44.0 | 37.5 | 38.5 | 50.8 | 46.0 | 46.5 |
| 2016-17 | 40.8 | 36.3 | 37.0 | 48.9 | 45.3 | 45.7 |
| 2017-18 | 41.3 | 35.7 | 36.7 | 47.8 | 44.2 | 44.6 |
Source: Parole Board of Canada.
Note:
Timing of parole in the sentence refers to the percentage of the sentence served at the time the first day parole or full parole starts during the sentence. In most cases a full parole is preceded by a day parole.
These calculations are based on sentences under federal jurisdiction, excluding life sentences and indeterminate sentences.
Offenders (other than those serving life or indeterminate sentences or subject to judicial determination) normally become eligible for full parole after serving 1/3 of their sentence or seven years, whichever is less. Eligibility for day parole is normally at six months before full parole eligibility.
The increases in the average proportion of time served after 2010-11 are in part due to the effect of Bill C-59 and were driven primarily by offenders serving sentences for Schedule II and non-Schedule offences (some of whom were former APR-eligible offenders).
The Successful completion of federal day parole increased
Figure D8
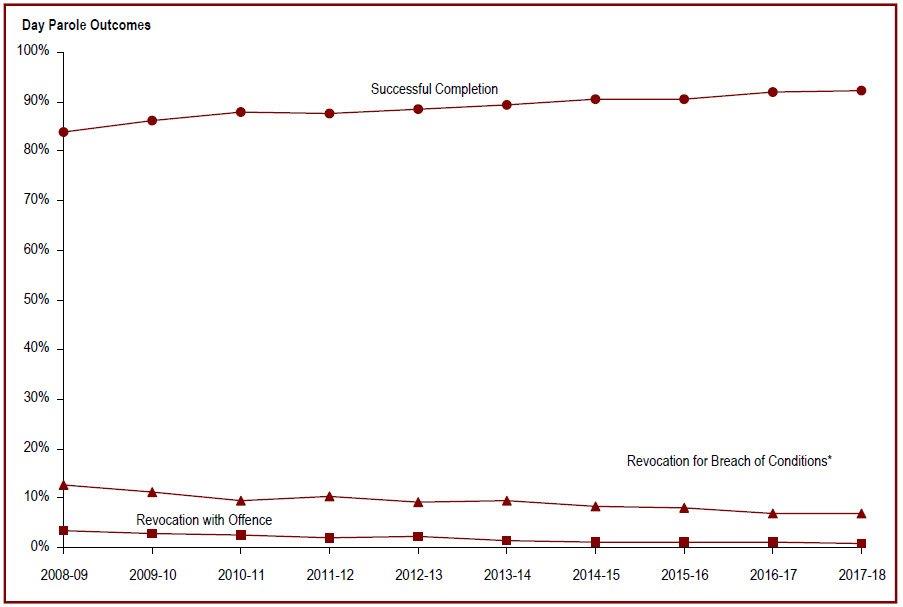
Source: Parole Board of Canada.
- In nine of the last ten years, the successful completion rate of federal day parole was over 85%.
- In 2017-18, the successful completion rate of federal day parole increased 0.4 of a percentage point to 92.2% compared to 2016-17.
- During the five-year period (between 2013-14 and 2017-18), the successful completion rate on federal day parole was on average 6.3 percentage points lower than the rate for federal APR day parole (90.8% and 97.1%, respectively).
- The rate of violent reoffending on federal day parole has been very low in the last five years, averaging 0.1%.
Note:
*Revocation for Breach of Conditions includes revocation with outstanding charges.
A day parole is considered successful if it was completed without a return to prison for a breach of conditions or for a new offence.
The Successful completion of federal day parole increased
| Federal Day Parole Outcomes | 2013-14 | 2014-15 | 2015-16 | 2016-17 | 2017-18 | |||||
|---|---|---|---|---|---|---|---|---|---|---|
| # | % | # | % | # | % | # | % | # | % | |
| Successful Completion | ||||||||||
| Regular | 2,766 | 89.2 | 2,784 | 90.4 | 2,981 | 90.5 | 3,171 | 91.6 | 3,452 | 92.2 |
| Accelerated | 27 | 100.0 | 36 | 100.0 | 38 | 100.0 | 86 | 97.7 | 84 | 93.3 |
| Total | 2,793 | 89.3 | 2,820 | 90.5 | 3,019 | 90.6 | 3,257 | 91.8 | 3,536 | 92.2 |
| Revocation for Breach of Conditions* | ||||||||||
| Regular | 293 | 9.4 | 260 | 8.4 | 273 | 8.3 | 248 | 7.2 | 261 | 7.0 |
| Accelerated | 0 | 0.0 | 0 | 0.0 | 0 | 0.0 | 2 | 2.3 | 6 | 6.7 |
| Total | 293 | 9.4 | 260 | 8.3 | 273 | 8.2 | 250 | 7.0 | 267 | 7.0 |
| Revocation with Non-Violent Offence | ||||||||||
| Regular | 36 | 1.2 | 35 | 1.1 | 32 | 1.0 | 35 | 1.0 | 31 | 0.8 |
| Accelerated | 0 | 0.0 | 0 | 0.0 | 0 | 0.0 | 0 | 0.0 | 0 | 0.0 |
| Total | 36 | 1.2 | 35 | 1.1 | 32 | 1.0 | 35 | 1.0 | 31 | 0.8 |
| Revocation with Violent Offence** | ||||||||||
| Regular | 7 | 0.2 | 1 | <0.01 | 8 | 0.2 | 7 | 0.2 | 2 | 0.1 |
| Accelerated | 0 | 0.0 | 0 | 0.0 | 0 | 0.0 | 0 | 0.0 | 0 | 0.0 |
| Total | 7 | 0.2 | 1 | <0.01 | 8 | 0.2 | 7 | 0.2 | 2 | 0.1 |
| Total | ||||||||||
| Regular | 3,102 | 99.1 | 3,080 | 98.8 | 3,294 | 98.9 | 3,461 | 97.5 | 3,746 | 97.7 |
| Accelerated | 27 | 0.9 | 36 | 1.2 | 38 | 1.1 | 88 | 2.5 | 90 | 2.3 |
| Total | 3,129 | 100.0 | 3,116 | 100.0 | 3,332 | 100.0 | 3,549 | 100.0 | 3,836 | 100.0 |
Source: Parole Board of Canada.
Note:
A day parole is considered successful if it was completed without a return to prison for a breach of conditions or for a new offence.
*Revocation for Breach of Conditions includes revocation with outstanding charges.
**Violent offences include murder and Schedule I offences (listed in the Corrections and Conditional Release Act) such as assaults, sexual offences, arson, abduction, robbery and some weapon offences.
The Successful completion of federal full parole increased
Figure D9
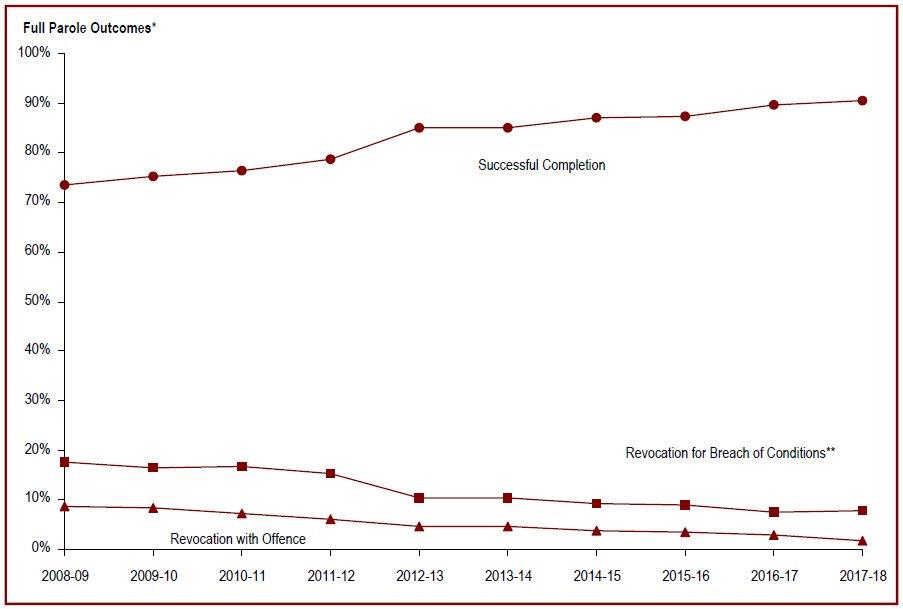
Source: Parole Board of Canada.
- In 2017-18, the successful completion rate on federal full parole for offenders serving determinate sentences increased 0.9 of a percentage point (to 90.5%) compared to 2016-17.
- While the average successful completion rate over the last five years (between 2013-14 and 2017-18) on federal full parole was 2.1 percentage points higher for offenders released on APR full parole than for offenders released on regular full parole (89.7%; 87.8%), the successful completion rate over the last three years has been higher for offenders released on regular full parole.
- The rate of violent reoffending on federal full parole has been decreasing in the last five years, averaging 0.5%.
Note:
*Excludes offenders serving indeterminate sentences because they do not have a warrant expiry date and can only successfully complete full parole upon [their] death.
**Revocation for Breach of Conditions includes revocation with outstanding charges.
A full parole is considered successful if it was completed without a return to prison for a breach of conditions or for a new offence.
The Successful completion of federal full parole increased
| Federal Day Parole Outcomes* | 2013-14 | 2014-15 | 2015-16 | 2016-17 | 2017-18 | |||||
|---|---|---|---|---|---|---|---|---|---|---|
| # | % | # | % | # | % | # | % | # | % | |
| Successful Completion | ||||||||||
| Regular | 579 | 81.9 | 734 | 86.9 | 757 | 87.5 | 847 | 89.8 | 961 | 90.7 |
| Accelerated | 246 | 93.2 | 97 | 87.4 | 95 | 86.4 | 89 | 88.1 | 101 | 88.6 |
| Total | 825 | 85.0 | 831 | 86.9 | 852 | 87.4 | 936 | 89.7 | 1,062 | 90.5 |
| Revocation for Breach of Conditions** | ||||||||||
| Regular | 90 | 12.7 | 78 | 9.2 | 76 | 8.8 | 67 | 7.1 | 81 | 7.6 |
| Accelerated | 12 | 4.5 | 11 | 9.9 | 12 | 10.9 | 10 | 9.9 | 10 | 8.8 |
| Total | 102 | 10.5 | 89 | 9.3 | 88 | 9.0 | 77 | 7.4 | 91 | 7.8 |
| Revocation with Non-Violent Offence | ||||||||||
| Regular | 30 | 4.2 | 32 | 3.8 | 25 | 2.9 | 25 | 2.7 | 14 | 1.3 |
| Accelerated | 5 | 1.9 | 3 | 2.7 | 3 | 2.7 | 1 | 1.0 | 3 | 2.6 |
| Total | 35 | 3.6 | 35 | 3.7 | 28 | 2.9 | 26 | 2.5 | 17 | 1.4 |
| Revocation with Violent Offence*** | ||||||||||
| Regular | 8 | 1.1 | 1 | 0.1 | 7 | 0.8 | 4 | 0.4 | 3 | 0.3 |
| Accelerated | 1 | 0.4 | 0 | 0.0 | 0 | 0.0 | 1 | 1.0 | 0 | 0.0 |
| Total | 9 | 0.9 | 1 | 0.1 | 7 | 0.7 | 5 | 0.5 | 3 | 0.3 |
| Total | ||||||||||
| Regular | 707 | 72.8 | 845 | 88.4 | 865 | 88.7 | 943 | 90.3 | 1,059 | 90.3 |
| Accelerated | 264 | 27.2 | 111 | 11.5 | 110 | 11.3 | 101 | 9.7 | 114 | 9.7 |
| Total | 971 | 100.0 | 956 | 100.0 | 975 | 100.0 | 1,044 | 100.0 | 1,173 | 100.0 |
Source: Parole Board of Canada.
Note:
*Excludes offenders serving indeterminate sentences because they do not have a warrant expiry date and can only successfully complete full parole upon [their] death.
**Revocation for Breach of Conditions includes revocation with outstanding charges.
***Violent offences include murder and Schedule I offences (listed in the Corrections and Conditional Release Act) such as assaults, sexual offences, arson, abduction, robbery and some weapon offences.
A full parole is considered successful if it was completed without a return to prison for a breach of conditions or for a new offence.
The Successful completion of statutory release increased
Figure D10
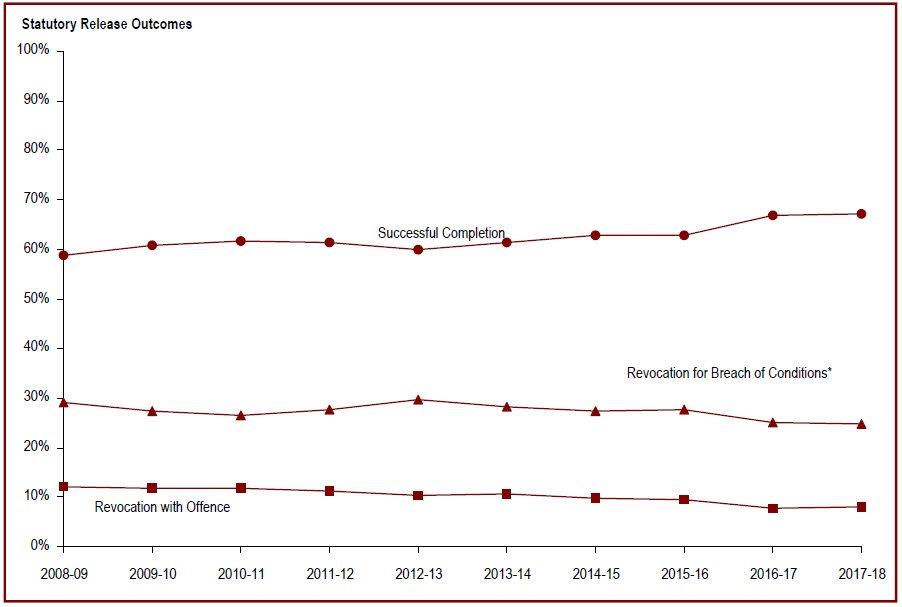
Source: Parole Board of Canada.
- In 2017-18, the successful completion rate of statutory release increased negligibly (+0.1%) to 67.1% compared to 2016-17.
- Over the last five years, the revocation with violent offence rates were, on average, ten and a half times higher for offenders on statutory release than for offenders on federal day parole and three times higher than for offenders on federal full parole.
- The rate of revocation with a violent offence for statutory release has been declining in the last five years, averaging 1.5%.
Note:
*Revocation for Breach of Conditions includes revocation with outstanding charges.
A statutory release is considered successful if it was completed without a return to prison for a breach of conditions or for a new offence.
An offender serving a determinate sentence, if he/she is not detained, will be subject to statutory release after serving 2/3 of his/her sentence if he/she is not on full parole at that time. On statutory release, an offender is subject to supervision until the end of his/her sentence.
The Successful completion of statutory release increased
| Statutory Release Outcomes | 2013-14 | 2014-15 | 2015-16 | 2016-17 | 2017-18 | |||||
|---|---|---|---|---|---|---|---|---|---|---|
| # | % | # | % | # | % | # | % | # | % | |
| Successful Completion | 3,805 | 61.4 | 3,759 | 62.8 | 3,780 | 62.8 | 3,789 | 67.0 | 3,545 | 67.1 |
| Revocation for Breach of Conditions* | 1,740 | 28.1 | 1,648 | 27.5 | 1,668 | 27.7 | 1,417 | 25.1 | 1,307 | 24.7 |
| Revocation with Non-Violent Offence | 536 | 8.6 | 489 | 8.2 | 481 | 8.0 | 374 | 6.6 | 384 | 7.3 |
| Revocation with Violent Offence** | 118 | 1.9 | 89 | 1.5 | 91 | 1.5 | 75 | 1.3 | 50 | 0.9 |
| Total | 6,199 | 100.0 | 5,985 | 100.0 | 6,020 | 100.0 | 5,655 | 100.0 | 5,286 | 100.0 |
Source: Parole Board of Canada.
Note:
*Revocation for Breach of Conditions includes revocation with outstanding charges.
**Violent offences include murder and Schedule I offences (listed in the Corrections and Conditional Release Act) such as assaults, sexual offences, arson, abduction, robbery and some weapon offences.
A statutory release is considered successful if it was completed without a return to prison for a breach of conditions or for a new offence.
An offender serving a determinate sentence, if he/she is not detained, will be subject to statutory release after serving 2/3 of his/her sentence if he/she is not on full parole at that time. On statutory release, an offender is subject to supervision until the end of his/her sentence.
Over the past decade, the rate of violent convictions for offenders while under supervision has declined
Figure D11
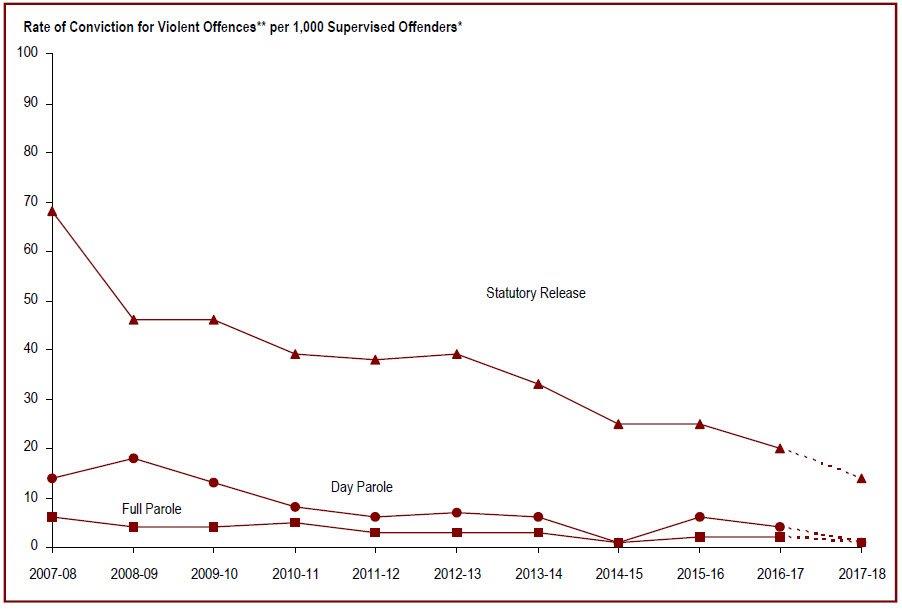
Source: Parole Board of Canada.
- Over the last ten years (between 2007-08 and 2016-17), the number of convictions for a violent offence decreased 65% for offenders on federal conditional release (from 255 in 2007-08 to 90 in 2016-17). Day parolees averaged 11 convictions for violent offences annually and full parolees, 13 convictions, compared to 129 by offenders on statutory release.
- Over the last ten years (between 2007-08 and 2016-17), convictions for violent offences on statutory release accounted for 85% of all convictions by offenders on federal conditional release.
- When comparing the rates of conviction for violent offences per 1,000 supervised offenders (between 2007-08 and 2016-17), offenders on statutory release were 11 and a half times more likely to commit a violent offence during their supervision periods than offenders on full parole, and 4 and a half times more likely to commit a violent offence than offenders on day parole.
Note:
*Supervised offenders include offenders who are on parole, statutory release, those temporarily detained in federal institutions, and those who are unlawfully at large.
**Violent offences include murder and Schedule I offences (listed in the Corrections and Conditional Release Act) such as assaults, sexual offences, arson, abduction, robbery and some weapon offences.
Day and full parole include those offenders serving determinate and indeterminate sentences.
The dotted line between 2016-17 and 2017-18 is intended to signify that due to delays in the court process, these numbers under-represent the actual number of convictions, as verdicts may have not been reached by year-end.
Over the past decade, the rate of violent convictions for offenders while under supervision has declined
| Year | # of Offenders Convicted for Violent Offences*** | Rate per 1,000 Supervised Offenders* | |||||
|---|---|---|---|---|---|---|---|
| Day Parole | Full Parole | Statutory Release | Total | Day Parole | Full Parole | Statutory Release | |
| 2007-08 | 18 | 23 | 214 | 255 | 14 | 6 | 68 |
| 2008-09 | 22 | 17 | 153 | 192 | 18 | 4 | 46 |
| 2009-10 | 17 | 16 | 149 | 182 | 13 | 4 | 46 |
| 2010-11 | 10 | 19 | 128 | 157 | 8 | 5 | 39 |
| 2011-12 | 8 | 10 | 135 | 153 | 6 | 3 | 38 |
| 2012-13 | 9 | 11 | 136 | 156 | 7 | 3 | 39 |
| 2013-14 | 7 | 10 | 118 | 135 | 6 | 3 | 33 |
| 2014-15 | 1 | 4 | 89 | 94 | 1 | 1 | 25 |
| 2015-16 | 8 | 9 | 91 | 108 | 6 | 2 | 25 |
| 2016-17 | 7 | 8 | 75 | 90 | 4 | 2 | 20 |
| 2017-18** | 2 | 3 | 50 | 55 | 1 | 1 | 14 |
Source: Parole Board of Canada.
Note:
*Supervised offenders include offenders who are on parole, statutory release, those temporarily detained in federal institutions, and those who are unlawfully at large.
**Due to delays in the court processes, the numbers under-represent the actual number of convictions, as verdicts may not have been reached by year-end. Day and full parole include those offenders serving determinate and indeterminate sentences.
***Violent offences include murder and Schedule I offences (listed in the Corrections and Conditional Release Act) such as assaults, sexual offences, arson, abduction, robbery and some weapon offences.
The number of offenders granted temporary absences
Figure D12
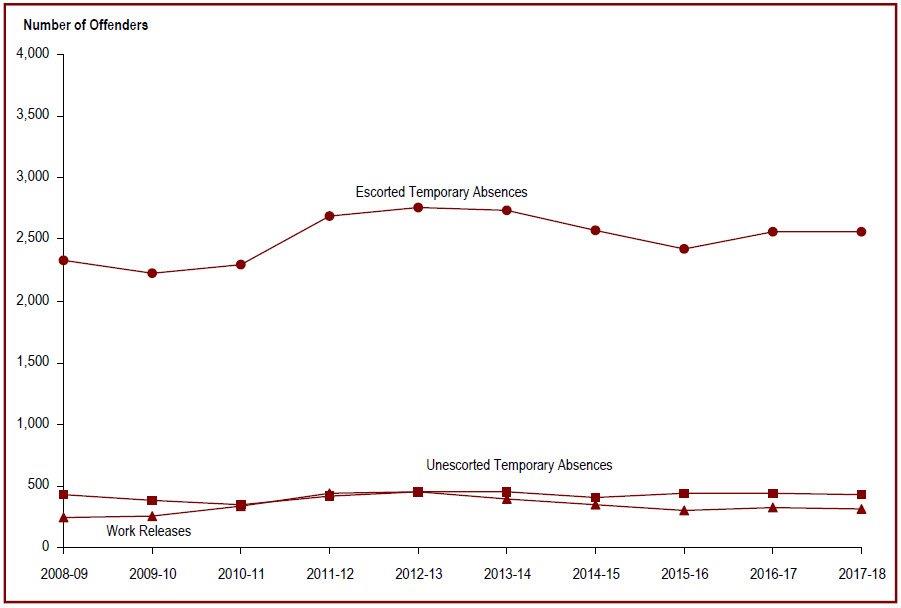
Source: Correctional Service Canada.
- There was a small increase in the number of offenders receiving escorted temporary absences, from 2,546 in 2016-17 to 2,567 in 2017-18. There was a small decrease in the number of offenders receiving unescorted temporary absences, from 443 in 2016-17 to 428 in 2017-18.
- The number of offenders receiving work releases has decreased by 3.7%, from 324 in 2016-17 to 312 in 2017-18.
- For the past 10 years, the average successful completion rates for escorted temporary absences was 99.5%, 98.8% for unescorted temporary absences and 94.6% for work releases.
Note:
A temporary absence is permission given to an eligible offender to be away from the normal place of confinement for medical, administrative, community service, family contact, personal development for rehabilitative purposes, or compassionate reasons, including parental responsibilities.
A work release is a structured program of release of specified duration for work or community service outside the penitentiary, under the supervision of a staff member or other authorized person or organization.
These numbers depict the number of offenders who received at least one temporary absence permit (excluding those for medical purposes) or at least one work release. An offender may be granted more than one temporary absence permit or work release over a period of time.
The number of offenders granted temporary absences
| Year | Temporary Absences | Work Releases | ||||
|---|---|---|---|---|---|---|
| Escorted | Unescorted | |||||
| # of Offenders | # of Permits | # of Offenders | # of Permits | # of Offenders | # of Permits | |
| 2008-09 | 2,336 | 36,137 | 432 | 3,659 | 243 | 663 |
| 2009-10 | 2,222 | 35,816 | 388 | 3,295 | 254 | 1,063 |
| 2010-11 | 2,301 | 40,074 | 353 | 3,117 | 339 | 1,343 |
| 2011-12 | 2,685 | 44,399 | 418 | 3,891 | 435 | 875 |
| 2012-13 | 2,753 | 47,815 | 448 | 3,709 | 455 | 815 |
| 2013-14 | 2,740 | 49,502 | 447 | 4,004 | 400 | 643 |
| 2014-15 | 2,574 | 49,633 | 411 | 3,563 | 346 | 490 |
| 2015-16 | 2,428 | 47,084 | 445 | 4,078 | 304 | 418 |
| 2016-17 | 2,546 | 48,590 | 443 | 3,798 | 324 | 482 |
| 2017-18 | 2,567 | 50,711 | 428 | 3,190 | 312 | 445 |
Source: Correctional Service Canada.
Note:
A temporary absence is permission given to an eligible offender to be away from the normal place of confinement for medical, administrative, community service, family contact, personal development for rehabilitative purposes, or compassionate reasons, including parental responsibilities.
A work release is a structured program of release of specified duration for work or community service outside the penitentiary, under the supervision of a staff member or other authorized person or organization.
These numbers depict the number of offenders who received at least one temporary absence permit (excluding those for medical purposes) or at least one work release. An offender may be granted more than one temporary absence permit or work release over a period of time.
Section E: Statistics on Special Applications of Criminal Justice
The number of initial detention reviews decreased
Figure E1
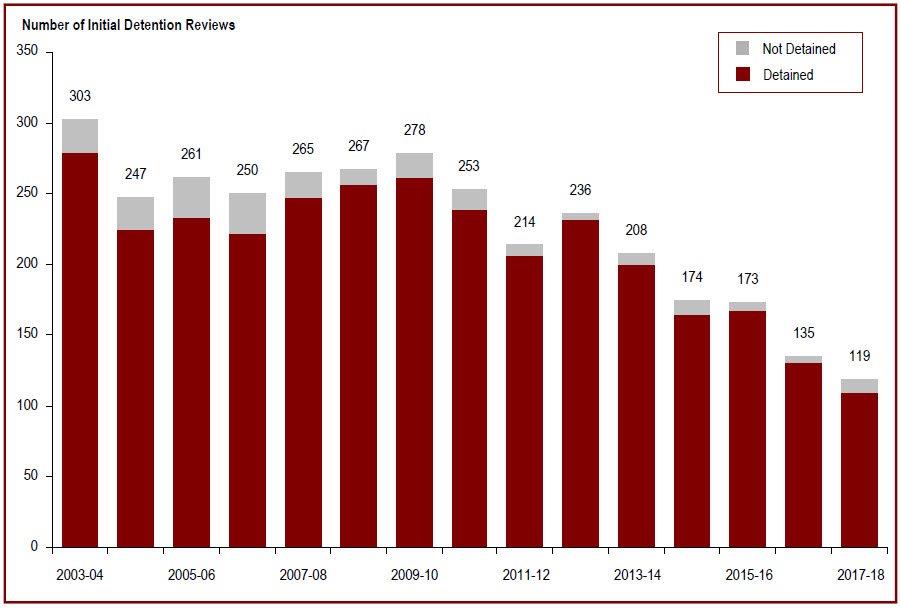
Source: Parole Board of Canada.
- In 2017-18, the number of referrals for detention decreased by 12% to 119 (from 135) when compared to 2016-17.
- The numbers of offenders detained as a result of a detention review decreased to 110 (-16%) compared to the previous year, while the proportion decreased to 92.4%. Nine offenders were released on statutory release following a detention review in 2017-18.
- Averaged over the last five years, the detention rate for Indigenous offenders was 94.6% compared to 96.1% for non-Indigenous offenders. Nineteen Indigenous offenders and eighteen non-Indigenous offenders were released on statutory release in the last five years.
- In 2017-18, Indigenous offenders accounted for 27.7% of federal incarcerated offenders serving determinate sentences while they accounted for 47.9% of offenders referred for detention and 42.9% of offenders detained.
Note:
According to the Corrections and Conditional Release Act, an offender entitled to statutory release after serving two-thirds of the sentence may be held in custody until warrant expiry if it is established that the offender is likely to commit, before the expiry of his/her sentence, an offence causing death or serious harm, a serious drug offence or a sex offence involving a child.
The number of initial detention reviews decreased
| Outcome of Initial Detention Reviews | |||||||||||
|---|---|---|---|---|---|---|---|---|---|---|---|
| Year | Detained | Statutory Release | Total | Total | |||||||
| Ind. | Non-Ind. | Total | % | Ind. | Non-Ind. | Total | % | Ind. | Non-Ind. | ||
| 2003-04 | 76 | 203 | 279 | 92.1 | 8 | 16 | 24 | 7.9 | 84 | 219 | 303 |
| 2004-05 | 71 | 154 | 225 | 91.1 | 6 | 16 | 22 | 8.9 | 77 | 170 | 247 |
| 2005-06 | 75 | 158 | 233 | 89.3 | 11 | 17 | 28 | 10.7 | 86 | 175 | 261 |
| 2006-07 | 65 | 157 | 222 | 88.8 | 4 | 24 | 28 | 11.2 | 69 | 181 | 250 |
| 2007-08 | 91 | 156 | 247 | 93.2 | 7 | 11 | 18 | 6.8 | 98 | 167 | 265 |
| 2008-09 | 107 | 149 | 256 | 95.9 | 5 | 6 | 11 | 4.1 | 112 | 156 | 267 |
| 2009-10 | 99 | 162 | 261 | 93.9 | 2 | 15 | 17 | 6.1 | 101 | 177 | 278 |
| 2010-11 | 113 | 126 | 239 | 94.5 | 5 | 9 | 14 | 5.5 | 118 | 135 | 253 |
| 2011-12 | 88 | 119 | 207 | 96.7 | 3 | 4 | 7 | 3.3 | 91 | 123 | 214 |
| 2012-13 | 92 | 140 | 232 | 98.3 | 4 | 0 | 4 | 1.7 | 96 | 140 | 236 |
| 2013-14 | 85 | 115 | 200 | 96.2 | 4 | 4 | 8 | 3.8 | 89 | 119 | 208 |
| 2014-15 | 67 | 97 | 164 | 94.3 | 5 | 5 | 10 | 5.7 | 72 | 102 | 174 |
| 2015-16 | 73 | 94 | 167 | 96.5 | 2 | 4 | 6 | 3.5 | 75 | 98 | 173 |
| 2016-17 | 56 | 75 | 131 | 97.0 | 2 | 2 | 4 | 3.0 | 58 | 77 | 135 |
| 2017-18 | 51 | 59 | 110 | 92.4 | 6 | 3 | 9 | 7.6 | 57 | 61 | 119 |
| Total | 1,209 | 1,964 | 3,173 | 93.8 | 74 | 136 | 210 | 6.2 | 1,283 | 2,100 | 3,383 |
Source: Parole Board of Canada.
Note:
According to the Corrections and Conditional Release Act, an offender entitled to statutory release after serving two-thirds of the sentence may be held in custody until warrant expiry if it is established that the offender is likely to commit, before the expiry of his/her sentence, an offence causing death or serious harm, a serious drug offence or a sex offence involving a child.
76% of Judicial Review Hearings Result in Earlier Parole Eligibility
Figure E2
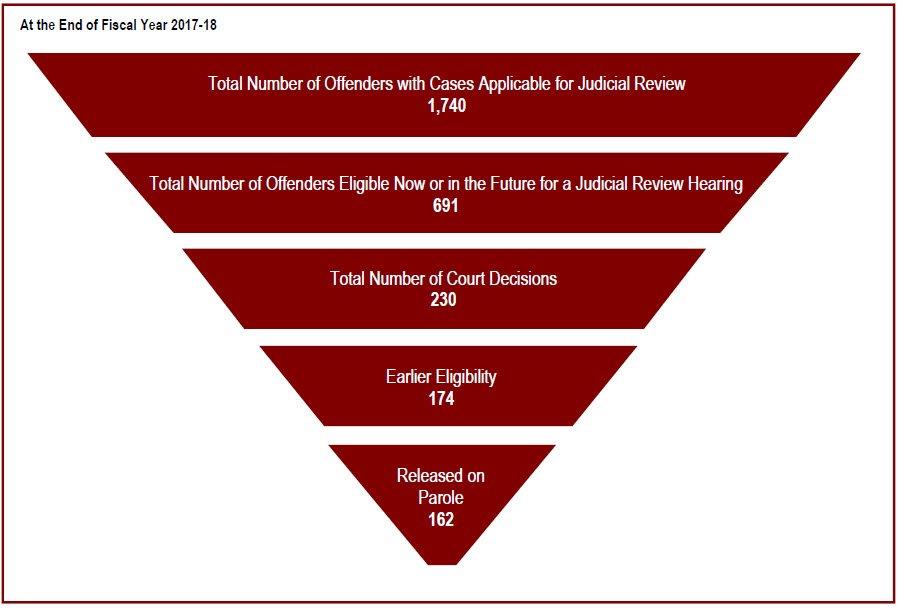
Source: Correctional Service Canada.
- Since the first judicial review hearing in 1987, there had been a total of 230 court decisions.
- Of these cases, 75.7% of the court decisions resulted in a reduction of the period that must be served before parole eligibility.
- Of the 691 offenders eligible to apply for a judicial review, 275 had already served 15 years of their sentence, whereas 416 had not.
- Of the 174 offenders who have had their parole eligibility date moved closer, 171 had reached their revised day parole eligibility date. Of these offenders, 162 had been released on parole, and 113 were being actively supervised in the community.*
- A higher percentage of second degree (83.3%) than first degree (74.8%) murder cases have resulted in a reduction of the period required to be served before parole eligibility.
Note:
*Of the 49 offenders no longer under active supervision, 7 were in custody, 34 were deceased, 6 were deported, and 2 were temporarily detained. Judicial review is an application to the court for a reduction in the time required to be served before being eligible for parole. Judicial review procedures apply to offenders who committed the offences prior to December 2, 2011 and have been sentenced to imprisonment for life without eligibility for parole for 15 years or more. Judicial reviews exclude offenders convicted of more than one murder. Eligible offenders can apply for a reduction in parole ineligibility when they have served at least 15 years of their sentence.
Judicial reviews are conducted in the province where the conviction took place.
76% of Judicial Review Hearings Result in Earlier Parole Eligibility
| Province/Territory of Judicial Review | Parole Ineligibility Reduced by Court | Reduction Denied by Court | Total | |||
|---|---|---|---|---|---|---|
| 1stDegree Murder | 2ndDegree Murder | 1stDegree Murder | 2ndDegree Murder | 1stDegree Murder | 2ndDegree murder | |
| Northwest Territories | 0 | 0 | 0 | 0 | 0 | 0 |
| Nunavut | 0 | 0 | 0 | 0 | 0 | 0 |
| Yukon Territories | 0 | 0 | 0 | 0 | 0 | 0 |
| Newfoundland & Labrador | 0 | 0 | 0 | 0 | 0 | 0 |
| Prince Edward Island | 0 | 0 | 0 | 0 | 0 | 0 |
| Nova Scotia | 1 | 1 | 1 | 0 | 2 | 1 |
| New Brunswick | 1 | 0 | 0 | 0 | 1 | 0 |
| Quebec | 73 | 15 | 6 | 2 | 79 | 17 |
| Ontario | 23 | 0 | 28 | 1 | 51 | 1 |
| Manitoba | 8 | 3 | 1 | 0 | 9 | 3 |
| Saskatchewan | 7 | 0 | 3 | 0 | 10 | 0 |
| Alberta | 19 | 0 | 7 | 1 | 26 | 1 |
| British Columbia | 22 | 1 | 6 | 0 | 28 | 1 |
| Sub-total | 154 | 20 | 52 | 4 | 206 | 24 |
| Total | 174 | 56 | 230 | |||
Source: Correctional Service Canada.
Note:
These numbers represent total decisions at the end of fiscal year 2017-18.
Judicial reviews are conducted in the province where the conviction took place.
The Number of Dangerous Offender Designations
Figure E3
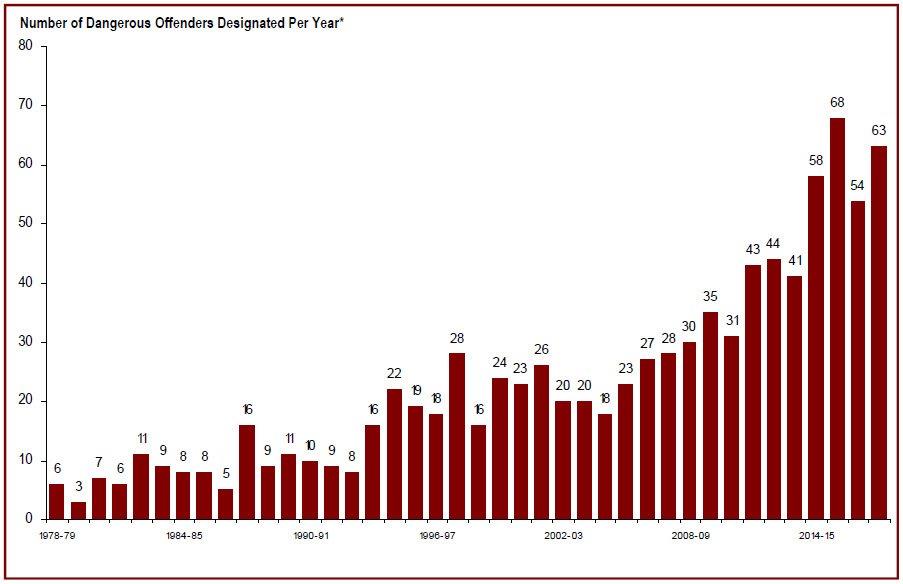
Source: Correctional Service Canada.
- At the end of fiscal year 2017-18, there have been 921 offenders designated as Dangerous Offenders (DOs) since 1978. Of these, 67.9% had at least one current conviction for a sexual offence.
- At the end of fiscal year 2017-18, there were 792 DOs under the responsibility of Correctional Service Canada, and of those 81.3% had indeterminate sentences.
- Of these 792 DOs, 712 were in custody (representing 5.1% of the In-Custody Population) and 80 were in the community under supervision.
- There were eight women with a Dangerous Offender designation.
- Indigenous offenders accounted for 35.5% of DOs and 24.0% of the total offender population.
Note:
The number of Dangerous Offenders designated per year does not include overturned decisions.
Offenders who have died since receiving designations are no longer classified as "active"; however, they are still represented in the above graph, which depicts the total number of offenders ‘"designated". Dangerous Offender legislation came into effect in Canada on October 15, 1977, replacing the Habitual Offender and Dangerous Sexual Offender provisions that were abolished. A Dangerous Offender (DO) is an individual given an indeterminate or *determinate sentence on the basis of a particularly violent crime or pattern of serious violent offences where it is judged that the offender's behaviour is unlikely to be inhibited by normal standards of behavioural restraint (see section 753 of the Criminal Code of Canada).
In addition to the DOs, there were 15 Dangerous Sexual Offenders and 3 Habitual Offenders under the responsibility of CSC at the end of fiscal year 2017-18.
*Determinate sentences for Dangerous Offenders must be a minimum punishment of imprisonment for a term of two years and have an order that the offender be subject to a long-term supervision period that does not exceed 10 years.
The Number of Dangerous Offender Designations
| Province/Territory of Designation | All Designations (# Designated Since 1978) |
Active Dangerous Offenders | ||
|---|---|---|---|---|
| # of Indeterminate Offenders | # of Determinate Offenders | Total | ||
| Newfoundland & Labrador | 13 | 8 | 1 | 9 |
| Nova Scotia | 25 | 19 | 2 | 21 |
| Prince Edward Island | 0 | 0 | 0 | 0 |
| New Brunswick | 8 | 4 | 0 | 4 |
| Quebec | 116 | 91 | 16 | 107 |
| Ontario | 391 | 263 | 72 | 335 |
| Manitoba | 29 | 26 | 2 | 28 |
| Saskatchewan | 98 | 56 | 33 | 89 |
| Alberta | 65 | 52 | 3 | 55 |
| British Columbia | 156 | 111 | 13 | 124 |
| Yukon Territories | 7 | 2 | 5 | 7 |
| Northwest Territories | 11 | 11 | 0 | 11 |
| Nunavut | 2 | 1 | 1 | 2 |
| Total | 921 | 644 | 148 | 792 |
Source: Correctional Service Canada.
Note:
Numbers presented are as of end of fiscal year 2017-18.
The number of Dangerous Offenders declared per year does not include overturned decisions.
Offenders who have died since receiving designations are no longer classified as "active"; however, they are still represented in the total number of offenders "designated".
Most Long-term Supervision Orders are for a 10-year period
Figure E4
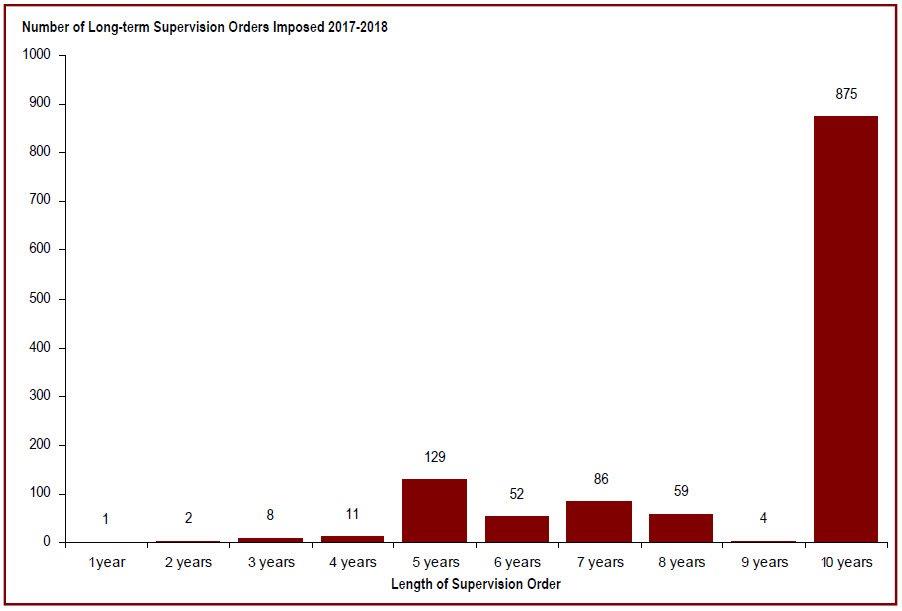
Source: Correctional Service Canada.
- At the end of fiscal year 2017-18, the courts had imposed 1,227 long-term supervision orders. Of these, 71.3% were for a period of 10 years.
- At the end of fiscal year 2017-18, there were 880 offenders with long-term supervision orders under the responsibility of Correctional Services Canada, and of these, 565 (64.2%) had at least one current conviction for a sexual offence.
- There were 17 women with long-term supervision orders.
- There were 450 offenders being supervised in the community on their long-term supervision orders at the end of fiscal year 2017-18. Of these, 396 offenders were supervised in the community, seven offenders were temporarily detained, 42 offenders were on remand, four offenders were unlawfully at large for less than 90 days and one offender was supervised and subject to an immigration hold by Canada Border Services Agency.
Note:
Long-term Supervision Order (LTSO) legislation, which came into effect in Canada on August 1, 1997, allows the court to impose a sentence of two years or more for the predicate offence and order that the offender be supervised in the community for a further period not exceeding 10 years.
Seventy five offenders under these provisions have died, and 210 offenders have completed their long-term supervision period.
Remand is the temporary detention of a person while awaiting trial, sentencing or the commencement of a custodial disposition.
Most Long-term Supervision Orders are for a 10-year period
| Province or Territory of Order | Length of Supervision Order (Years) | Current Status 2017-2018 | ||||||||||||||
|---|---|---|---|---|---|---|---|---|---|---|---|---|---|---|---|---|
| 1 | 2 | 3 | 4 | 5 | 6 | 7 | 8 | 9 | 10 | Total | Incarcerated | DP, FP or SR* | LTSO period | LTSO**interrupted | Total | |
| Newfoundland & Labrador | 0 | 0 | 0 | 0 | 0 | 0 | 0 | 1 | 0 | 10 | 11 | 3 | 0 | 6 | 0 | 9 |
| Nova Scotia | 0 | 0 | 0 | 0 | 5 | 0 | 1 | 2 | 0 | 13 | 21 | 3 | 1 | 10 | 0 | 14 |
| Prince Edward Island | 0 | 0 | 0 | 0 | 1 | 0 | 0 | 0 | 0 | 1 | 2 | 0 | 0 | 0 | 0 | 0 |
| New Brunswick | 0 | 0 | 1 | 0 | 2 | 0 | 0 | 1 | 0 | 8 | 12 | 2 | 1 | 2 | 2 | 7 |
| Quebec | 1 | 1 | 7 | 2 | 63 | 18 | 40 | 12 | 2 | 258 | 404 | 108 | 19 | 143 | 22 | 292 |
| Ontario | 0 | 0 | 0 | 6 | 20 | 15 | 21 | 23 | 0 | 275 | 360 | 73 | 14 | 152 | 27 | 266 |
| Manitoba | 0 | 0 | 0 | 0 | 1 | 2 | 3 | 1 | 0 | 37 | 44 | 6 | 0 | 12 | 7 | 25 |
| Saskatchewan | 0 | 1 | 0 | 1 | 11 | 9 | 13 | 11 | 2 | 70 | 118 | 48 | 3 | 30 | 14 | 95 |
| Alberta | 0 | 0 | 0 | 0 | 8 | 1 | 0 | 1 | 0 | 67 | 77 | 13 | 3 | 27 | 6 | 49 |
| British Columbia | 0 | 0 | 0 | 2 | 14 | 5 | 5 | 6 | 0 | 116 | 148 | 35 | 4 | 56 | 6 | 101 |
| Yukon Territories | 0 | 0 | 0 | 0 | 1 | 0 | 3 | 0 | 0 | 15 | 19 | 8 | 0 | 7 | 0 | 15 |
| Northwest Territories | 0 | 0 | 0 | 0 | 1 | 1 | 0 | 0 | 0 | 2 | 4 | 1 | 0 | 1 | 0 | 2 |
| Nunavut | 0 | 0 | 0 | 0 | 2 | 1 | 0 | 1 | 0 | 3 | 7 | 0 | 0 | 4 | 1 | 5 |
| Total | 1 | 2 | 8 | 11 | 129 | 52 | 86 | 59 | 4 | 875 | 1,277 | 300 | 45 | 450 | 85 | 880 |
Source: Correctional Service Canada.
Note:
*This category includes offenders whose current status is either supervised on day parole (DP), full parole (FP) or statutory release (SR).
**This category includes offenders convicted of a new offence while on the supervision portion of an LTSO. When this occurs, the LTSO supervision period is interrupted until the offender has served the new sentence to its warrant expiry date. At that time, the LTSO supervision period resumes where it left off. From the 85, 69 offenders were in custody, 15 were supervised in the community on statutory release and 1 offender was on remand.
Long-term Supervision Order (LTSO) legislation, which came into effect in Canada on August 1, 1997, allows the court to impose a sentence of two years or more for the predicate offence and order that the offender be supervised in the community for a further period not exceeding 10 years.
75 offenders under these provisions have died, and 210 offenders have completed their long-term supervision period.
Remand is the temporary detention of a person while awaiting trial, sentencing or the commencement of a custodial disposition.
The Number of Record Suspension Applications Received has Decreased
Figure E5
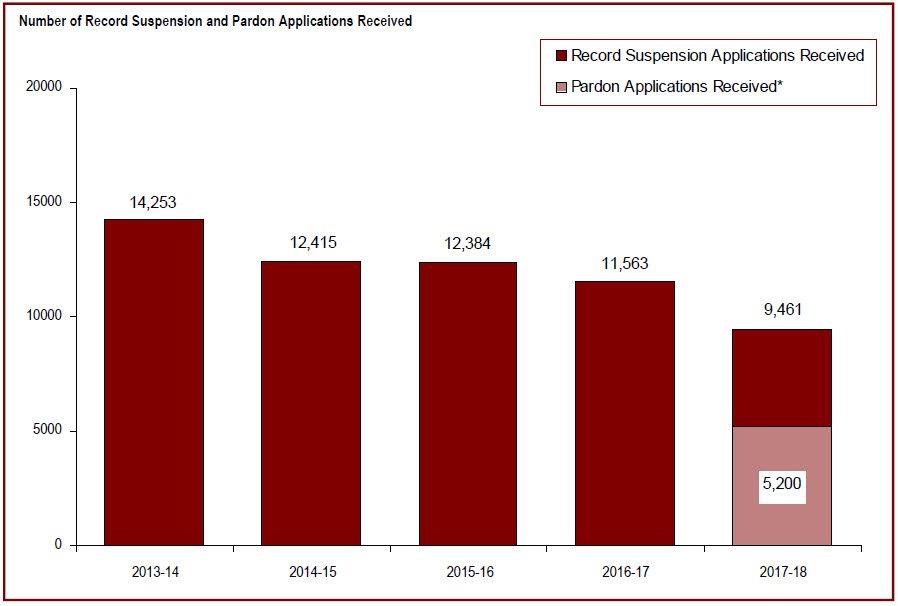
Source: Parole Board of Canada.
- In 2017-18, the Parole Board received 9,461 record suspension applications and accepted 6,529 applications for processing as record suspensions and 638, as pardons (Ontario and British Columbia cases). The Board also received 5,200 pardon applications and accepted 4,429 pardon applications for processing. The acceptance rate was 79.1%.
- In 2017-18, the Board rendered 2,089 pardon decisions, granting a pardon in 93.6% of cases and denying apardon in 6.4% of cases.
- In 2017-18, the Board made 7,180 record suspension decisions; 98% of record suspensions were ordered and 2% were refused.
- Since 1970, when the pardon/record suspension process began, 525,187 pardons/record suspensions have been granted/issued and ordered.
Note:
*Refers to pardon applications processed for residents of Ontario and British Columbia following the reversal of the amendments to the CRA (Canada Revenue Agency) by Supreme Court decisions in those provinces.
On March 13, 2012, Bill C-10 amended the CRA by replacing the term "pardon" with the term "record suspension". The Record Suspension and Clemency program involves the review of record suspension applications, the ordering of record suspensions and the making of clemency recommendations. The amendments to the CRA increased the waiting periods for a record suspension to five years for all summary convictions and to ten years for all indictable offences. Individuals convicted of sexual offences against minors (with certain exceptions) and those who have been convicted of more than three indictable offences, each with a sentence of two or more years, became ineligible for a record suspension
The Number of Record Suspension Applications Received has Decreased
| 2013-14 | 2014-15 | 2015-16 | 2016-17 | 2017-18 | |
|---|---|---|---|---|---|
| Record Suspension Applications Processed | |||||
| Applications Received | 14,253 | 12,415 | 12,384 | 11,563 | 9,461 |
| Applications Accepted | 9,624 | 9,071 | 8,917 | 8,191 | 7,1671 |
| % Accepted | 67.5 | 73.1 | 72.0 | 70.8 | 75.8 |
| Record Suspensions | |||||
| Ordered | 8,511 | 8,422 | 8,428 | 8,340 | 7,038 |
| Refused | 772 | 726 | 525 | 439 | 142 |
| Total Ordered/Refused | 9,283 | 9,148 | 8,953 | 8,779 | 7,180 |
| % Ordered | 91.7 | 92.1 | 94.1 | 95.0 | 98.0 |
| Pardon Applications Processed | |||||
| Applications Received | - - | - - | - - | - - | 5,2002 |
| Applications Accepted | - - | - - | - - | - - | 4,4292 |
| % Accepted | - - | - - | - - | - - | 85.2 |
| Pardons | |||||
| Granted | 8,265 | 5,625 | 1,628 | 3,740 | 222 |
| Issued | - - | - - | - - | - - | 1,734 |
| Denied | 581 | 681 | 349 | 125 | 133 |
| Total Granted/Denied | 8,8463 | 6,3063 | 1,9773 | 3,8653 | 2,0892 |
| % Granted | 93.4 | 89.2 | 82.3 | 96.8 | 93.6 |
| Pardon/Record Suspension Revocations/Cessations | |||||
| Revocations4 | 669 | 438 | 670 | 501 | 85 |
| Cessations | 589 | 578 | 636 | 776 | 692 |
| Total Revocations/Cessations | 1,258 | 1,016 | 1,306 | 1,277 | 777 |
| Cumulative Granted/Issued and Ordered5 | 480,010 | 494,057 | 504,113 | 516,193 | 525,187 |
| Cumulative Revocations/Cessations5 | 22,321 | 23,337 | 24,643 | 25,920 | 26,697 |
Source: Parole Board of Canada.
Note:
1Includes 638 record suspension applications that were discontinued and reclassified as pardon applications for residents of Ontario and British Columbia following the reversal of amendments to the CRA by Supreme Court decisions in those provinces.
2Refers to pardon applications processed for residents of Ontario and British Columbia following the reversal of the amendments to the CRA by Supreme Court decisions in those provinces.
3Refers to pardon applications received on or before March 12, 2012 (C-10).
4Revocations fluctuate due to resource re-allocation to deal with backlogs.
5Cumulative data reflects activity since 1970, when the pardon process was established under the Criminal Records Act.
On June 29, 2010, Bill C-23A amended the CRA by extending the ineligibility periods for certain applications for pardon. Additionally, the bill resulted in significant changes to program operations.
The process was modified to include additional inquiries and new, more exhaustive investigations by staff for some applications and required additional review time by Board members. New concepts of merit and disrepute to the administration of justice form part of the statute. As a result of these new changes, application processing time increased. On March 13, 2012, Bill C-10 amended the CRA by replacing the term "pardon" with the term "record suspension"”. The Record Suspension and Clemency program involves the review of record suspension applications, the ordering of record suspensions and the making of clemency recommendations. The amendments to the CRA increased the waiting periods for a record suspension to five years for all summary convictions and to ten years for all indictable offences. Individuals convicted of sexual offences against minors (with certain exceptions) and those who have been convicted of more than three indictable offences, each with a sentence of two or more years, became ineligible for a record suspension.
Section F: Victims of Crime
Victimization rates for theft of personal property and assault decreased in 2014
Figure F1
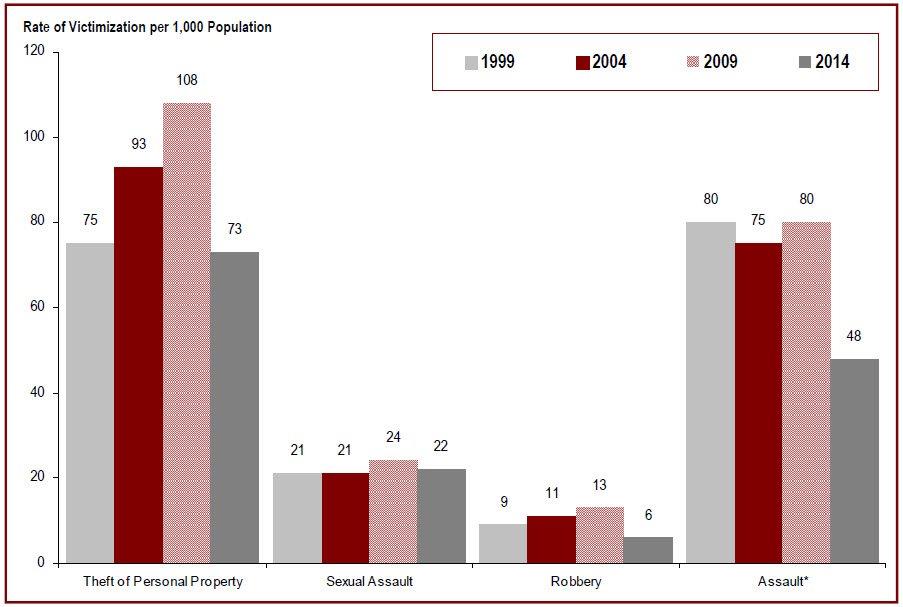
Source: General Social Survey, Statistics Canada, 1999, 2004, 2009 and 2014.
- Victimization rates for theft of personal property were lower in 2014 than in previous years.
- Victimization rates for assault were lower in 2014 than in previous years.
- Since 1999, the rates of victimization for sexual assault have remained stable.
Note:
The General Social Survey is administered every five years by Statistics Canada. Updated data were not available during the preparation of this report. It is anticipated that updated data will be available in 2020.
*Assault data includes incidents of spousal violence. In previous editions of this document, the victimization data excluded incidents of spousal violence.
Rates are based on 1,000 population, 15 years of age and older, across the 10 provinces.
Victimization rates for theft of personal property and assault decreased in 2014
| Type of Incident | Year | |||
|---|---|---|---|---|
| 1999 | 2004 | 2009 | 2014 | |
| Theft of Personal Property | 75 | 93 | 108 | 73 |
| Sexual Assault | 21 | 21 | 24 | 22 |
| Robbery | 9 | 11 | 13 | 6 |
| Assault* | 80 | 75 | 80 | 48 |
Source: General Social Survey, Statistics Canada, 1999, 2004, 2009 and 2014.
Note:
The General Social Survey is administered every five years by Statistics Canada. Updated data were not available during the preparation of this report. It is anticipated that updated data will be available in 2020.
*Assault data includes incidents of spousal violence. In previous editions of this document, the victimization data excluded incidents of spousal violence.
Rates are based on 1,000 population, 15 years of age and older, across the 10 provinces.
The majority of victims of violent crime are under age 30
Figure F2
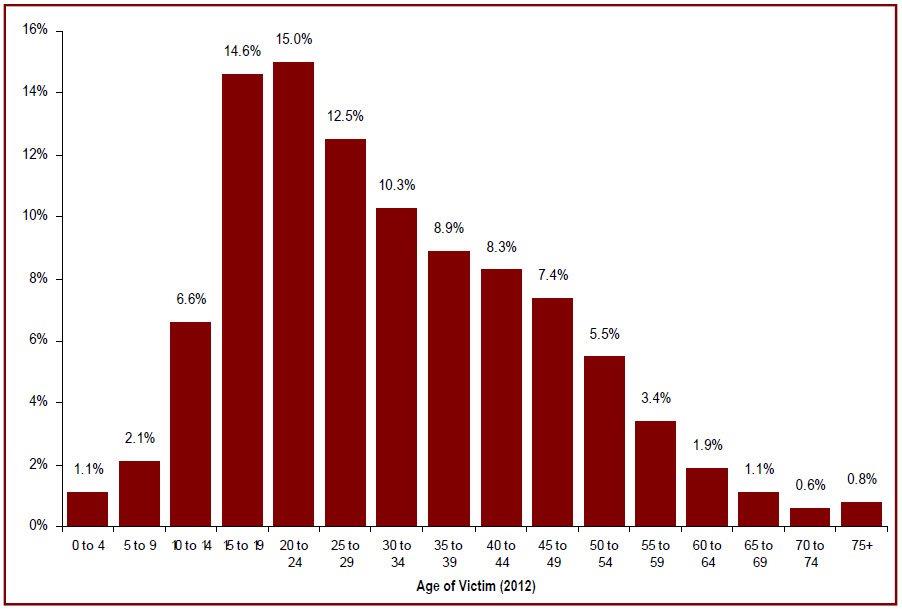
Source: Incident-based Uniform Crime Reporting Survey, Canadian Centre for Justice Statistics, Statistics Canada.
- More than half (51.9%) of all victims of violent crime reported in 2012 were under the age of 30, whereas 36.9% of the Canadian population is under the age of 30*.
- Women aged 15 to 39 were more likely than men of that age to be victims of crime.
- Canadians aged 65 and older, who account for 14.1% of the general population*, represent 2.4% of victims of crime.
Note:
Updated data were not available during the preparation of this report.
*Population estimates are as of July 1, 2010.
The data excludes traffic violations, victims whose age is above 89, victims whose age is unknown and victims whose gender is unknown.
Due to rounding, totals may not add up to 100 percent.
The majority of victims of violent crime are under age 30
| Age of Victim | Men | Women | Total | |||
|---|---|---|---|---|---|---|
| # | % | # | % | # | % | |
| 0 to 4 years | 1,761 | 1.0 | 2,053 | 1.1 | 3,814 | 1.1 |
| 5 to 9 years | 3,803 | 2.2 | 3,724 | 2.0 | 7,527 | 2.1 |
| 10 to 14 years | 11,716 | 6.7 | 12,109 | 6.5 | 23,825 | 6.6 |
| 15 to 19 years | 25,294 | 14.4 | 27,674 | 14.9 | 52,968 | 14.6 |
| 20 to 24 years | 24,712 | 14.1 | 29,380 | 15.8 | 54,092 | 15.0 |
| 25 to 29 years | 21,477 | 12.2 | 23,897 | 12.9 | 45,374 | 12.5 |
| 30 to 34 years | 17,282 | 9.8 | 20,001 | 10.8 | 37,283 | 10.3 |
| 35 to 39 years | 14,829 | 8.4 | 17,403 | 9.4 | 32,232 | 8.9 |
| 40 to 44 years | 14,607 | 8.3 | 15,456 | 8.3 | 30,063 | 8.3 |
| 45 to 49 years | 13,568 | 7.7 | 13,038 | 7.0 | 26,606 | 7.4 |
| 50 to 54 years | 10,965 | 6.2 | 9,051 | 4.9 | 20,016 | 5.5 |
| 55 to 59 years | 6,983 | 4.0 | 5,149 | 2.8 | 12,132 | 3.4 |
| 60 to 64 years | 4,081 | 2.3 | 2,792 | 1.5 | 6,873 | 1.9 |
| 65 to 69 years | 2,321 | 1.3 | 1,605 | 0.9 | 3,926 | 1.1 |
| 70 to 74 years | 1,128 | 0.6 | 977 | 0.5 | 2,105 | 0.6 |
| 75 and over | 1,228 | 0.7 | 1,507 | 0.8 | 2,735 | 0.8 |
| Total | 175,755 | 100.0 | 185,816 | 100.0 | 361,571 | 100.0 |
Source: Incident-based Uniform Crime Reporting Survey, Canadian Centre for Justice Statistics, Statistics Canada.
Note:
Updated data were not available during the preparation of this report.
The data excludes traffic violations, victims whose age is above 89, victims whose age is unknown and victims whose gender is unknown.
Due to rounding, totals may not add up to 100 percent.
The majority of victims receiving services are victims of violent crime
Figure F3
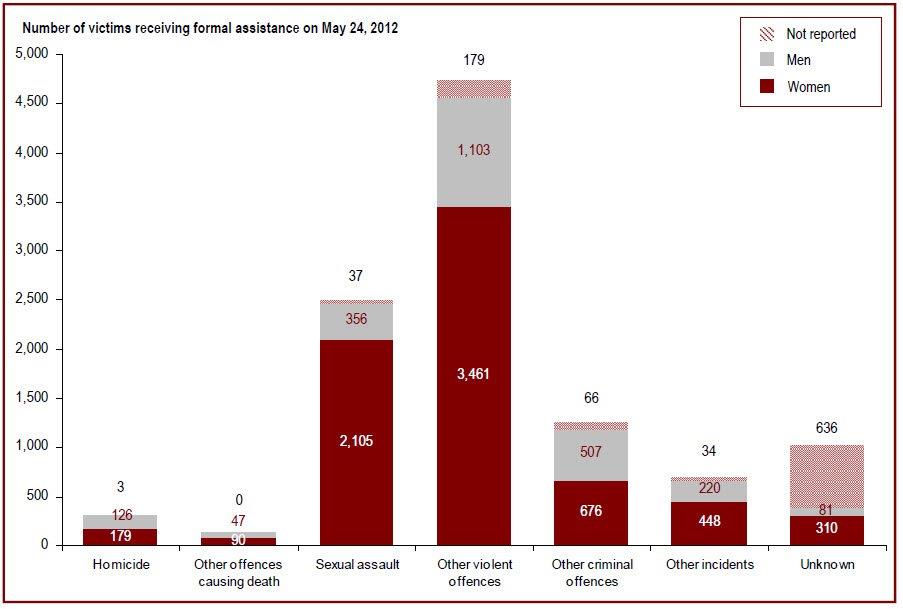
Source: Victim Services in Canada, 2009/2010; Victim Services in Canada 2011/2012; Canadian Centre for Justice Statistics, Statistics Canada.
- On May 24, 2012, the Victim Services Survey snapshot day, 10,664 victims received formal assistance from a victim service office. This represents an increase of 12.7% from 9,462 on May 27, 2010. Of the 9,637 where the crime was known, the majority, 79.8% were victims of a violent crime.
- Of the 9,709 cases in which gender of the victim was noted, women accounted for 74.9% of the victims who received formal assistance from a victim service office, and men represented 25.1%.
- Of the 6,959 women who received formal assistance where the type of crime was known, 83.8% were victims of violent crime. A total of 2,105 women (30.2%) were victims of sexual assault.
- Of the 2,359 men who received formal assistance where the type of crime was known, 69.2% were victims of violent crime. A total of 356 men (15.1%) were victims of sexual assault.
Note:
Updated data were not available during the preparation of this report.
Victim services are defined as agencies that provide direct services to primary or secondary victims of crime, and that are funded in whole or in part by a ministry responsible for justice matters. Survey respondents included 684 victim service providers.
The majority of victims receiving services are victims of violent crime
| Type of Crime | Gender of Victim | |||||||
|---|---|---|---|---|---|---|---|---|
| Women | Men | Not Reported | Total | |||||
| Snapshot on May 27, 2010 | # | % | # | % | # | % | # | % |
| Homicide | 154 | 2.4 | 70 | 3.3 | 3 | 0.5 | 227 | 2.5 |
| Other offences causing death | 95 | 1.5 | 77 | 3.7 | 8 | 1.4 | 180 | 2.0 |
| Sexual assault | 1,922 | 30.0 | 379 | 18.1 | 160 | 28.3 | 2,461 | 27.1 |
| Other violent offences | 3,323 | 51.8 | 917 | 43.8 | 262 | 46.4 | 4,502 | 49.6 |
| Other criminal offences* | 496 | 7.7 | 357 | 17.0 | 73 | 12.9 | 926 | 10.2 |
| Other incidents** | 421 | 6.6 | 295 | 14.1 | 59 | 10.4 | 775 | 8.5 |
| Total without unknown | 6,411 | 100.0 | 2,095 | 100.0 | 565 | 100.0 | 9,071 | 100.0 |
| Unknown type of crime | 197 | — | 81 | — | 113 | — | 391 | — |
| Total | 6,608 | 2,176 | 678 | 9,462 | ||||
| Snapshot on May 24, 2012 | # | % | # | % | # | % | # | % |
| Homicide | 179 | 2.6 | 126 | 5.3 | 3 | 0.9 | 308 | 3.2 |
| Other offences causing death | 90 | 1.3 | 47 | 2.0 | 0 | 0.0 | 137 | 1.4 |
| Sexual assault | 2,105 | 30.2 | 356 | 15.1 | 37 | 11.6 | 2,498 | 25.9 |
| Other violent offences | 3,461 | 49.7 | 1,103 | 46.8 | 179 | 56.1 | 4,743 | 49.2 |
| Other criminal offences* | 676 | 9.7 | 507 | 21.5 | 66 | 20.7 | 1,249 | 13.0 |
| Other incidents** | 448 | 6.4 | 220 | 9.3 | 34 | 10.7 | 702 | 7.3 |
| Total without unknown | 6,959 | 100.0 | 2,359 | 100.0 | 319 | 100.0 | 9,637 | 100.0 |
| Unknown type of crime | 310 | — | 81 | — | 636 | — | 1,027 | — |
| Total | 7,269 | 2,440 | 955 | 10,664 | ||||
Source: Victim Services in Canada, 2009/2010; Victim Services in Canada 2011/2012; Canadian Centre for Justice Statistics, Statistics Canada.
Note:
Updated data were not available during the preparation of this report.
*Other criminal offences include arson, property crimes, traffic offences, and other Criminal Code offences.
**Other incidents include those of a non-criminal nature as well as those that are still under investigation to determine if they are criminal offences.
Victim services are defined as agencies that provide direct services to primary or secondary victims of crime, and that are funded in whole or in part by a ministry responsible for justice matters. Survey respondents included 684 victim service providers.
The number of victims registered with the federal correctional system has increased
Figure F4
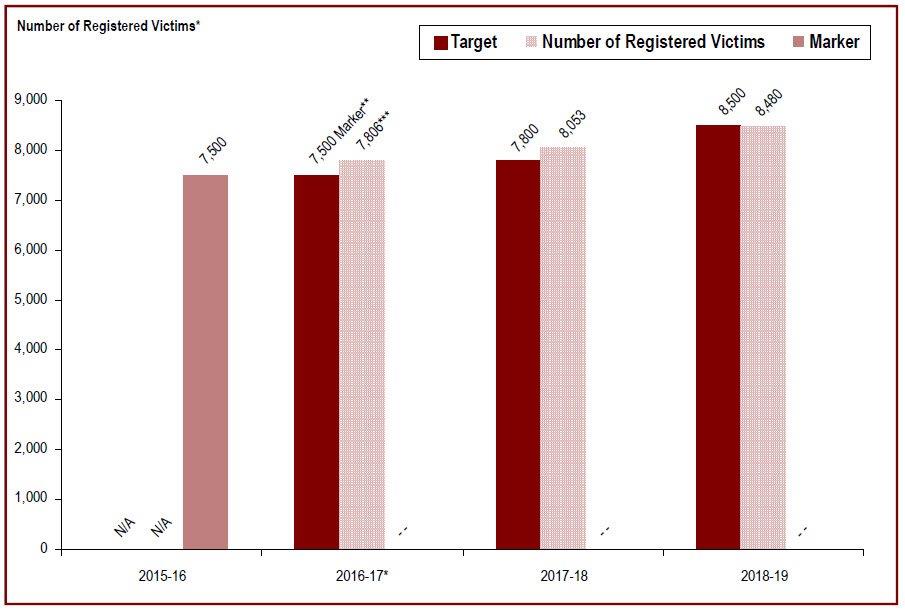
Source: Correctional Service Canada.
Note:
*Indicator new as of the 2016-17 reporting cycle; therefore, data not available from 2013-14 to 2015-16.
**A ‘marker' was set for the new 2016-17 indicator, estimating the number of registered victims. This was done because CSC was changing from management of victim files within OMS, offender file based, to the newly built Victims Application Module (VAM), victim file based and no data was available until year end due to data migration.
***When Victim Services used OMS as their database, the prior indicator counted the number of offenders with registered victims. Over the last three years, CSC has used a new indicator reflective of the VAM; counting number of registered victims. This provides the true number of registered victims.
For example, in the old system (OMS) = one offender could have six victims, but only one offender with registered victims was counted. In the new system (VAM) = six registered victims as each victim has their own electronic file and is counted separately.
The number of victims registered with the federal correctional system has increased
| Year | Target | Number of Registered Victims | Marker |
|---|---|---|---|
| 2015-16 | N/A | N/A | 7,500 |
| 2016-17* | 7,500 Marker** | 7,806*** | - - |
| 2017-18 | 7,800 | 8,053 | - - |
| 2018-19 | 8,500 | 8,480 | - - |
Source: Correctional Service Canada.
Note:
*Indicator new as of the 2016-17 reporting cycle; therefore, data not available from 2013-14 to 2015-16.
**A ‘marker' was set for the new 2016-17 indicator, estimating the number of registered victims. This was done because CSC was changing from management of victim files within OMS, offender file based, to the newly built Victims Application Module (VAM), victim file based and no data was available until year end due to data migration.
***When Victim Services used OMS as their database, the prior indicator counted the number of offenders with registered victims. Over the last three years, CSC has used a new indicator reflective of the VAM; counting number of registered victims. This provides the true number of registered victims.
For example, in the old system (OMS) = one offender could have six victims, but only one offender with registered victims was counted. In the new system (VAM) = six registered victims as each victim has their own electronic file and is counted separately.
Offences causing death are the most common type of offence** that harmed the victims registered* with Correctional Service Canada
Figure F5
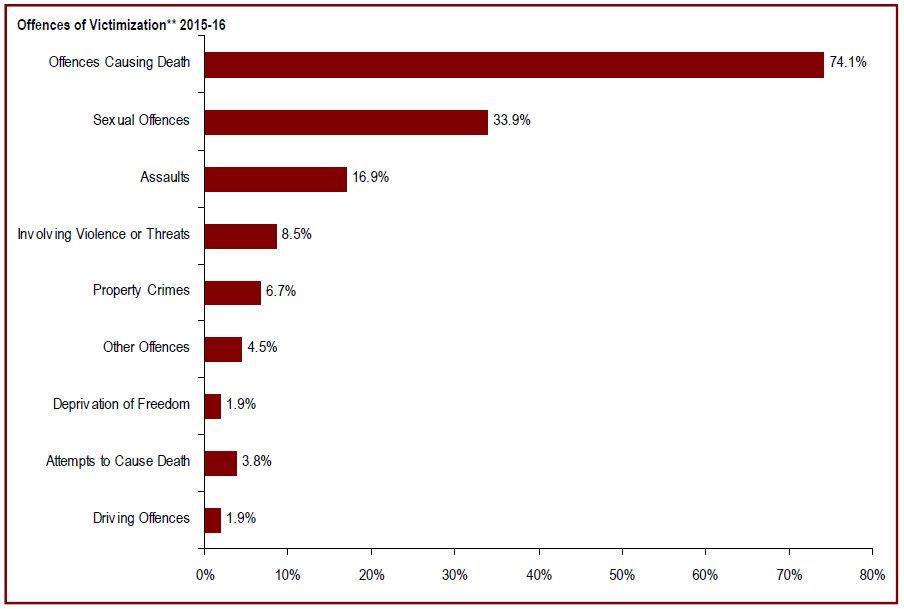
Source: Correctional Service Canada.
- Of the 8,303 registered victims, 74.1% (6,151) were victims of an offence that caused death.
- Victims of sexual offences (2,817) accounted for 33.9% of the registered victims.
- Victims of assault (1,401) and victims of offences involving violence or threats (706) accounted for 16.9% and 8.5% of the registered victims.
Note:
In 2016, CSC implemented the new Victims Application Module (VAM). Following some implementation and development challenges, CSC has worked towards greater stabilization of the VAM system. This caused a delay in the creation of a new reporting mechanism. For this reason, CSC is unable to report beyond the number of registered victims and is working to develop a new reporting mechanism for VAM.
*In order to register to receive information under sections 26 and 142 of the Corrections and Conditional Release Act, a person must meet the definition of a victim that appears in section 2, or subsections 26(3) or 142(3) of the Act. Victims can register with the Correctional Service of Canada or the Parole Board of Canada by completing a Victims Request for Information form, though a signed letter of request can be considered as meeting this requirement.
**Some victims were harmed by more than one offence, therefore the number of Offences of Victimization are higher than the number of Registered Victims. The percentages in the table represent the number of registered victims who were harmed by that offence and do not add up to 100%.
Offences causing death are the most common type of offence** that harmed the victims registered* with Correctional Service Canada
| Type of Offence** That Harmed Victim* |
2011-12 | 2012-13 | 2013-14 | 2014-15 | 2015-16 | |||||
|---|---|---|---|---|---|---|---|---|---|---|
| # | % | # | % | # | % | # | % | # | % | |
| Offences Causing Death | 4,056 | 55.4 | 4,292 | 56.6 | 4,533 | 57.8 | 5,432 | 68.5 | 6,151 | 74.1 |
| Sexual Offences | 2,114 | 28.9 | 2,169 | 28.6 | 2,237 | 28.5 | 2,493 | 31.4 | 2,817 | 33.9 |
| Assaults | 998 | 13.6 | 965 | 12.7 | 941 | 12.0 | 1,178 | 14.9 | 1,401 | 16.9 |
| Involving Violence or Threats | 707 | 9.7 | 710 | 9.4 | 720 | 9.2 | 849 | 10.7 | 706 | 8.5 |
| Property Crimes | 534 | 7.3 | 551 | 7.3 | 541 | 6.9 | 617 | 7.8 | 558 | 6.7 |
| Other Offences | 452 | 6.2 | 441 | 5.8 | 475 | 6.1 | 583 | 7.4 | 377 | 4.5 |
| Deprivation of Freedom | 272 | 3.7 | 281 | 3.7 | 249 | 3.2 | 330 | 4.2 | 157 | 1.9 |
| Attempts to Cause Death | 241 | 3.3 | 246 | 3.2 | 283 | 3.6 | 299 | 3.8 | 318 | 3.8 |
| Driving Offences | 125 | 1.7 | 152 | 2.0 | 153 | 2.0 | 163 | 2.1 | 157 | 1.9 |
| Offence Not Recorded | 6 | 0.1 | 4 | 0.1 | 9 | 0.1 | 85 | 1.1 | 0 | 0 |
| Total Number of Victims** | 7,322 | 7,585 | 7,838 | 7,929 | 8,303 | |||||
Source: Correctional Service Canada.
Note:
In 2016, CSC implemented the new Victims Application Module (VAM). Following some implementation and development challenges, CSC has worked towards greater stabilization of the VAM system. This caused a delay in the creation of a new reporting mechanism. For this reason, CSC is unable to report beyond the number of registered victims and is working to develop a new reporting mechanism for VAM.
*In order to register to receive information under sections 26 and 142 of the Corrections and Conditional Release Act, a person must meet the definition of a victim that appears in section 2, or subsections 26(3) or 142(3) of the Act. Victims can register with the Correctional Service of Canada or the Parole Board of Canada by completing a Victims Request for Information form, though a signed letter of request can be considered as meeting this requirement.
**Some victims were harmed by more than one offence, therefore the number of Offences of Victimization are higher than the number of Registered Victims. The percentages in the table represent the number of registered victims who were harmed by that offence and do not add up to 100%.
Temporary absence information is the most common type of information provided during a notification to registered victims* with Correctional Service Canada
Figure F6
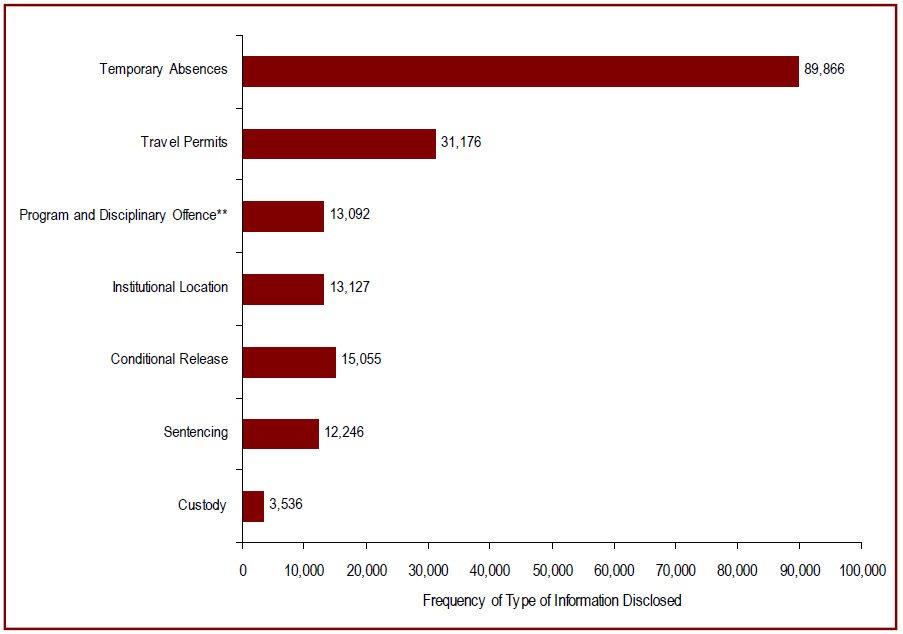
Source: Correctional Service Canada.
- In 2015-16, information on Temporary Absences (41.2%) and Travel Permits (17.5%) were the most frequent pieces of information about offenders that were provided during a notification to registered victims*.
- There has been a 44.6% increase in the number of pieces of information provided to registered victims* during notifications from 123,136 in 2011-12 to 178,098 in 2015-16.
Note:
In 2016, CSC implemented the new Victims Application Module (VAM). Following some implementation and development challenges, CSC has worked towards greater stabilization of the VAM system. This caused a delay in the creation of a new reporting mechanism. For this reason, CSC is unable to report beyond the number of registered victims and is working to develop a new reporting mechanism for VAM.
Temporary Absence information includes information on unescorted and escorted temporary absences and work release. Conditional Release information includes information regarding day and full parole, statutory release, suspensions, detention, and long-term supervision orders. Sentencing information includes information on the offender's sentence, offender information, warrant expiry date, judicial review, and public domain.
Disclosure means a type of information identified in section 26 of the CCRA that has been disclosed to a registered victim during a notification.
As of December 2, 2011 as per Bill S6, Correctional Services Canada now provides information to some victims who are not registered which requires providing information to family members of murdered victims where the offender is still eligible to apply for Judicial Review including when the offender does not apply for a Judicial Review within the allotted time period, as well as the next date the offender can apply. Notification to unregistered victims are excluded for the data.
*In order to register to receive information under section 26 and 142 of the Corrections and Conditional Release Act, a person must meet the definition of a victim that appears in section 2 or subsection 26(3) or 142(3) of the Act. Victims can register with the Correctional Service of Canada or the Parole Board of Canada by completing a Victims Request for Information form, though a signed letter of request can be considered as meeting this requirement.
Temporary absence information is the most common type of information provided during a notification to registered victims* with Correctional Service Canada
| Information | 2011-12 | 2012-13 | 2013-14 | 2014-15 | 2015-16 |
|---|---|---|---|---|---|
| Temporary Absences | 75,848 | 93,609 | 100,934 | 96,131 | 89,866 |
| Travel Permits | 10,877 | 28,763 | 34,294 | 34,501 | 31,176 |
| Institutional Location | 6,859 | 14,434 | 17,495 | 16,242 | 13,127 |
| Program & Disciplinary Offence Information** | 11,208 | 14,826 | 16,790 | 13,092 | |
| Conditional Release | 10,870 | 11,803 | 12,318 | 13,253 | 15,055 |
| Sentencing Information | 16,268 | 12,813 | 10,333 | 10,792 | 12,246 |
| Custody | 2,414 | 2,569 | 2,476 | 2,423 | 3,536 |
| TOTAL | 123,136 | 175,199 | 192,676 | 190,132 | 178,098 |
Source: Correctional Service Canada.
Note:
In 2016, CSC implemented the new Victims Application Module (VAM). Following some implementation and development challenges, CSC has worked towards greater stabilization of the VAM system. This caused a delay in the creation of a new reporting mechanism. For this reason, CSC is unable to report beyond the number of registered victims and is working to develop a new reporting mechanism for VAM.
Temporary Absence information includes information on unescorted and escorted temporary absences and work release. Conditional Release information includes information regarding day and full parole, statutory release, suspensions, detention, and long-term supervision orders. Sentencing information includes information on the offender's sentence, offender information, warrant expiry date, judicial review, and public domain.
Disclosure means a type of information identified in section 26 of the CCRA that has been disclosed to a registered victim during a notification.
As of December 2, 2011 as per Bill S6, Correctional Services Canada now provides information to some victims who are not registered which requires providing information to family members of murdered victims where the offender is still eligible to apply for Judicial Review including when the offender does not apply for a Judicial Review within the allotted time period, as well as the next date the offender can apply. Notification to unregistered victims are excluded for the data.
*In order to register to receive information under section 26 and 142 of the Corrections and Conditional Release Act, a person must meet the definition of a victim that appears in section 2 or subsection 26(3) or 142(3) of the Act. Victims can register with the Correctional Service of Canada or the Parole Board of Canada by completing a Victims Request for Information form, though a signed letter of request can be considered as meeting this requirement.
Parole Board of Canada contact with victims has increased
Figure F7
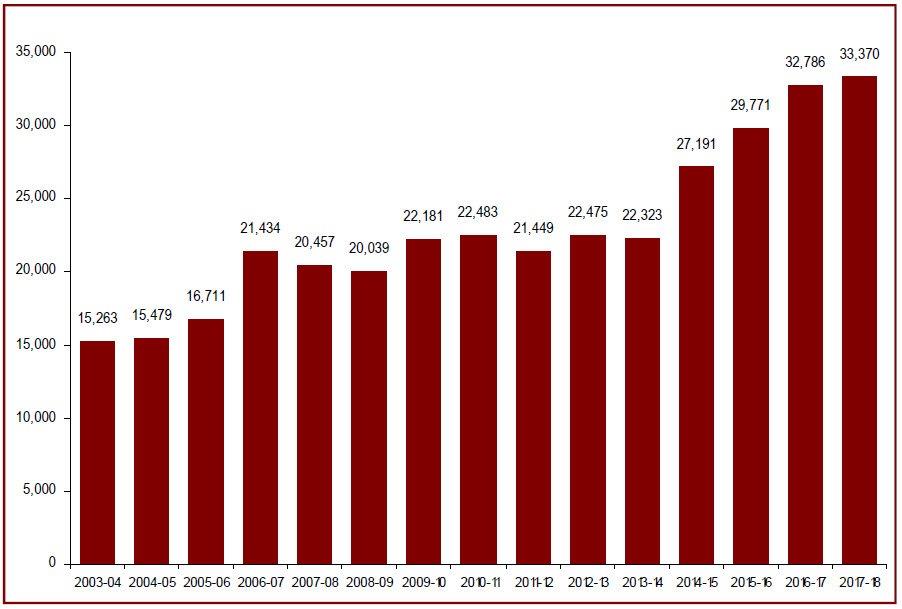
Source: Parole Board of Canada.
- In 2017-18, PBC reported 33,370 contacts*with victims, an increase of 2% from the previous year.
- Compared to 2003-04, the number of PBC contacts with victims has increased by 119% (18,107 more contacts).
Note:
*A victim contact refers to each time the Parole Board of Canada has contact with a victim by mail, fax, or by telephone.
Parole Board of Canada contact with victims has increased
| Year | Total Number of Contacts* |
|---|---|
| 2003-04 | 15,263 |
| 2004-05 | 15,479 |
| 2005-06 | 16,711 |
| 2006-07 | 21,434 |
| 2007-08 | 20,457 |
| 2008-09 | 20,039 |
| 2009-10 | 22,181 |
| 2010-11 | 22,483 |
| 2011-12 | 21,449 |
| 2012-13 | 22,475 |
| 2013-14 | 22,323 |
| 2014-15 | 27,191 |
| 2015-16 | 29,771 |
| 2016-17 | 32,786 |
| 2017-18 | 33,370 |
Source: Parole Board of Canada.
Note:
*A victim contact refers to each time the Parole Board of Canada has contact with a victim by mail, fax, or by telephone.
Victims presenting a statement at Parole Board of Canada hearings
Figure F8
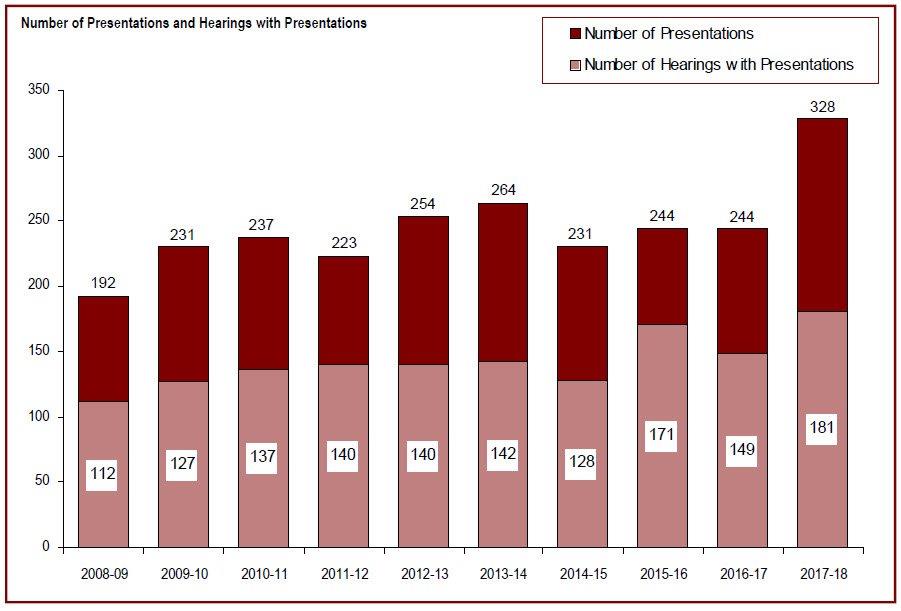
Source: Parole Board of Canada.
- In 2017-18, victims made 328 presentations at 181 hearings. By comparison, victims made 244 presentations at 149 hearings the previous year.
- When compared to 2008-09, the number of victims who present a statement at hearings increased by 71% in 2017-18.
- Between 2008-09 and 2017-18, the majority of presentations were done in person (89%) followed by presentations via video conferencing or tele conferencing (7%) and pre-recorded presentations (audiotape or videotape/DVD) (4%).
- The major offence of victimization for victims making presentations in 2017-18 was most likely to have been murder (31%), sexual assault (18%), and manslaughter (17%).
Victims presenting a statement at Parole Board of Canada hearings
| Year | Number of Hearings with Presentations | Number of Presentations |
|---|---|---|
| 2008-09 | 112 | 192 |
| 2009-10 | 127 | 231 |
| 2010-11 | 137 | 237 |
| 2011-12 | 140 | 223 |
| 2012-13 | 140 | 254 |
| 2013-14 | 142 | 264 |
| 2014-15 | 128 | 231 |
| 2015-16 | 171 | 244 |
| 2016-17 | 149 | 244 |
| 2017-18 | 181 | 328 |
Source: Parole Board of Canada.
Victims requesting access to the decision registry
Figure F9
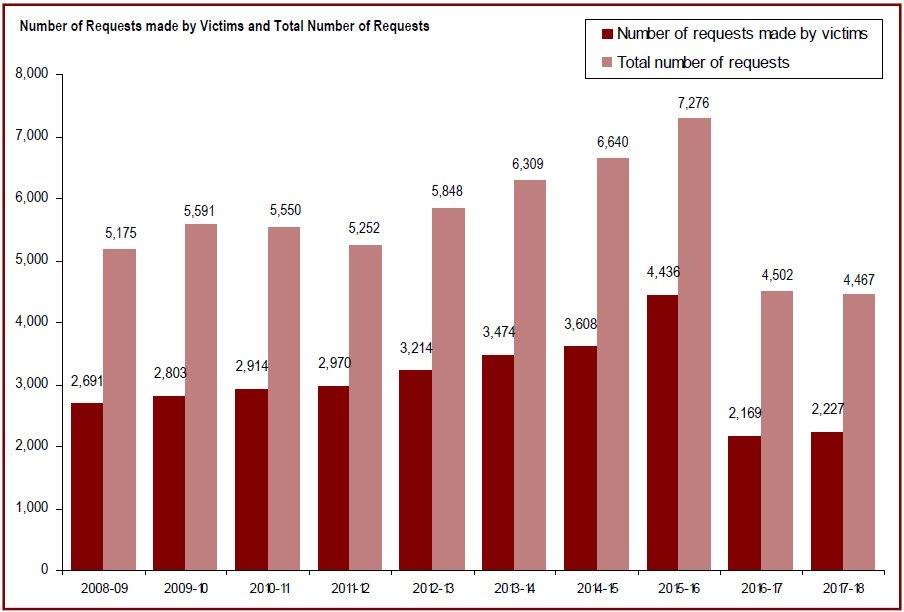
Source: Parole Board of Canada.
- In 2017-18, the number of request for access to the decision registry*made by victims increased to 2,227 (+2.7%) compared to 2016-17, and decreased by 49.8% compared to 2015-16 after reaching a peak (4,436) in the last decade.
- When averaged over the last ten years (between 2008-09 and 2017-18), 53.9% of request for access to the decision registry were made by victims.
Note:
Victims also include victims' agents and victims' organizations.
*Since November 1, 1992, the Corrections and Conditional Release Act (CCRA) requires the Parole Board of Canada (PBC) to maintain a registry of its decisions along with the reasons for those decisions. Anyone may request, in writing, a copy of these decisions.
Victims requesting access to the decision registry
| Year | Request made by victims* | Total number of requests | |
|---|---|---|---|
| # | % | ||
| 2008-09 | 2,691 | 52.0 | 5,175 |
| 2009-10 | 2,803 | 50.1 | 5,591 |
| 2010-11 | 2,914 | 52.5 | 5,550 |
| 2011-12 | 2,970 | 56.5 | 5,252 |
| 2012-13 | 3,214 | 55.0 | 5,848 |
| 2013-14 | 3,474 | 55.1 | 6,309 |
| 2014-15 | 3,608 | 54.3 | 6,640 |
| 2015-16 | 4,436 | 61.0 | 7,276 |
| 2016-17 | 2,169 | 48.2 | 4,502 |
| 2017-18 | 2,227 | 49.9 | 4,467 |
Source: Parole Board of Canada.
Note:
*Also include victims' agents and victims' organizations.
Questionnaire
In order to improve the Corrections and Conditional Release Statistical Overview, we are asking our readers to complete the following voluntary questionnaire.
- Where did you obtain this copy of the Corrections and Conditional Release Statistical Overview?
- How did you become aware of it?
- Did you experience any difficulties in obtaining or accessing the document? ▢ Yes ▢ No
Please elaborate.
- Have you found the Corrections and Conditional Release Statistical Overview to be a useful document? ▢ Yes ▢ No
Please elaborate.
- Are there any tables, figures, bullets or notes that are not clear?
- Are there any topics you would like to see addressed in future publications of the Corrections and Conditional Release Statistical Overview that are not currently included?
- Any additional comments?
Please return completed questionnaires to:
Portfolio Corrections Statistics Committee
Public Safety Canada
340 Laurier Avenue West, 12th Floor
Ottawa, Ontario
K1A 0P8
Telephone: 613-946-9994
Fax: 613-990-8295
E-mail: ps.csccbresearch-recherchsscrc.sp@canada.ca
For further information, please visit:
Canadian Centre for Justice Statistics, Statistics Canada
Office of the Correctional Investigator
- Date modified: