2020 Corrections and Conditional Release Statistical Overview
Please tell us about your experience with this year's CCRSO by filling-out our short online CCRSO User Evaluation survey!
Erratum
Date: March 22, 2022
Revision: Figure A12, Totals have been corrected. Table A12, "Female" and "Total" rows have been corrected.
 2020 Corrections and Conditional Release Statistical Overview - PDF Version (6.9 MB)
January 2022
This document was produced by the Public Safety Canada Portfolio Corrections Statistics Committee which is composed of representatives of Public Safety Canada, Correctional Service of Canada, Parole Board of Canada, the Office of the Correctional Investigator and the Canadian Centre for Justice and Community Safety Statistics (Statistics Canada).
Table of contents
- Preface
- Contributing Partners
- Section A. Context – Crime and the Criminal Justice System
- Police-reported crime rate
- Crime rates were higher in the West and highest in the North
- Prison population across Western and European countries
- Canada's incarceration rate has fluctuated in the last 10 years
- The rate of adults charged
- Common assault, impaired driving, and theft were the three most frequent cases in adult courts
- Most adult custodial sentences ordered by the court were short
- Few cases with guilty findings have resulted in admissions to federal jurisdiction
- The rate of youth charged has continued to decline
- The most frequent youth court case was common assault
- The most common sentence for youth was probation
- When considering the most serious sentence in a case, probation was the most common sentence for youth
- Section B. Corrections Administration
- Correction costs federally and provincially/territorially
- CSC employees were concentrated in custody centres
- The cost of keeping an inmate incarcerated has remained relatively steady in the past 5 years
- The number of Parole Board of Canada employees
- The number of employees in the Office of the Correctional Investigator
- Health care was the most common area of offender complaint received by the Office of the Correctional Investigator
- Section C. Offender Population
- Offenders under the responsibility of CSC
- The number of in-custody offenders
- The number of admissions to CSC facilities
- Over the last ten years, the number of females admitted from the courts to CSC facilities has fluctuated
- About half of the total offender population in CSC facilities were serving a sentence of less than five years
- Admission of older offenders to CSC facilities has increased
- The average age at admission to CSC facilities was lower for Indigenous offenders.
- 25% of the in-custody offender population in a CSC facility was aged 50 or over
- 54% of offenders in CSC facilities were White
- The religious identification of the CSC offender population was diverse
- The proportion of Indigenous offenders in CSC custody vs in the community under supervision continued to be higher than non-Indigenous offenders
- The majority of in-custody offenders in a CSC facility were classified as medium security risk
- Admissions to federal jurisdiction with a life and/or indeterminate sentence
- Offenders with life and/or indeterminate sentences represented 25% of the CSC total offender population
- 72% of the CSC total offender population was serving a sentence for a violent offence.
- The number of Indigenous offenders under CSC supervision has increased
- The total number of admissions to administrative segregation in a federal institution has decreased
- 72% of placements in administrative segregation in a CSC facility were for less than 30 days
- The number of offender deaths while in custody
- The number of escapees from federal institutions
- The population of offenders in the community under supervision by CSC has increased
- The provincial/territorial community corrections population has decreased
- The number of offenders on provincial parole has increased
- Section D. Conditional Release
- The percentage of offenders released from a federal institution or a Healing Lodge on statutory release
- The percentage of offenders released from a federal institution or a Healing Lodge on day parole and full parole
- The federal day and full parole grant rate has increased
- The federal full parole grant rate for indiginous offenders has increased
- The number of federal Elder-Assisted parole hearings have increased
- Proportion of sentence served prior to being released on parole
- Indigenous offenders served a higher proportion of their sentences before being released on parole
- The successful completion rate of federal day parole supervision periods has remained stable
- The successful completion rate of federal full parole supervision periods has remained stable
- The successful completion rate of statutory release supervision periods has remained stable
- Over the last ten years, the rates of conviction for violent offences for offenders on federal conditional release have declined
- The number of CSC offenders granted temporary absences
- Section E. Statistics on Special Applications of Criminal Justice
- Section F. Victims of Crime
- The most common type of self-reported victimization was theft of personal property
- Women were more likely to be victims of violent crime than men, this gap is larger at younger ages
- Sexual assault was the least likely crime to be reported to police
- Police-reported violent victimization has increased
- Police-reported violent victimization was most frequent amongst 12-17 year olds
- The most common type of police-reported violent crime was assault
- The number of registered victims with the federal correctional system has increased in the last 3 years
- Registered victims are impacted by serious offences
- Most registered victims were between the ages of 41 and 70
- The proportion of registered victims who identified as female or male remained relatively stable
- Most registered victims were White
- The number of notifications to registered victims has increased
- The number of victim statements received for consideration in release decisions has fluctuated
- The number of victims who request financial assistance to attend parole hearings has fluctuated
- The number of Parole Board of Canada contacts with victims
- Victims presenting a statement at PBC hearings
- Victims requesting access to the decision registry
Preface
The purpose of the Corrections and Conditional Release Statistical Overview (CCRSO) is to assist the public in understanding statistical information on corrections and conditional release. A primary consideration in producing the CCRSO was to present general statistical information in a user friendly way that will facilitate understanding by a broad audience. There are several features of this document that make it different from typical statistical reports:
- The visual representation of the statistics is simple and uncluttered, and under each chart there are a few key points that will assist the reader in extracting information from the chart.
- For each chart there is a table of numbers corresponding to the visual representation. In some instances, the table includes additional numbers, e.g., a five-year series, even though the chart depicts the data for the most recent year (e.g., Figure A2).
- Rather than using the conventional headings for statistics (e.g., "Police-reported crime rate by year by type of crime") titles for charts and tables inform the reader about the matter at hand (e.g., "Police-reported crime rate has declined").
- Only notes that were judged as essential for the reader to understand the statistics were included.
- The source of the statistics is indicated under each chart so that the interested reader can easily access more information.
The data used in the CCRSO reflects the most recent data available at the time of publication. For much of the report the data is available from 2020 (or if the data follows the fiscal year from April 1 2019 - March 31 2020), for other data there is a lag in reporting so the most recent data is from 2019 (or April 1 2018 – March 31 2020). There are a few figures where the cycle of data collection is more infrequent, for example the victim module of the General Social Survey is administered on a 5-year cycle.
The CCRSO has been published annually since 1998. Some notable updates in the current 2020 CCRSO include 8 new tables and figures in Section F: Victims of Crime. Also, tables and figures with older data that could not be updated due to discontinued surveys or data collected (e.g., Statistics Canada Victim Services Survey) were removed.
The total Crime Rates presented in the CCRSO differs from the crime rates reported by Statistics Canada. This difference is due to the CCSRSO including traffic offences in the Canadian Criminal Code and violations of federal statutes in the total crime rate that are excluded in the rates published by Statistics Canada.
The format of this document has been updated to optimize the user experience by implementing industry-standard data visualization techniques to improve accessibility and usability. For more information, see the Standard on Web Accessibility and the Standard on Web Usability.
To continually improve this annual publication, we welcome your comments. Once you have finished consulting the CCRSO, please fill out our short online survey. If the hyperlink does not work, please email your responses to our survey questions to PS.CPBResearch-RechercheSPC.SP@ps-sp.gc.ca.
Any other correspondence regarding this report, including permission to use tables and figures should be directed to PS.CPBResearch-RechercheSPC.SP@ps-sp.gc.ca.
Contributing Partners
Public Safety Canada
Public Safety Canada (PS) is Canada's lead federal department for public safety, which includes emergency management, national security and community safety. Its many responsibilities include developing legislation and policies that govern corrections, implementing innovative approaches to community justice, and providing research expertise and resources to the corrections community.
Correctional Service Canada
The Correctional Service of Canada (CSC) is the federal government agency responsible for administering sentences of a term of two years or more, as imposed by the courts. CSC is responsible for managing institutions of various security levels and supervising offenders under conditional release in the community.
Parole Board of Canada
The Parole Board of Canada (PBC) is an independent administrative tribunal responsible for making decisions about the timing and conditions of release of offenders into the community on various forms of conditional release. The Board also makes pardon, record suspension and expungement decisions and recommendations respecting clemency through the Royal Prerogative of Mercy.
Office of the Correctional Investigator
The Office of the Correctional Investigator (OCI) is an ombudsman for federal offenders. It conducts investigations into the problems of offenders related to decisions, recommendations, acts or omissions of the Correctional Service of Canada that affect offenders individually or as a group.
Canadian Centre for Justice and Community Safety Statistics (Statistics Canada)
The Canadian Centre for Justice and Community Safety Statistics (CCJCSS) is a division of Statistics Canada. The CCJCSS is the focal point of a federal-provincial-territorial partnership, known as the National Justice Statistics Initiative, for the collection of information on the nature and extent of crime and the administration of civil and criminal justice in Canada.
Section A. Context – Crime and the Criminal Justice System
Police-reported crime rate
Figure A1: Police-reported crime rate per 100,000 population
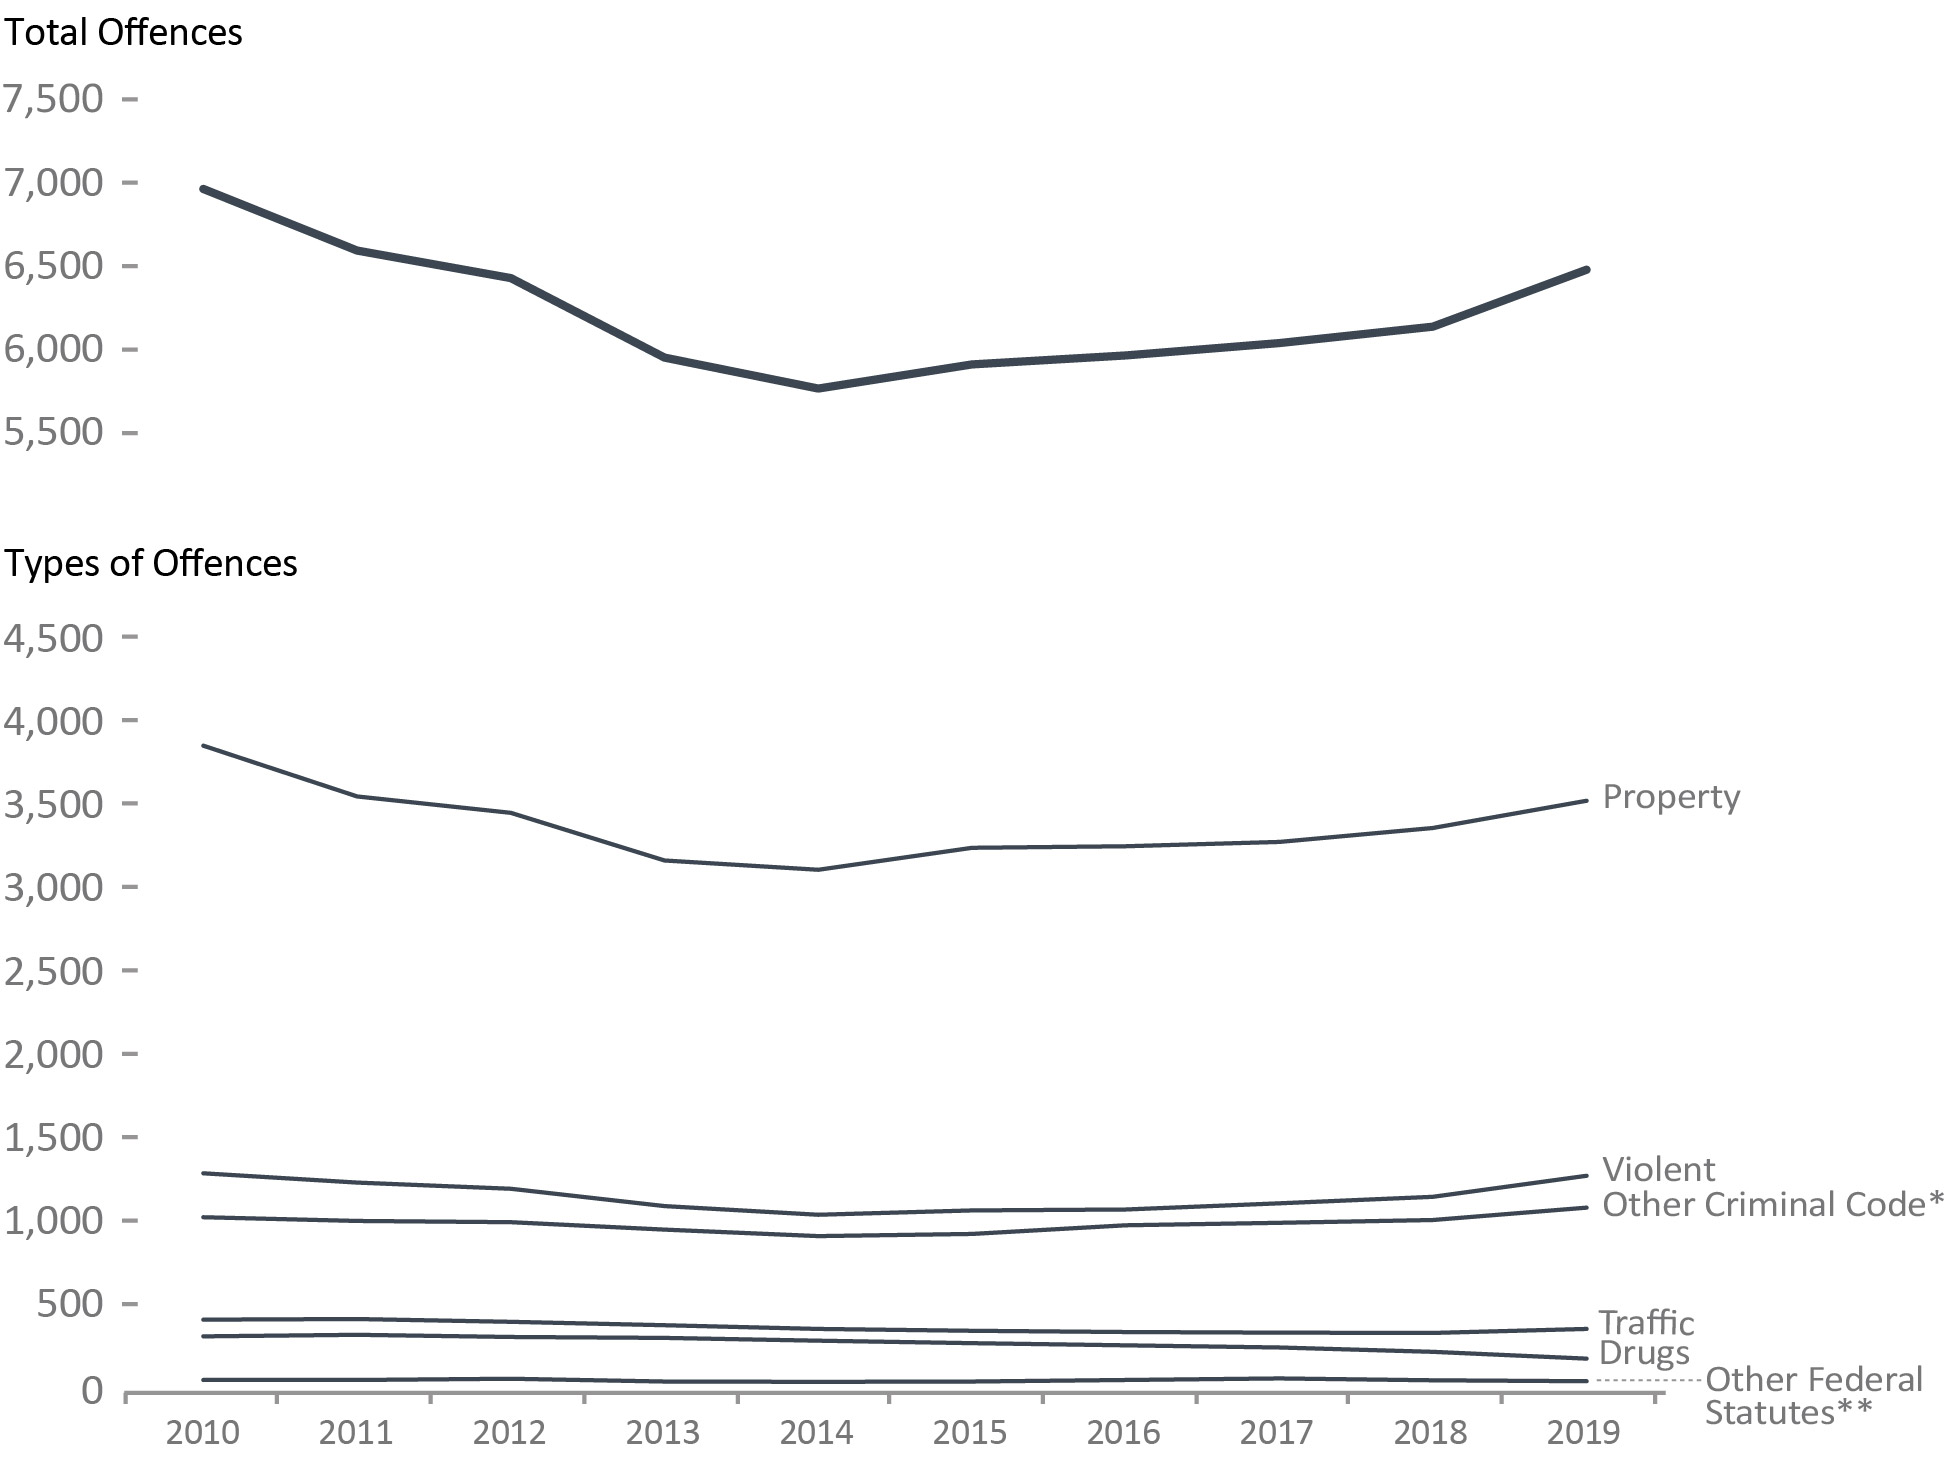
Image description
Year |
Violent |
Property |
Traffic |
Other CCCFigure A1 footnote * |
Drugs |
Other Fed. StatutesFigure A1 footnote ** |
Total Charged |
|---|---|---|---|---|---|---|---|
2010 |
1,292 |
3,838 |
420 |
1,029 |
321 |
61 |
6,961 |
2011 |
1,236 |
3,536 |
424 |
1,008 |
330 |
60 |
6,594 |
2012 |
1,199 |
3,438 |
407 |
1,001 |
317 |
67 |
6,429 |
2013 |
1,096 |
3,154 |
387 |
956 |
311 |
52 |
5,956 |
2014 |
1,044 |
3,100 |
365 |
918 |
295 |
49 |
5,771 |
2015 |
1,070 |
3,231 |
353 |
930 |
280 |
51 |
5,915 |
2016 |
1,076 |
3,239 |
346 |
982 |
267 |
59 |
5,970 |
2017 |
1,113 |
3,266 |
343 |
997 |
254 |
69 |
6,042 |
2018 |
1,152 |
3,349 |
340 |
1,013 |
229 |
58 |
6,141 |
2019 |
1,277 |
3,511 |
364 |
1,087 |
187 |
53 |
6,479 |
Figure A1 Notes:
Source: Table 35-10-0177-01, Uniform Crime Reporting Survey, Canadian Centre for Justice and Community Safety Statistics, Statistics Canada.
- The overall police-reported crime rate in 2019 increased 9.5% from 2015 (5,915 per 100,000 in 2015 to 6,479 in 2019), but remained 6.9% lower than 2010 (6,961 per 100,000 in 2010).
- Property crime followed a similar pattern, with an 8.7% increase from 2015 to 2019, but remained 8.7% lower than 2010 (3,838 per 100,000 in 2010 to 3,511 in 2019).
- The crime rate for drug offences decreased 33.2% from 2015 to 2019. A 41.7% decrease was observed between 2010 and 2019 (321 per 100,000 population to 187).
- The rate of violent crime increased 19.3% between 2015 from 1,070 per 100,000 to 1,277 in 2019. The 2019 rate was slightly lower (1.2%) than 2010.
Unlike Statistics Canada, the total crime rate in the Corrections and Conditional Release Statistical Overview includes traffic offences and violations of federal statutes to provide a measure of all criminal offences. As a result, the Total Crime Rate reported here is higher than that reported by Statistics Canada.
Comparable data for police-reported crime are only available starting in 1998 due to changes from Uniform Crime Reporting (UCR) to the (UCR2) and revisions by Statistics Canada to definitions for Violent, Property, Other Criminal Code offences, and Total Other Federal Statutes to better reflect definitions used by the policing community. As a result the data presented in this year's report are not comparable to the data reported in previous versions of the Corrections and Conditional Release Statistical Overview. These crime statistics are based on crimes that are reported to the police. Since not all crimes are reported to the police, these figures underestimate actual crime. See Figure F1 for rates based on victimization surveys (drawn from the General Social Survey), an alternative method of measuring crime.
The figure includes data from the most recent year available at the time of publication.
Year |
Violent |
Property |
Traffic |
Other CCCTable A1 footnote * |
Drugs |
Other Fed. StatutesTable A1 footnote ** |
Total Charged |
|---|---|---|---|---|---|---|---|
1998 |
1,345 |
5,696 |
469 |
1,051 |
235 |
40 |
8,836 |
1999 |
1,440 |
5,345 |
388 |
910 |
264 |
44 |
8,391 |
2000 |
1,494 |
5,189 |
370 |
924 |
287 |
43 |
8,307 |
2001 |
1,473 |
5,124 |
393 |
989 |
288 |
62 |
8,329 |
2002 |
1,441 |
5,080 |
379 |
991 |
296 |
54 |
8,241 |
2003 |
1,435 |
5,299 |
373 |
1,037 |
274 |
46 |
8,464 |
2004 |
1,404 |
5,123 |
379 |
1,072 |
306 |
50 |
8,334 |
2005 |
1,389 |
4,884 |
378 |
1,052 |
290 |
60 |
8,053 |
2006 |
1,387 |
4,809 |
376 |
1,050 |
295 |
57 |
7,974 |
2007 |
1,354 |
4,525 |
402 |
1,029 |
308 |
59 |
7,677 |
2008 |
1,334 |
4,258 |
437 |
1,039 |
308 |
67 |
7,443 |
2009 |
1,322 |
4,122 |
435 |
1,017 |
291 |
57 |
7,244 |
2010 |
1,292 |
3,838 |
420 |
1,029 |
321 |
61 |
6,961 |
2011 |
1,236 |
3,536 |
424 |
1,008 |
330 |
60 |
6,594 |
2012 |
1,199 |
3,438 |
407 |
1,001 |
317 |
67 |
6,429 |
2013 |
1,096 |
3,154 |
387 |
956 |
311 |
52 |
5,956 |
2014 |
1,044 |
3,100 |
365 |
918 |
295 |
49 |
5,771 |
2015 |
1,070 |
3,231 |
353 |
930 |
280 |
51 |
5,915 |
2016 |
1,076 |
3,239 |
346 |
982 |
267 |
59 |
5,970 |
2017 |
1,113 |
3,266 |
343 |
997 |
254 |
69 |
6,042 |
2018 |
1,152 |
3,349 |
340 |
1,013 |
229 |
58 |
6,141 |
2019 |
1,277 |
3,511 |
364 |
1,087 |
187 |
53 |
6,479 |
Table A1 Notes:
Source: Table 35-10-0177-01, Uniform Crime Reporting Survey, Canadian Centre for Justice and Community Safety Statistics, Statistics Canada.
Unlike Statistics Canada, the total crime rate in the Corrections and Conditional Release Statistical Overview includes traffic offences and violations of federal statutes to provide a measure of all criminal offences. As a result, the Total Crime Rate reported here is higher than that reported by Statistics Canada.
Comparable data for police-reported crime are only available starting in 1998 due to changes from Uniform Crime Reporting (UCR) to the (UCR2) and revisions by Statistics Canada to Violent, Property, Other Criminal Code offences, and Total Other Federal Statutes to better reflect definitions used by the policing community. As a result the data presented in this year's report are not comparable to the data reported in previous versions of the Corrections and Conditional Release Statistical Overview.
Rates are based on incidents reported per 100,000 population.
The table includes data from the most recent year available at the time of publication.
Crime rates were higher in the West and highest in the North
Figure A2: Crime rate per 100,000 population (2019)
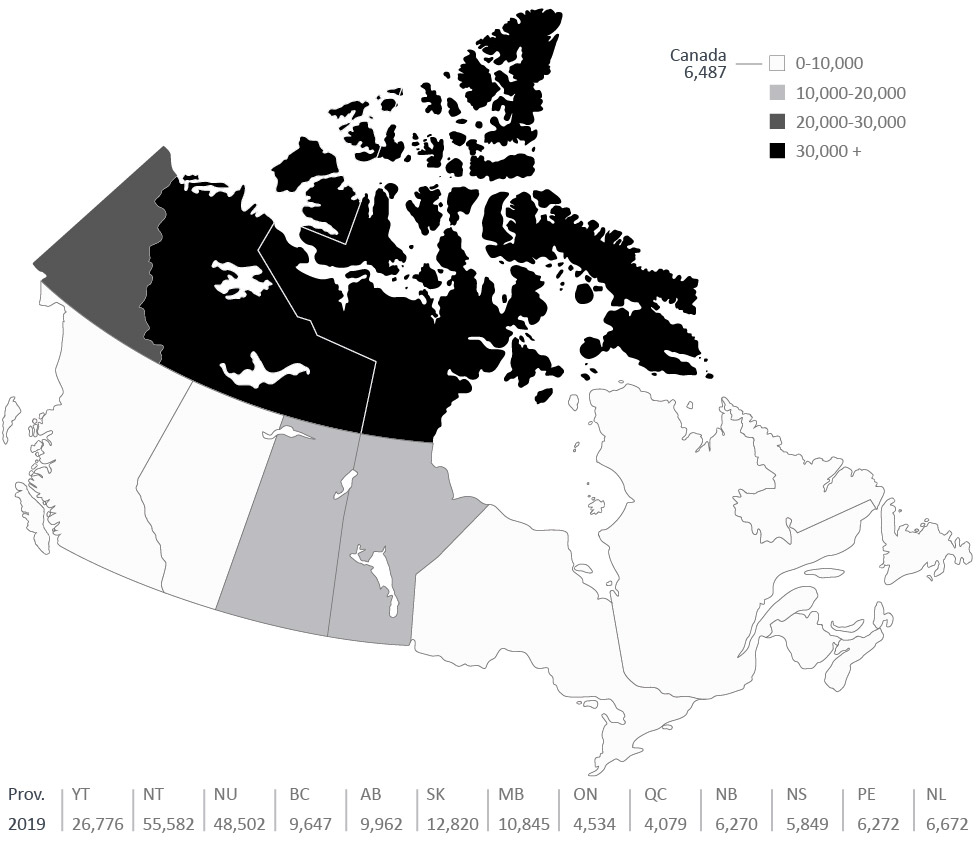
Image description
Province/Territory |
2019 Number |
|---|---|
Canada |
6,487 |
YK (Yukon ) |
26,776 |
NT (Northwest Territories) |
55,582 |
NU (Nunavut) |
48,502 |
BC (British Columbia) |
9,647 |
AB (Alberta) |
9,962 |
SK (Saskatchewan) |
12,820 |
MB (Manitoba) |
10,845 |
ON (Ontario) |
4,534 |
QC (Quebec) |
4,079 |
NB (New Brunswick) |
6,270 |
NS (Nova Scotia) |
5,849 |
PE (Prince Edward Island) |
6,272 |
NL (Newfoundland & Labrador) |
6,672 |
Figure A2 Notes:
Source: Table 35-10-0177-01, Uniform Crime Reporting Survey, Canadian Centre for Justice and Community Safety Statistics, Statistics Canada.
- Crime rates were higher in the west and highest in the territories. This general pattern has been stable over time.
- The Canadian crime rate increased 9.3% from 5,934 per 100,000 in 2015 to 6,487 in 2019.
Unlike Statistics Canada, the Crime Rate in the Corrections and Conditional Release Statistical Overview includes traffic offences and violations of federal statutes to provide a measure of all criminal offences. As a result, the Crime Rate reported here is higher than that reported by Statistics Canada.
The figure includes data from the most recent year available at the time of publication.
Province/Territory |
2015 |
2016 |
2017 |
2018 |
2019 |
|---|---|---|---|---|---|
British Columbia |
8,608 |
8,489 |
8,098 |
8,266 |
9,647 |
Alberta |
8,917 |
9,026 |
9,330 |
9,387 |
9,962 |
Saskatchewan |
12,919 |
13,511 |
12,977 |
12,652 |
12,820 |
Manitoba |
8,926 |
9,508 |
9,756 |
9,994 |
10,845 |
Ontario |
4,022 |
4,091 |
4,259 |
4,506 |
4,534 |
Quebec |
4,252 |
4,233 |
4,331 |
4,172 |
4,079 |
New Brunswick |
5,479 |
5,276 |
5,752 |
6,051 |
6,270 |
Nova Scotia |
5,727 |
5,590 |
5,730 |
5,679 |
5,849 |
Prince Edward Island |
4,750 |
5,013 |
4,711 |
5,385 |
6,272 |
Newfoundland & Labrador |
6,371 |
6,501 |
6,041 |
6,041 |
6,672 |
Yukon |
25,795 |
23,543 |
22,179 |
21,639 |
26,776 |
Northwest Territories |
47,230 |
43,320 |
44,520 |
45,487 |
55,582 |
Nunavut |
34,483 |
35,935 |
36,899 |
40,098 |
48,502 |
Canada |
5,934 |
5,987 |
6,057 |
6,153 |
6,487 |
Table A2 Notes:
Source: Table 35-10-0177-01, Uniform Crime Reporting Survey, Canadian Centre for Justice and Community Safety Statistics, Statistics Canada.
Unlike Statistics Canada, the Crime Rate in the Corrections and Conditional Release Statistical Overview includes traffic offences and violations of federal statutes to provide a measure of all criminal offences. As a result, the Crime Rate reported here is higher than that reported by Statistics Canada.
The table includes data from the most recent year available at the time of publication.
Prison population across Western and European countries
Figure A3: Prison population per 100,000 (2020)
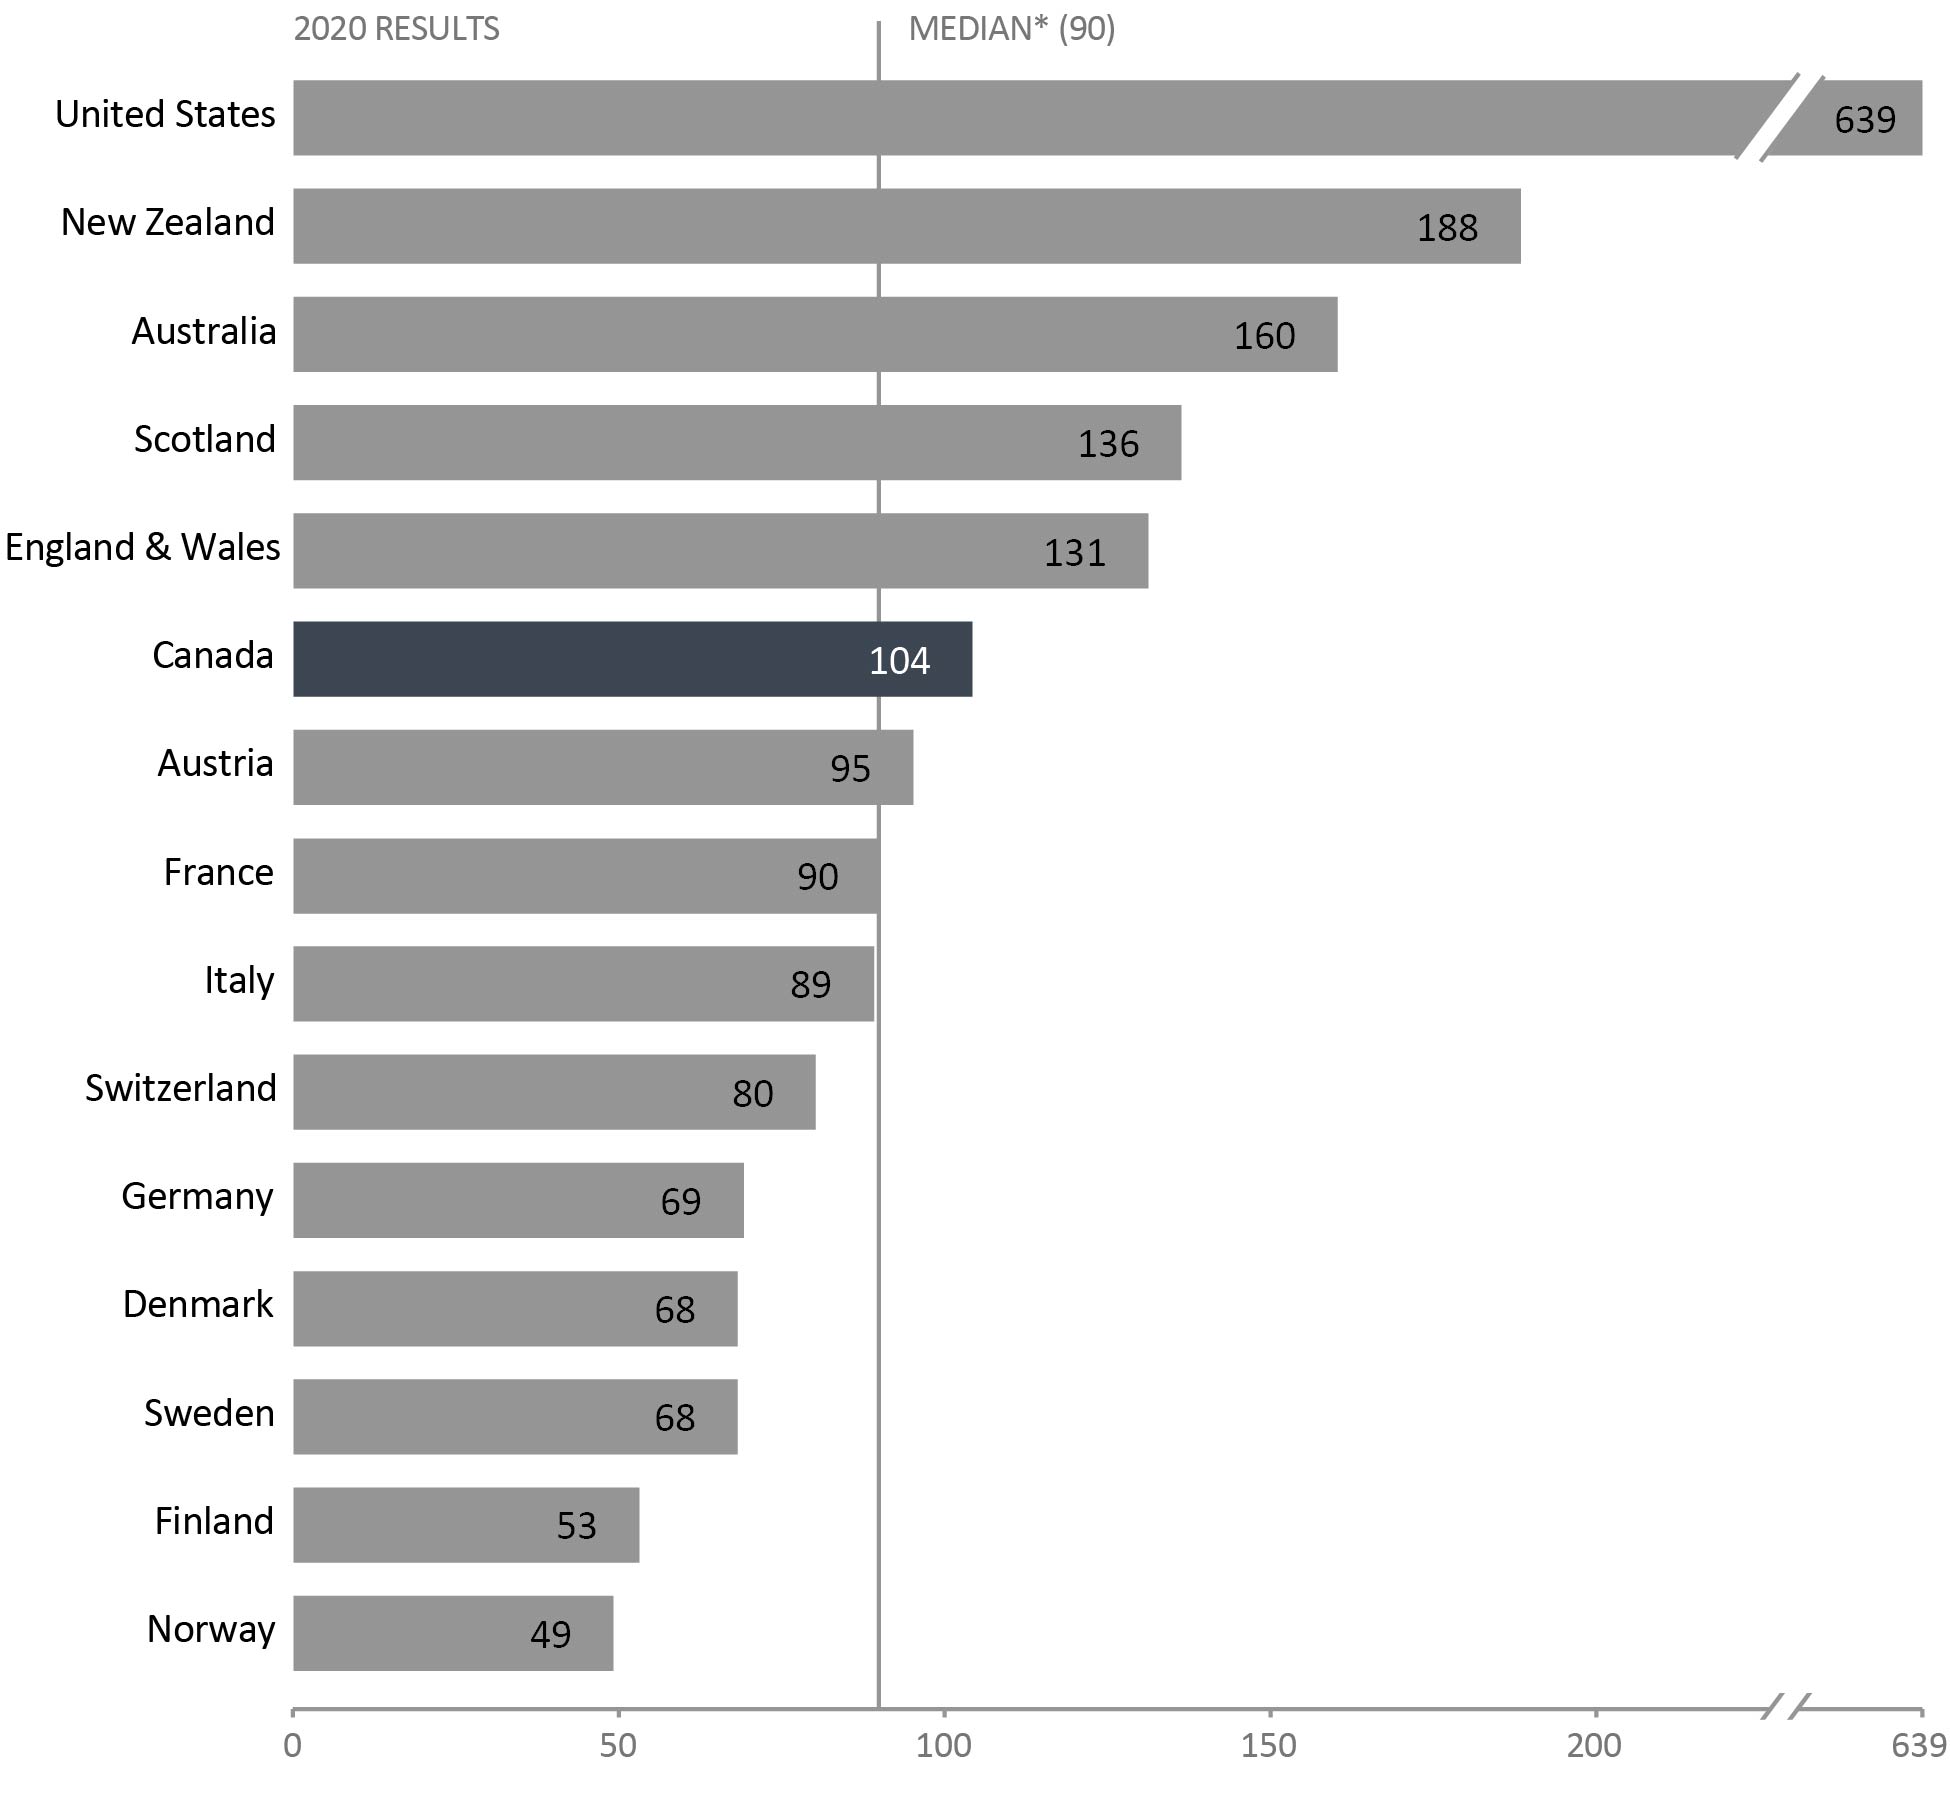
Image description
MedianFigure A3 footnote * |
90 |
United States |
639 |
New Zealand |
188 |
Australia |
160 |
Scotland |
136 |
England & Wales |
131 |
Canada |
104 |
Austria |
95 |
France |
90 |
Italy |
89 |
Switzerland |
80 |
Germany |
69 |
Denmark |
68 |
Sweden |
68 |
Finland |
53 |
Norway |
49 |
Figure A3 Notes:
Source: World Prison Brief, Institute for Crime & Justice Policy Research (ICPR) (retrieved January 13, 2021 at www.prisonstudies.org/highest-to-lowest/prison-population-total).
- Canada's incarceration rate was 104 per 100,000. When ranked from highest to lowest, Canada's prison population rate was ranked 143 of 223 countries. Canada's incarceration rate is higher than the average of western countriesFigure A3 footnote *, but much lower than the United States where the most recent incarceration rate was 639 per 100,000.
- Norway's incarceration rate was 49 per 100,000, the lowest incarceration rate among western European countries.
The incarceration rate presented here is a measure of the number of people (i.e., adults and youth) in custody per 100,000 people in the general population. Incarceration rates from the World Prison Brief hosted by the Institute for Crime & Justice Policy Research (ICPR) are based on the most recently available data at the time the list was compiled. The data was retrieved online on January 13, 2021 from http://www.prisonstudies.org which contains the most up-to-date information available. Additionally, different practices and variations in measurement in different countries limit the comparability of these figures.
2012 |
2013 |
2014 |
2015 |
2016 |
2017 |
2018 |
2019 |
2020 |
|
|---|---|---|---|---|---|---|---|---|---|
United States |
730 |
716 |
707 |
698 |
693 |
666 |
655 |
655 |
639 |
New Zealand |
194 |
192 |
190 |
190 |
203 |
214 |
214 |
201 |
188 |
Australia |
129 |
130 |
143 |
151 |
152 |
168 |
172 |
170 |
160 |
Scotland |
151 |
147 |
144 |
144 |
142 |
138 |
143 |
149 |
136 |
England & Wales |
154 |
148 |
149 |
148 |
147 |
146 |
140 |
140 |
131 |
Canada |
114 |
118 |
118 |
106 |
114 |
114 |
114 |
107 |
104 |
Austria |
104 |
98 |
99 |
95 |
93 |
94 |
98 |
98 |
95 |
France |
102 |
101 |
102 |
100 |
103 |
103 |
100 |
105 |
90 |
Italy |
109 |
106 |
88 |
86 |
90 |
95 |
98 |
101 |
89 |
Switzerland |
76 |
82 |
87 |
84 |
83 |
82 |
81 |
81 |
80 |
Germany |
83 |
79 |
81 |
78 |
78 |
77 |
75 |
77 |
69 |
Denmark |
74 |
73 |
67 |
61 |
58 |
59 |
63 |
63 |
68 |
Sweden |
70 |
67 |
57 |
60 |
53 |
57 |
59 |
61 |
68 |
Finland |
59 |
58 |
55 |
57 |
55 |
57 |
51 |
53 |
53 |
Norway |
73 |
72 |
75 |
71 |
74 |
74 |
63 |
60 |
49 |
Table A3 Notes:
Source: World Prison Brief, Institute for Crime & Justice Policy Research (ICPR) (retrieved January 15, 2021 at www.prisonstudies.org/highest-to-lowest/prison-population-total).
The incarceration rate presented here is a measure of the number of people (i.e., adults and youth) in custody per 100,000 people in the general population. Incarceration rates from the World Prison Brief are based on the most recently available data at the time the list was compiled. For 2020, the data was retrieved online on January 15, 2021 at www.prisonstudies.org which contains the most up to date information available. Different practices and variations in measurement in different countries limit the comparability of these figures.
Canada's incarceration rate has fluctuated in the last 10 years
Figure A4: Prison population rate per 100,000
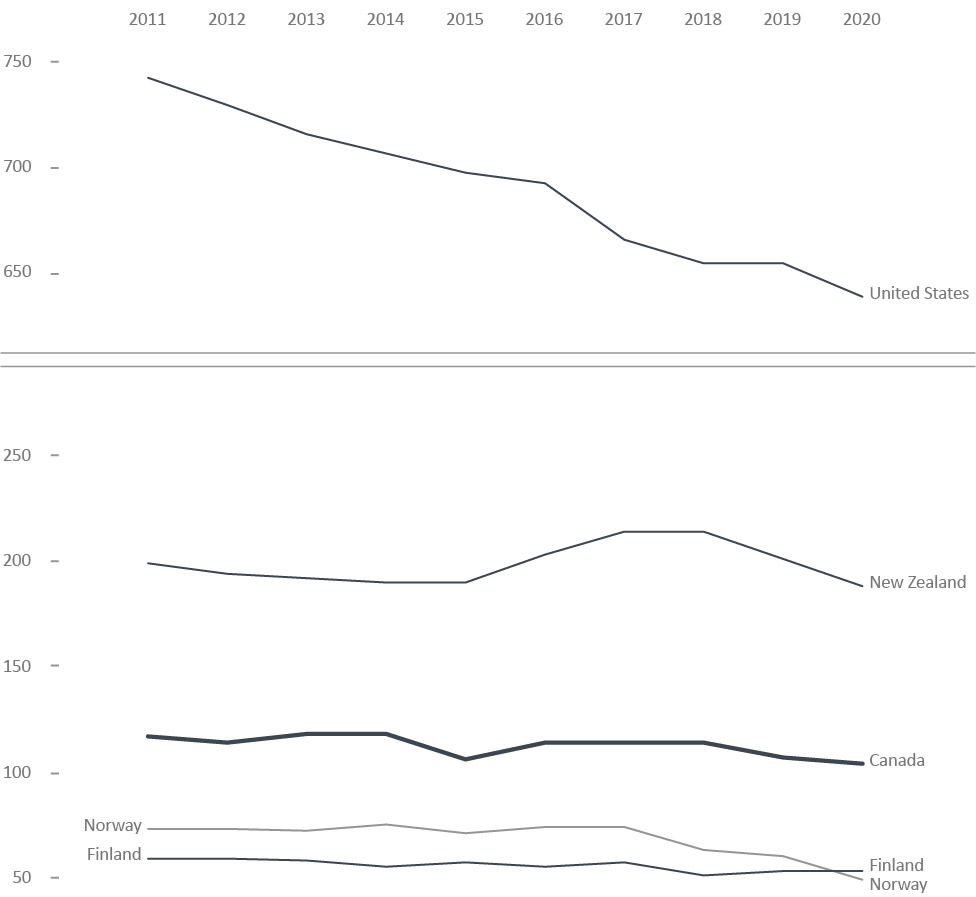
Image description
|
United States |
New Zealand |
Canada |
Finland |
Norway |
|---|---|---|---|---|---|
2011 |
743 |
199 |
117 |
59 |
73 |
2012 |
730 |
194 |
114 |
59 |
73 |
2013 |
716 |
192 |
118 |
58 |
72 |
2014 |
707 |
190 |
118 |
55 |
75 |
2015 |
698 |
190 |
106 |
57 |
71 |
2016 |
693 |
203 |
114 |
55 |
74 |
2017 |
666 |
214 |
114 |
57 |
74 |
2018 |
655 |
214 |
114 |
51 |
63 |
2019 |
655 |
201 |
107 |
53 |
60 |
2020 |
639 |
188 |
104 |
53 |
49 |
Figure A4 Notes:
Source: World Prison Brief, Institute for Crime & Justice Policy Research (ICPR) (retrieved January 15, 2021 at www.prisonstudies.org/highest-to-lowest/prison-population-total).
- Since 2009, Canada's incarceration rate decreased 11.1%, from 117 per 100,000 to 104 in 2020. This was the largest decline during this period.
- Since 2011, the incarceration rate of the United States has steadily declined. It decreased 14.0% from 743 per 100,000 in 2011 to 639 per 100,000 in 2020.
- Over the same period, New Zealand's incarceration rate decreased 5.5% from 199 to 188 per 100,000.
- Norway's incarceration rate decreased 32.9% from 73 per 100,000 in 2011 to 49 per 100,000 in 2020.
- Since 2011, Finland's incarceration rate has remained fairly stable.
The incarceration rate presented here is a measure of the number of people (i.e., adults and youth) in custody per 100,000 people in the general population. Incarceration rates from the World Prison Brief hosted by the Institute for Crime & Justice Policy Research (ICPR) are based on the most recently available data at the time the list was compiled. The data was retrieved online on February 20, 2020 from http://www.prisonstudies.org which contains the most up-to-date information available. Different practices and variations in measurement in different countries limit the comparability of these figures.
2011 |
2012 |
2013 |
2014 |
2015 |
2016 |
2017 |
2018 |
2019 |
2020 |
|
|---|---|---|---|---|---|---|---|---|---|---|
United States |
743 |
730 |
716 |
707 |
698 |
693 |
666 |
655 |
655 |
639 |
New Zealand |
199 |
194 |
192 |
190 |
190 |
203 |
214 |
214 |
201 |
188 |
Australia |
133 |
129 |
130 |
143 |
151 |
152 |
168 |
172 |
170 |
160 |
Scotland |
155 |
151 |
147 |
144 |
144 |
142 |
138 |
143 |
149 |
136 |
England & Wales |
155 |
154 |
148 |
149 |
148 |
147 |
146 |
140 |
140 |
131 |
Canada |
117 |
114 |
118 |
118 |
106 |
114 |
114 |
114 |
107 |
104 |
Austria |
104 |
104 |
98 |
99 |
95 |
93 |
94 |
98 |
98 |
95 |
France |
102 |
102 |
101 |
102 |
100 |
103 |
103 |
100 |
105 |
90 |
Italy |
110 |
109 |
106 |
88 |
86 |
90 |
95 |
98 |
101 |
89 |
Switzerland |
79 |
76 |
82 |
87 |
84 |
83 |
82 |
81 |
81 |
80 |
Germany |
87 |
83 |
79 |
81 |
78 |
78 |
77 |
75 |
77 |
69 |
Denmark |
74 |
74 |
73 |
67 |
61 |
58 |
59 |
63 |
63 |
68 |
Sweden |
78 |
70 |
67 |
57 |
60 |
53 |
57 |
59 |
61 |
68 |
Finland |
59 |
59 |
58 |
55 |
57 |
55 |
57 |
51 |
53 |
53 |
Norway |
73 |
73 |
72 |
75 |
71 |
74 |
74 |
63 |
60 |
49 |
Table A4 Notes:
Source: World Prison Brief, Institute for Crime & Justice Policy Research (ICPR) (retrieved January 15, 2021 at www.prisonstudies.org/highest-to-lowest/prison-population-total).
The incarceration rate presented here is a measure of the number of people (i.e., adults and youth) in custody per 100,000 people in the general population.
Incarceration rates from the World Prison Brief are based on the most recently available data at the time the list was compiled. For 2020, the data was retrieved online on January 13, 2021 at www.prisonstudies.org which contains the most up to date information available. Additionally, different practices and variations in measurement in different countries limit the comparability of these figures.
The rate of adults charged
Figure A5: Rate of adults charged per 100,000 adult population

Image description
Year |
Total Charged |
Other CCCFigure A5 footnote * |
Violent |
Property |
Traffic |
Drugs |
Total Other Fed. Stat.Figure A5 footnote ** |
|---|---|---|---|---|---|---|---|
2010 |
2,122 |
545 |
576 |
473 |
295 |
211 |
22 |
2011 |
2,023 |
527 |
548 |
441 |
271 |
213 |
23 |
2012 |
2,008 |
536 |
541 |
434 |
269 |
203 |
25 |
2013 |
1,901 |
519 |
505 |
417 |
242 |
200 |
18 |
2014 |
1,845 |
520 |
489 |
399 |
233 |
191 |
13 |
2015 |
1,866 |
535 |
501 |
403 |
230 |
182 |
15 |
2016 |
1,912 |
609 |
511 |
381 |
222 |
171 |
18 |
2017 |
1,902 |
635 |
515 |
375 |
208 |
157 |
12 |
2018 |
1,923 |
661 |
523 |
385 |
203 |
138 |
13 |
2019 |
1,986 |
679 |
560 |
407 |
214 |
112 |
14 |
Figure A5 Notes:
Source: Table 35-10-0177-01, Uniform Crime Reporting Survey, Canadian Centre for Justice and Community Safety Statistics, Statistics Canada.
- The rate of adults charged increased 6.4% from 2015 to 2019 (1,866 per 100,000 to 1,986). The 2019 rate was 6.4% lower than 2010 (2,122 per 100,000).
- The rate of adults charged with violent crimes increased 11.8% from 2015 to 2019 (501 per 100,000 to 560 per 100,000). The 2019 rate is 2.8% lower than 2010 (576 adults per 100,000).
- The rate of other Criminal Code offences* increased by 26.9% between 2015 to 2019 (from 535 adults per 100,000 to 679 in 2019).
- The rate of adults charged for property offences in 2019 (407 per 100,000) was similar to 2015 (403 per 100,000) and was 14.0% lower than 2010 (473 adults per 100,000).
Unlike Statistics Canada, the total crime rate in the Corrections and Conditional Release Statistical Overview includes traffic offences and violations of federal statutes to provide a measure of all criminal offences. As a result, the Total Crime Rate reported here is higher than that reported by Statistics Canada.
The definitions for Violent, Property and Other Criminal Code offences have been revised by Statistics Canada to better reflect definitions used by the policing community. As a result of these changes, comparable data are only available starting in 1998 and the data presented in this year's report are not comparable to the data reported in previous versions of the Corrections and Conditional Release Statistical Overview.
Violent crimes include homicide, attempted murder, assault, sexual offences, abduction, extortion, robbery, firearms, and other violent offences such as uttering threats and criminal harassment.
Property crimes include break and enter, motor vehicle thefts, other thefts, possession of stolen property, fraud, mischief and arson.
The figure includes data from the most recent year available at the time of publication.
Year |
Violent |
Property |
Traffic |
Other CCCTable A5 note* |
Drugs |
Total Other Fed. Stat.Table A5 note** |
Total Charged |
|---|---|---|---|---|---|---|---|
1998 |
563 |
677 |
374 |
430 |
168 |
12 |
2,224 |
1999 |
590 |
632 |
371 |
396 |
185 |
18 |
2,192 |
2000 |
615 |
591 |
349 |
411 |
198 |
16 |
2,180 |
2001 |
641 |
584 |
349 |
451 |
202 |
18 |
2,245 |
2002 |
617 |
569 |
336 |
460 |
199 |
18 |
2,199 |
2003 |
598 |
573 |
326 |
476 |
172 |
15 |
2,160 |
2004 |
584 |
573 |
314 |
490 |
187 |
22 |
2,170 |
2005 |
589 |
550 |
299 |
479 |
185 |
22 |
2,124 |
2006 |
594 |
533 |
300 |
498 |
198 |
20 |
2,143 |
2007 |
577 |
499 |
298 |
521 |
208 |
20 |
2,123 |
2008 |
576 |
487 |
307 |
540 |
207 |
22 |
2,139 |
2009 |
585 |
490 |
311 |
532 |
201 |
20 |
2,139 |
2010 |
576 |
473 |
295 |
545 |
211 |
22 |
2,122 |
2011 |
548 |
441 |
271 |
527 |
213 |
23 |
2,023 |
2012 |
541 |
434 |
269 |
536 |
203 |
25 |
2,008 |
2013 |
505 |
417 |
242 |
519 |
200 |
18 |
1,901 |
2014 |
489 |
399 |
233 |
520 |
191 |
13 |
1,845 |
2015 |
501 |
403 |
230 |
535 |
182 |
15 |
1,866 |
2016 |
511 |
381 |
222 |
609 |
171 |
18 |
1,912 |
2017 |
515 |
375 |
208 |
635 |
157 |
12 |
1,902 |
2018 |
523 |
385 |
203 |
661 |
138 |
13 |
1,923 |
2019 |
560 |
407 |
214 |
679 |
112 |
14 |
1,986 |
Table A5 Notes:
Source: Table 35-10-0177-01, Uniform Crime Reporting Survey, Canadian Centre for Justice and Community Safety Statistics, Statistics Canada
Unlike Statistics Canada, the total crime rate in the Corrections and Conditional Release Statistical Overview includes traffic offences and violations of federal statutes to provide a measure of all criminal offences. As a result, the Total Crime Rate reported here is higher than that reported by Statistics Canada.
The definitions for Violent, Property, Other Criminal Code offences, and Total other federal statutes have been revised by Statistics Canada to better reflect definitions used by the policing community. As a result of these changes, comparable data are only available starting in 1998 and the data presented in this year's report are not comparable to the data reported in previous versions of the Corrections and Conditional Release Statistical Overview.
Due to rounding, rates may not add up to totals.
Violent crimes include homicide, attempted murder, assault, sexual offences, abduction, extortion, robbery, firearms, and other violent offences such as uttering threats and criminal harassment.
Property crimes include break and enter, motor vehicle theft, other theft, possession of stolen property, fraud, mischief and arson.
The table includes data from the most recent year available at the time of publication.
Common assault, impaired driving, and theft were the three most frequent cases in adult courts
Figure A6: Percentage of Criminal Code and Other Federal Statute Charges (2018-19)
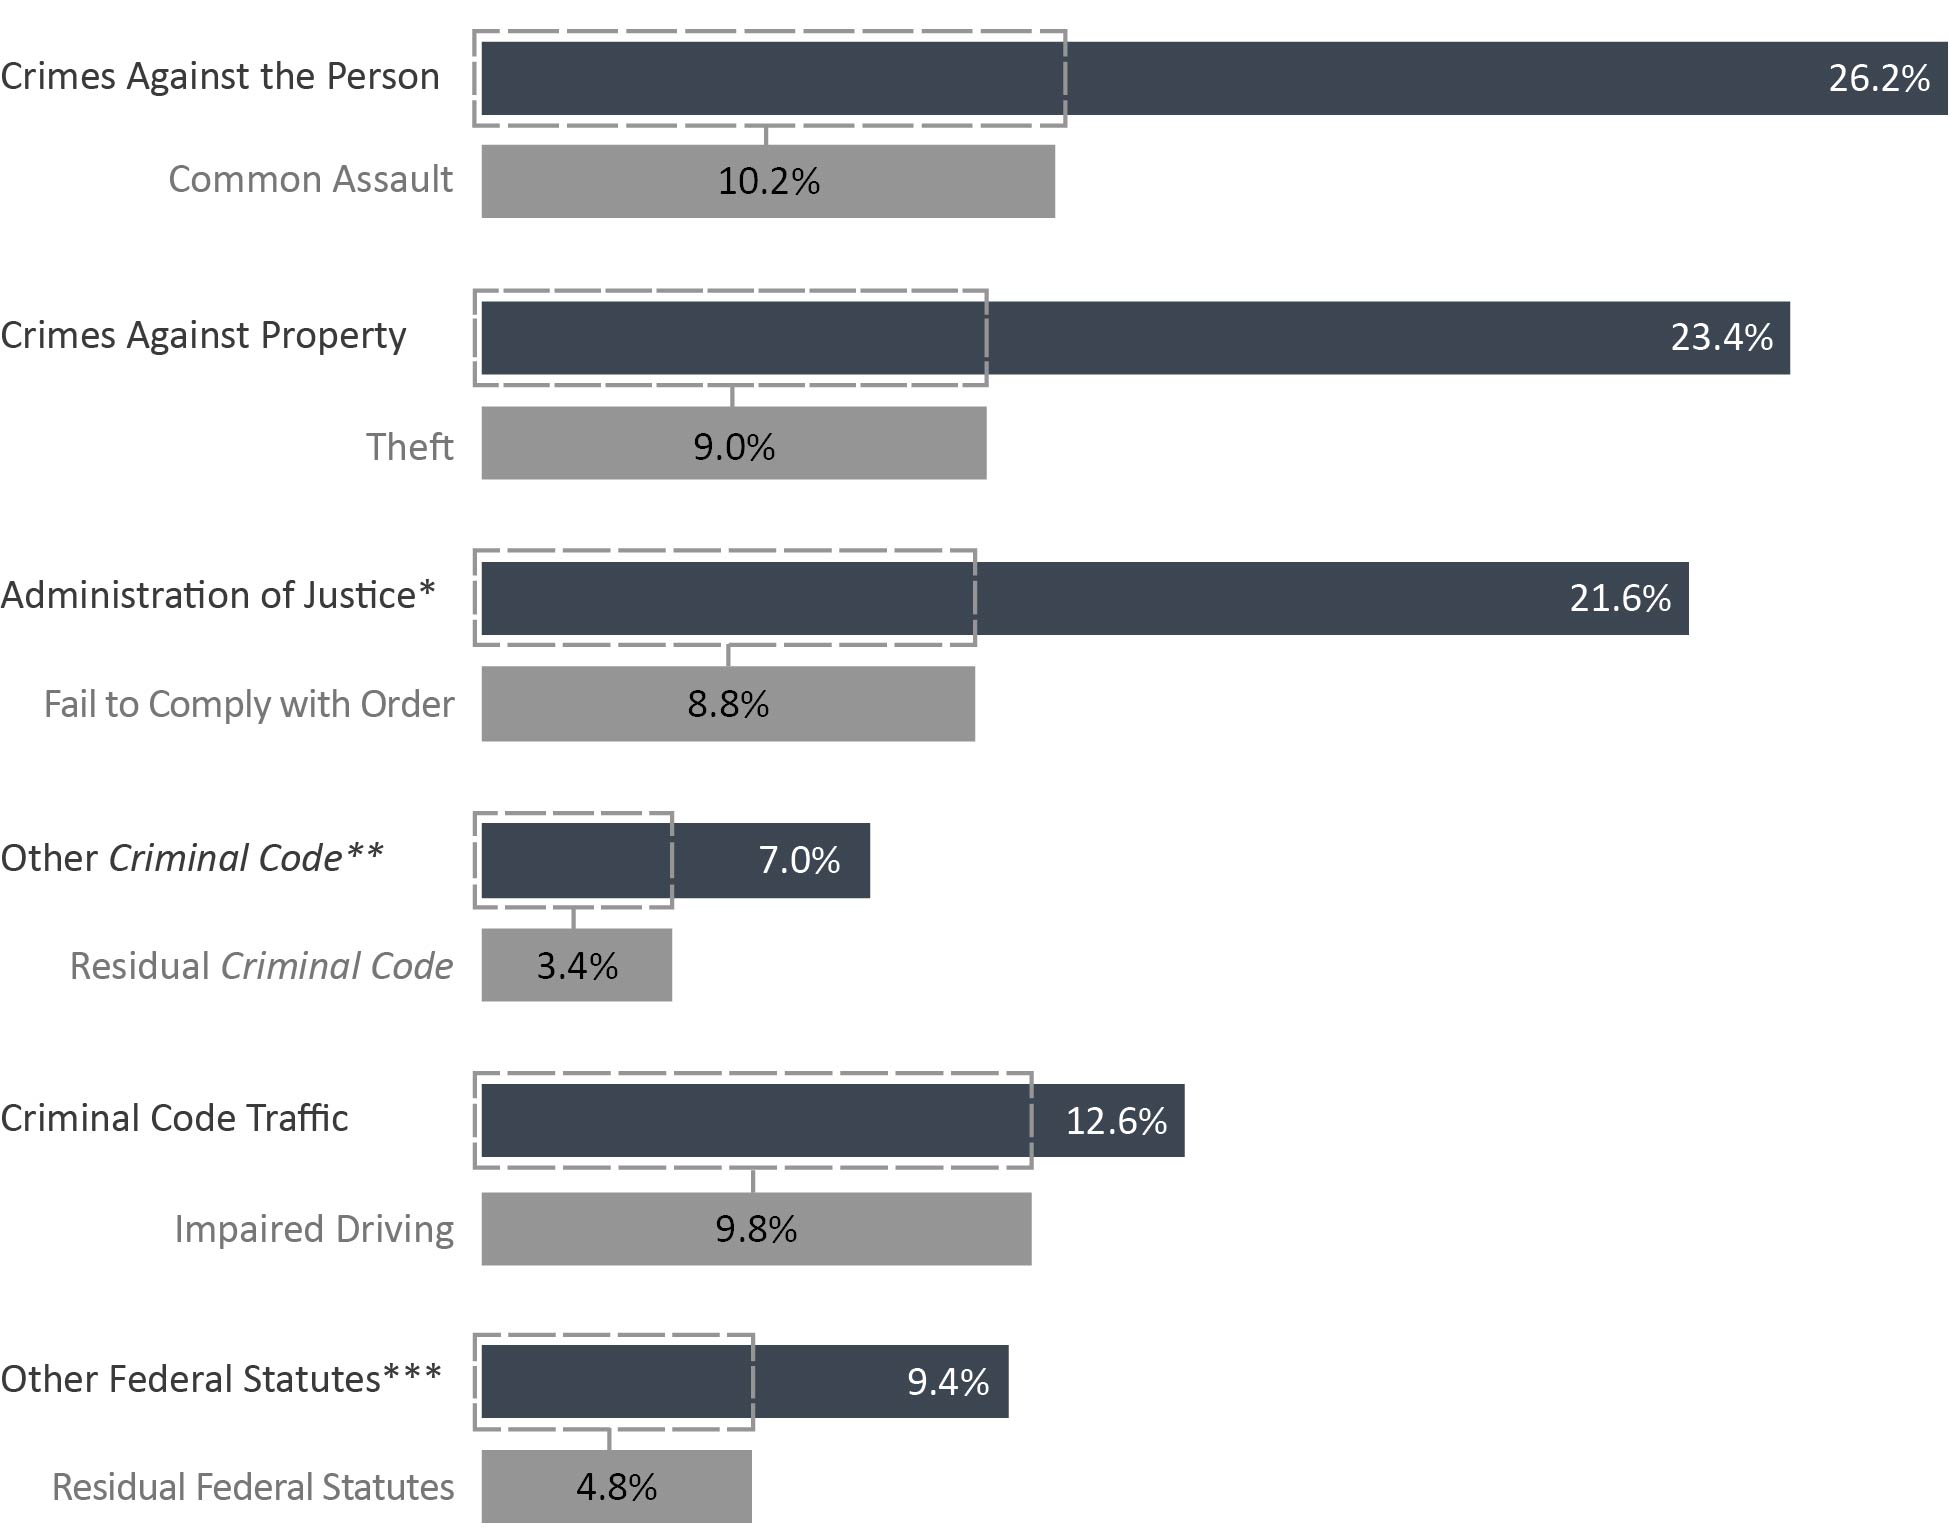
Image description
| Type of Charge | Percent |
|---|---|
| Crimes Against the Person | 26.17 |
| Most Common Crime Against the Person: Common Assault (Level 1) | 10.24 |
| Crimes Against Property | 23.37 |
| Most Common Crime Against Property: Theft | 9.01 |
| Administration of JusticeFigure A6 footnote * | 21.56 |
| Most Common Administration of Justice*: Fail to Comply with Order | 8.79 |
| Other Criminal CodeFigure A6 footnote ** | 6.95 |
| Most Common Other Criminal Code**: Residual Criminal Code | 3.40 |
| Criminal Code Traffic | 12.55 |
| Most Common Criminal Code Traffic: Impaired Driving | 9.82 |
| Other Federal StatutesFigure A6 footnote *** | 9.41 |
| Most Common Other Federal StatuesFigure A6 footnote ***: Residual Federal Statutes | 4.81 |
Figure A6 Notes:
Source: Table 35-10-0027-01, Integrated Criminal Court Survey, Canadian Centre for Justice and Community Safety Statistics, Statistics Canada.
- Common assault (Level 1) (10.2%), theft (9.0%) and impaired driving (9.8%) were the most frequent cases in adult courts in 2018-19.
- Administration of justice cases (offences related to case proceedings such as failure to appear in court, failure to comply with a court order, breach of probation, and unlawfully at large) accounted for 21.6% of cases completed in adult criminal courts. Breach of probation (8.3%) and failure to comply with a court order (8.8%) combined accounted for 17.1% of total cases in adult court.
The concept of a case has changed to more closely reflect court processing. Statistics from the Integrated Criminal Court Survey used in this report should not be compared to editions of the Corrections and Conditional Release Statistical Overview prior to 2007. A case is one or more charges against an accused person or corporation, processed by the courts at the same time, and where all of the charges in the case received a final disposition. Where a case has more than one charge, it is necessary to select a charge to represent the case. An offence is selected by applying two rules. First, the "most serious decision" rule is applied. In cases where two or more offences have the same decision, the "most serious offence" rule is applied. All charges are ranked according to an offence seriousness scale. Superior Court data are not reported to the Integrated Criminal Court Survey for Prince Edward Island, Quebec, Ontario, Manitoba and Saskatchewan. In addition, information from Quebec's municipal courts is not collected.
The Canadian Centre for Justice and Community Safety Statistics continues to make updates to the offence library used to classify offence data sent by the provinces and territories. These improvements have resulted in minor changes in the counts of charges and cases as well as the distributions by type of offence. Data presented have been revised to account for these updates.
Due to rounding, percentages may not add up to 100 percent.
The figure includes data from the most recent year available at the time of publication.
Type of Charge |
2014-15 |
2015-16 |
2016-17 |
2017-18 |
2018-19 |
|
|---|---|---|---|---|---|---|
Crimes Against the Person |
79,771 |
80,824 |
85,112 |
89,172 |
81,024 |
|
| Crimes Against the Person | Common Assault (Level 1) |
30,336 |
30,494 |
31,647 |
35,118 |
31,720 |
Major Assault (Levels 2 & 3) |
18,439 |
18,900 |
20,201 |
20,806 |
19,196 |
|
Uttering Threats |
15,074 |
14,879 |
15,261 |
13,913 |
12,690 |
|
Criminal Harassment |
3,236 |
3,345 |
3,538 |
3,749 |
3,245 |
|
Sexual Assault |
2,685 |
2,844 |
3,109 |
3,278 |
3,222 |
|
Robbery |
3,223 |
3,358 |
3,576 |
3,535 |
2,968 |
|
Homicide and Related |
289 |
259 |
364 |
377 |
314 |
|
Attempted Murder |
177 |
206 |
203 |
202 |
190 |
|
Other Sexual Offences |
3,475 |
3,695 |
3,950 |
4,346 |
3,853 |
|
Crimes Against Property |
79,984 |
81,187 |
85,467 |
82,539 |
72,354 |
|
| Crimes Against Property | Theft |
34,913 |
35,197 |
36,138 |
32,713 |
27,900 |
Mischief |
12,340 |
12,411 |
12,955 |
13,167 |
11,949 |
|
Fraud |
11,314 |
11,476 |
12,728 |
12,601 |
10,777 |
|
Possession of Stolen Property |
10,552 |
10,929 |
11,646 |
11,983 |
10,371 |
|
Break and Enter |
8,994 |
9,325 |
9,968 |
9,707 |
8,933 |
|
Other Property Crimes |
1,871 |
1,849 |
2,032 |
2,368 |
2,424 |
|
Administration of JusticeTable A6 footnote** |
77,528 |
78,195 |
80,940 |
73,794 |
66,773 |
|
| Administration of Justice | Fail to Comply with Order |
32,978 |
33,290 |
34,632 |
30,064 |
27,226 |
Breach of Probation |
30,228 |
30,396 |
30,955 |
29,010 |
25,689 |
|
Fail to Appear |
3,891 |
4,113 |
4,442 |
4,156 |
4,284 |
|
Unlawfully at Large |
2,588 |
2,591 |
2,693 |
2,873 |
2,676 |
|
Other Admin. Justice |
7,843 |
7,805 |
8,218 |
7,691 |
6,898 |
|
Other Criminal CodeTable A6 footnote*** |
17,993 |
18,552 |
20,447 |
23,459 |
21,521 |
|
| Other Criminal Code | Residual Criminal Code |
6,977 |
6,986 |
8,149 |
11,345 |
10,534 |
Weapons |
9,528 |
10,340 |
10,958 |
11,322 |
10,340 |
|
Disturbing the Peace |
1,132 |
1,054 |
938 |
740 |
625 |
|
Prostitution |
356 |
172 |
402 |
52 |
22 |
|
Criminal Code Traffic |
48,778 |
46,086 |
45,833 |
44,204 |
38,855 |
|
| Criminal Code Traffic | Impaired Driving |
39,130 |
36,308 |
35,993 |
34,947 |
30,402 |
Other CC Traffic |
9,648 |
9,778 |
9,840 |
9,257 |
8,453 |
|
Other Federal StatutesTable A6 footnote* |
42,517 |
39,390 |
38,371 |
36,302 |
29,137 |
|
| Other Federal Statutes | Residual Federal Statutes |
18,339 |
17,147 |
18,179 |
18,695 |
14,899 |
Drug Possession |
13,678 |
12,517 |
10,675 |
8,592 |
6,374 |
|
Other Drug Offences |
9,238 |
8,550 |
8,506 |
8,139 |
7,119 |
|
Total Charges |
346,571 |
344,234 |
356,170 |
349,470 |
309,664 |
|
Table A6 Notes:
Source: Table 35-10-0027-01, Integrated Criminal Court Survey, Canadian Centre for Justice and Community Safety Statistics, Statistics Canada.
The concept of a case has changed to more closely reflect court processing. Statistics from the Integrated Criminal Court Survey used in this report should not be compared to editions of the Corrections and Conditional Release Statistical Overview prior to 2007. Superior Court data are not reported to the Integrated Criminal Court Survey for Prince Edward Island, Quebec, Ontario, Manitoba and Saskatchewan. In addition, information from Quebec's municipal courts is not collected. The Canadian Centre for Justice Statistics continues to make updates to the offence library used to classify offence data sent by the provinces and territories. These improvements have resulted in minor changes in the counts of charges and cases as well as the distributions by type of offence. Data presented have been revised to account for these updates.
Due to rounding, percentages may not add up to 100 percent.
The figure includes data from the most recent year available at the time of publication.
Most adult custodial sentences ordered by the court were short
Figure A7: Length of prison sentence ordered by the court (2018-19)
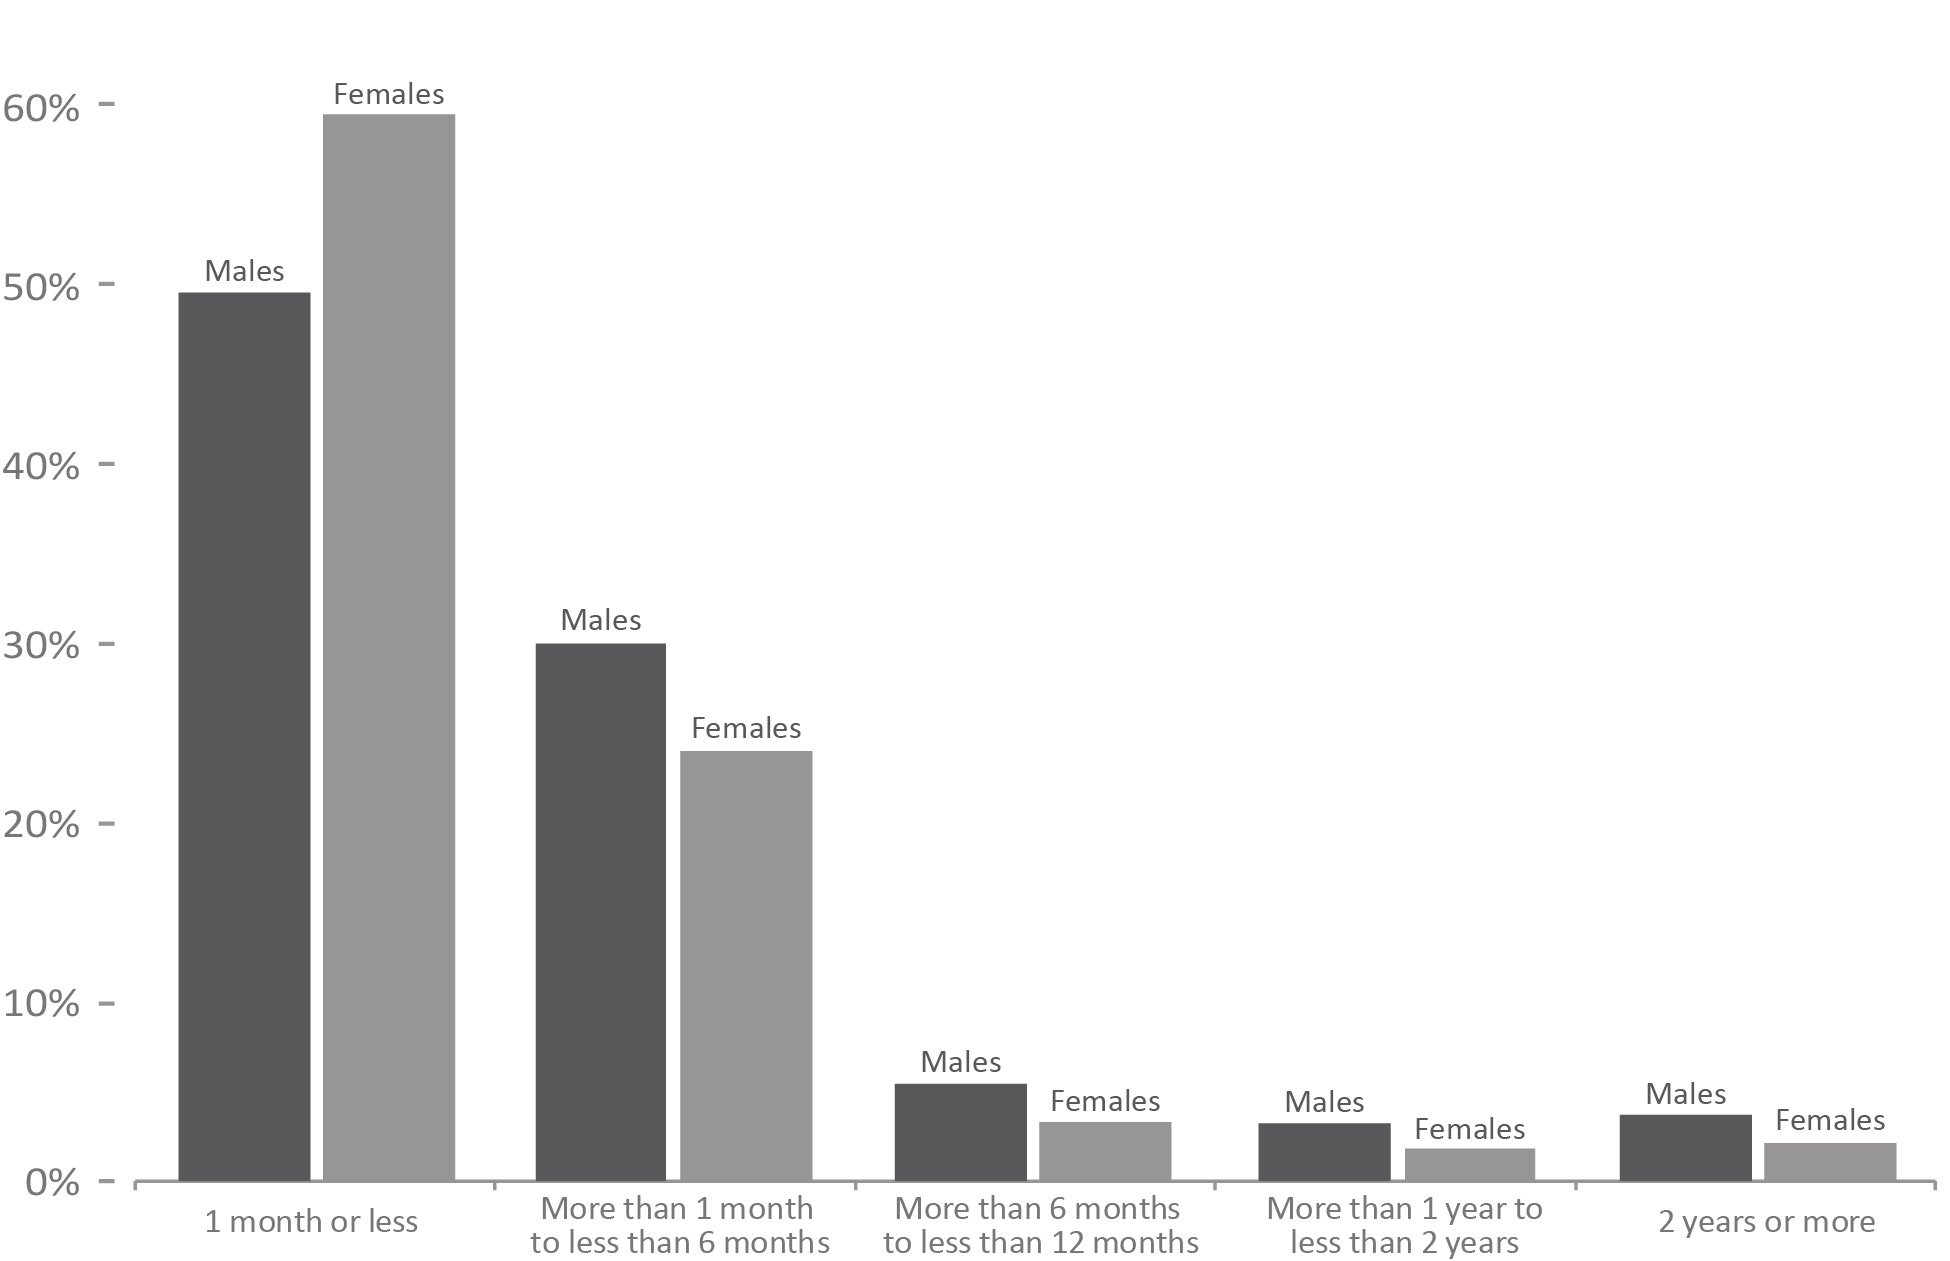
Image description
| 1 month or less | |
|---|---|
| Sex | Percent |
| Males | 49.5 |
| Females | 59.4 |
| More than 1 month up to 6 months | |
| Sex | Percent |
| Males | 29.9 |
| Females | 23.9 |
| More than 6 months up to 12 months | |
| Sex | Percent |
| Males | 5.4 |
| Females | 3.3 |
| More than 1 year up to less than 2 years | |
| Sex | Percent |
| Males | 3.2 |
| Females | 1.8 |
| 2 years or More | |
| Sex | Percent |
| Males | 3.7 |
| Females | 2.1 |
| Length unknown | |
| Sex | Percent |
| Males | 8.3 |
| Females | 9.5 |
Figure A7 Notes:
Source: Table 35-10-0032-01, Integrated Criminal Court Survey, Canadian Centre for Justice and Community Safety Statistics, Statistics Canada.
- Just under half (47.0%) of all custodial sentences imposed by adult criminal courts were one month or less. Prison sentences for males tended to be longer than for females.
- 59.4% of females and 49.5% of males who were incarcerated following a guiltyFigure A7 footnote * finding received a sentence of one month or less, and 83.3% of females and 79.4% of males received a sentence of six months or less.
The concept of a case has changed to more closely reflect court processing. Statistics from the Integrated Criminal Court Survey used in this report should not be compared to editions of the Corrections and Conditional Release Statistical Overview prior to 2007.
Superior Court data are not reported to the Integrated Criminal Court Survey for Prince Edward Island, Quebec, Ontario, Manitoba and Saskatchewan. In addition, information from Quebec's municipal courts is not collected.
The Canadian Centre for Justice and Community Safety Statistics continues to make updates to the offence library used to classify offence data sent by the provinces and territories. These improvements have resulted in minor changes in the counts of charges and cases as well as the distributions by type of offence. Data presented have been revised to account for these updates.
Due to rounding, totals may not add up to 100 percent.
The figure includes data from the most recent year available at the time of publication.
Length of Prison Sentence |
||||||
|---|---|---|---|---|---|---|
2014-15 |
2015-16 |
2016-17 |
2017-18 |
2018-19 |
||
% |
% |
% |
% |
% |
||
1 month or less |
Females |
62.7 |
64.4 |
63.7 |
62.8 |
59.4 |
Males |
51.2 |
51.9 |
52.0 |
50.3 |
49.5 |
|
TotalFootnote * |
48.6 |
49.4 |
49.4 |
47.8 |
47.0 |
|
More than 1 month up to 6 months |
Females |
23.6 |
22.8 |
22.0 |
22.2 |
23.9 |
Males |
31.1 |
30.4 |
29.9 |
30.1 |
29.9 |
|
TotalFootnote * |
28.4 |
27.7 |
27.2 |
27.2 |
27.3 |
|
More than 6 months up to 12 months |
Females |
3.7 |
3.3 |
3.3 |
3.6 |
3.3 |
Males |
5.9 |
5.5 |
5.2 |
5.4 |
5.4 |
|
TotalFootnote * |
5.4 |
5.0 |
4.7 |
4.9 |
4.9 |
|
More than 1 year up to less than 2 years |
Females |
2.0 |
1.7 |
1.7 |
1.7 |
1.8 |
Males |
3.3 |
3.3 |
3.0 |
3.2 |
3.2 |
|
TotalFootnote * |
3.0 |
3.0 |
2.8 |
2.8 |
2.9 |
|
2 years or More |
Females |
2.0 |
2.2 |
2.1 |
1.9 |
2.1 |
Males |
3.5 |
3.6 |
3.4 |
3.6 |
3.7 |
|
TotalFootnote * |
3.1 |
3.2 |
3.0 |
3.1 |
3.2 |
|
Length unknown |
Females |
5.9 |
5.5 |
7.2 |
7.8 |
9.5 |
Males |
4.9 |
5.3 |
6.5 |
7.4 |
8.3 |
|
TotalFootnote * |
11.5 |
11.7 |
12.9 |
14.1 |
14.8 |
|
Table A7 Notes:
Source: Table 35-10-0032-01, Integrated Criminal Court Survey, Canadian Centre for Justice and Community Safety Statistics, Statistics Canada.
The concept of a case has changed to more closely reflect court processing. Statistics from the Integrated Criminal Court Survey used in this report should not be compared to editions of the Corrections and Conditional Release Statistical Overview prior to 2007.
Superior Court data are not reported to the Integrated Criminal Court Survey for Prince Edward Island, Quebec, Ontario, Manitoba and Saskatchewan. In addition, information from Quebec's municipal courts is not collected.
The Canadian Centre for Justice and Community Safety Statistics continues to make updates to the offence library used to classify offence data sent by the provinces and territories. These improvements have resulted in minor changes in the counts of charges and cases as well as the distributions by type of offence. Data presented have been revised to account for these updates.
Due to rounding, totals may not add up to 100 percent.
The table includes data from the most recent year available at the time of publication.
Few cases with guilty findings have resulted in admissions to federal jurisdiction
Figure A8: Cases in adult criminal court and admissions to custody (2018-19)
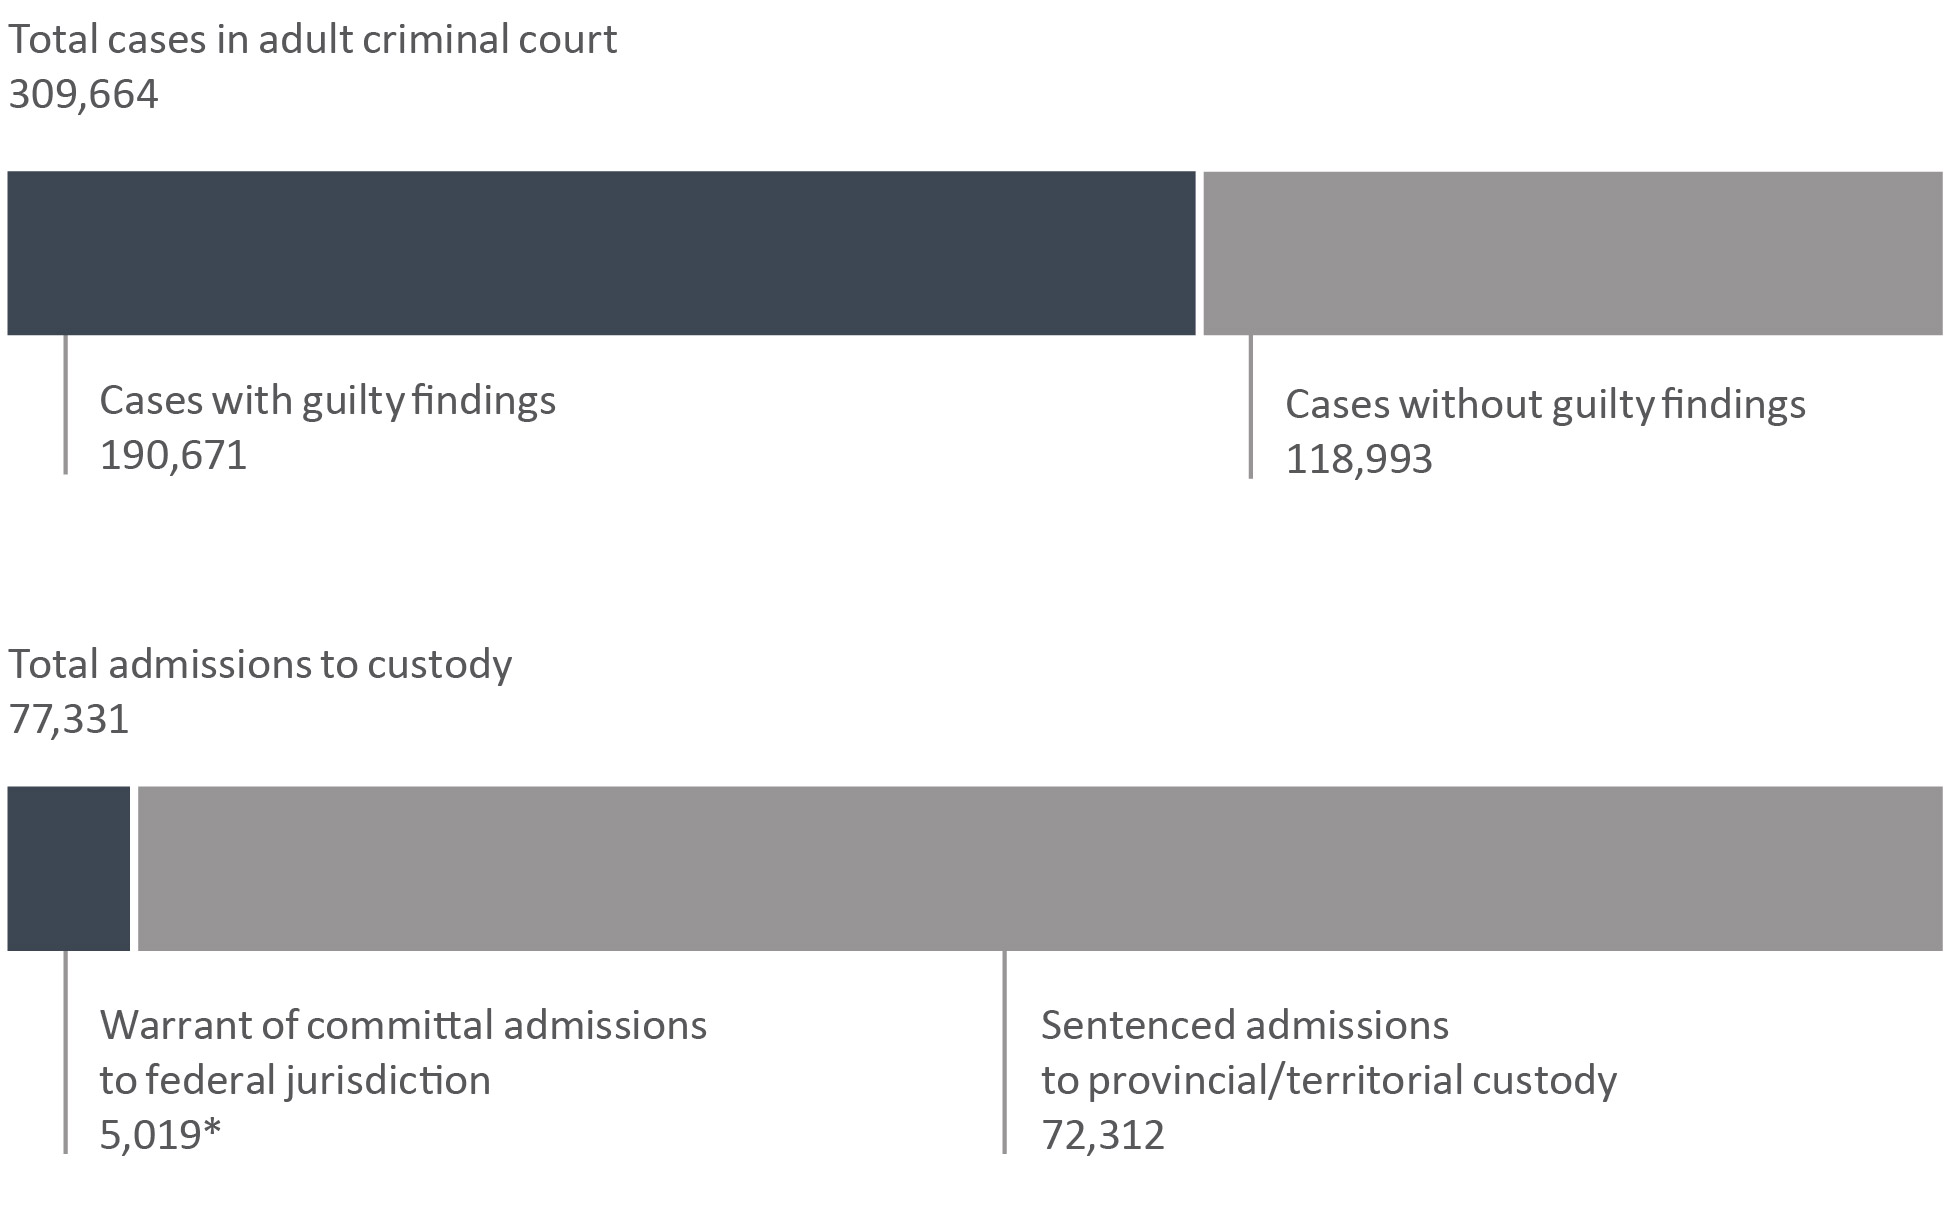
Image description
Total cases in Adult Court |
309,664 |
Cases with Guilty Findings in Adult Criminal Court |
190,671 |
Cases without Guilty Findings in Criminal Court |
118,993 |
|
|
Total admissions to custody |
77,331 |
Warrant of Committal-Admission to FED (CSC)Figure A8 footnote * |
5,019 |
Sentenced Admissions to Provincial/Territorial Custody |
72,312 |
Figure A8 Notes:
Sources:
Table 35-10-0027-01, Integrated Criminal Court Survey, Canadian Centre for Justice and Community Safety Statistics, Statistics Canada;
Table 35-10-0018-01, Adult Correctional Services, Canadian Centre for Justice and Community Safety Statistics, Statistics Canada;
Correctional Service of Canada.
- During 2019-20, there were 4,595 warrant of committal admissions to a federal institution or Healing Lodge.
- In 2018-19, there were 190,671 cases with guilty findingsFigure A8 footnote ** in adult criminal court.
- In 2018-19, there were 72,312 sentenced admissions to provincial/territorial custody, compared to 5,019 warrant of committal admissions for offenders sentenced to a federal institution or Healing Lodge.
This figure only includes cases in provincial court and partial data from Superior Court. Superior Court data are not reported to the Integrated Criminal Court Survey for Prince Edward Island, Quebec, Ontario, Manitoba and Saskatchewan. Information from Quebec's municipal courts is not collected.
These numbers refer to the total number of admissions to a federal institution or Healing Lodge during each fiscal year and may be greater than the actual number of offenders admitted, since an individual offender may be admitted more than once in a given year.
The concept of a case has changed to more closely reflect court processing. Statistics from the Integrated Criminal Court Survey used in this report should not be compared to editions of the Corrections and Conditional Release Statistical Overview prior to 2007. A case is one or more charges against an accused person or corporation, processed by the courts at the same time, and where all of the charges in the case received a final disposition.
Court and prison data are reported on a fiscal year basis (April 1 through March 31).
There is a lag in the data entry of admissions into CSC's Offender Management System. The admission figures for the most recent year are under-reported by 200-400 at the time of our year end extraction. More accurate figures will be available in the next year's publication. Please use caution when including the most recent year in any trend analysis.
The figure includes data from the most recent year available at the time of publication.
2015-16 |
2016-17 |
2017-18 |
2018-19 |
2019-20 |
|
|---|---|---|---|---|---|
Total Case DecisionsTable A8 Note * in Adult Criminal CourtFootnote 1 |
344,234 |
356,170 |
349,470 |
309,664 |
Not availableFootnote *** |
Cases with GuiltyTable A8 Note ** Findings in Adult Criminal CourtFootnote 1 |
221,848 |
224,410 |
217,441 |
190,671 |
Not availableFootnote *** |
Total Cases without Guilty Findings in Criminal CourtFootnote 1 |
122,386 |
131,760 |
132,029 |
118,993 |
Not availableFootnote *** |
AcquittedFootnote 1 |
11,086 |
13,029 |
12,638 |
11,258 |
Not availableFootnote *** |
Stayed or withdrawnFootnote 1 |
107,036 |
114,554 |
115,298 |
103,811 |
Not availableFootnote *** |
Other decisionsFootnote 1 |
4,264 |
4,177 |
4,093 |
3,924 |
Not availableFootnote *** |
Sentenced Admissions to Provincial/Territorial CustodyFootnote 2 |
62,771 |
84,543 |
80,759 |
72,312 |
Not availableFootnote *** |
Warrant of Committal-Admission to FED (CSC)Footnote 3 |
4,890 |
4,907 |
4,996 |
5,019 |
4,595 |
Table A8 Notes:
Police data are reported on a calendar year basis whereas court and prison data are reported on a fiscal year basis (April 1 through March 31).
These numbers refer to the total number of admissions to a federal institution or Healing Lodge during each fiscal year and may be greater than the actual number of offenders admitted, since an individual offender may be admitted more than once in a given year.
There is a lag in the data entry of admissions into CSC's Offender Management System. The admission figures for the most recent year are under-reported by 200-400 at the time of our year end extraction. More accurate figures will be available in the next year's publication. Please use caution when including the most recent year in any trend analysis.
The rate of youth charged has continued to decline
Figure A9: Rate of youth charged per 100,000 youth population
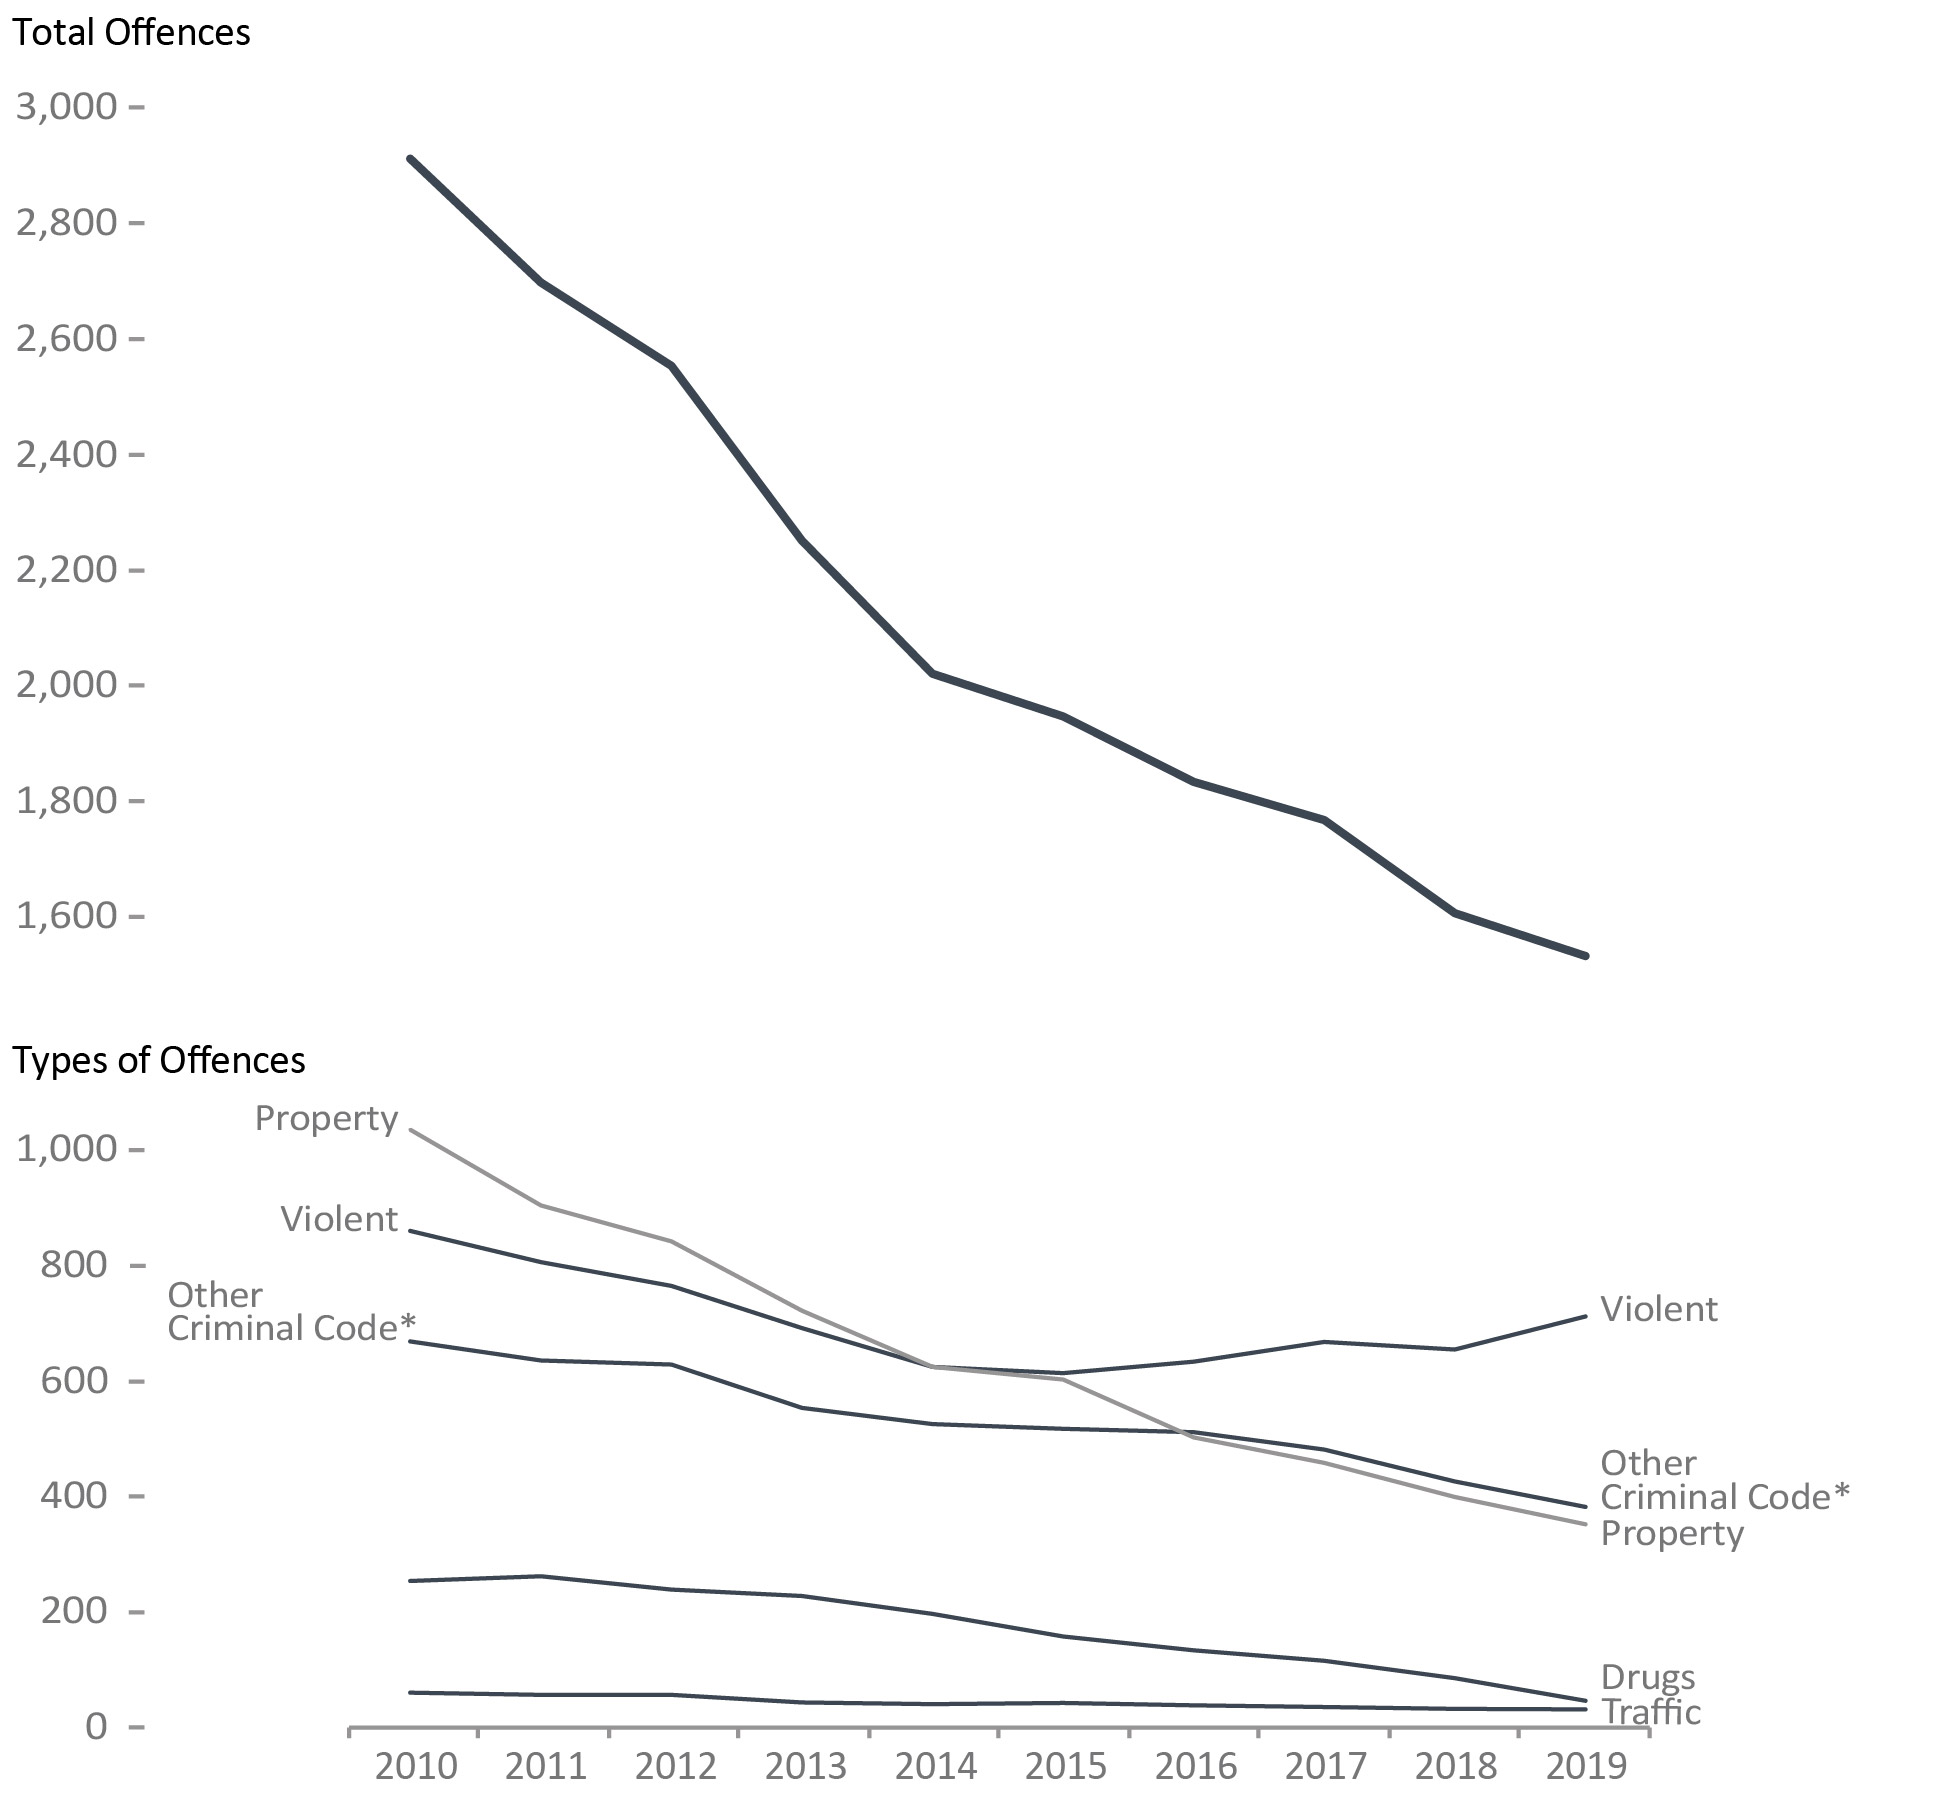
Image description
Year |
Total Charged |
Violent |
Other Criminal CodeFigure A9 footnote * |
Property |
Drugs |
Traffic |
|---|---|---|---|---|---|---|
2010 |
2,912 |
860 |
669 |
1,035 |
255 |
62 |
2011 |
2,698 |
806 |
636 |
904 |
263 |
58 |
2012 |
2,554 |
765 |
629 |
842 |
240 |
58 |
2013 |
2,252 |
692 |
554 |
722 |
229 |
45 |
2014 |
2,022 |
625 |
526 |
625 |
198 |
42 |
2015 |
1,948 |
614 |
518 |
603 |
159 |
44 |
2016 |
1,795 |
634 |
512 |
503 |
135 |
40 |
2017 |
1,769 |
668 |
482 |
459 |
117 |
37 |
2018 |
1,628 |
668 |
425 |
407 |
90 |
33 |
2019 |
1,534 |
712 |
383 |
353 |
48 |
33 |
Figure A9 Notes:
Source: Table 35-10-0177-01, Uniform Crime Reporting Survey, Canadian Centre for Justice and Community Safety Statistics, Statistics Canada.
- Since 2010, the rate of youthFigure A9 footnote ** charged decreased by 47.3%, from 2,912 per 100,000 youth to 1,534 in 2019.
- There was 16.0% increase in the rate of youth charged with a violent crime between 2015 to 2019 (from 614 per 100,000 to 712). The rate of youth charged with violent crimes remains 17.2% lower than 2010 when it was 860 per 100,000.
- Since 2010, the rate of youth charged with property crimes decreased by 65.9%, dropping from 1,035 per 100,000 youth to 353 in 2019. Over the same time period, the rate of youth charged with drug offences decreased by 81.2% from 255 per 100,000 youth to 48 in 2019.
Rates are based on 100,000 youth population (12 to 17 years old). Violent crimes include homicide, attempted murder, assault, sexual offences, abduction, extortion, robbery, firearms, and other violent offences such as uttering threats and criminal harassment. Property crimes include break and enter, motor vehicle theft, other theft, possession of stolen property, fraud, mischief and arson. Unlike Statistics Canada, the total crime rate in the Corrections and Conditional Release Statistical Overview includes traffic offences and violations of federal statutes to provide a measure of all criminal offences. As a result, the Total Crime Rate reported here is higher than that reported by Statistics Canada. In addition, the definitions for Violent, Property and Other Criminal Code offences have been revised by Statistics Canada to better reflect definitions used by the policing community.
The figure includes data from the most recent year available at the time of publication.
Year |
Violent |
Property |
TrafficTable A9 Note * |
Other CCCTable A9 Note ** |
Drugs |
Total Other Fed. Stat.Table A9 Note *** |
Total Charged |
|---|---|---|---|---|---|---|---|
1998 |
994 |
2,500 |
-- |
870 |
226 |
4 |
4,594 |
1999 |
1,060 |
2,237 |
-- |
728 |
266 |
2 |
4,293 |
2000 |
1,136 |
2,177 |
-- |
760 |
317 |
4 |
4,394 |
2001 |
1,157 |
2,119 |
-- |
840 |
343 |
6 |
4,465 |
2002 |
1,102 |
2,009 |
-- |
793 |
337 |
6 |
4,247 |
2003 |
953 |
1,570 |
-- |
726 |
208 |
5 |
3,462 |
2004 |
918 |
1,395 |
-- |
691 |
230 |
5 |
3,239 |
2005 |
924 |
1,276 |
-- |
660 |
214 |
10 |
3,084 |
2006 |
917 |
1,216 |
-- |
680 |
240 |
16 |
3,069 |
2007 |
943 |
1,211 |
75 |
732 |
260 |
17 |
3,238 |
2008 |
909 |
1,130 |
74 |
730 |
267 |
19 |
3,129 |
2009 |
888 |
1,143 |
68 |
698 |
238 |
30 |
3,065 |
2010 |
860 |
1,035 |
62 |
669 |
255 |
31 |
2,912 |
2011 |
806 |
904 |
58 |
636 |
263 |
31 |
2,698 |
2012 |
765 |
842 |
58 |
629 |
240 |
20 |
2,554 |
2013 |
692 |
722 |
45 |
554 |
229 |
10 |
2,252 |
2014 |
625 |
625 |
42 |
526 |
198 |
6 |
2,022 |
2015 |
614 |
603 |
44 |
518 |
159 |
10 |
1,948 |
2016 |
634 |
503 |
40 |
512 |
135 |
11 |
1,795 |
2017 |
668 |
459 |
37 |
482 |
117 |
6 |
1,769 |
2018 |
668 |
407 |
33 |
425 |
90 |
5 |
1,628 |
2019 |
712 |
353 |
33 |
383 |
48 |
5 |
1,534 |
Table A9 Notes:
Source: Table 35-10-0177-01, Uniform Crime Reporting Survey, Canadian Centre for Justice and Community Safety Statistics, Statistics Canada.
Unlike Statistics Canada, the total crime rate in the Corrections and Conditional Release Statistical Overview includes traffic offences and violations of federal statutes to provide a measure of all criminal offences. As a result, the Total Crime Rate reported here is higher than that reported by Statistics Canada. In addition, the definitions for Violent, Property, Other Criminal Code offences, and Total other federal statutes have been revised by Statistics Canada to better reflect definitions used by the policing community. As a result of these changes, comparable data are only available starting in 1998 and the data presented in this year's report are not comparable to the data reported in previous versions of the Corrections and Conditional Release Statistical Overview. Violent crimes include homicide, attempted murder, assault, sexual offences, abduction, extortion, robbery, firearms, and other violent offences such as uttering threats and criminal harassment. Property crimes include break and enter, motor vehicle theft, other theft, possession of stolen property, fraud, mischief and arson.
For criminal justice purposes, youth are defined under Canadian law as persons age 12 to 17.
The table includes data from the most recent year available at the time of publication.
The most frequent youth court case was common assault
Figure A10: Percentage of all Criminal Code and other federal statute charges (2018-19)
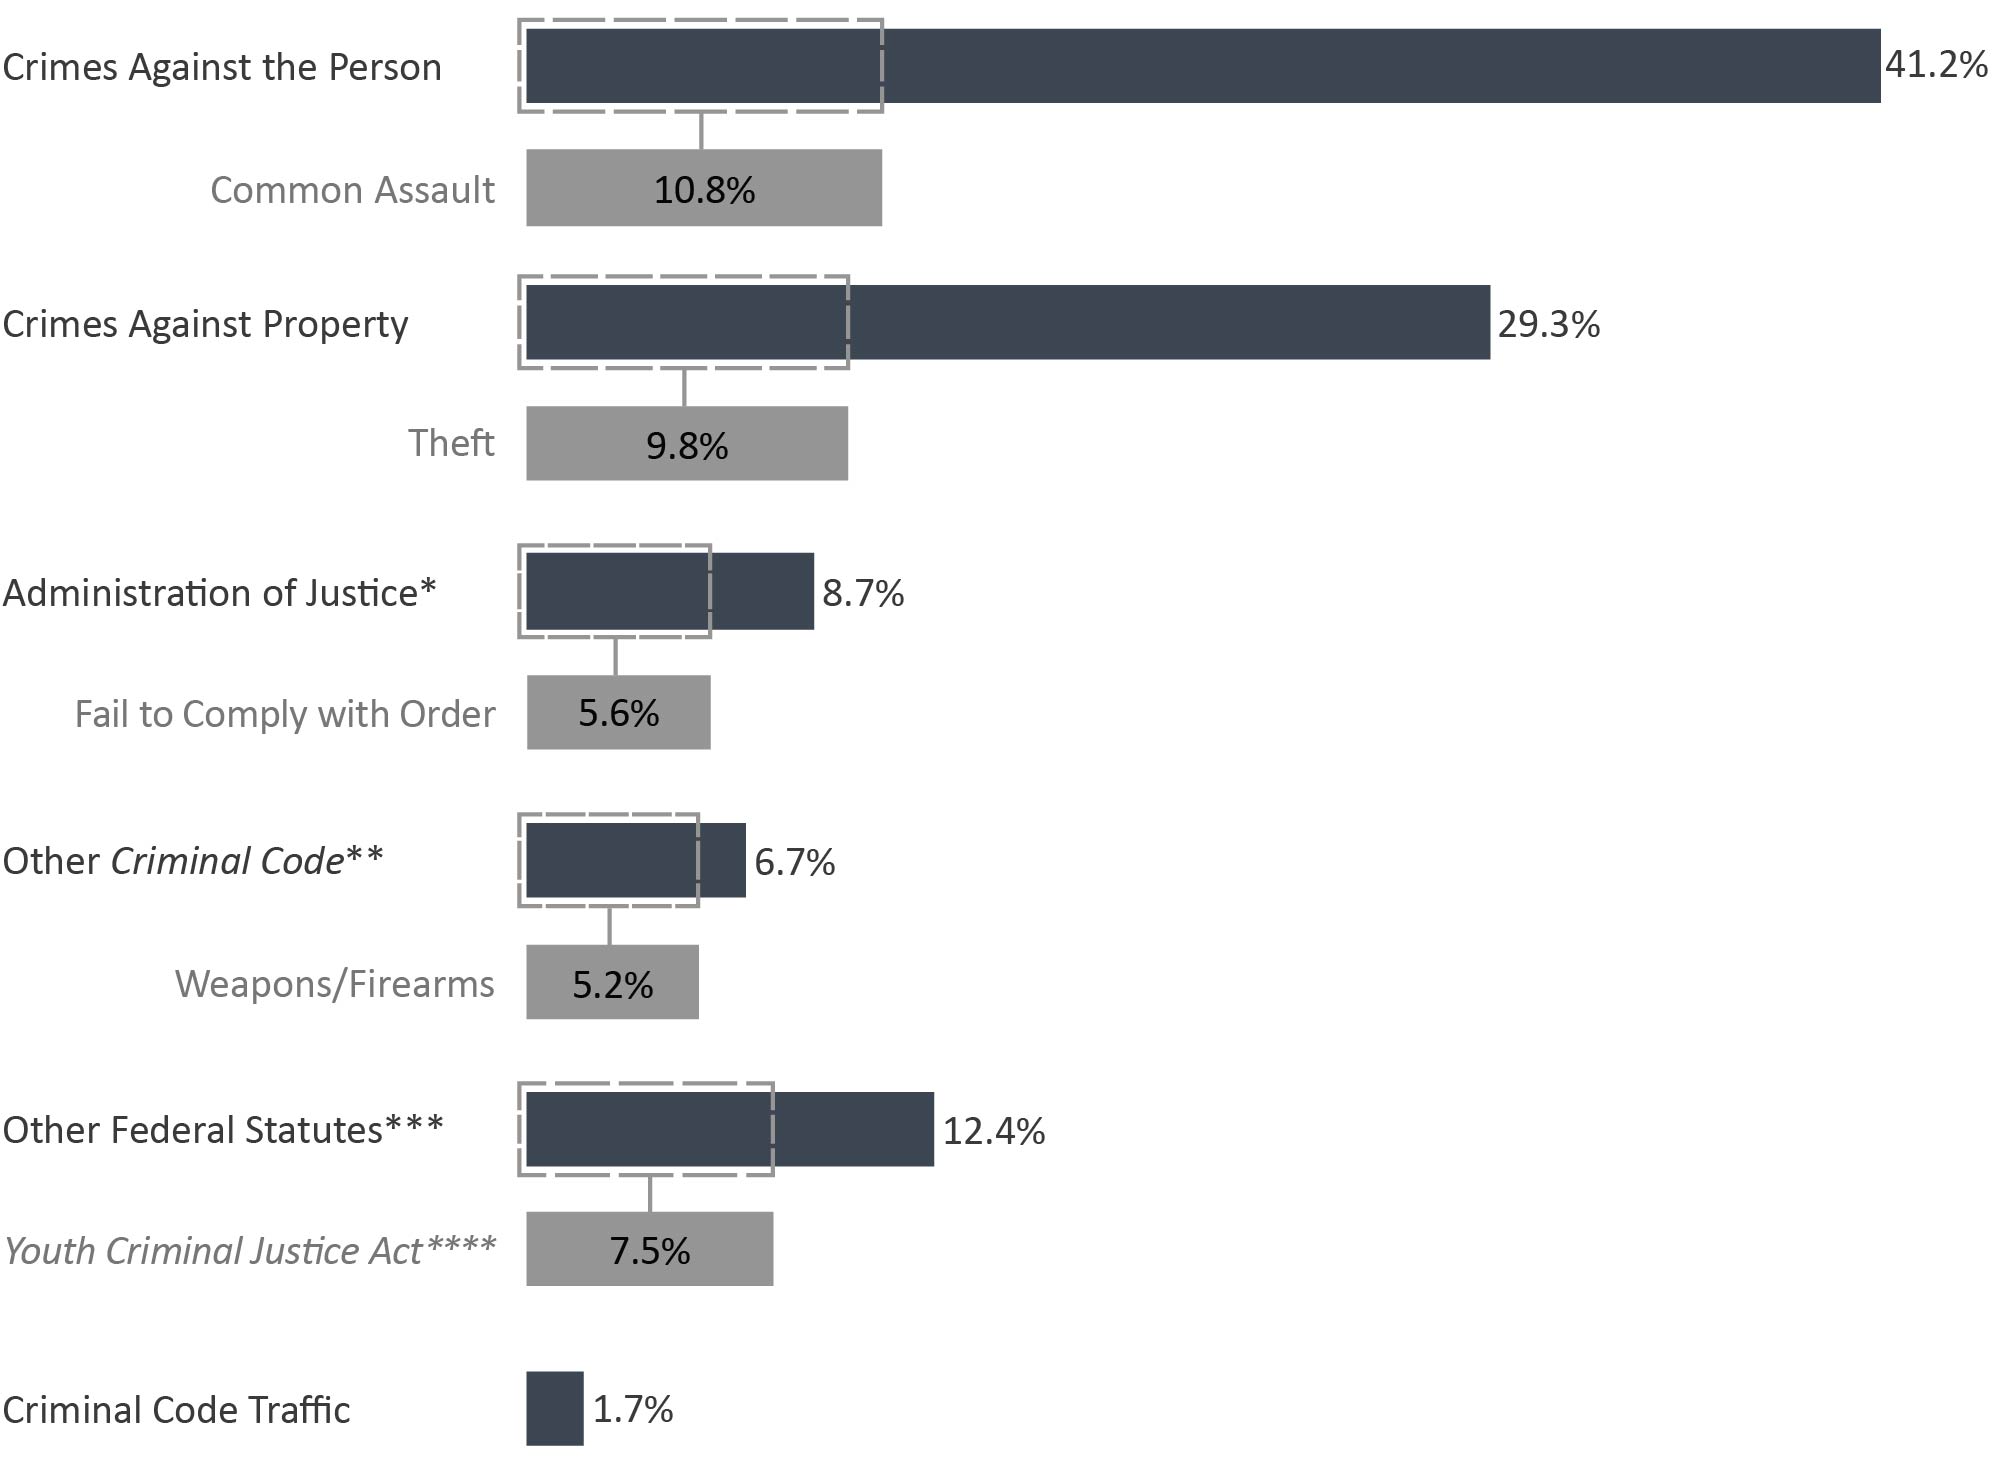
Image description
| Percent | |
|---|---|
| Crimes Against the Person | 41.2 |
| Most Common Crime Against the Person: Common Assault | 10.8 |
| Crimes Against Property | 29.3 |
| Most Commin Crime Against Property: Theft | 9.8 |
| Administration of JusticeFigure A10 footnote * | 8.7 |
| Most Common Administration of JusticeFigure A10 footnote *: Failure to Comply with Order | 5.6 |
| Other Criminal CodeFigure A10 footnote ** | 6.7 |
| Most Common Other Criminal CodeFigure A10 footnote **: Weapons/Firearms | 5.2 |
| Other Federal StatutesFigure A10 footnote *** | 12.4 |
| Most Common Other Federal StatuesFigure A10 footnote ***: Youth Criminal Justice ActFigure A10 footnote **** | 7.5 |
| Criminal Code Traffic | 1.7 |
Source: Table 35-10-0038-01, Integrated Criminal Court Survey, Canadian Centre for Justice and Community Safety Statistics, Statistics Canada.
- Common assault was the most frequent case in youth court (10.8%), closely followed by theft (9.8%).
- Homicides and related offences accounted for 0.2% of all youth cases.
Figure A10 Notes:
The concept of a case has changed to more closely reflect court processing. Statistics from the Integrated Criminal Court Survey used in this report should not be compared to editions of the Corrections and Conditional Release Statistical Overview prior to 2007. A case is one or more charges against an accused person or corporation, processed by the courts at the same time, and where all of the charges in the case received a final disposition. Where a case has more than one charge, it is necessary to select a charge to represent the case. An offence is selected by applying two rules. First, the "most serious decision" rule is applied. In cases where two or more offences have the same decision, the "most serious offence" rule is applied. All charges are ranked according to an offence seriousness scale.
The Canadian Centre for Justice and Community Safety Statistics continues to make updates to the offence library used to classify offence data sent by the provinces and territories. These improvements have resulted in minor changes in the counts of charges and cases as well as the distributions by type of offence. Data presented have been revised to account for these updates.
The figure includes data from the most recent year available at the time of publication.
2014-15 |
2015-16 |
2016-17 |
2017-18 |
2018-19 |
|
|---|---|---|---|---|---|
Crimes Against the Person |
9,984 |
9,653 |
9,917 |
10,395 |
9,938 |
Common Assault |
2,796 |
2,586 |
2,641 |
2,894 |
2,609 |
Major Assault |
2,136 |
2,094 |
2,149 |
2,126 |
2,025 |
Sexual Assault/Other Sexual Offences |
1,330 |
1,442 |
1,536 |
1,658 |
1,794 |
Robbery |
1,481 |
1,475 |
1,516 |
1,618 |
1,484 |
Homicide and Attempted Murder |
49 |
55 |
54 |
41 |
49 |
Other Crimes Against the Person |
2,192 |
2,001 |
2,021 |
2,058 |
1,977 |
Crimes Against Property |
11,016 |
10,652 |
9,627 |
8,490 |
7,071 |
Theft |
3,670 |
3,671 |
3,280 |
2,796 |
2,361 |
Break and Enter |
2,559 |
2,386 |
2,193 |
1,823 |
1,468 |
Mischief |
2,158 |
2,091 |
1,819 |
1,660 |
1,445 |
Possession of Stolen Property |
1,901 |
1,817 |
1,621 |
1,466 |
1,149 |
Fraud |
376 |
377 |
423 |
389 |
367 |
Other Crimes Against Property |
352 |
310 |
291 |
356 |
281 |
Administration of JusticeTable A10 footnote * |
3,630 |
3,394 |
3,113 |
2,492 |
2,108 |
Failure to Comply with Order |
2,390 |
2,209 |
2,067 |
1,573 |
1,344 |
Other Administration of Justice |
1,240 |
1,185 |
1,046 |
919 |
764 |
Other Criminal CodeTable A10 footnote ** |
2,086 |
1,946 |
1,888 |
1,833 |
1,606 |
Weapons/Firearms |
1,425 |
1,406 |
1,408 |
1,407 |
1,262 |
Residual Criminal Code |
582 |
468 |
416 |
390 |
319 |
Disturbing the Peace |
64 |
65 |
50 |
33 |
25 |
Prostitution |
15 |
7 |
14 |
3 |
0 |
Criminal Code Traffic |
566 |
569 |
554 |
483 |
420 |
Other Federal StatutesTable A10 footnote *** |
6,392 |
5,504 |
4,609 |
3,794 |
2,989 |
Youth Criminal Justice ActTable A10 footnote **** |
3,525 |
3,094 |
2,701 |
2,295 |
1,811 |
Drug Possession |
1,788 |
1,551 |
1,129 |
917 |
700 |
Residual Federal Statutes |
146 |
134 |
126 |
44 |
30 |
Other Drug Offences |
933 |
725 |
653 |
538 |
448 |
Total |
33,674 |
31,718 |
29,708 |
27,487 |
24,132 |
Table A10 Notes:
Source: Table 35-10-0038-01, Integrated Criminal Court Survey, Canadian Centre for Justice and Community Safety Statistics, Statistics Canada.
The concept of a case has changed to more closely reflect court processing. Statistics from the Integrated Criminal Court Survey used in this report should not be compared to editions of the Corrections and Conditional Release Statistical Overview prior to 2007. A case is one or more charges against an accused person or corporation, processed by the courts at the same time, and where all of the charges in the case received a final disposition. Where a case has more than one charge, it is necessary to select a charge to represent the case. An offence is selected by applying two rules. First, the "most serious decision" rule is applied. In cases where two or more offences have the same decision, the "most serious offence" rule is applied. All charges are ranked according to an offence seriousness scale. The Canadian Centre for Justice and Community Safety Statistics continues to make updates to the offence library used to classify offence data sent by the provinces and territories. These improvements have resulted in minor changes in the counts of charges and cases as well as the distributions by type of offence. Data presented have been revised to account for these updates.
The table includes data from the most recent year available at the time of publication.
The most common sentence for youth was probation
Figure A11: Percentage of sentence received in youth court
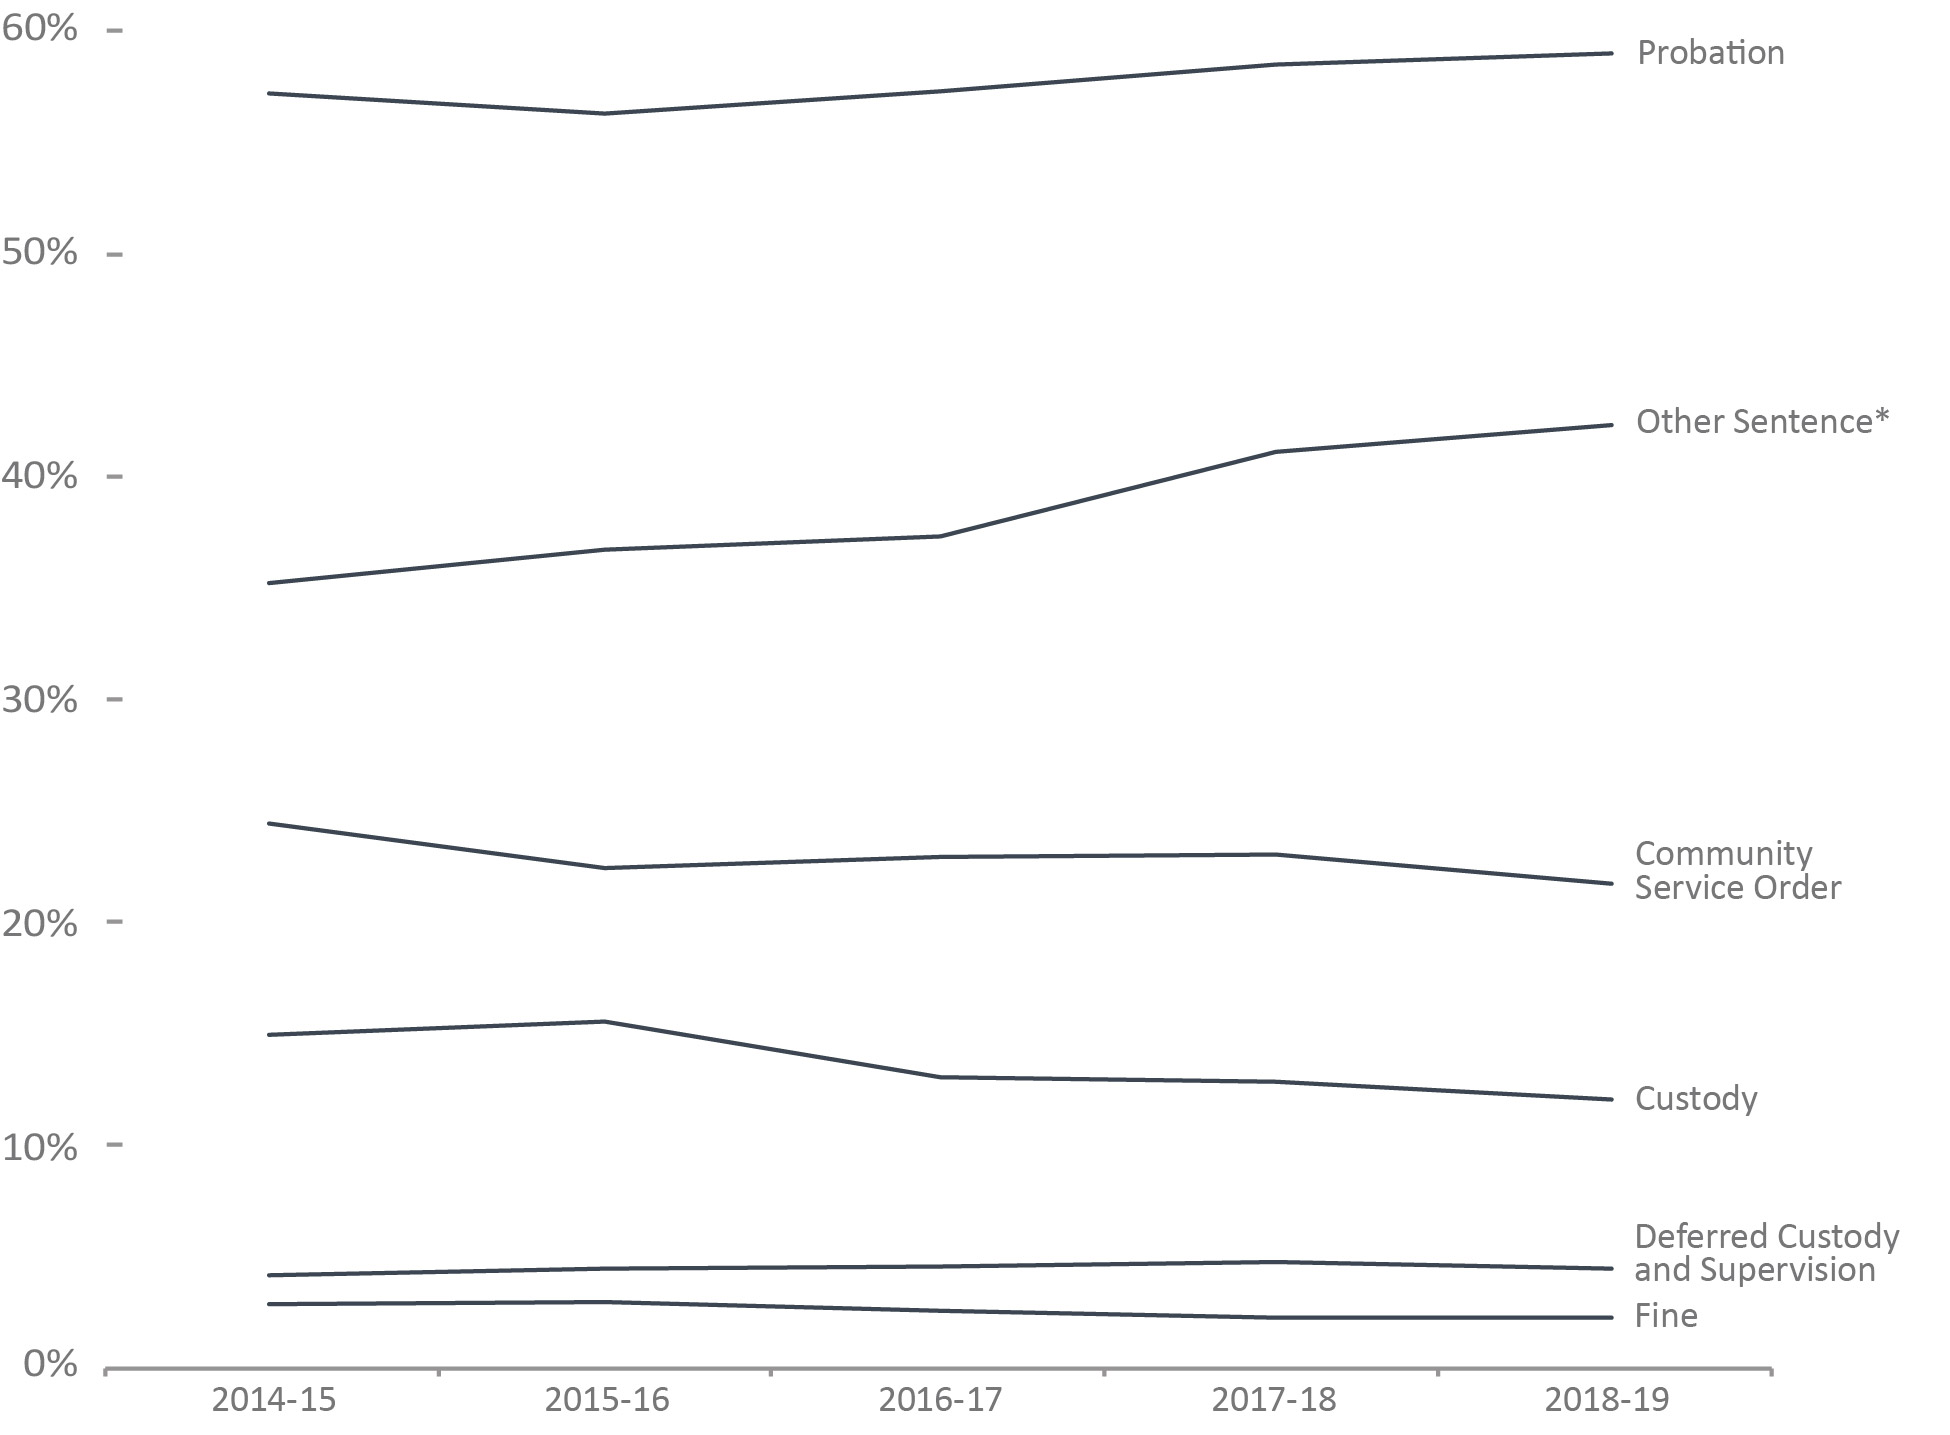
Image description
| Type of Sentence | Year | ||||
|---|---|---|---|---|---|
| 2014-15 Percent | 2015-16 Percent | 2016-17 Percent | 2017-18 Percent | 2018-19 Percent | |
| Probation | 57.2 |
56.3 |
57.3 |
58.5 |
59 |
| Other SentenceFigure A11 footnote * | 35.2 |
36.7 |
37.3 |
41.1 |
42.3 |
| Community Service Order | 24.4 |
22.4 |
22.9 |
23 |
21.7 |
| Custody | 14.9 |
15.5 |
13 |
12.8 |
12 |
| Deferred Custody and Supervision | 4.1 |
4.4 |
4.5 |
4.7 |
4.4 |
| Fine | 2.8 |
2.9 |
2.5 |
2.2 |
2.2 |
Figure A11 Notes:
Source: Table 35-10-0041-01, Integrated Criminal Court Survey, Canadian Centre for Justice and Community Safety Statistics, Statistics Canada.
- In 2018-19, 12.0% of all guilty cases resulted in the youth being sentenced to custody.
- In 2018-19, 59.0% of youth found guilty were sentenced to probation.
Cases can have more than one sentence. Therefore, sanctions are not mutually exclusive and will not add to 100%. For all sentencing tables, data are for cases with a guilty finding only. Sentencing information is not available for a small proportion of guilty cases (i.e., approximately 3%, overall). For all sentencing tables, data are for cases with a guilty finding only and for which sentencing information is reported.
The concept of a case has changed to more closely reflect court processing. Statistics from the Integrated Criminal Court Survey used in this report should not be compared to editions of the Corrections and Conditional Release Statistical Overview prior to 2007.
The figure includes data from the most recent year available at the time of publication.
Type of Sentence |
Sex |
Year |
||||
|---|---|---|---|---|---|---|
2014-15 |
2015-16 |
2016-17 |
2017-18 |
2018-19 |
||
% |
% |
% |
% |
% |
||
Probation |
Female |
53.6 |
54.1 |
54.7 |
51.7 |
53.3 |
Male |
59.3 |
58.8 |
59.9 |
60.5 |
60.5 |
|
Total |
57.2 |
56.3 |
57.3 |
58.5 |
59.0 |
|
Custody |
Female |
11.7 |
11.9 |
7.5 |
8.9 |
6.3 |
Male |
15.9 |
16.5 |
13.7 |
13.5 |
13.3 |
|
Total |
14.9 |
15.5 |
13.0 |
12.8 |
12.0 |
|
Community Service Order |
Female |
23.5 |
20.9 |
21.9 |
21.6 |
21.4 |
Male |
27.1 |
24.4 |
24.9 |
24.2 |
22.7 |
|
Total |
24.4 |
22.4 |
22.9 |
23.0 |
21.7 |
|
Fine |
Female |
2.8 |
2.9 |
2.4 |
2.0 |
2.4 |
Male |
2.9 |
2.9 |
2.5 |
2.3 |
2.1 |
|
Total |
2.8 |
2.9 |
2.5 |
2.2 |
2.2 |
|
Deferred Custody and Supervision |
Female |
3.3 |
3.9 |
3.3 |
3.4 |
3.1 |
Male |
4.4 |
4.7 |
4.8 |
5.3 |
4.9 |
|
Total |
4.1 |
4.4 |
4.5 |
4.7 |
4.4 |
|
Other SentenceTable A11 footnote * |
Female |
35.5 |
37.7 |
38.5 |
41.7 |
41.8 |
Male |
38.4 |
39.8 |
40.6 |
42.4 |
43.3 |
|
Total |
35.2 |
36.7 |
37.3 |
41.1 |
42.3 |
|
Table A11 Notes:
Source: Table 35-10-0041-01, Integrated Criminal Court Survey, Canadian Centre for Justice and Community Safety Statistics, Statistics Canada.
Cases can have more than one sentence. Therefore, sanctions are not mutually exclusive and will not add to 100%. For all sentencing tables, data are for cases with a guilty finding only. Sentencing information is not available for a small proportion of guilty cases (i.e., approximately 3%, overall). For all sentencing tables, data are for cases with a guilty finding only and for which sentencing information is reported.
The concept of a case has changed to more closely reflect court processing. Statistics from the Integrated Criminal Court Survey used in this report should not be compared to editions of the Corrections and Conditional Release Statistical Overview prior to 2007.
The table includes data from the most recent year available at the time of publication.
When considering the most serious sentence in a case, probation was the most common sentence for youth
Figure A12: Percentage of youth court sentence for most serious sentenceFigure A12 footnote *
Image description
| Type of Sentence | Year | ||||
|---|---|---|---|---|---|
| 2014-15 Percent | 2015-16 Percent | 2016-17 Percent | 2017-18 Percent | 2018-19 Percent | |
| Probation | 48.4 | 47.0 | 49.6 | 50.3 | 50.9 |
| Custody | 14.9 | 15.5 | 13.0 | 12.7 | 12.0 |
| Community Service Order | 8.6 | 8.5 | 8.7 | 8.3 | 7.5 |
| Deferred Custody and Supervision | 3.9 | 4.3 | 4.5 | 4.7 | 4.3 |
| Fine | 2.4 | 2.5 | 2.1 | 2.0 | 1.8 |
| Other sentenceFigure A12 footnote ** | 16.9 | 17.5 | 17.2 | 17.9 | 19.2 |
Figure A12 Notes:
Source: Table 35-10-0042-01, Integrated Criminal Court Survey, Canadian Centre for Justice and Community Safety Statistics, Statistics Canada.
- In 2018-19, 50.9% of youth found guilty were given probation as the most serious sentence. This rate has remained relatively stable since the implementation of the Youth Criminal Justice Act in April 2003.
- Of the Youth Criminal Justice Act sentences, deferred custody and supervision orders were handed down least frequently. In 2018-19, 4.3% of all guilty cases received such an order as the most serious sentence.
The concept of a case has changed to more closely reflect court processing. Statistics from the Integrated Criminal Court Survey used in this report should not be compared to editions of the Corrections and Conditional Release Statistical Overview prior to 2007.
Figure A12 in the 2020 CCRSO aligns with data provided in A11 in CCRSO reports prior to 2020.
The figure includes data from the most recent year available at the time of publication.
Type of Sentence |
Sex |
Year |
||||
|---|---|---|---|---|---|---|
2014-15 |
2015-16 |
2016-17 |
2017-18 |
2018-19 |
||
% |
% |
% |
% |
% |
||
Probation |
Female |
47.6 |
47.0 |
50.1 |
47.8 |
49.2 |
Male |
48.6 |
47.5 |
50.4 |
50.9 |
51.1 |
|
Total |
48.4 |
47.0 |
49.6 |
50.3 |
50.9 |
|
Custody |
Female |
11.7 |
11.9 |
7.5 |
8.9 |
6.3 |
Male |
15.9 |
16.5 |
13.6 |
13.5 |
13.3 |
|
Total |
14.9 |
15.5 |
13.0 |
12.7 |
12.0 |
|
Community Service Order |
Female |
9.4 |
8.5 |
9.2 |
9.2 |
8.4 |
Male |
8.4 |
7.9 |
8.1 |
7.3 |
6.4 |
|
Total |
8.6 |
8.5 |
8.7 |
8.3 |
7.5 |
|
Deferred Custody and Supervision |
Female |
3.1 |
3.7 |
3.3 |
3.4 |
3.1 |
Male |
4.2 |
4.5 |
4.8 |
5.2 |
4.8 |
|
Total |
3.9 |
4.3 |
4.5 |
4.7 |
4.3 |
|
Fine |
Female |
2.5 |
2.6 |
2.2 |
2.0 |
2.1 |
Male |
2.4 |
2.5 |
2.1 |
2.0 |
1.7 |
|
Total |
2.4 |
2.5 |
2.1 |
2.0 |
1.8 |
|
Other SentenceTable A12 footnote ** |
Female |
18.5 |
19.6 |
20.8 |
22.8 |
24.4 |
Male |
16.1 |
16.5 |
16.1 |
17.3 |
18.7 |
|
Total |
16.9 |
17.5 |
17.2 |
17.9 |
19.2 |
|
Table A12 Notes:
Source: Table 35-10-0042-01, Integrated Criminal Court Survey, Canadian Centre for Justice and Community Safety Statistics, Statistics Canada.
The concept of a case has changed to more closely reflect court processing. Statistics from the Integrated Criminal Court Survey used in this report should not be compared to editions of the Corrections and Conditional Release Statistical Overview prior to 2007.
Table A12 in the 2020 CCRSO aligns with data provided in A11 in CCRSO reports prior to 2020.
The table includes data from the most recent year available at the time of publication.
Section B. Corrections Administration
Correction costs federally and provincially/territorially
Figure B1: Costs of federal and provincial/territorial corrections
Image description
Year |
Federal Operating Costs |
Federal Adjusted CostsFigure B1 footnote * |
Provincial/Territorial Operating Costs |
Provincial/Territorial Adjusted CostsFigure B1 footnote * |
|---|---|---|---|---|
2009-10 |
2,317,117 |
2,025,452 |
1,878,204 |
1,641,787 |
2010-11 |
2,429,965 |
2,085,807 |
1,917,557 |
1,645,972 |
2011-12 |
2,715,886 |
2,265,126 |
2,021,627 |
1,686,094 |
2012-13 |
2,693,043 |
2,193,032 |
2,057,391 |
1,675,400 |
2013-14 |
2,805,418 |
2,240,749 |
2,159,641 |
1,724,953 |
2014-15 |
2,424,744 |
1,915,280 |
2,212,026 |
1,747,256 |
2015-16 |
2,235,401 |
1,740,967 |
2,369,076 |
1,845,075 |
2016-17 |
2,255,848 |
1,729,945 |
2,445,894 |
1,875,686 |
2017-18 |
2,490,188 |
1,866,708 |
2,559,582 |
1,918,727 |
2018-19 |
2,405,581 |
1,803,284 |
2,692,706 |
2,018,520 |
Figure B1 Notes:
Source: Table 35-10-0013-01, Adult Correctional Services, Canadian Centre for Justice and Community Safety Statistics, Statistics Canada.
- Costs of federal corrections were $2.41 billion in 2018-19. This was a 3.5% decrease compared to the prior year and is 3.8% higher than 2009-2010.
- Costs of provincial/territorial corrections were about $2.7 billion in 2018-19. This represented a 5.2% increase from 2017-18 and a 43.4% increase since 2009-2010.
Federal expenditures on corrections include spending by Correctional Service Canada (CSC), the Parole Board of Canada (PBC), and the Office of the Correctional Investigator (OCI). Total expenditures represent gross expenditures and exclude revenues. Operating costs include Employee Benefit Plan expenditures. CSC expenditures exclude CORCAN (a Special Operating Agency that conducts industrial operations within penitentiaries).
The table includes data from the most recent year available at the time of publication.
Year |
Current Dollars |
Constant 2002 Dollars |
|||||||
|---|---|---|---|---|---|---|---|---|---|
Operating |
Capital |
Total |
Per capitaTable B1 footnote * |
Operating |
Capital |
Total |
Per capitaTable B1 footnote * |
||
$'000 |
$ |
$'000 |
$ |
||||||
2014-15 |
CSC |
2,373,604 |
200,606 |
2,574,210 |
72.6 |
1,874,885 |
158,457 |
2,033,341 |
57.4 |
PBC |
50,122 |
NA |
50,100 |
1.4 |
39,573 |
NA |
39,573 |
1.1 |
|
OCI |
4,659 |
NA |
4,659 |
0.1 |
3,680 |
NA |
3,680 |
0.1 |
|
Total |
2,424,744 |
200,606 |
2,628,969 |
74.2 |
1,918,138 |
158,457 |
2,076,595 |
59.8 |
|
2015-16 |
CSC |
2,189,101 |
168,684 |
2,357,785 |
66.0 |
1,704,907 |
131,374 |
1,836,281 |
51.4 |
PBC |
46,300 |
NA |
46,300 |
1.3 |
36,059 |
NA |
36,059 |
1.0 |
|
OCI |
4,656 |
NA |
4,656 |
0.1 |
3,626 |
NA |
3,626 |
0.1 |
|
Total |
2,235,401 |
168,684 |
2,408,741 |
67.5 |
1,744,593 |
131,374 |
1,875,967 |
54.0 |
|
2016-17 |
CSC |
2,209,048 |
153,757 |
2,362,805 |
65.4 |
1,694,055 |
117,912 |
1,811,966 |
50.2 |
PBC |
46,800 |
NA |
46,800 |
1.3 |
35,890 |
NA |
35,890 |
1.0 |
|
OCI |
4,693 |
NA |
4,693 |
0.1 |
3,599 |
NA |
3,599 |
0.1 |
|
Total |
2,255,848 |
153,757 |
2,414,298 |
66.9 |
1,733,544 |
117,912 |
1,851,455 |
53.3 |
|
2017-18 |
CSC |
2,442,488 |
185,624 |
2,628,112 |
71.9 |
1,830,951 |
139,148 |
1,970,099 |
53.9 |
PBC |
47,700 |
NA |
47,700 |
1.3 |
35,757 |
NA |
35,757 |
1.0 |
|
OCI |
4,616 |
NA |
4,616 |
0.1 |
3,472 |
NA |
3,472 |
0.1 |
|
Total |
2,490,188 |
185,624 |
2,680,428 |
73.4 |
1,870,179 |
139,148 |
2,009,328 |
57.9 |
|
2018-19 |
CSC |
2,352,556 |
227,793 |
2,580,349 |
69.6 |
1,763,535 |
170,759 |
1,934,295 |
52.2 |
PBC |
49,800 |
NA |
49,800 |
1.3 |
37,331 |
NA |
37,331 |
1.1 |
|
OCI |
4,631 |
NA |
4,631 |
0.1 |
3,472 |
NA |
3,472 |
0.1 |
|
Total |
2,405,581 |
227,793 |
2,634,780 |
71.1 |
1,804,338 |
170,759 |
1,975,097 |
56.9 |
|
Notes:
Sources: Table 35-10-0013-01, Adult Correctional Services, Canadian Centre for Justice and Community Safety Statistics, Statistics Canada; Correctional Service Canada; Office of the Correctional Investigator; Parole Board of Canada.
Due to rounding, constant dollar amounts may not add up to "Total".
Constant dollars represent dollar amounts calculated on a one-year base (2002) that adjusts for inflation allowing the yearly amounts to be directly comparable. Changes in the Consumer Price Index (CPI) were used to calculate constant dollars. The CPI rate for the 2020 CCRSO was based on an average of the monthly CPI for the fiscal year rather than calendar year. This limits comparability to CCRSO reports prior to 2020.
Costs are rounded to the thousands. Therefore, the per capita rate needs to be multiplied by 1000.
NA is the short form for not applicable.
The table includes data from the most recent year available at the time of publication.
CSC employees were concentrated in custody centres
Figure B2: CSC employees at the end of fiscal year (2019-20)

Image description
| Percent | Employees | |
|---|---|---|
| Community Supervision | 8.6 |
1,486 |
| Custody Centres | 76.7 |
13,215 |
| Headquarters and Central Services | 14.7 |
2,537 |
Figure B2 Notes:
Source: Correctional Service of Canada.
- The Correctional Service of Canada (CSC) had a total staff of 17,238.
- Approximately 77% of CSC staff worked in institutions.
- Staff employed in community supervision accounted for 9% of the total.
Due to changes in policy, Correctional Officers no longer occupy positions in the community.
CSC has changed its definition of employee. Previously the total number of employees included casual employees, employees on leave without pay and suspended employees. These categories have been removed from the total as of 2005-06. These numbers represent indeterminate and term equal to, or more than 3 months of substantive employment; and employee status of active and paid leave current up to March 31, 2020.
Due to rounding, the percentage may not add to 100.
Service Area |
March 31, 2009 |
March 31, 2020 |
||
|---|---|---|---|---|
# |
% |
# |
% |
|
Headquarters and Central Services |
2,609 |
15.8 |
2,537 |
14.7 |
Administration |
2,198 |
13.3 |
2,186 |
12.7 |
Health Care |
111 |
0.7 |
77 |
0.4 |
Program Staff |
108 |
0.7 |
57 |
0.3 |
Correctional Officers |
44 |
0.3 |
43 |
0.2 |
Instructors/Supervisors |
17 |
0.1 |
11 |
0.1 |
Parole Officers/Parole SupervisorsTable B2 footnote * |
2 |
0 |
1 |
0.0 |
OtherTable B2 footnote ** |
129 |
0.8 |
162 |
0.9 |
Custody Centres |
12,590 |
76.1 |
13,215 |
76.7 |
Correctional Officers |
6,382 |
38.6 |
7,162 |
41.5 |
Administration |
2,126 |
12.9 |
1,821 |
10.6 |
Health Care |
988 |
6 |
965 |
5.6 |
Program Staff |
839 |
5.1 |
987 |
5.7 |
Parole Officers/Parole SupervisorsTable B2 footnote * |
727 |
4.4 |
586 |
3.4 |
Instructors/Supervisors |
444 |
2.7 |
421 |
2.4 |
OtherTable B2 footnote ** |
1,084 |
6.6 |
1,273 |
7.4 |
Community Supervision |
1,337 |
8.1 |
1,486 |
8.6 |
Parole Officers/Parole SupervisorsTable B2 footnote * |
714 |
4.3 |
775 |
4.5 |
Administration |
336 |
2 |
377 |
2.2 |
Program Staff |
198 |
1.2 |
247 |
1.4 |
Health Care |
69 |
0.4 |
84 |
0.5 |
Correctional Officers |
18 |
0.1 |
0 |
0.0 |
OtherTable B2 footnote ** |
2 |
0 |
3 |
0.0 |
Total |
16,536 |
100 |
17,238 |
100 |
Table B2 Notes:
Source: Correctional Service of Canada.
Due to changes in policy, Correctional Officers no longer occupy positions in the community.
CSC has changed its definition of employee. Previously the total number of employees included casual employees, employees on leave without pay and suspended employees. These categories have been removed from the total as of 2005-06. These numbers represent indeterminate and term equal to, or more than 3 months of substantive employment; and employee status of active and paid leave current up to March 31, 2020.
Due to rounding, the percentage may not add to 100.
The cost of keeping an inmate incarcerated has remained relatively steady in the past 5 years
Figure B3: Federal average daily inmate cost (current $)
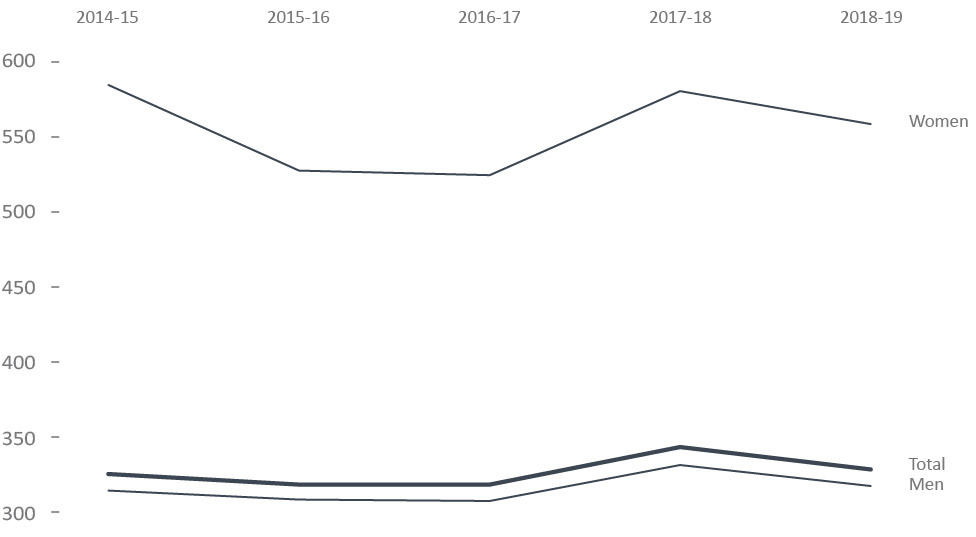
Image description
| Year | Women | Total | Men |
|---|---|---|---|
| 2014-15 | 585 |
326 |
315 |
| 2015-16 | 528 |
319 |
309 |
| 2016-17 | 525 |
319 |
308 |
| 2017-18 | 581 |
344 |
332 |
| 2018-19 | 559 |
329 |
318 |
Figure B3 Notes:
Source: Correctional Service of Canada.
- The federal average daily inmate cost increased from $326 in 2014-15 to $330 in 2018-19. In 2018-19, the annual average cost of keeping an inmate incarcerated was $120,589 per year, an increase from $119,152 per year in 2014-15. In 2018-19, the annual average cost of keeping a male incarcerated was $116,294 per year, whereas the annual average cost for incarcerating a female was $204,474.
- The cost associated with maintaining an offender in the community was 73.4% less than to maintain an offender in custody ($32,037 per year versus $120,589 per year).
In 2018-19, the methodology of presentation for certain indirect costs was changed to better reflect the direct costs of maintaining an offender.
The average daily inmate cost includes those costs associated with the operation of the institutions such as salaries and employee benefit plan contributions, but excludes capital expenditures and expenditures related to CORCAN (a Special Operating Agency that conducts industrial operations within federal institutions).
Total incarcerated and community includes additional NHQ & RHQ administrative costs which are not part of the Institutional and/or Community calculations. Offenders in the Community includes: Offenders on conditional release, statutory release or with Long-Term Supervision Order, under CSC supervision.
Figures may not add due to rounding.
The figure includes data from the most recent year available at the time of publication.
Categories |
2014-15 |
2015-16 |
2016-17 |
2017-18 |
2018-19 |
|---|---|---|---|---|---|
Maximum Security (males only) |
160,094 |
155,848 |
158,113 |
169,367 |
163,642 |
Medium Security (males only) |
105,750 |
106,868 |
105,349 |
115,263 |
109,660 |
Minimum Security (males only) |
86,613 |
81,528 |
83,450 |
86,603 |
83,900 |
Women's Facilities |
213,800 |
192,742 |
191,843 |
212,005 |
204,474 |
Exchange of Services AgreementsTable B3 footnote * (both) |
111,839 |
114,974 |
122,998 |
114,188 |
122,269 |
Incarcerated Average |
119,152 |
116,364 |
116,473 |
125,466 |
120,589 |
Offenders in the Community |
33,067 |
31,052 |
30,639 |
32,327 |
32,037 |
Total Incarcerated and CommunityTable B3 footnote ** |
99,982 |
94,545 |
95,654 |
100,425 |
99,185 |
Table B3 Notes:
Source: Correctional Service of Canada.
In 2018-19, the methodology of presentation for certain indirect costs was changed to better reflect the direct costs of maintaining an offender.
The average daily inmate cost includes those costs associated with the operation of the institutions such as salaries and employee benefit plan contributions, but excludes capital expenditures and expenditures related to CORCAN (a Special Operating Agency that conducts industrial operations within federal institutions).
Figures may not add to total due to rounding.
The table includes data from the most recent year available at the time of publication.
The number of Parole Board of Canada employees
Figure B4 Full-time equivalentsFigure B4 footnote * – 10-year trend
Image description
Year |
Full-Time Equivalents |
|---|---|
2010-11 |
438 |
2011-12 |
461 |
2012-13 |
468 |
2013-14 |
505 |
2014-15 |
495 |
2015-16 |
475 |
2016-17 |
480 |
2017-18 |
471 |
2018-19 |
481 |
2019-20 |
499 |
Notes:
Source: Parole Board of Canada.
- In 2019-20, the full-time equivalentsFigure B4 footnote * used by the Parole Board of Canada increased by 3.7% to 499 compared to 2018-19.
2014-15 |
2015-16 |
2016-17 |
2017-18 |
2018-19 |
2019-20 |
|
|---|---|---|---|---|---|---|
Program Activity |
||||||
Conditional Release Decisions |
325 |
322 |
321 |
317 |
317 |
320 |
Conditional Release Openness and Accountability |
54 |
42 |
44 |
42 |
43 |
45 |
Record Suspension and Clemency Recommendations |
69 |
52 |
59 |
48 |
58 |
72 |
Internal Services |
47 |
59 |
56 |
64 |
63 |
62 |
Total |
495 |
475 |
480 |
471 |
481 |
499 |
Types of Employees |
||||||
Full-time Board Members |
42 |
41 |
39 |
38 |
41 |
40 |
Part-time Board Members |
18 |
18 |
17 |
20 |
19 |
20 |
Staff |
435 |
416 |
424 |
413 |
421 |
439 |
Total |
495 |
475 |
480 |
471 |
481 |
499 |
Table B4 Note:
Source: Parole Board of Canada.
The number of employees in the Office of the Correctional Investigator
Figure B5: Full-time equivalents

Image description
| Year | Total |
|---|---|
| 2010-11 | 30 |
| 2011-12 | 32 |
| 2012-13 | 36 |
| 2013-14 | 36 |
| 2014-15 | 36 |
| 2015-16 | 36 |
| 2016-17 | 36 |
| 2017-18 | 36 |
| 2018-19 | 39 |
| 2019-20 | 40 |
Figure B5 Notes:
Source: Office of the Correctional Investigator.
- In 2019-20, the total number of full-time equivalents at the Office of the Correctional Investigator increased by 1 (1 in Senior Management and Investigative Services) from 39 (2018-19) to 40 employees total.
The Office of the Correctional Investigator (OCI) may commence an investigation on receipt of a complaint by or on behalf of an offender or on its own initiative. Complaints are made by telephone, letter and during interviews with the OCI's investigative staff at federal correctional facilities. The dispositions in response to complaints involve a combination of internal responses (where the information or assistance sought by the offender can generally be provided by the OCI's investigative staff) and investigations (where, further to a review/analysis of law, policies and documentation, OCI investigative staff make an inquiry or several interventions with Correctional Service Canada and submit recommendations to address the complaint). Investigations vary considerably in terms of scope, complexity, duration and resources required.
Types of Employees |
2015-16 |
2016-17 |
2017-18 |
2018-19 |
2019-20 |
|---|---|---|---|---|---|
Senior Management and Investigative Services |
26 |
26 |
26 |
27 |
28 |
Legal Counsel, Policy and Research |
5 |
5 |
5 |
5 |
6 |
Internal Services |
4 |
4 |
4 |
6 |
5 |
Correctional Investigator |
1 |
1 |
1 |
1 |
1 |
Total |
36 |
36 |
36 |
39 |
40 |
Table B5 Notes:
Source: Office of the Correctional Investigator.
The Office of the Correctional Investigator (OCI) may commence an investigation on receipt of a complaint by or on behalf of an offender or on its own initiative. Complaints are made by telephone, letter and during interviews with the OCI's investigative staff at federal correctional facilities. The dispositions in response to complaints involve a combination of internal responses (where the information or assistance sought by the offender can generally be provided by the OCI's investigative staff) and investigations (where, further to a review/analysis of law, policies and documentation, OCI investigative staff make an inquiry or several interventions with Correctional Service Canada and submit recommendations to address the complaint). Investigations vary considerably in terms of scope, complexity, duration and resources required.
Health care was the most common area of offender complaint received by the Office of the Correctional Investigator
Figure B6: Ten most common offender complaints in 2019-20

Image description
Category of Complaint |
2019-20 |
|---|---|
Health Care |
688 |
Staff |
560 |
Conditions of Confinement |
502 |
Cell Effects |
388 |
Transfer |
368 |
Request for Information |
245 |
Safety/Security of Offender(s) |
230 |
Visits |
209 |
Telephone |
185 |
Security Classification |
136 |
Figure B6 Notes:
Source: Office of the Correctional Investigator.
- There were 5,566 complaints/enquiries received at the Office of the Correctional Investigator (OCI) in 2019-20.
- Health care (12.4%), staff (10.1%), conditions of confinement (9.0%), and cell effects (7.0%), accounted for 38.4% of all complaints.
- Health care remained the most common offender complaint in the last 5 years.
The Office of the Correctional Investigator (OCI) may commence an investigation on receipt of a complaint by or on behalf of an offender or on its own initiative. Complaints are made by telephone, letter and during interviews with the OCI's investigative staff at federal correctional facilities. The dispositions in response to complaints involve a combination of internal responses (where the information or assistance sought by the offender can generally be provided by the OCI's investigative staff) and investigations (where, further to a review/analysis of law, policies and documentation, OCI investigative staff make an inquiry or several interventions with Correctional Service Canada and submit recommendations to address the complaint). Investigations vary considerably in terms of scope, complexity, duration and resources required.
Category of ComplaintTable B6 footnote * |
2015-16 |
2016-17 |
2017-18 |
2018-19 |
2019-20 |
|---|---|---|---|---|---|
Health Care |
917 |
913 |
858 |
693 |
688 |
Conditions of Confinement |
821 |
783 |
783 |
608 |
502 |
Staff |
429 |
408 |
530 |
501 |
560 |
Cell Effects |
426 |
497 |
412 |
407 |
388 |
Transfer |
370 |
439 |
353 |
334 |
368 |
Administrative Segregation |
272 |
269 |
223 |
187 |
89 |
Visits |
290 |
285 |
214 |
192 |
209 |
Telephone |
224 |
187 |
169 |
183 |
185 |
Outside OCI Jurisdiction |
245 |
259 |
193 |
128 |
133 |
Request for Information |
152 |
213 |
126 |
159 |
245 |
Safety/Security of Offender(s) |
197 |
208 |
127 |
177 |
230 |
Grievance |
188 |
173 |
177 |
127 |
129 |
Financial Matters |
199 |
170 |
107 |
111 |
119 |
Programs |
161 |
202 |
138 |
112 |
112 |
Correspondence |
165 |
167 |
149 |
84 |
130 |
Security Classification |
143 |
135 |
129 |
102 |
136 |
Case Preparation |
102 |
115 |
55 |
73 |
96 |
Mental Health |
133 |
122 |
76 |
59 |
100 |
Temporary Absence |
100 |
93 |
74 |
65 |
52 |
Release Procedures |
95 |
104 |
83 |
55 |
83 |
Total of All CategoriesTable B6 footnote ** |
6,651 |
6,844 |
5,865 |
5,113 |
5,566 |
Table B6 Notes:
Source: Office of the Correctional Investigator.
The Office of the Correctional Investigator (OCI) may commence an investigation on receipt of a complaint by or on behalf of an offender or on its own initiative. Complaints are made by telephone, letter and during interviews with the OCI's investigative staff at federal correctional facilities. The dispositions in response to complaints involve a combination of internal responses (where the information or assistance sought by the offender can generally be provided by the OCI's investigative staff) and investigations (where, further to a review/analysis of law, policies and documentation, OCI investigative staff make an inquiry or several interventions with Correctional Service Canada and submit recommendations to address the complaint). Investigations vary considerably in terms of scope, complexity, duration and resources required.
Due to ongoing efforts at the OCI (Office of the Correctional Investigator) to streamline our administrative database and ensure accuracy in reporting, the numbers in this table will not always match those of past Corrections and Conditional Release Statistical Overviews, or OCI Annual Reports.
Section C. Offender Population
Offenders under the responsibility of CSC
Figure C1: Total offender population (2019-20)Figure C1 footnote *

Image description
| Status | Percent |
|---|---|
In-Custody Population (CSC Facility)
|
59.4 |
In Community under Supervision
|
40.6 |
Figure C1 Notes:
Source: Correctional Service of Canada.
Offenders under the responsibility of CSC
Definitions
Total Offender Population includes all active offenders, who are incarcerated in a CSC facility, offenders on temporary absence from a CSC facility, offenders who are temporarily detained, offenders who are actively supervised, and offenders who are unlawfully at large for less than 90 days.
In addition to the total offender population, there are excluded groups such as:
Federal jurisdiction offenders incarcerated in a Community Correctional Centre or in a non-CSC facility.
Federal jurisdiction offenders deported /extradited including offenders for whom a deportation order has been enforced by Canada Border Services Agency.
Federal offenders on bail which includes offenders on a judicial interim release; they have appealed their conviction or sentence and have been released to await the results of a new trial.
Escaped includes offenders who have absconded from either a correctional facility or while on a temporary absence and whose whereabouts are unknown.
Unlawfully at Large for 90 days or more. This includes offenders who have been released to the community on day parole, full parole, statutory release or a long term supervision order for whom a warrant for suspension has been issued at least 90 days ago, but has not yet been executed.
CSC Facilities include all federal institutions and federally funded Healing Lodges.
Total Offender Population
In custody includes all active offenders incarcerated in a CSC facility, offenders on temporary absence from a CSC facility, offenders who are temporarily detained in a CSC facility and offenders on remand in a CSC facility.
In Community Under Supervision includes all active offenders on day parole, full parole, statutory release, in the community supervised on a long-term supervision order, offenders who are temporarily detained in a non-CSC facility, offenders who are unlawfully at large for less than 90 days, offenders on remand in a non-CSC facility, and offenders supervised and subject to an immigration hold by Canada Border Services Agency.
Actively Supervised includes all active offenders on day parole, full parole or statutory release, as well as those who are in the community on long-term supervision orders.
Temporarily Detained includes offenders who are physically held in a CSC facility or a non-CSC facility after being suspended for a breach of a parole condition or to prevent a breach of parole conditions.
Status |
Offenders under the responsibility of CSC (2019-20) |
|
|---|---|---|
# |
% |
|
In-Custody Population (CSC Facility) |
13,720 |
59.4 |
Incarcerated in CSC Facility |
13,056 |
56.5 |
Temporarily Detained in CSC Facility |
664 |
2.9 |
In Community under Supervision |
9,382 |
40.6 |
Temporarily Detained in Non-CSC Facility |
216 |
0.9 |
Actively Supervised |
9,166 |
39.7 |
Day Parole |
1,509 |
6.5 |
Full Parole |
4,540 |
19.7 |
Statutory Release |
2,647 |
11.5 |
Long-Term Supervision Order |
470 |
2.0 |
Total |
23,102 |
100 |
Notes:
Source: Correctional Service of Canada.
The number of in-custody offenders
Figure C2 (A): Number of in-custody offenders in a CSC facility at fiscal yearFigure C2 (A) footnote * end
Image description
Year |
Number of in-custody offenders in a CSC facility at fiscal year end |
|---|---|
2010-11 |
14,840 |
2011-12 |
15,131 |
2012-13 |
15,318 |
2013-14 |
15,342 |
2014-15 |
14,886 |
2015-16 |
14,712 |
2016-17 |
14,159 |
2017-18 |
14,092 |
2018-19 |
14,149 |
2019-20 |
13,720 |
Source: Correctional Service of Canada
Figure C2 (B): Number of in-custody offenders in a provincial/territorial facilityFigure C2 (B) footnote *

Image description
Year |
Number of in-custody offenders in a provincial/territorial facility |
|---|---|
2009-10 |
24,092 |
2010-11 |
24,435 |
2011-12 |
24,814 |
2012-13 |
25,185 |
2013-14 |
21,704 |
2014-15 |
24,455 |
2015-16 |
25,405 |
2016-17 |
25,448 |
2017-18 |
24,658 |
2018-19 |
23,783 |
Source: Table: 35-10-0154-01, Corrections Key Indicator Report for Adults and Youth, Canadian Centre for Justice and Community Safety Statistics, Statistics Canada.
Figure C2 (A) and (B) Notes:
- From 2009-10 to 2013-14, the in-custody population at a CSC facility increased consistently but started to decline in 2014-15. There was a 3.0% decrease in 2019-20 in comparison with 2018-19.
- The number of offenders in provincial/territorial custody decreased by 6.9% from 2015-16 to 2018-19.
The figure includes data from the most recent year available at the time of publication.
Year |
In Custody in a CSCTable C2 footnote 1 FacilityTable C2 footnote * |
Provincial/TerritorialTable C2 footnote 2 |
Total |
|||
|---|---|---|---|---|---|---|
Sentenced |
Remand |
Other/ Temporary Detention |
Total |
|||
2009-10 |
14,197 |
10,045 |
13,739 |
308 |
24,092 |
38,289 |
2010-11 |
14,840 |
10,922 |
13,086 |
427 |
24,435 |
39,275 |
2011-12 |
15,131 |
11,138 |
13,369 |
308 |
24,814 |
39,945 |
2012-13 |
15,318 |
11,138 |
13,739 |
308 |
25,185 |
40,503 |
2013-14 |
15,342 |
9,888 |
11,494 |
322 |
21,704 |
37,046 |
2014-15 |
14,886 |
10,364 |
13,650 |
441 |
24,455 |
39,341 |
2015-16 |
14,712 |
10,091 |
14,899 |
415 |
25,405 |
40,117 |
2016-17 |
14,159 |
9,710 |
15,417 |
321 |
25,448 |
39,607 |
2017-18 |
14,092 |
9,543 |
15,417 |
303 |
24,658 |
38,750 |
2018-19 |
14,149 |
8,708 |
14,778 |
297 |
23,783 |
37,932 |
2019-20 |
13,720 |
Not availableTable C2 footnote ** |
Not availableTable C2 footnote ** |
Not availableTable C2 footnote ** |
Not availableTable C2 footnote ** |
Not availableTable C2 footnote ** |
Table C2 Notes:
Sources:
The figures for provincial and territorial offenders reflect annual average counts.
The table includes data from the most recent year available at the time of publication.
The number of admissions to CSC facilities
Figure C3: Number of admissions to CSC facilities

Image description
|
Warrant of Committal |
Revocations |
OtherFigure C3 footnote * |
|---|---|---|---|
2010-11 |
5,333 |
2,651 |
120 |
2011-12 |
5,031 |
2,577 |
127 |
2012-13 |
5,043 |
2,893 |
133 |
2013-14 |
5,071 |
2,716 |
114 |
2014-15 |
4,817 |
2,503 |
76 |
2015-16 |
4,890 |
2,476 |
82 |
2016-17 |
4,907 |
2,146 |
98 |
2017-18 |
4,996 |
2,131 |
64 |
2018-19 |
5,019 |
2,255 |
72 |
2019-20 |
4,595 |
2,285 |
66 |
Figure C3 Notes:
Source: Correctional Service Canada.
- After peaking at 8,104 in 2010-11, the number of admissions has decreased by 14.3% to 6,946 in 2019-20.
- The number of warrant of committal admissions has fluctuated over the past decade but has declined by 13.8% compared to the highest point which occurred in fiscal year 2010-11.The number of females admitted to CSC facilities under warrants of committal decreased 9.8% from 388 in 2015-16 to 350 in 2019-20.
Warrant of committal is a new admission to federal jurisdiction from the courts.
Revocation is when an offender is admitted to federal custody after conditional release and before reaching warrant expiry.
These numbers refer to the total number of admissions to a federal institution or Healing Lodge during each fiscal year and may be greater than the actual number of offenders admitted, since an individual offender may be admitted more than once in a given year. A fiscal year runs from April 1 to March 31 of the following year.
There is a lag in the data entry of admissions into CSC's Offender Management System. The admission figures for the most recent year are under-reported by 200-400 at the time of our year end extraction. More accurate figures will be available in the next year's publication. Please use caution when including the most recent year in any trend analysis.
2015-16 |
2016-17 |
2017-18 |
2018-19 |
2019-20 |
||||||
|---|---|---|---|---|---|---|---|---|---|---|
Females |
Males |
Females |
Males |
Females |
Males |
Females |
Males |
Females |
Males |
|
Warrant of Committal |
||||||||||
1st Federal Sentence |
348 |
3321 |
376 |
3,354 |
336 |
3,363 |
347 |
3,461 |
320 |
3,150 |
2nd or Subsequent Federal Sentence |
39 |
1,173 |
37 |
1,130 |
45 |
1,238 |
36 |
1,166 |
29 |
1,092 |
Provincial Sentence |
1 |
8 |
1 |
9 |
2 |
12 |
0 |
9 |
1 |
3 |
Subtotal |
388 |
4,502 |
414 |
4,493 |
383 |
4,613 |
383 |
4,636 |
350 |
4,245 |
Total |
4,890 |
4,907 |
4,996 |
5,019 |
4,595 |
|||||
Revocations |
149 |
2,327 |
132 |
2,014 |
149 |
1,982 |
145 |
2,110 |
176 |
2,109 |
Total |
2,476 |
2,146 |
2,131 |
2,255 |
2,285 |
|||||
OtherTable C3 footnote * |
4 |
78 |
4 |
95 |
9 |
55 |
5 |
67 |
4 |
62 |
Total |
82 |
99 |
64 |
72 |
66 |
|||||
Total Admissions |
541 |
6,907 |
550 |
6,602 |
541 |
6,650 |
533 |
6,813 |
530 |
6,416 |
7,448 |
7,152 |
7,191 |
7,346 |
6,946 |
||||||
Table C3 Notes:
Source: Correctional Service of Canada.
Warrant of committal is a new admission to federal jurisdiction from the courts.
Revocation is when an offender is admitted to federal custody after conditional release and before reaching warrant expiry.
These numbers refer to the total number of admissions to a federal institution or Healing Lodge during each fiscal year and may be greater than the actual number of offenders admitted, since an individual offender may be admitted more than once in a given year. A fiscal year runs from April 1 to March 31 of the following year.
There is a lag in the data entry of admissions into CSC's Offender Management System. The admission figures for the most recent year are under-reported by 200-400 at the time of our year end extraction. More accurate figures will be available in the next year's publication. Please use caution when including the most recent year in any trend analysis.
Over the last ten years, the number of females admitted from the courts to CSC facilities has fluctuated
Figure C4: Warrant of committal admissions for females
Image description
| Year | Number |
|---|---|
| 2010-11 | 328 |
| 2011-12 | 337 |
| 2012-13 | 265 |
| 2013-14 | 312 |
| 2014-15 | 343 |
| 2015-16 | 388 |
| 2016-17 | 414 |
| 2017-18 | 383 |
| 2018-19 | 383 |
| 2019-20 | 350 |
Figure C4 Notes:
Source: Correctional Service Canada.
- In the last ten years, the number of females admitted to CSC facilities on a warrant of committal increased 6.7% from 328 in 2010-11 to 350 in 2019-20. During the same time period, there was a decrease of 15.2% in the number of males admitted to federal jurisdiction on a warrant of committal from 5,005 in 2010-11 to 4,245 in 2019-20.
- Overall, females continued to represent a small proportion of the total number of warrant of committal admissions (i.e., 7.6% in 2019-20).
- At the end of fiscal year 2019-20, there were 685 females in custody within Correctional Service Canada facilities.
A warrant of committal is a new admission to federal jurisdiction from the courts.
There is a lag in the data entry of admissions into CSC’s Offender Management System. The admission figures for the most recent year are under-reported by 200-400 at the time of our year end extraction. More accurate figures will be available in the next year’s publication. Please use caution when including the most recent year in any trend analysis.
Year |
Females |
Males |
Total |
||
|---|---|---|---|---|---|
# |
% |
# |
% |
||
2010-11 |
328 |
6.2 |
5,005 |
93.8 |
5,333 |
2011-12 |
337 |
6.7 |
4,695 |
93.3 |
5,032 |
2012-13 |
265 |
5.3 |
4,779 |
94.7 |
5,044 |
2013-14 |
312 |
6.2 |
4,759 |
93.8 |
5,071 |
2014-15 |
343 |
7.1 |
4,474 |
92.9 |
4,817 |
2015-16 |
388 |
7.9 |
4,502 |
92.1 |
4,890 |
2016-17 |
414 |
8.4 |
4,493 |
91.6 |
4,907 |
2017-18 |
383 |
7.7 |
4,613 |
92.3 |
4,996 |
2018-19 |
383 |
7.6 |
4,636 |
92.4 |
5,019 |
2019-20 |
350 |
7.6 |
4,245 |
92.4 |
4,595 |
Table C4 Notes:
Source: Correctional Service of Canada.
A warrant of committal is a new admission to federal jurisdiction from the courts.
There is a lag in the data entry of admissions into CSC's Offender Management System. The admission figures for the most recent year are under-reported by 200-400 at the time of our year end extraction. More accurate figures will be available in the next year's publication. Please use caution when including the most recent year in any trend analysis.
About half of the total offender population in CSC facilities were serving a sentence of less than five years
Figure C5: Sentence length of total offender population (2019-20)Figure C5 footnote *
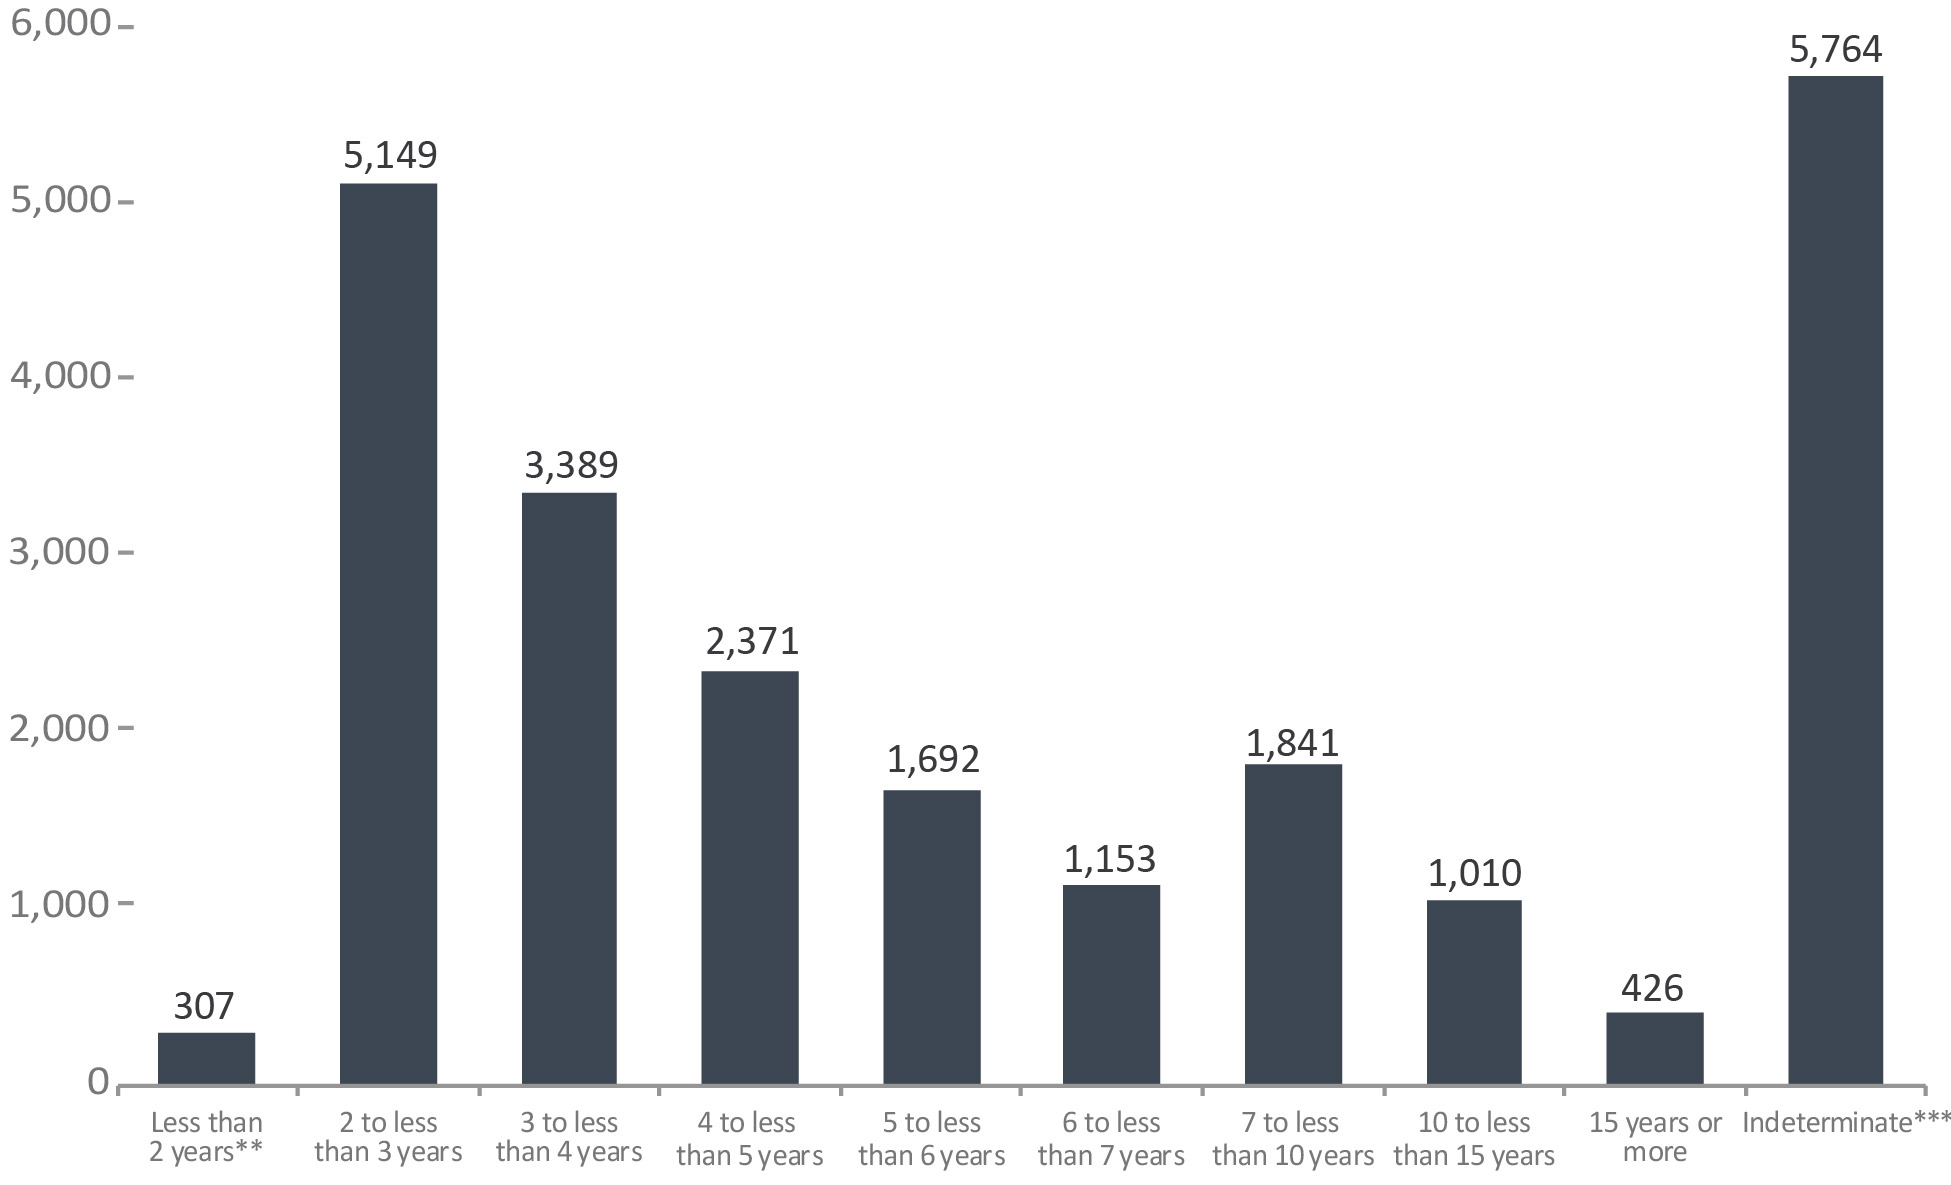
Image description
Sentence Length |
Number |
|---|---|
< than 2 yearsFigure C5 footnote ** |
307 |
2 years to < 3 years |
5,149 |
3 years to < 4 years |
3,389 |
4 years to < 5 years |
2,371 |
5 years to < 6 years |
1,692 |
6 years to < 7 years |
1,153 |
7 years to < 10 years |
1,841 |
10 years to < 15 years |
1,010 |
15 years or more |
426 |
IndeterminateFigure C5 footnote *** |
5,764 |
Figure C5 Notes:
Source: Correctional Service of Canada.
- In 2019-20, almost half (48.5%) of the total offender population was serving a sentence of less than 5 years with 22.3% serving a sentence between two years and less than three years.
- One quarter (25.0%) of the total offender population was serving an indeterminate sentence. The total number of offenders with indeterminate sentences has increased 6.9% since 2015-16 from 5,393 to 5,764 in 2019-20.
Sentence Length |
2015-16 |
2016-17 |
2017-18 |
2018-19 |
2019-20 |
|||||
|---|---|---|---|---|---|---|---|---|---|---|
# |
% |
# |
% |
# |
% |
# |
% |
# |
% |
|
< than 2 yearsTable C5 footnote ** |
306 |
1.3 |
307 |
1.3 |
348 |
1.5 |
307 |
1.3 |
307 |
1.3 |
2 years to < 3 years |
5,367 |
23.3 |
5,391 |
23.4 |
5,412 |
23.3 |
5,457 |
23.3 |
5,149 |
22.3 |
3 years to < 4 years |
3,503 |
15.2 |
3,377 |
14.7 |
3,378 |
14.5 |
3,436 |
14.6 |
3,389 |
14.7 |
4 years to < 5 years |
2,393 |
10.4 |
2,382 |
10.3 |
2,342 |
10.1 |
2,368 |
10.1 |
2,371 |
10.3 |
5 years to < 6 years |
1,692 |
7.3 |
1,691 |
7.3 |
1,674 |
7.2 |
1,711 |
7.3 |
1,692 |
7.3 |
6 years to < 7 years |
1,136 |
4.9 |
1,143 |
5.0 |
1,186 |
5.1 |
1,172 |
5.0 |
1,153 |
5.0 |
7 years to < 10 years |
1,805 |
7.8 |
1,810 |
7.9 |
1,811 |
7.8 |
1,857 |
7.9 |
1,841 |
8.0 |
10 years to < 15 years |
940 |
4.1 |
951 |
4.1 |
979 |
4.2 |
998 |
4.3 |
1,010 |
4.4 |
15 years or more |
522 |
2.3 |
501 |
2.2 |
474 |
2.0 |
445 |
1.9 |
426 |
1.8 |
IndeterminateTable C5 footnote *** |
5,393 |
23.4 |
5,492 |
23.8 |
5,619 |
24.2 |
5,713 |
24.3 |
5,764 |
25.0 |
Total |
23,057 |
100 |
23,045 |
100 |
23,223 |
100 |
23,464 |
100 |
23,102 |
100 |
Notes:
Source: Correctional Service of Canada.
Admission of older offenders to CSC facilities has increased
Figure C6: Percentage of warrant of committal admissions by age (2019-20)

Image description
Age at Admission |
2010-11 Percent |
2019-20 Percent |
|---|---|---|
18 and 19 |
3.4 |
1.5 |
20 to 24 |
18 |
13.9 |
25 to 29 |
19.2 |
18.6 |
30 to 34 |
15.2 |
17.5 |
35 to 39 |
12.3 |
15.1 |
40 to 44 |
11 |
9.7 |
45 to 49 |
8.9 |
7 |
50 to 59 |
9 |
11 |
60 to 69 |
2.3 |
4 |
70 and over |
0.7 |
1.8 |
Figure C6 Notes:
Source: Correctional Service of Canada.
- In 2019-20 32.5% of offenders admitted on a warrant of committal to CSC facilities were between the ages of 20 and 29, and 32.5% were between 30 and 39 years of age.
- The distribution of age upon admission was similar for both male and female offenders.
- The median age of the population upon admission in 2019-20 was 34, compared to a median age of 33 in 2010-11.
- The number of offenders between the ages of 40 and 49 at admission decreased from 1,060 in 2010-11 to 767 in 2019-20, representing a 27.6% decrease.
- The number of offenders between the ages of 50 and 59 at admission increased from 481 in 2010-11 to 505 in 2019-20 representing a 5.0% increase.
A warrant of committal is a new admission to federal jurisdiction from the courts.
Due to rounding, percentages may not add to 100 percent.
There is a lag in the data entry of admissions into CSC's Offender Management System. The admission figures for the most recent year are under-reported by 200-400 at the time of our year end extraction. More accurate figures will be available in the next year's publication. Please use caution when including the most recent year in any trend analysis.
Age at Admission |
2010-11 |
2019-20 |
||||||||||
|---|---|---|---|---|---|---|---|---|---|---|---|---|
Females |
Males |
Total |
Females |
Males |
Total |
|||||||
# |
% |
# |
% |
# |
% |
# |
% |
# |
% |
# |
% |
|
18 and 19 |
12 |
3.7 |
167 |
3.3 |
179 |
3.4 |
4 |
1.1 |
65 |
1.5 |
69 |
1.5 |
20 to 24 |
50 |
15.2 |
912 |
18.2 |
962 |
18.0 |
51 |
14.6 |
587 |
13.8 |
638 |
13.9 |
25 to 29 |
67 |
20.4 |
959 |
19.2 |
1,026 |
19.2 |
75 |
21.4 |
781 |
18.4 |
856 |
18.6 |
30 to 34 |
57 |
17.4 |
752 |
15.0 |
809 |
15.2 |
60 |
17.1 |
743 |
17.5 |
803 |
17.5 |
35 to 39 |
43 |
13.1 |
613 |
12.2 |
656 |
12.3 |
57 |
16.3 |
635 |
15.0 |
692 |
15.1 |
40 to 44 |
39 |
11.9 |
545 |
10.9 |
584 |
11.0 |
31 |
8.9 |
416 |
9.8 |
447 |
9.7 |
45 to 49 |
30 |
9.1 |
446 |
8.9 |
476 |
8.9 |
24 |
6.9 |
296 |
7.0 |
320 |
7.0 |
50 to 59 |
26 |
7.9 |
455 |
9.1 |
481 |
9.0 |
36 |
10.3 |
469 |
11.0 |
505 |
11.0 |
60 to 69 |
2 |
0.6 |
122 |
2.4 |
124 |
2.3 |
11 |
3.1 |
173 |
4.1 |
184 |
4.0 |
70 and over |
2 |
0.6 |
34 |
0.7 |
36 |
0.7 |
1 |
0.3 |
80 |
1.9 |
81 |
1.8 |
Total |
328 |
5,005 |
5,333 |
350 |
4,245 |
4,595 |
||||||
Table C6 Notes:
Source: Correctional Service of Canada.
A warrant of committal is a new admission to federal jurisdiction from the courts.
Due to rounding, percentages may not add to 100 percent.
There is a lag in the data entry of admissions into CSC's Offender Management System. The admission figures for the most recent year are under-reported by 200-400 at the time of our year end extraction. More accurate figures will be available in the next year's publication. Please use caution when including the most recent year in any trend analysis.
The average age at admission to CSC facilities was lower for Indigenous offenders
Figure C7: Percentage of warrant of committal admissions for Indigenous and Non-Indigenous offenders (2019-20)
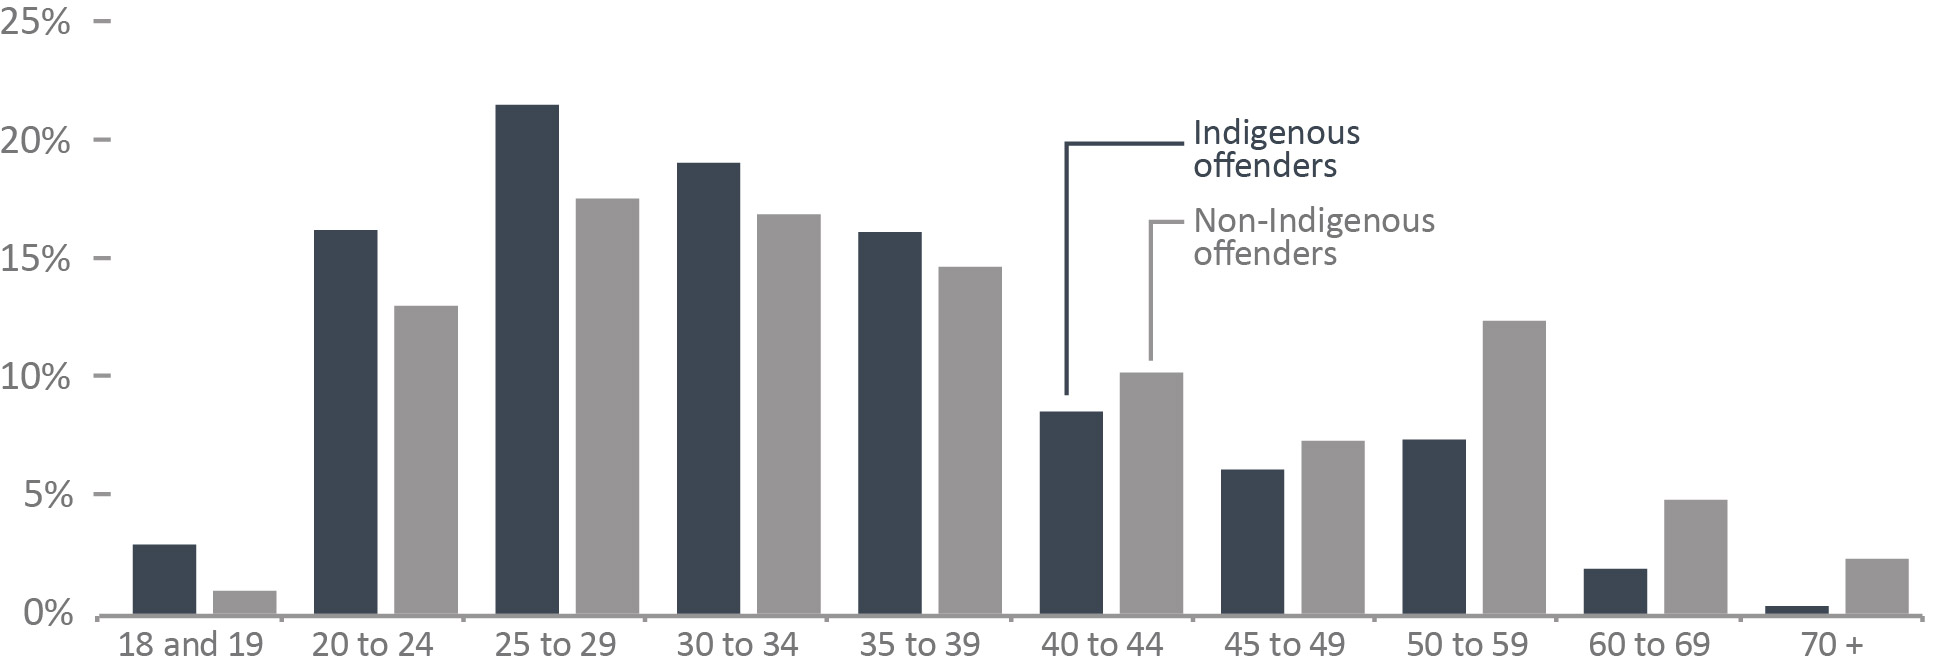
Image description
Age at Admission |
Percent Indigenous |
Percent Non-Indigenous |
|---|---|---|
18 and 19 |
2.9 |
1 |
20 to 24 |
16.2 |
13 |
25 to 29 |
21.5 |
17.5 |
30 to 34 |
19.1 |
16.9 |
35 to 39 |
16.1 |
14.7 |
40 to 44 |
8.5 |
10.2 |
45 to 49 |
6.1 |
7.3 |
50 to 59 |
7.4 |
12.4 |
60 to 69 |
1.9 |
4.8 |
70 and over |
0.3 |
2.3 |
Figure C7 Notes:
Source: Correctional Service of Canada.
- Of those offenders admitted on a warrant of committal to CSC facilities in 2019-20, 40.6% of Indigenous offenders were under the age of 30, compared to 31.5% of non-Indigenous offenders.
- The median age of Indigenous offenders at admission was 32, compared to a median age of 35 for non-Indigenous offenders.
- The median age of Indigenous female offenders at admission was 29, compared to a median age of 37 for non-Indigenous female offenders.
A warrant of committal is a new admission to federal jurisdiction from the courts.
Due to rounding, percentages may not add to 100 percent.
There is a lag in the data entry of admissions into CSC's Offender Management System. The admission figures for the most recent year are under-reported by 200-400 at the time of our year end extraction. More accurate figures will be available in the next year's publication. Please use caution when including the most recent year in any trend analysis.
Age at Admission |
2010-11 |
2019-20 |
||||||||||
|---|---|---|---|---|---|---|---|---|---|---|---|---|
Indigenous |
Non-Indigenous |
Total |
Indigenous |
Non-Indigenous |
Total |
|||||||
# |
% |
# |
% |
# |
% |
# |
% |
# |
% |
# |
% |
|
18 and 19 |
72 |
5.8 |
107 |
2.6 |
179 |
3.4 |
37 |
2.9 |
32 |
1.0 |
69 |
1.5 |
20 to 24 |
290 |
23.4 |
672 |
16.4 |
962 |
18.0 |
205 |
16.2 |
433 |
13.0 |
638 |
13.9 |
25 to 29 |
255 |
20.6 |
771 |
18.8 |
1,026 |
19.2 |
272 |
21.5 |
584 |
17.5 |
856 |
18.6 |
30 to 34 |
180 |
14.5 |
629 |
15.4 |
809 |
15.2 |
241 |
19.1 |
562 |
16.9 |
803 |
17.5 |
35 to 39 |
150 |
12.1 |
506 |
12.4 |
656 |
12.3 |
204 |
16.1 |
488 |
14.7 |
692 |
15.1 |
40 to 44 |
138 |
11.1 |
446 |
10.9 |
584 |
11.0 |
108 |
8.5 |
339 |
10.2 |
447 |
9.7 |
45 to 49 |
80 |
6.5 |
396 |
9.7 |
476 |
8.9 |
77 |
6.1 |
243 |
7.3 |
320 |
7.0 |
50 to 59 |
64 |
5.2 |
417 |
10.2 |
481 |
9.0 |
93 |
7.4 |
412 |
12.4 |
505 |
11.0 |
60 to 69 |
7 |
0.6 |
117 |
2.9 |
124 |
2.3 |
24 |
1.9 |
160 |
4.8 |
184 |
4.0 |
70 and over |
2 |
0.2 |
34 |
0.8 |
36 |
0.7 |
4 |
0.3 |
77 |
2.3 |
81 |
1.8 |
Total |
1,238 |
4,095 |
5,333 |
1,265 |
3,330 |
4,595 |
||||||
Table C7 Notes:
Source: Correctional Service of Canada.
A warrant of committal is a new admission to federal jurisdiction from the courts.
Due to rounding, percentages may not add to 100 percent.
There is a lag in the data entry of admissions into CSC's Offender Management System. The admission figures for the most recent year are under-reported by 200-400 at the time of our year end extraction. More accurate figures will be available in the next year's publication. Please use caution when including the most recent year in any trend analysis.
25% of the in-custodyFigure C8 footnote * offender population in a CSC facility was aged 50 or over
Figure C8: Percentage of in-custodyFigure C8 footnote * offender population (2019-20) vs. Canadian adult population (2020)
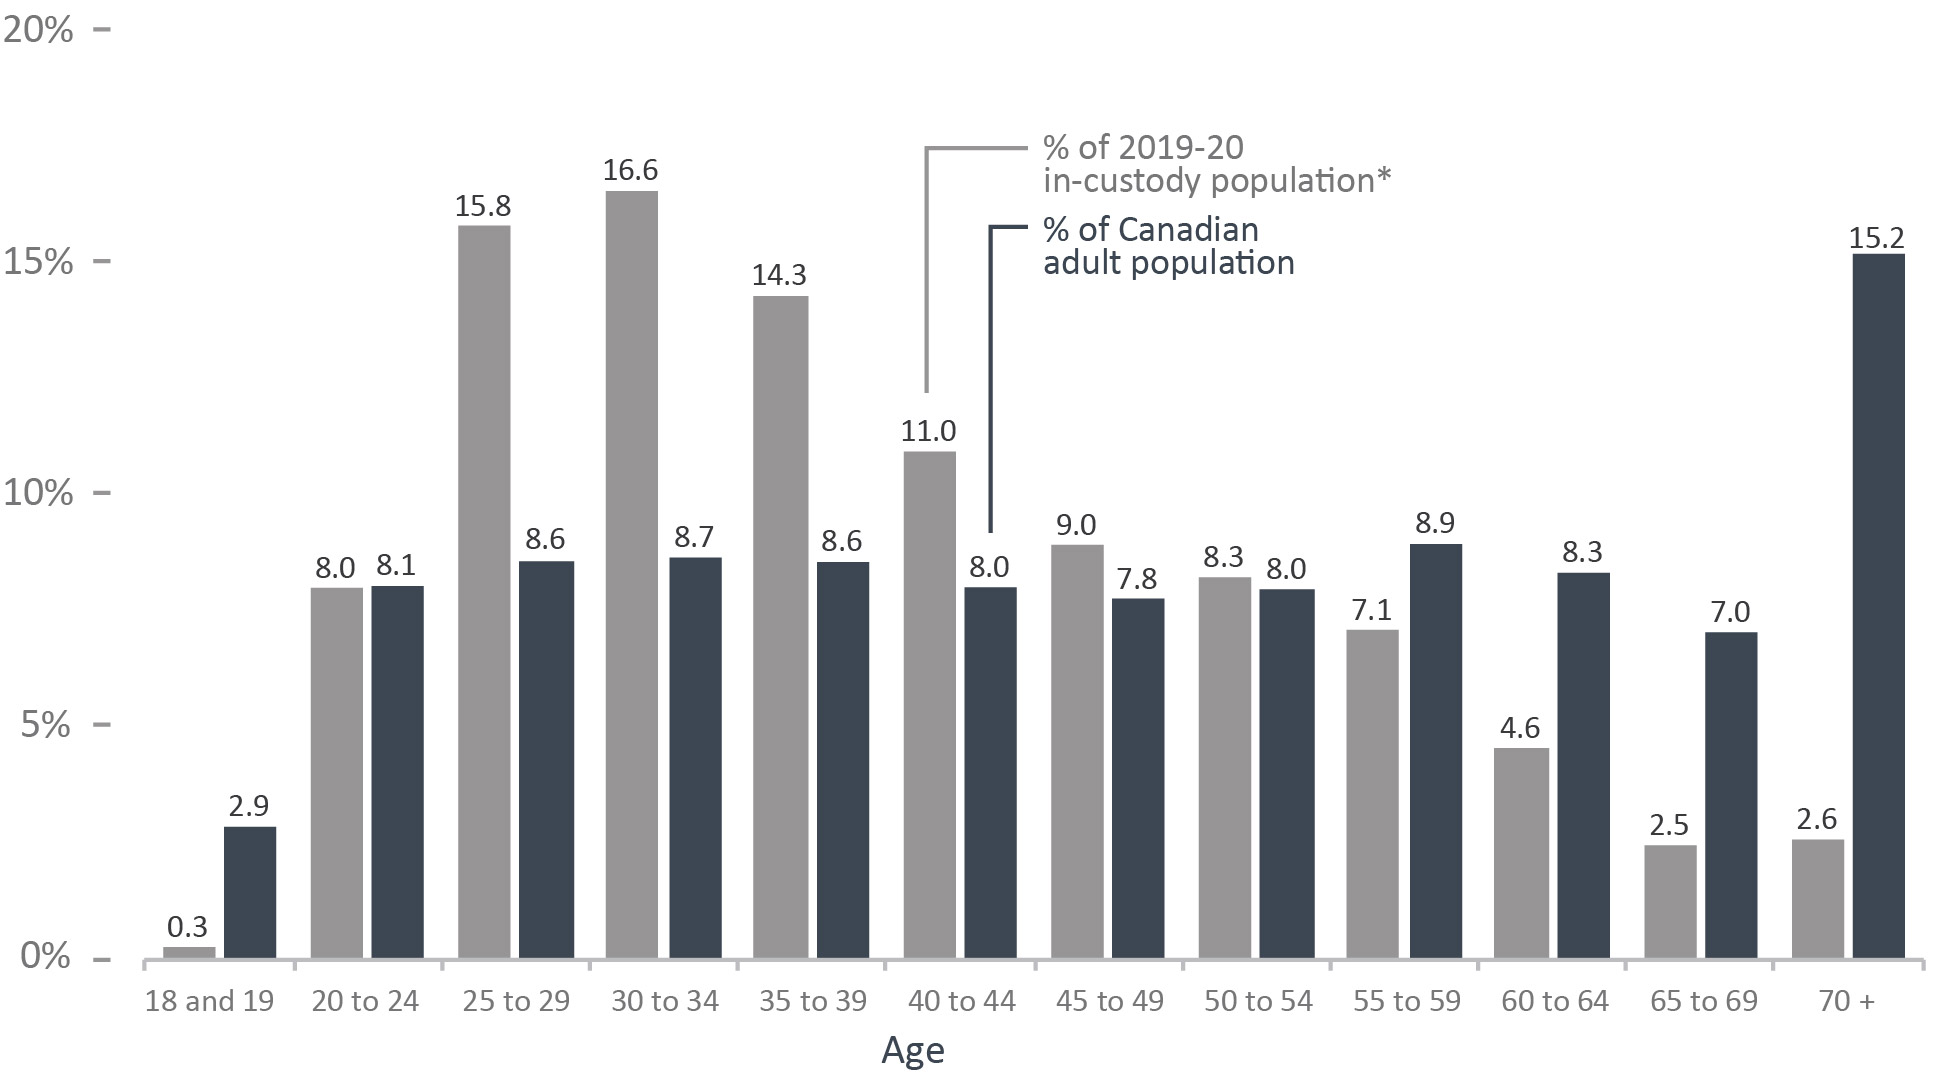
Image description
| Age | Percent of 2019-20 in-custody populationFigure C8 footnote * | Percent of Canadian adult population |
|---|---|---|
| 18 and 19 | 0.3 |
2.9 |
| 20 to 24 | 8 |
8.1 |
| 25 to 29 | 15.8 |
8.6 |
| 30 to 34 | 16.6 |
8.7 |
| 35 to 39 | 14.3 |
8.6 |
| 40 to 44 | 11 |
8 |
| 45 to 49 | 9 |
7.8 |
| 50 to 54 | 8.3 |
8 |
| 55 to 59 | 7.1 |
8.9 |
| 60 to 64 | 4.6 |
8.3 |
| 65 to 69 | 2.5 |
7 |
| 70 and over | 2.6 |
15.2 |
Figure C8 Notes:
Sources: Correctional Service of Canada; Table 17-10-0005-01, Annual Demographic Estimates: Canada, Provinces, and Territories, Canadian Centre for Justice and Community Safety Statistics, Statistics Canada.
- In 2019-20, 55.0% of in-custodyFigure C8 footnote * offenders were under the age of 40.
- In 2019-20, 25.1% of the in-custodyFigure C8 footnote * offender population were aged 50 and over.
- The community offender populationFigure C8 footnote ** was older than the in-custodyFigure C8 footnote * population; 38.9% of offenders in the community were aged 50 and over, compared to 25.1% of the in-custodyFigure C8 footnote * offenders in this age group.
Due to rounding, percentage may not add to 100 percent.
Age |
In CustodyTable C8 footnote * |
In Community Under SupervisionTable C8 footnote ** |
Total |
% of Canadian Adult Population |
|||
|---|---|---|---|---|---|---|---|
# |
% |
# |
% |
# |
% |
% |
|
18 and 19 |
37 |
0.3 |
2 |
0.0 |
39 |
0.2 |
2.9 |
20 to 24 |
1,102 |
8.0 |
392 |
4.2 |
1,494 |
6.5 |
8.1 |
25 to 29 |
2,171 |
15.8 |
1,004 |
10.7 |
3,175 |
13.7 |
8.6 |
30 to 34 |
2,273 |
16.6 |
1,191 |
12.7 |
3,464 |
15.0 |
8.7 |
35 to 39 |
1,963 |
14.3 |
1,236 |
13.2 |
3,199 |
13.8 |
8.6 |
40 to 44 |
1,504 |
11.0 |
975 |
10.4 |
2,479 |
10.7 |
8.0 |
45 to 49 |
1,229 |
9.0 |
928 |
9.9 |
2,157 |
9.3 |
7.8 |
50 to 54 |
1,133 |
8.3 |
892 |
9.5 |
2,025 |
8.8 |
8.0 |
55 to 59 |
978 |
7.1 |
874 |
9.3 |
1,852 |
8.0 |
8.9 |
60 to 64 |
629 |
4.6 |
643 |
6.9 |
1,272 |
5.5 |
8.3 |
65 to 69 |
342 |
2.5 |
529 |
5.6 |
871 |
3.8 |
7.0 |
70 and over |
359 |
2.6 |
716 |
7.6 |
1,075 |
4.7 |
15.2 |
Total |
13,720 |
100 |
9,382 |
100 |
23,102 |
100 |
100 |
Table C8 Notes:
Sources: Correctional Service of Canada; Table 17-10-0005-01, Annual Demographic Estimates: Canada, Provinces, and Territories, Canadian Centre for Justice and Community Safety Statistics, Statistics Canada.
Due to rounding, percentage may not add to 100 percent.
54% of offenders in CSC facilities were White
Figure C9: Percentage of total offender population by self-reported raceFigure C9 footnote * (2019-20)
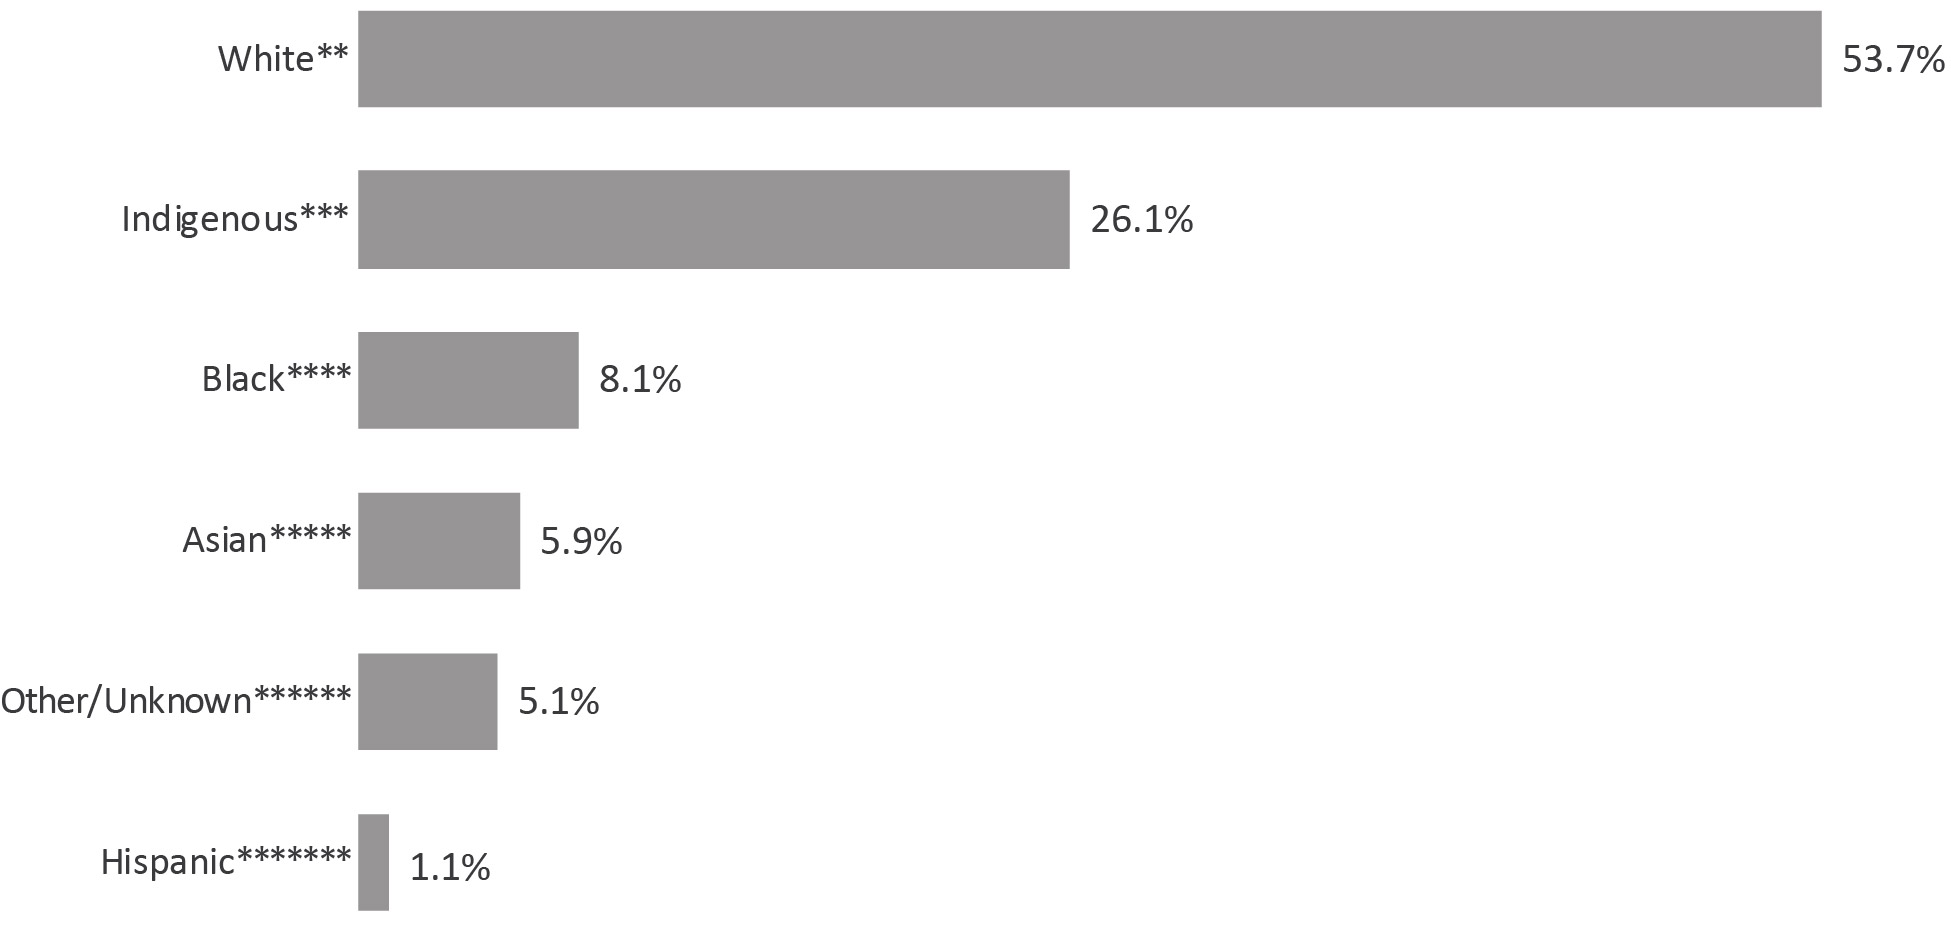
Image description
| Percent | |
|---|---|
| WhiteFigure C8 footnote ** | 53.7 |
| IndigenousFigure C8 footnote *** | 26.1 |
| BlackFigure C8 footnote **** | 8.1 |
| AsianFigure C8 footnote ***** | 5.9 |
| Other/UnknownFigure C8 footnote ****** | 5.1 |
| HispanicFigure C8 footnote ******* | 1.1 |
Figure C9 Notes:
Source: Correctional Service of Canada.
- The offender population in in CSC facilities is becoming more diverse, as evidenced by the decrease in the proportion of White offenders (from 58.8% in 2015-16 to 53.7% in 2019-20). Between 2015-16 and 2019-20, the Indigenous population has increased by 15.3% (from 5,227 to 6,027).
- Indigenous offenders represented 26.1% of the 2019-20 total federal offender population and 27.5% of 2019-20 warrant of committal admissions to federal jurisdiction.
The data reflect all active offenders, who are incarcerated in a CSC facility, offenders on temporary absence from a CSC facility, offenders who are temporarily detained, offenders who are actively supervised, and offenders who are unlawfully at large for less than 90 days.
The data reflect the number of offenders active at the end of each fiscal year. A fiscal year runs from April 1 to March 31 of the following year.
Due to rounding, percentages may not add to 100 percent.
2015-16 |
2019-20 |
|||
|---|---|---|---|---|
# |
% |
# |
% |
|
WhiteTable C9 footnote ** |
13,553 |
58.8 |
12,402 |
53.7 |
IndigenousTable C9 footnote *** |
5,277 |
22.7 |
6,027 |
26.1 |
First Nations |
3,520 |
15.3 |
4,109 |
17.8 |
Métis |
1,478 |
6.4 |
1,721 |
7.4 |
Inuit |
229 |
1.0 |
197 |
0.9 |
1,787 |
7.8 |
1,866 |
8.1 |
|
1,263 |
5.5 |
1,371 |
5.9 |
|
AsiaticTable C9 footnote ****** |
322 |
1.4 |
431 |
1.9 |
Arab |
167 |
0.7 |
195 |
0.8 |
Arab / West Asian |
177 |
0.8 |
185 |
0.8 |
South East Asian |
222 |
1.0 |
180 |
0.8 |
South Asian |
148 |
0.6 |
156 |
0.7 |
Chinese |
118 |
0.5 |
105 |
0.5 |
Filipino |
76 |
0.3 |
83 |
0.4 |
East Indian |
12 |
0.1 |
14 |
0.1 |
Korean |
17 |
0.1 |
14 |
0.1 |
Japanese |
4 |
0.0 |
8 |
0.0 |
HispanicTable C9 footnote ******* |
240 |
1.0 |
258 |
1.1 |
Latin American |
234 |
1.0 |
251 |
1.1 |
Hispanic |
6 |
0.0 |
7 |
0.0 |
Other/UnknownTable C9 footnote ******** |
987 |
4.3 |
1,178 |
5.1 |
Total |
23,057 |
100 |
23,102 |
100 |
Table C9 Notes:
Source: Correctional Service of Canada.
Multiracial/Ethnic, Oceania, British Isles, Caribbean, Sub-Sahara African, offenders unable to identify to one race, other and unknown.
The data reflect all active offenders, who are incarcerated in a CSC facility, offenders on temporary absence from a CSC facility, offenders who are temporarily detained, offenders who are actively supervised, and offenders who are unlawfully at large for less than 90 days.
The data reflect the number of offenders active at the end of each fiscal year. A fiscal year runs from April 1 to March 31 of the following year.
Due to rounding, percentages may not add to 100 percent.
The religious identification of the CSC offender population was diverse
Figure C10: Percentage of total offender population by religious identification (2019-20)
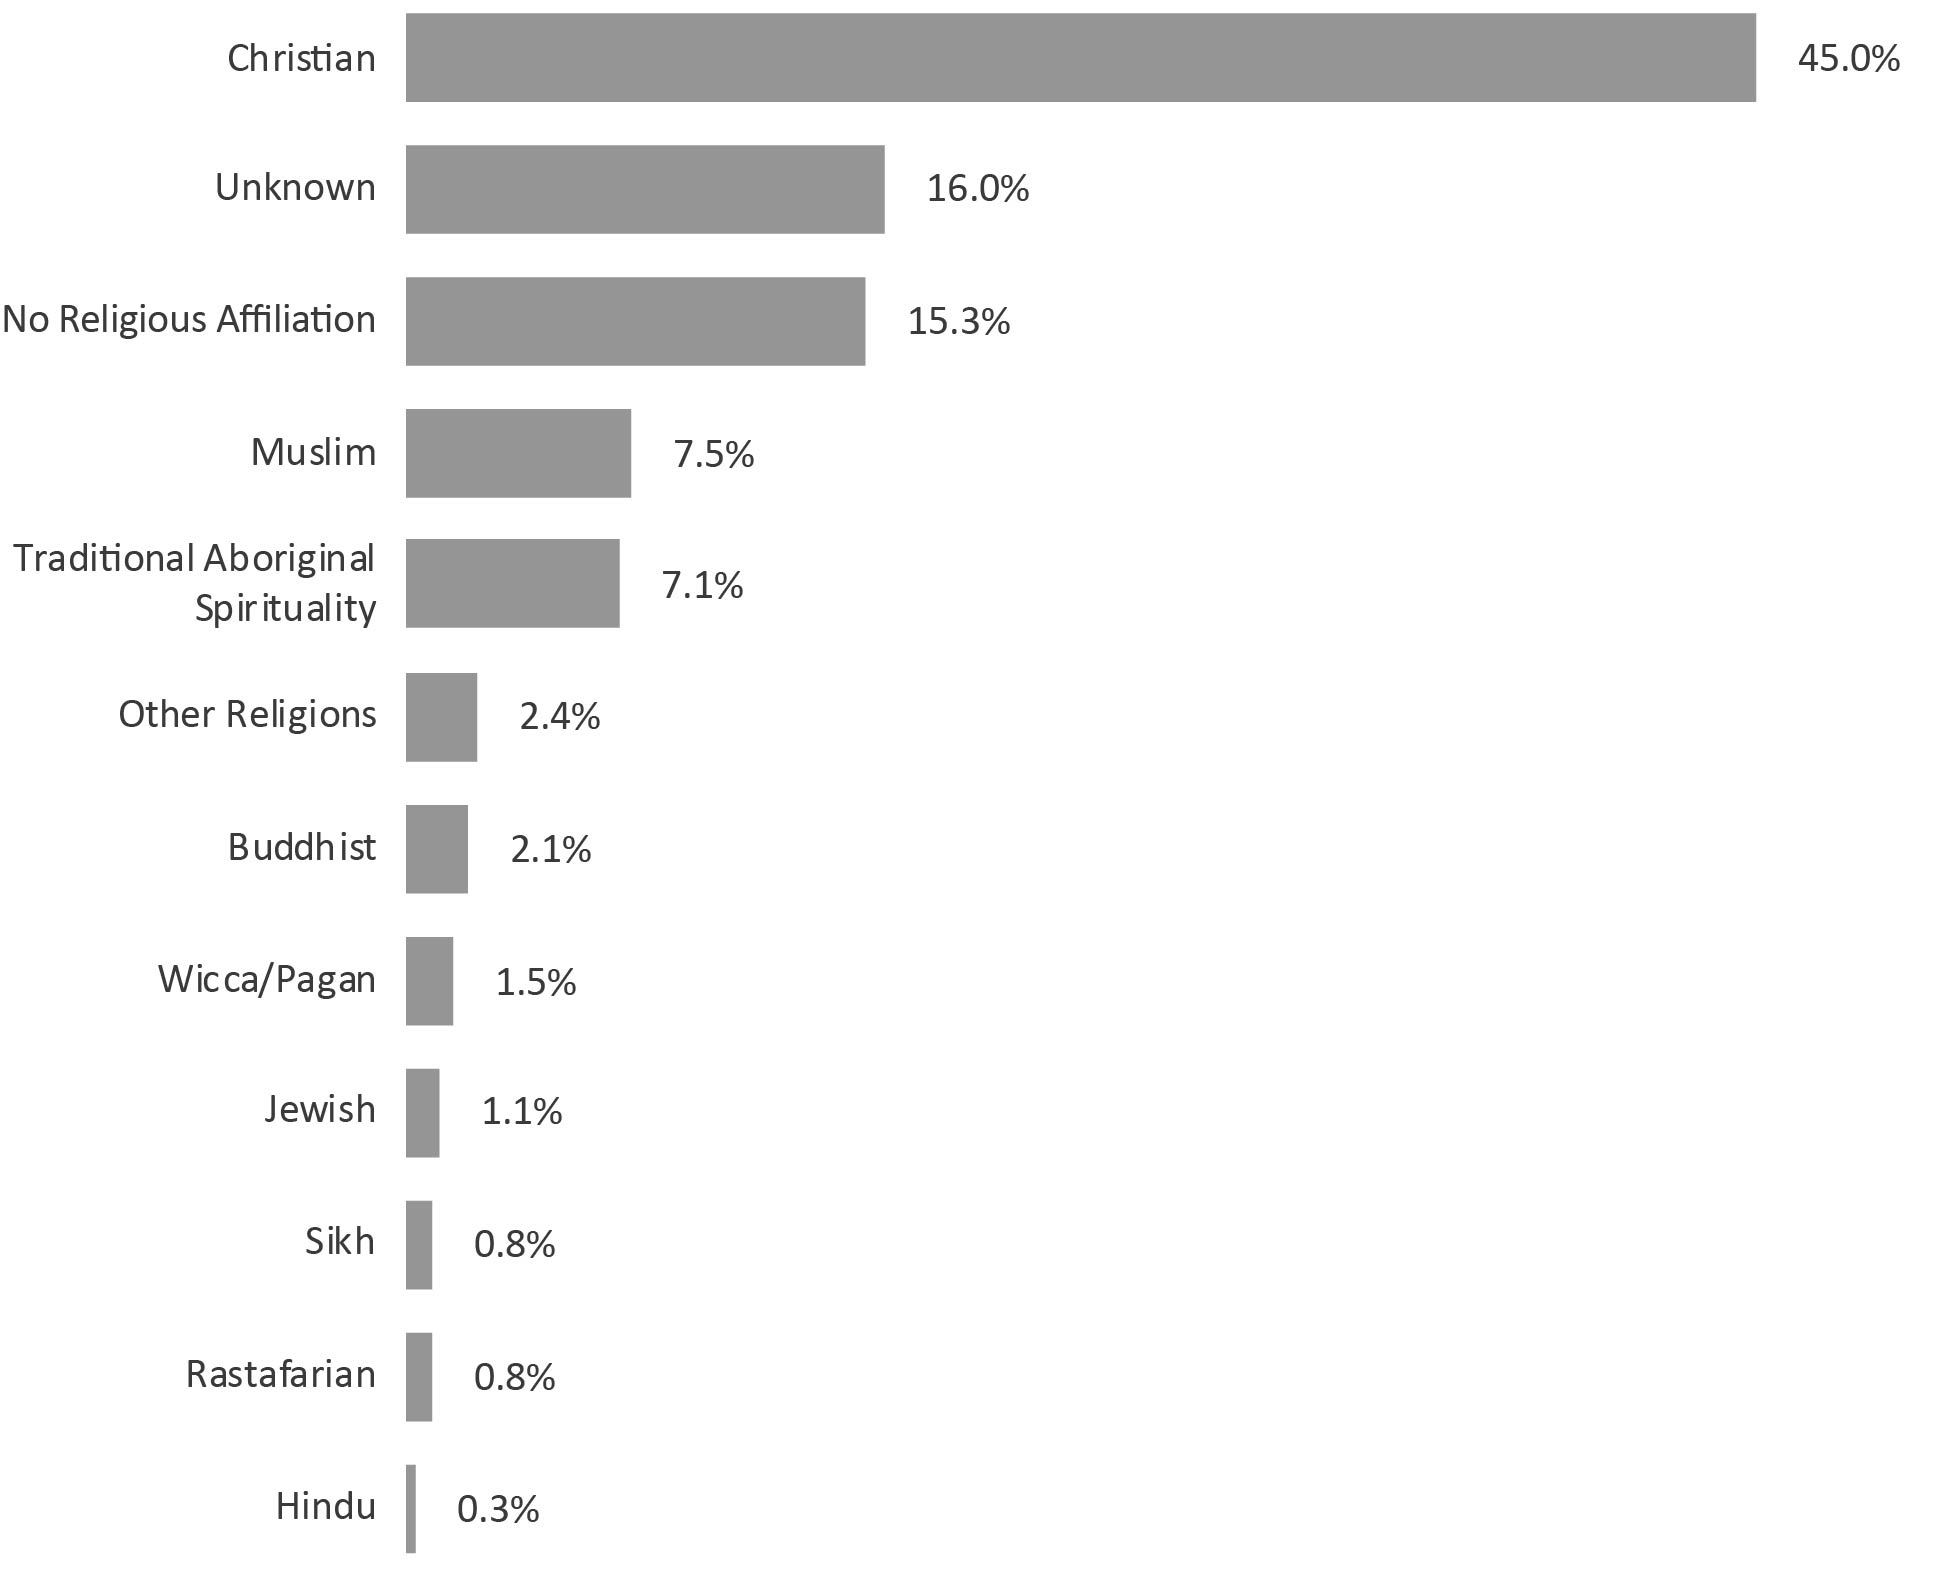
Image description
|
Percent |
|---|---|
Christian |
45.0 |
Unknown |
16.0 |
No Religious Affiliation |
15.3 |
Muslim |
7.5 |
Traditional Aboriginal Spirituality |
7.1 |
Other Religions |
2.4 |
Buddhist |
2.1 |
Wicca/Pagan |
1.5 |
Jewish |
1.1 |
Rastafarian |
0.8 |
Sikh |
0.8 |
Hindu |
0.3 |
Notes:
Source: Correctional Service of Canada.
- The religious identification of the CSC offender population was diverse. While the proportion of offenders who identified as Christian still represented the majority, their proportions decreased from 52.7% in 2015-2016 to 45.0% in 2019-20.
- Religious identification was unknown for 16.0% of offenders, whereas 15.3% stated they had no religion.
- Note that the religion groupings changed in 2018 to reflect the same groupings as Statistics Canada.
Religious identification is self-declared by offenders while they are incarcerated, and the categories are not comprehensive; therefore, the reader should interpret these data with caution.
Christian includes offenders who belong to the following groups: Amish, Anglican (Episcopal Church of England), Antiochian Orthodox, Apostolic Christian Church, Armenian Orthodox/Apostolic, Associated Gospel, Assyrian Chaldean Catholic, Baptist, Brethren In Christ, Bulgarian Orthodox, Canadian Reformed Church, Catholic- Greek, Catholic-Roman, Catholic-Ukranian, Catholic Non-Specific, Churches of Christ/Christian Churches, Charismatic, Christadelphian, Christian & Missionary Alliance, Christian Congregational, Christian Non Specific, Christian Or Plymouth Brethren, Christian Orthodox, Christian Reformed, Christian Reformed Church, Christian Science, Church of Christ Scientist, Church of God, Church of Jesus Christ of Latter-Day Saint, Community of Christ, Coptic Orthodox, Doukhobor, Dutch Reformed Church, Ethiopian Orthodox, Evangelical, Evangelical Free Church , Evangelical Missionary Church, Free Methodist, Free Reformed Church, Grace Communion International, Greek Orthodox, Hutterite, Iglesia Ni Cristo, Jehovah's Witnesses, Lutheran, Macedonian Orthodox, Maronite, Melkite, Mennonite, Methodist Christian, Metropolitan Community Church, Mission de l'Esprit Saint, Moravian, Mormon (Latter Day Saints), Nazarene Christian, Netherlands Reformed, New Apostolic, Pentecostal (4-Square), Pentecostal Assembly of God, Pentecôtiste, Philadelphia Church of God, Presbyterian, Protestant Non-Specific, Quaker (Society of Friends), Reformed Christian, Romanian Orthodox, Russian Orthodox, Salvation Army, Serbian Orthodox, Seventh Day Adventist, Shaker, Swedenborgian (New Church), Syrian/Syriac Orthodox, Ukrainian Catholic, Ukrainian Orthodox, United Church, United Reformed Church, Vineyard Christian Fellowship, Wesleyan Christian and Worldwide Church of God.
Muslim includes offenders who belong to the following groups: Muslim and Sufism.
Traditional Indigenous Spirituality includes offenders who belong to the following groups: Indigenous Spirituality Catholic, Traditional Indigenous Protestant, Native Spirituality, Catholic - Native Spirituality, Native Spirituality Protestant and Indigenous Spirituality.
Other Religion includes offenders who belong to the following groups: Baha'i, Eckankar, Gnostic, Independent Spirituality, Jain, Krishna, New Age, New Thought-Unity-Religious Science, Other, Pantheist, Rosicrucian, Satanist, Scientology, Shintoïste, Spiritualist, Taoism, Transcendental Meditation, Unification Church, Unitarian, Visnabha and Zoroastrian.
No religion Affiliation includes offenders who belong to the following groups: Agnostic, Atheist, Humanist and offenders who have no religion affiliation.
Buddhist includes offenders who belong to the following groups: Buddhist, Mahayana Buddhist, Theravadan Buddhist and Vajrayana Buddhist.
Wiccan/Pagan includes offenders who belong to the following groups: Asatru Paganism, Druidry Paganism, Pagan and Wicca.
Jewish includes offenders who belong to the following groups: Jewish Orthodox, Jewish Reformed and Judaism.
Sikh includes offenders who belong to the following groups: Sikh.
Rastafarian includes offenders who belong to the following groups: Rastafarian.
Hindu includes offenders who belong to the following groups: Hindu and Siddha Yoga.
The data reflect all active offenders, who are incarcerated in a CSC facility, offenders on temporary absence from a CSC facility, offenders who are temporarily detained, offenders who are actively supervised, and offenders who are unlawfully at large for less than 90 days.
The data reflect the number of offenders active at the end of each fiscal year. A fiscal year runs from April 1 to March 31 of the following year.
Due to rounding, percentages may not add to 100 percent.
2015-16 |
2019-20 |
|||
|---|---|---|---|---|
# |
% |
# |
% |
|
Christian |
12,145 |
52.7 |
10,406 |
45.0 |
Muslim |
1,317 |
5.7 |
1,736 |
7.5 |
Traditional Aboriginal Spirituality |
1,349 |
5.9 |
1,646 |
7.1 |
Buddhist |
473 |
2.1 |
478 |
2.1 |
Wicca/Pagan |
173 |
0.8 |
350 |
1.5 |
Jewish |
163 |
0.7 |
257 |
1.1 |
Rastafarian |
171 |
0.7 |
175 |
0.8 |
Sikh |
140 |
0.6 |
196 |
0.8 |
Hindu |
43 |
0.2 |
74 |
0.3 |
Other Religions |
463 |
2.0 |
555 |
2.4 |
No Religious Affiliation |
3,627 |
15.7 |
3,540 |
15.3 |
Unknown |
2,993 |
13.0 |
3,689 |
16.0 |
Total |
23,057 |
100 |
23,102 |
100 |
Table C10 Notes:
Source: Correctional Service of Canada.
Religious identification is self-declared by offenders while they are incarcerated, and the categories are not comprehensive; therefore, the reader should interpret these data with caution.
Christian includes offenders who belong to the following groups: Amish, Anglican (Episcopal Church of England), Antiochian Orthodox, Apostolic Christian Church, Armenian Orthodox/Apostolic, Associated Gospel, Assyrian Chaldean Catholic, Baptist, Brethren In Christ, Bulgarian Orthodox, Canadian Reformed Church, Catholic- Greek, Catholic-Roman, Catholic-Ukranian, Catholic Non-Specific, Churches of Christ/Christian Churches, Charismatic, Christadelphian, Christian & Missionary Alliance, Christian Congregational, Christian Non Specific, Christian Or Plymouth Brethren, Christian Orthodox, Christian Reformed, Christian Reformed Church, Christian Science, Church of Christ Scientist, Church of God, Church of Jesus Christ of Latter-Day Saint, Community of Christ, Coptic Orthodox, Doukhobor, Dutch Reformed Church, Ethiopian Orthodox, Evangelical, Evangelical Free Church , Evangelical Missionary Church, Free Methodist, Free Reformed Church, Grace Communion International, Greek Orthodox, Hutterite, Iglesia Ni Cristo, Jehovah's Witnesses, Lutheran, Macedonian Orthodox, Maronite, Melkite, Mennonite, Methodist Christian, Metropolitan Community Church, Mission de l'Esprit Saint, Moravian, Mormon (Latter Day Saints), Nazarene Christian, Netherlands Reformed, New Apostolic, Pentecostal (4-Square), Pentecostal Assembly of God, Pentecôtiste, Philadelphia Church of God, Presbyterian, Protestant Non-Specific, Quaker (Society of Friends), Reformed Christian, Romanian Orthodox, Russian Orthodox, Salvation Army, Serbian Orthodox, Seventh Day Adventist, Shaker, Swedenborgian (New Church), Syrian/Syriac Orthodox, Ukrainian Catholic, Ukrainian Orthodox, United Church, United Reformed Church, Vineyard Christian Fellowship, Wesleyan Christian and Worldwide Church of God.
Muslim includes offenders who belong to the following groups: Muslim and Sufism.
Traditional Indigenous Spirituality includes offenders who belong to the following groups: Indigenous Spirituality Catholic, Traditional Indigenous Protestant, Native Spirituality, Catholic - Native Spirituality, Native Spirituality Protestant and Indigenous Spirituality.
Other Religion includes offenders who belong to the following groups: Baha'i, Eckankar, Gnostic, Independent Spirituality, Jain, Krishna, New Age, New Thought-Unity-Religious Science, Other, Pantheist, Rosicrucian, Satanist, Scientology, Shintoïste, Spiritualist, Taoism, Transcendental Meditation, Unification Church, Unitarian, Visnabha and Zoroastrian.
Buddhist includes offenders who belong to the following groups: Buddhist, Mahayana Buddhist, Theravadan Buddhist and Vajrayana Buddhist.
Wiccan/Pagan includes offenders who belong to the following groups: Asatru Paganism, Druidry Paganism, Pagan and Wicca.
Jewish includes offenders who belong to the following groups: Jewish Orthodox, Jewish Reformed and Judaism.
Rastafarian includes offenders who belong to the following groups: Rastafarian.
Sikh includes offenders who belong to the following groups: Sikh.
Hindu includes offenders who belong to the following groups: Hindu and Siddha Yoga.
No religion Affiliation includes offenders who belong to the following groups: Agnostic, Atheist, Humanist and offenders who have no religion affiliation.
The data reflect all active offenders, who are incarcerated in a CSC facility, offenders on temporary absence from a CSC facility, offenders who are temporarily detained, offenders who are actively supervised, and offenders who are unlawfully at large for less than 90 days.
The data reflect the number of offenders active at the end of each fiscal year. A fiscal year runs from April 1 to March 31 of the following year.
Due to rounding, percentages may not add to 100 percent.
The proportion of Indigenous offenders in CSC custody vs in the community under supervision continued to be higher than non-Indigenous offenders
Figure C11: Percentage of Indigenous and non-Indigenous offenders in custodyFigure C11 footnote *
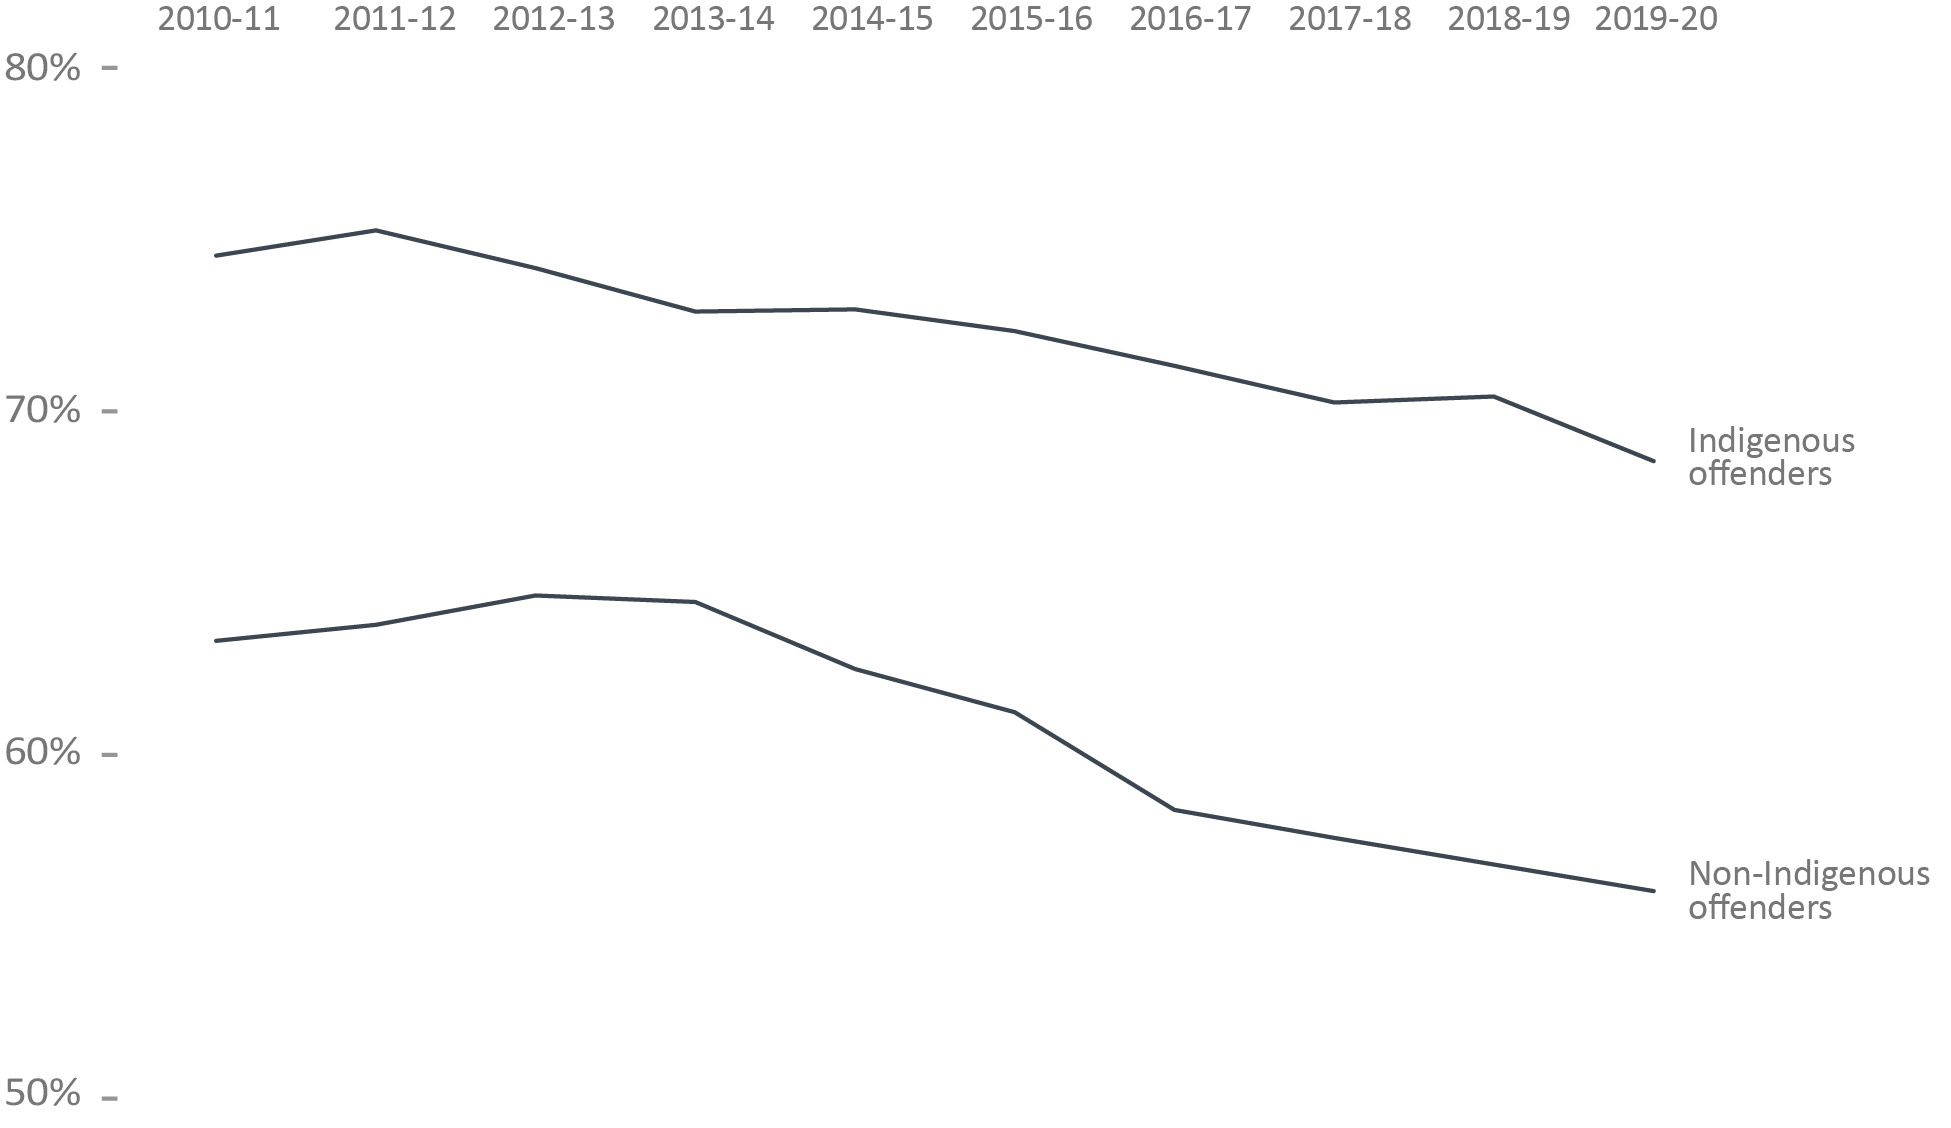
Image description
| Indigenous Offenders Percent | Non-Indigenous Offenders Percent | |
|---|---|---|
2010-11 |
74.6 |
63.4 |
2011-12 |
75.3 |
63.8 |
2012-13 |
74.2 |
64.7 |
2013-14 |
72.9 |
64.5 |
2014-15 |
73.0 |
62.6 |
2015-16 |
72.4 |
61.3 |
2016-17 |
71.4 |
58.5 |
2017-18 |
70.3 |
57.7 |
2018-19 |
70.5 |
56.9 |
2019-20 |
68.6 |
56.1 |
Figure C11 Notes:
Source: Correctional Service of Canada.
- At the end of fiscal year 2019-20, the proportion of offenders in custodyFigure C11 footnote * was 12.5% greater for Indigenous offenders (68.6%) than for non-Indigenous offenders (56.1%).
- Indigenous females in custodyFigure C11 footnote * represent 40.7% of all females in custodyFigure C11 footnote * while Indigenous males who were in custody represented 29.6% of all males in custody.
- In 2019-20, Indigenous offenders represented 26.1% of the total offender populationFigure C11 footnote ***.
- Indigenous offenders accounted for 30.1% of the in-custodyFigure C11 footnote * population and 20.2% of the community populationFigure C11 footnote ** in 2019-20.
The data reflect the number of offenders active at the end of each fiscal year. A fiscal year runs from April 1 to March 31 of the following year.
In-Custody PopulationTable C11 footnote * |
In Community Under SupervisionTable C11 footnote ** |
||||||
|---|---|---|---|---|---|---|---|
# |
% |
# |
% |
||||
Males |
2015-16 |
Indigenous |
3,532 |
73.2 |
1,293 |
26.8 |
4,825 |
Non-Indigenous |
10,485 |
61.8 |
6,468 |
38.2 |
16,953 |
||
Total |
14,017 |
64.4 |
7,761 |
35.6 |
21,778 |
||
2016-17 |
Indigenous |
3,545 |
72.2 |
1,362 |
27.8 |
4,907 |
|
Non-Indigenous |
9,922 |
59.0 |
6,885 |
41.0 |
16,807 |
||
Total |
13,467 |
62.0 |
8,247 |
38.0 |
21,714 |
||
2017-18 |
Indigenous |
3,647 |
71.4 |
1,464 |
28.6 |
5,111 |
|
Non-Indigenous |
9,769 |
58.4 |
6,946 |
41.6 |
16,715 |
||
Total |
13,416 |
61.5 |
8,410 |
38.5 |
21,826 |
||
2018-19 |
Indigenous |
3,877 |
71.5 |
1,548 |
28.5 |
5,425 |
|
Non-Indigenous |
9,571 |
57.6 |
7,036 |
42.4 |
16,607 |
||
Total |
13,448 |
61.0 |
8,584 |
39.0 |
22,032 |
||
2019-20 |
Indigenous |
3,855 |
69.6 |
1,684 |
30.4 |
5,539 |
|
Non-Indigenous |
9,177 |
56.8 |
6,966 |
43.2 |
16,143 |
||
Total |
13,032 |
60.1 |
8,650 |
39.9 |
21,682 |
||
Females |
2015-16 |
Indigenous |
251 |
62.4 |
151 |
37.6 |
402 |
Non-Indigenous |
444 |
50.6 |
433 |
49.4 |
877 |
||
Total |
695 |
54.3 |
584 |
45.7 |
1,279 |
||
2016-17 |
Indigenous |
253 |
61.0 |
162 |
39.0 |
415 |
|
Non-Indigenous |
439 |
47.9 |
477 |
52.1 |
916 |
||
Total |
692 |
52.0 |
639 |
48.0 |
1,331 |
||
2017-18 |
Indigenous |
270 |
58.6 |
191 |
41.4 |
461 |
|
Non-Indigenous |
406 |
43.4 |
530 |
56.6 |
936 |
||
Total |
676 |
48.4 |
721 |
51.6 |
1,397 |
||
2018-19 |
Indigenous |
291 |
59.5 |
198 |
40.5 |
489 |
|
Non-Indigenous |
410 |
43.5 |
533 |
56.5 |
943 |
||
Total |
701 |
49.0 |
731 |
51.0 |
1,432 |
||
2019-20 |
Indigenous |
279 |
57.3 |
208 |
42.7 |
487 |
|
Non-Indigenous |
406 |
43.7 |
523 |
56.3 |
929 |
||
Total |
685 |
48.4 |
731 |
51.6 |
1,416 |
||
Another Sex |
2019-20 |
Indigenous |
1 |
100 |
0 |
0.0 |
1 |
Non-Indigenous |
2 |
66.7 |
1 |
33.3 |
3 |
||
Total |
3 |
75.0 |
1 |
25.0 |
4 |
||
Table C11 Notes:
Source: Correctional Service of Canada.
The data reflect the number of offenders active at the end of each fiscal year. A fiscal year runs from April 1 to March 31 of the following year.
The majority of in-custodyFigure C12 footnote * offenders in a CSC facility were classified as medium security risk
Figure C12: Percentage of classified in-custodyFigure C12 footnote * offenders (2019-20)
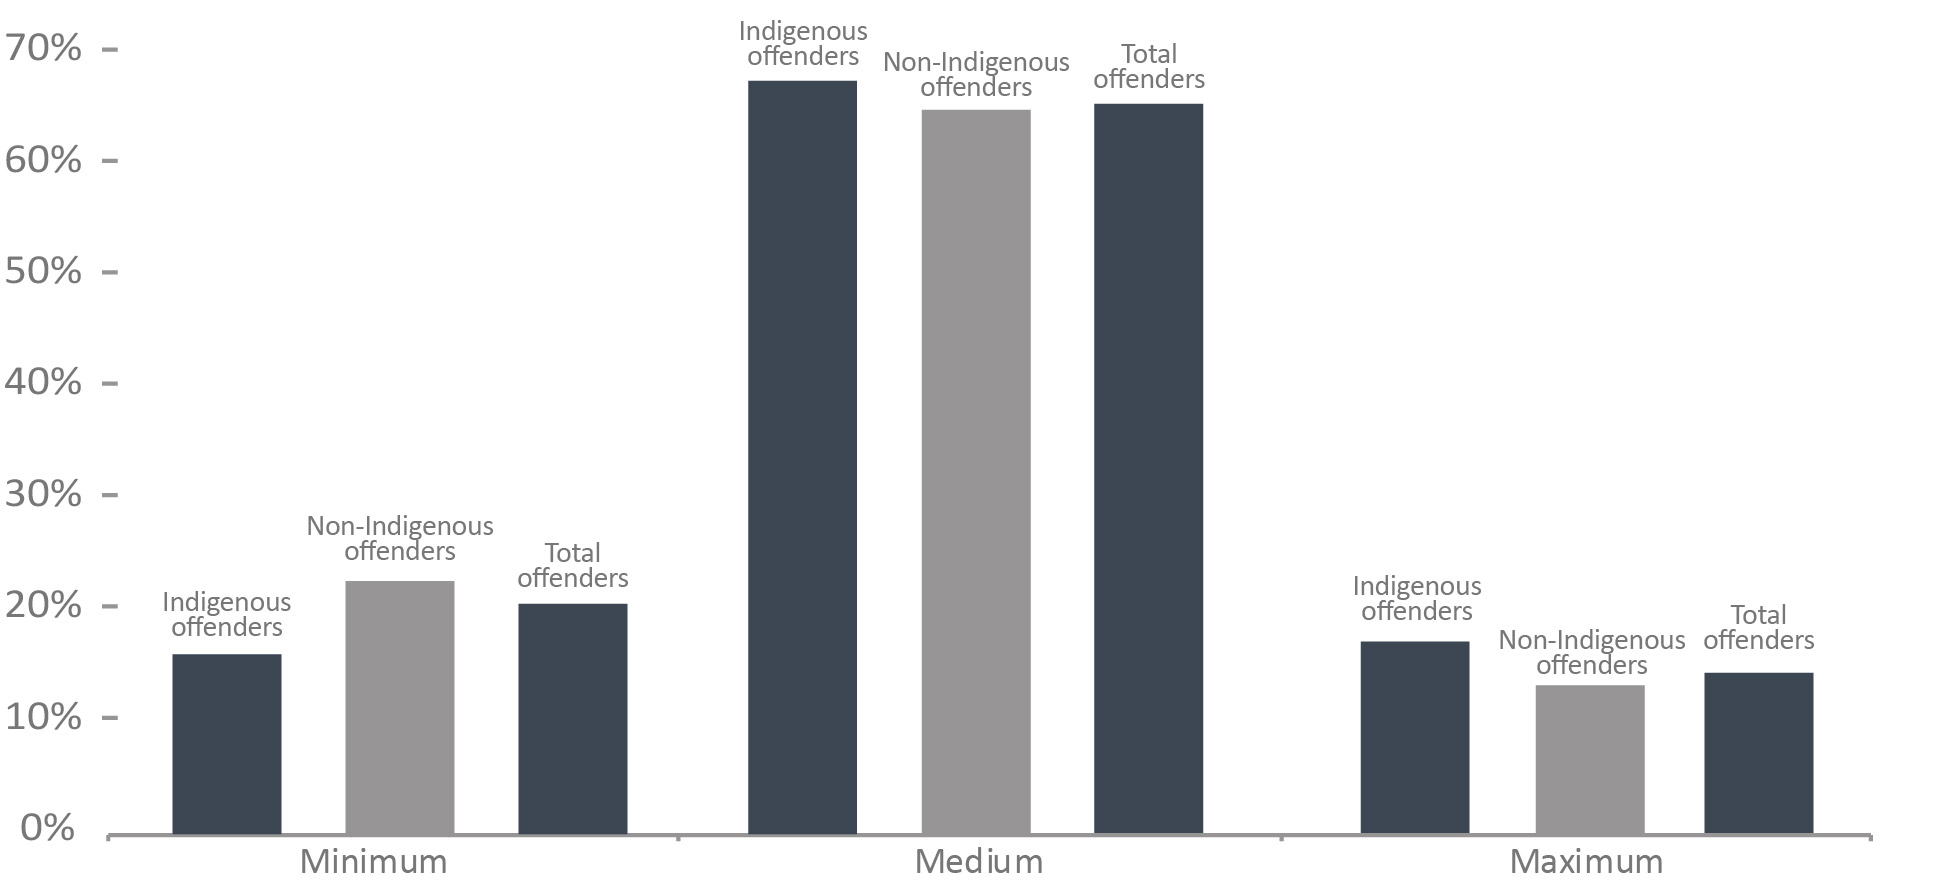
Image description
| Security Risk Level | Indigenous Percent | Non-Indigenous Percent | Total Percent |
|---|---|---|---|
| Minimum | 16.0 |
22.5 |
20.5 |
| Medium | 66.9 |
64.3 |
65.1 |
| Maximum | 17.1 |
13.2 |
14.4 |
Figure C12 Notes:
Source: Correctional Service of Canada.
- Approximately two-thirds (65.1%) of offenders were classified as medium security risk. Indigenous offenders were more likely to be classified to a medium or maximum security risk compared to non-Indigenous.
- Compared to non-Indigenous offenders, a lower percentage of Indigenous offenders were classified as minimum security risk (16.0% vs. 22.5%) and a higher percentage were classified as medium (66.9% vs. 64.3%) and maximum (17.1% vs. 13.2%) security risk.
The data represent the offender security level decision as of end of fiscal year 2019-20.
Security Risk Level |
Indigenous |
Non-Indigenous |
Total |
|||
|---|---|---|---|---|---|---|
# |
% |
# |
% |
# |
% |
|
Minimum |
619 |
16.0 |
1,958 |
22.5 |
2,577 |
20.5 |
Medium |
2,591 |
66.9 |
5,608 |
64.3 |
8,199 |
65.1 |
Maximum |
663 |
17.1 |
1,153 |
13.2 |
1,816 |
14.4 |
Total |
3,873 |
100 |
8,719 |
100 |
12,592 |
100 |
Not Yet DeterminedTable C12 footnote ** |
262 |
866 |
1,128 |
|||
Total |
4,135 |
9,585 |
13,720 |
|||
Table C12 Notes:
Source: Correctional Service of Canada.
The data represent the offender security level decision as of end of fiscal year 2019-20.
Admissions to federal jurisdiction with a life and/or indeterminateFigure C13 footnote * sentence
Figure C13: Number of warrant of committal admissions for life and/or indeterminateFigure C13 footnote * sentences

Image description
| Year | Non-Indigenous Offenders | Indigenous Offenders |
|---|---|---|
| 2010-11 | 135 |
39 |
| 2011-12 | 121 |
54 |
| 2012-13 | 117 |
54 |
| 2013-14 | 126 |
48 |
| 2014-15 | 128 |
41 |
| 2015-16 | 132 |
54 |
| 2016-17 | 140 |
46 |
| 2017-18 | 148 |
80 |
| 2018-19 | 128 |
59 |
| 2019-20 | 136 |
40 |
Figure C13 Notes:
Source: Correctional Service of Canada.
- From 2010-11 to 2019-20, there was a small increase of 1.1% in the number of warrant of committal admissions to federal jurisdiction with a life and/or indeterminateFigure C13 footnote * sentence from 174 to 176.
- At the end of fiscal year 2019-20, 25.0% of the total population was serving a life and/or indeterminateFigure C13 footnote * sentence. Of these offenders, 63.5% were in custodyFigure C13 footnote ** and 36.5% were in the community under supervisionFigure C13 footnote ***.
- At the end of fiscal year 2019-20, there were a total of 3,661 offenders in custodyFigure C13 footnote ** with a life and/or indeterminateFigure C13 footnote * sentence. Of these, 3,525 (96.3%) were male, 133 (3.6%) were female and 3 (0.1%) were offenders who identified as another sex; 990 (27.0%) were Indigenous and 2,671 (73.0%) were non-Indigenous.
A warrant of committal is a new admission to federal jurisdiction from the courts.
Total offender population includes all active offenders, who are incarcerated in a CSC facility, offenders on temporary absence from a CSC facility, offenders who are temporarily detained, offenders who are actively supervised, and offenders who are unlawfully at large for less than 90 days.
There is a lag in the data entry of admissions into CSC's Offender Management System. The admission figures for the most recent year are under-reported by 200-400 at the time of our year end extraction. More accurate figures will be available in the next year's publication. Please use caution when including the most recent year in any trend analysis.
Year |
Indigenous Offenders |
Non-Indigenous Offenders |
Total |
||||||
|---|---|---|---|---|---|---|---|---|---|
Females |
Males |
Total |
Females |
Males |
Total |
Females |
Males |
Total |
|
2010-11 |
4 |
35 |
39 |
5 |
130 |
135 |
9 |
165 |
174 |
2011-12 |
6 |
48 |
54 |
11 |
110 |
121 |
17 |
158 |
175 |
2012-13 |
6 |
48 |
54 |
2 |
115 |
117 |
8 |
163 |
171 |
2013-14 |
7 |
41 |
48 |
7 |
119 |
126 |
14 |
160 |
174 |
2014-15 |
1 |
40 |
41 |
8 |
120 |
128 |
9 |
160 |
169 |
2015-16 |
5 |
49 |
54 |
6 |
126 |
132 |
11 |
175 |
186 |
2016-17 |
2 |
44 |
46 |
11 |
129 |
140 |
13 |
173 |
186 |
2017-18 |
6 |
74 |
80 |
12 |
136 |
148 |
18 |
210 |
228 |
2018-19 |
6 |
53 |
59 |
4 |
124 |
128 |
10 |
177 |
187 |
2019-20 |
1 |
39 |
40 |
8 |
128 |
136 |
9 |
167 |
176 |
Table C13 Notes:
Source: Correctional Service of Canada.
A warrant of committal is a new admission to federal jurisdiction from the courts.
There is a lag in the data entry of admissions into CSC's Offender Management System. The admission figures for the most recent year are under-reported by 200-400 at the time of our year end extraction. More accurate figures will be available in the next year's publication. Please use caution when including the most recent year in any trend analysis.
Offenders with life and/or indeterminate sentences represented 25% of the CSC total offender population
Figure C14: Sentence imposed for the total offender populationFigure C14 footnote * (2019-20)
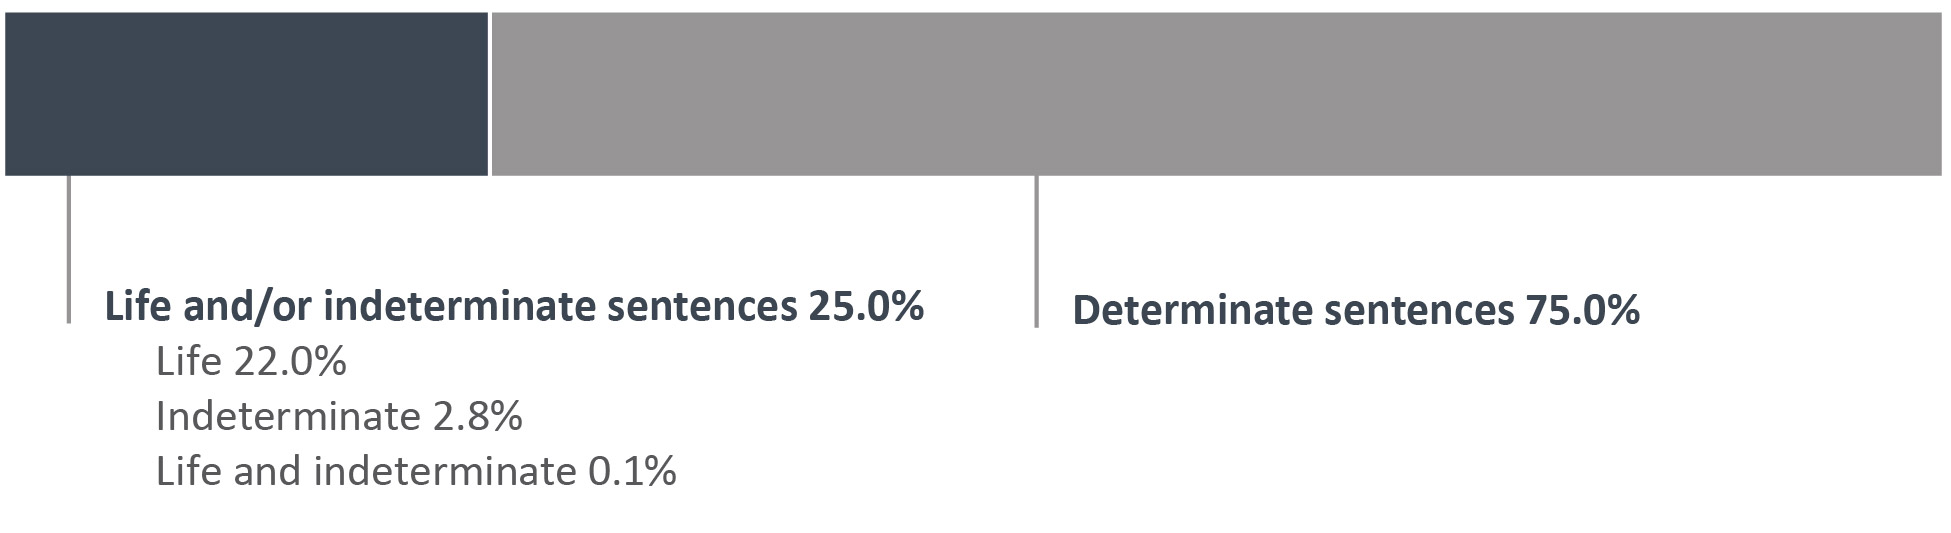
Image description
Life and/or indeterminate sentences |
25.0% |
|
|---|---|---|
Life |
22.0% |
|
Indeterminate |
2.8% |
|
Life and indeterminate |
0.1% |
|
Determinate sentences |
75.0% |
|
Figure C14 Notes:
Source: Correctional Service of Canada.
- At the end of fiscal year 2019-20, there were 5,764 offenders serving a life sentence and/or an indeterminate sentenceFigure C14 footnote **. This represented 25.0% of the total offender population. The majority (63.5%) of these offenders were in custodyFigure C14 footnote ***. Of the 2,103 offenders who were in the community under supervisionFigure C14 footnote ****, the majority (80.1%) were serving a life sentence for 2nd Degree Murder.
- There were 21 offenders who were serving both a life sentence and an indeterminate sentence.
- There were 656 offenders who were serving an indeterminate sentence as a result of a special designation. The remaining 5,087 offenders did not receive a special designation, but were serving a life sentence.
- 93.8% of the 643 Dangerous Offenders with indeterminate sentences were in custody and 6.2% were in the community under supervision.
- In contrast, 63.6% of the 11 Dangerous Sexual Offenders were in custody and all (2) of the offenders with an Habitual Offender designation were in the community under supervision.
Total Offender PopulationTable C14 footnote * |
In CustodyTable C14 footnote ** in a CSC Facility |
In Community Under SupervisionTable C14 footnote *** |
|||||
|---|---|---|---|---|---|---|---|
# |
% |
Incarcerated |
Day Parole |
Full Parole |
|||
Offenders with a life sentence for: |
1st Degree Murder |
1,293 |
5.6 |
1,010 |
69 |
214 |
0 |
2nd Degree Murder |
3,604 |
15.6 |
1,920 |
235 |
1,449 |
0 |
|
Other OffencesTable C14 footnote ***** |
190 |
0.8 |
102 |
12 |
76 |
0 |
|
Total |
5,087 |
22.0 |
3,032 |
316 |
1,739 |
0 |
|
Offenders with indeterminate sentences resulting from the special designation of: |
Dangerous Offender |
643 |
2.8 |
603 |
18 |
22 |
0 |
Dangerous Sexual Offender |
11 |
0.0 |
7 |
0 |
4 |
0 |
|
Habitual Offender |
2 |
0.0 |
0 |
0 |
2 |
0 |
|
Total |
656 |
2.8 |
610 |
18 |
28 |
0 |
|
Offenders serving an indeterminate sentence (due to a special designation) and a life sentence (due to an offence)Table C14 footnote ****** |
21 |
0.1 |
19 |
0 |
2 |
0 |
|
Total offenders with life and/or indeterminate sentenceTable C14 footnote ******* |
5,764 |
25.0 |
3,661 |
334 |
1,769 |
0 |
|
Offenders Serving Determinate sentencesTable C14 footnote ******** |
17,338 |
75.0 |
10,059 |
1,205 |
2,802 |
3,272 |
|
Total |
23,102 |
100 |
13,720 |
1,539 |
4,571 |
3,272 |
|
Table C14 Notes:
Source: Correctional Service of Canada.
72% of the CSC total offender population was serving a sentence for a violent offence
Figure C15: Percentage of total offender populationFigure C15 footnote * (2019-20)

Image description
| Offence Category | Indigenous Offenders Percent | Non-Indigenous Offenders Percent |
|---|---|---|
Murder I |
4.3 |
6.1 |
Murder II |
14.1 |
16.3 |
Schedule I |
60.5 |
46.9 |
Schedule II |
10.3 |
19.6 |
Non-Schedule |
10.8 |
11 |
Figure C15 Notes:
Source: Correctional Service of Canada.
- At the end of fiscal year 2019-20, Indigenous offenders were more likely to be serving a sentence for a violent offence** (79.0% for Indigenous versus 69.3% for non-Indigenous).
- 67.6% of Indigenous female offenders were serving a sentence for a violent offence compared to 44.8% of non-Indigenous female offenders.
- Of those offenders serving a sentence for murder, 5.0% were female and 22.5% were Indigenous.
- A greater proportion of Indigenous offenders than non-Indigenous offenders were serving a sentence for a Schedule I*** offence (60.5% versus 46.9%, respectively).
- 10.3% of Indigenous offenders were serving a sentence for a Schedule II**** offence compared to 19.6% of non-Indigenous offenders.
- 31.4% of female were serving a sentence for a Schedule II offence compared to 16.3% for male.
In cases where the offender is serving a sentence for more than one offence, the data reflect the most serious offence.
Offence Category |
Indigenous |
Non-Indigenous |
Total |
|||||||||
|---|---|---|---|---|---|---|---|---|---|---|---|---|
Female |
Male |
Another Sex |
Total |
Female |
Male |
AnotherSex |
Total |
Female |
Male |
Another Sex |
Total |
|
Murder I |
12 |
248 |
0 |
260 |
47 |
1,002 |
1 |
1,050 |
59 |
1,250 |
1 |
1,310 |
% |
2.5 |
4.5 |
0.0 |
4.3 |
5.1 |
6.2 |
33.3 |
6.1 |
4.2 |
5.8 |
25.0 |
5.7 |
Murder II |
65 |
784 |
1 |
850 |
122 |
2,653 |
2 |
2,777 |
187 |
3,437 |
3 |
3,627 |
% |
13.3 |
14.2 |
100 |
14.1 |
13.1 |
16.4 |
66.7 |
16.3 |
13.2 |
15.9 |
75.0 |
15.7 |
Schedule ITable C15 footnote ** |
252 |
3,397 |
0 |
3,649 |
247 |
7,763 |
0 |
8,010 |
499 |
11,160 |
0 |
11,659 |
% |
51.7 |
61.3 |
0.0 |
60.5 |
26.6 |
48.1 |
0.0 |
46.9 |
35.2 |
51.5 |
0.0 |
50.5 |
Schedule IITable C15 footnote *** |
98 |
520 |
0 |
618 |
347 |
3,007 |
0 |
3,354 |
445 |
3,527 |
0 |
3,972 |
% |
20.1 |
9.4 |
0.0 |
10.3 |
37.4 |
18.6 |
0.0 |
19.6 |
31.4 |
16.3 |
0.0 |
17.2 |
Non-Schedule |
60 |
590 |
0 |
650 |
166 |
1,718 |
0 |
1,884 |
226 |
2,308 |
0 |
2,534 |
% |
12.3 |
10.7 |
0.0 |
10.8 |
17.9 |
10.6 |
0.0 |
11.0 |
16.0 |
10.6 |
0.0 |
11.0 |
Total |
487 |
5,539 |
1 |
6,027 |
929 |
16,143 |
3 |
17,075 |
1,416 |
21,682 |
4 |
23,102 |
Table C15 Notes:
Source: Correctional Service of Canada.
In cases where the offender is serving a sentence for more than one offence, the data reflect the most serious offence.
The number of Indigenous offenders under CSC supervision has increased
Figure C16: Indigenous offender population
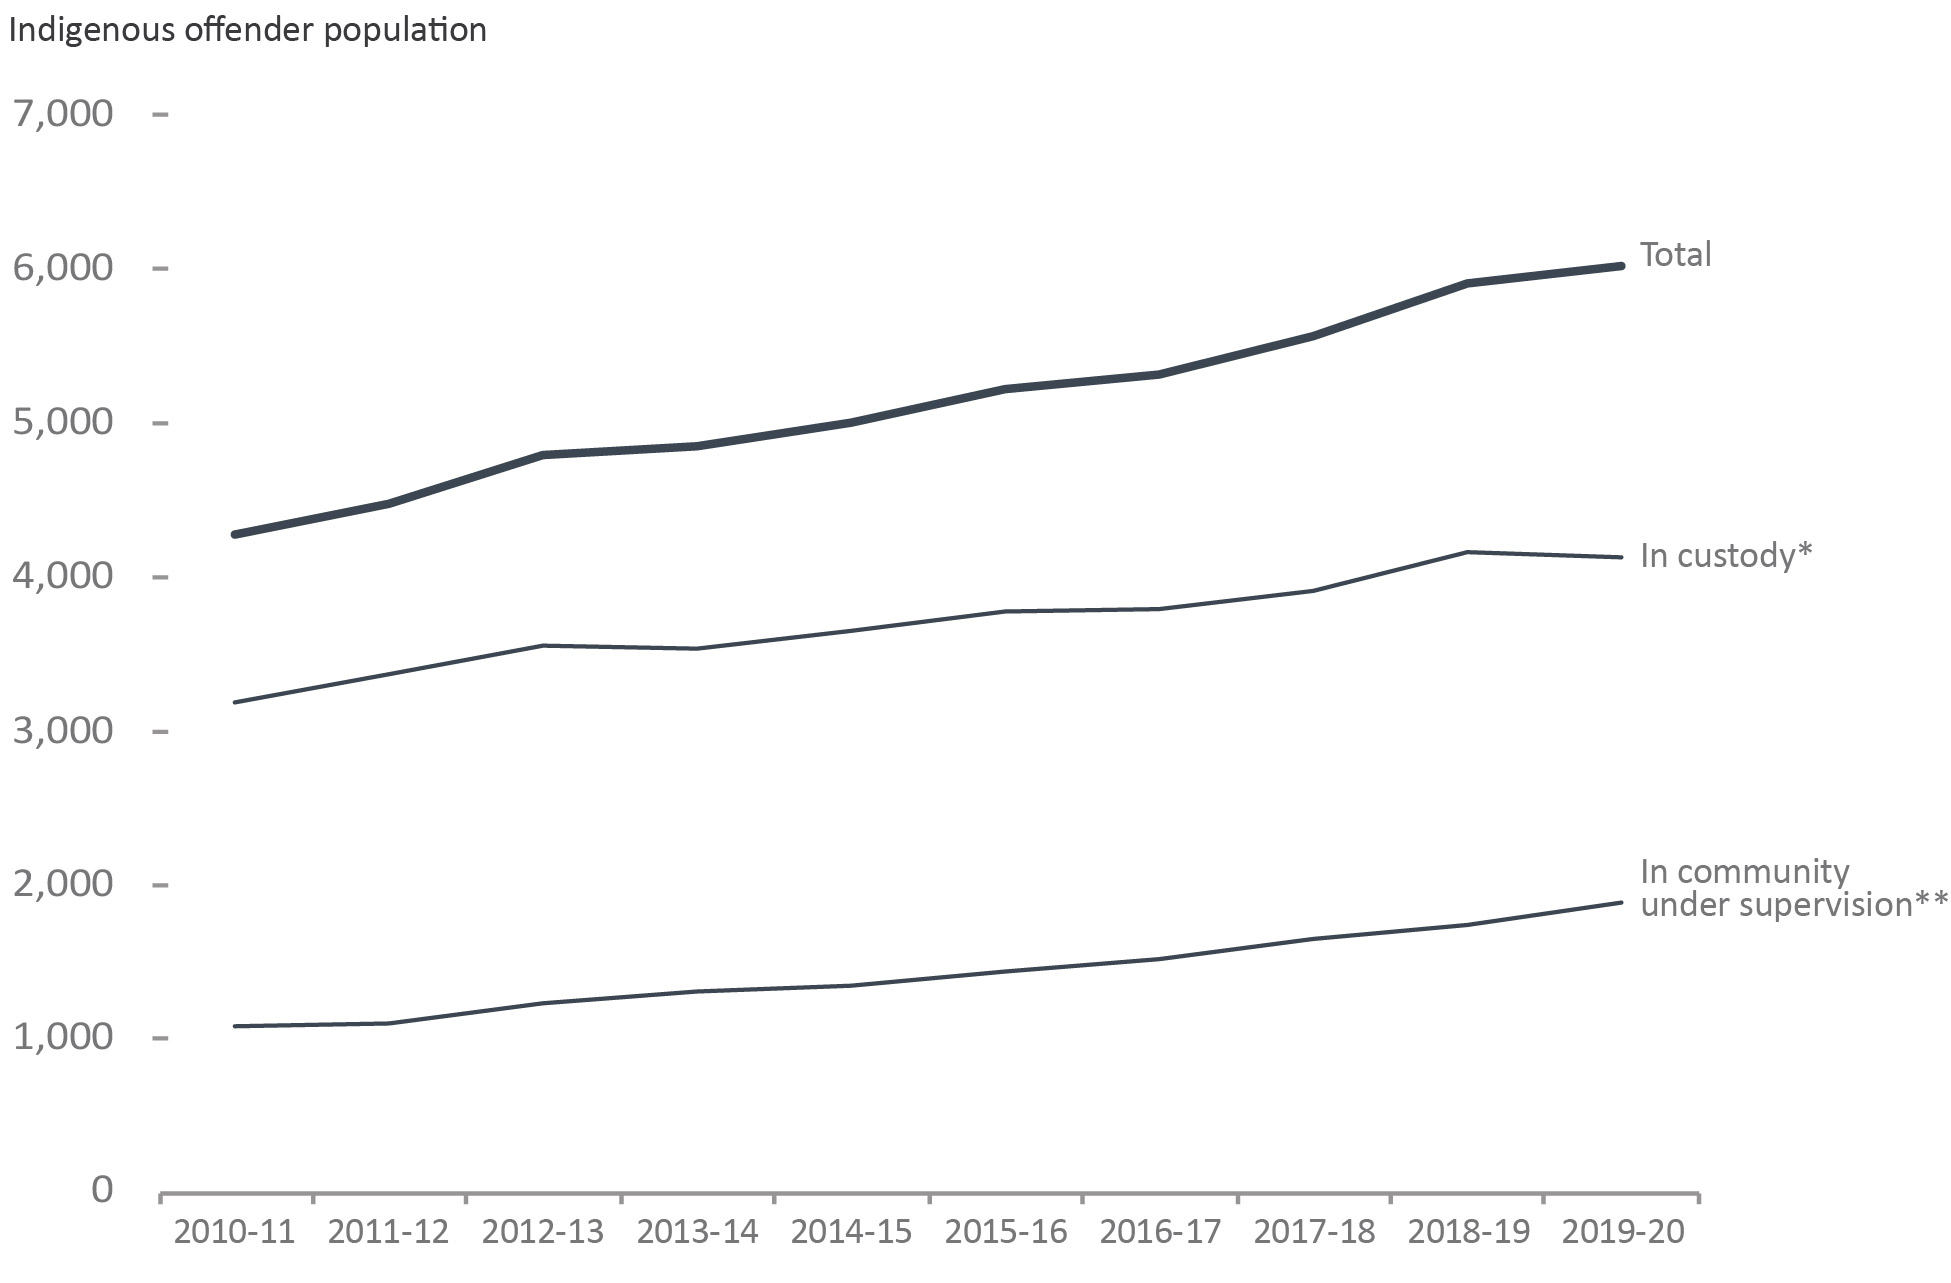
Image description
Year |
Total |
In CustodyFigure C16 footnote * |
In Community Under SupervisionFigure C16 footnote ** |
|---|---|---|---|
2010-11 |
4282 |
3193 |
1089 |
2011-12 |
4483 |
3376 |
1107 |
2012-13 |
4799 |
3561 |
1238 |
2013-14 |
4856 |
3542 |
1314 |
2014-15 |
5009 |
3657 |
1352 |
2015-16 |
5227 |
3783 |
1444 |
2016-17 |
5322 |
3798 |
1524 |
2017-18 |
5572 |
3917 |
1655 |
2018-19 |
5914 |
4168 |
1746 |
2019-20 |
6027 |
4,135 |
1892 |
Figure C16 Notes:
Source: Correctional Service of Canada.
- From 2010-2011 to 2019-20, the in-custody* Indigenous offender population increased by 29.5%, while the total Indigenous offender population increased 40.8% over the same period of time.
- The number of in-custody* Indigenous female offenders increased steadily from 196 in 2010-11 to 279 in 2019-20, an increase of 42.3%. The increase for in-custody* Indigenous male offenders was 28.6% for the same period, increasing from 2,997 to 3,855.
- From 2010-11 to 2019-20 the number of Indigenous offenders on community supervision** increased 73.7%, from 1,089 to 1,892. The Indigenous community population accounted for 20.2% of the total community population in 2019-20.
Indigenous Offenders |
Fiscal Year |
||||||
|---|---|---|---|---|---|---|---|
2015-16 |
2016-17 |
2017-18 |
2018-19 |
2019-20 |
|||
In CustodyTable C16 footnote * |
Atlantic Region |
Males |
157 |
175 |
184 |
224 |
234 |
Females |
12 |
8 |
14 |
19 |
18 |
||
Another Sex |
NR |
NR |
NR |
NR |
0 |
||
Quebec Region |
Males |
425 |
384 |
392 |
449 |
370 |
|
Females |
24 |
14 |
11 |
16 |
13 |
||
Another Sex |
NR |
NR |
NR |
NR |
0 |
||
Ontario Region |
Males |
453 |
487 |
534 |
558 |
612 |
|
Females |
39 |
37 |
43 |
50 |
49 |
||
Another Sex |
NR |
NR |
NR |
NR |
0 |
||
Prairie Region |
Males |
1,868 |
1,861 |
1,879 |
1,955 |
1,968 |
|
Females |
133 |
155 |
163 |
158 |
152 |
||
Another Sex |
NR |
NR |
NR |
NR |
0 |
||
Pacific Region |
Males |
629 |
638 |
658 |
691 |
671 |
|
Females |
43 |
39 |
39 |
48 |
47 |
||
Another Sex |
NR |
NR |
NR |
NR |
1 |
||
National Total |
Males |
3,532 |
3,545 |
3,647 |
3,877 |
3,855 |
|
Females |
251 |
253 |
270 |
291 |
279 |
||
Another Sex |
NR |
NR |
NR |
NR |
1 |
||
Total |
3,783 |
3,798 |
3,917 |
4,168 |
4,135 |
||
In Community Under SupervisionTable C16 footnote ** |
Atlantic Region |
Males |
68 |
71 |
88 |
83 |
106 |
Females |
10 |
11 |
9 |
10 |
13 |
||
Another Sex |
NR |
NR |
NR |
NR |
0 |
||
Quebec Region |
Males |
185 |
185 |
181 |
162 |
182 |
|
Females |
18 |
10 |
6 |
9 |
8 |
||
Another Sex |
NR |
NR |
NR |
NR |
0 |
||
Ontario Region |
Males |
204 |
201 |
231 |
239 |
277 |
|
Females |
24 |
31 |
29 |
31 |
28 |
||
Another Sex |
NR |
NR |
NR |
NR |
0 |
||
Prairie Region |
Males |
560 |
604 |
645 |
720 |
750 |
|
Females |
77 |
78 |
111 |
113 |
119 |
||
Another Sex |
NR |
NR |
NR |
NR |
0 |
||
Pacific Region |
Males |
276 |
301 |
319 |
344 |
369 |
|
Females |
22 |
32 |
36 |
35 |
40 |
||
Another Sex |
NR |
NR |
NR |
NR |
0 |
||
National Total |
Males |
1,293 |
1,362 |
1,464 |
1,548 |
1,684 |
|
Females |
151 |
162 |
191 |
198 |
208 |
||
Another Sex |
NR |
NR |
NR |
NR |
0 |
||
Total |
1,444 |
1,524 |
1,655 |
1,746 |
1,892 |
||
Total Offender PopulationTable C16 footnote *** |
5,227 |
5,322 |
5,572 |
5,914 |
6,027 |
||
Table C16 Notes:
Source: Correctional Service of Canada.
Regional statistics for the Correctional Service of Canada account for data relating to the northern territories in the following manner: data for Nunavut are reported in the Ontario Region, data for the Northwest Territories are reported in the Prairies Region, and data for the Yukon are reported in the Pacific Region.
NR is the short form for not reported.
The total number of admissions to administrative segregationFigure C17 footnote * in a federal institution has decreased
Figure C17: Number of admissions to administrative segregationFigure C17 footnote *

Image description
Year |
Males |
Non-Indigenous |
Indigenous |
Females |
|---|---|---|---|---|
2015-16 |
6,411 |
4,651 |
2,137 |
377 |
2016-17 |
5,746 |
3,929 |
2,108 |
290 |
2017-18 |
5,089 |
3,322 |
1,972 |
205 |
2018-19 |
5,282 |
3,319 |
2,120 |
157 |
2019-20Figure C17 footnote ** |
2,822 |
1,752 |
1,143 |
73 |
Figure C17 Notes:
Source: Correctional Service of Canada.
- Between April 1, 2019 and November 30, 2019, there were 2,895 admissions to administrative segregationFigure C17 footnote *. Of the total admissions to administrative segregationFigure C17 footnote *, 2,822 were male and 73 were female. Indigenous offenders accounted for 39.5% of admissions to administrative segregationFigure C17 footnote *.
These reports count admissions, not offenders. Offenders admitted multiple times to segregation are counted once for each admission.
Year and Type of Administrative SegregationTable C17 footnote * |
By Sex |
By Race |
||||||
|---|---|---|---|---|---|---|---|---|
Females |
Males |
Another Sex |
Total |
Indigenous |
Non-Indigenous |
Total |
||
2015-16 |
CCRA 31(3-A) Involuntary |
342 |
4,200 |
0 |
4,542 |
1,378 |
3,164 |
4,542 |
CCRA 31(3-B) |
2 |
235 |
0 |
237 |
94 |
143 |
237 |
|
CCRA 31(3-C) |
33 |
1,976 |
0 |
2,009 |
665 |
1,344 |
2,009 |
|
Total |
377 |
6,411 |
0 |
6,788 |
2,137 |
4,651 |
6,788 |
|
2016-17 |
CCRA 31(3-A) Involuntary |
271 |
3,825 |
0 |
4,096 |
1,381 |
2,715 |
4,096 |
CCRA 31(3-B) |
3 |
273 |
0 |
276 |
75 |
201 |
276 |
|
CCRA 31(3-C) |
16 |
1,648 |
1 |
1,665 |
652 |
1,013 |
1,665 |
|
Total |
290 |
5,746 |
1 |
6,037 |
2,108 |
3,929 |
6,037 |
|
2017-18 |
CCRA 31(3-A) Involuntary |
183 |
3,162 |
0 |
3,345 |
1,195 |
2,150 |
3,345 |
CCRA 31(3-B) |
10 |
229 |
0 |
239 |
79 |
160 |
239 |
|
CCRA 31(3-C) |
12 |
1,698 |
0 |
1,710 |
698 |
1,012 |
1,710 |
|
Total |
205 |
5,089 |
0 |
5,294 |
1,972 |
3,322 |
5,294 |
|
2018-19 |
CCRA 31(3-A) Involuntary |
134 |
3,010 |
0 |
3,144 |
1,175 |
1,969 |
3,144 |
CCRA 31(3-B) |
5 |
161 |
0 |
166 |
52 |
114 |
166 |
|
CCRA 31(3-C) |
18 |
2,111 |
0 |
2,129 |
893 |
1,236 |
2,129 |
|
Total |
157 |
5,282 |
0 |
5,439 |
2,120 |
3,319 |
5,439 |
|
2019-20Table C17 footnote ** |
CCRA 31(3-A)Involuntary |
57 |
1,599 |
0 |
1,656 |
661 |
995 |
1,656 |
CCRA 31(3-B) |
5 |
60 |
0 |
65 |
25 |
40 |
65 |
|
CCRA 31(3-C) |
11 |
1,163 |
0 |
1,174 |
457 |
717 |
1,174 |
|
Total |
73 |
2,822 |
0 |
2,895 |
1,143 |
1,752 |
2,895 |
|
Table C17 Notes:
Source: Correctional Service of Canada.
These reports count admissions, not offenders. Offenders admitted multiple times to segregation are counted once for each admission.
72% of placements in administrative segregationFigure C18 footnote * in a CSC facility were for less than 30 days
Figure C18: Percentage of federal offenders admitted to administrative segregation (2019-20)**
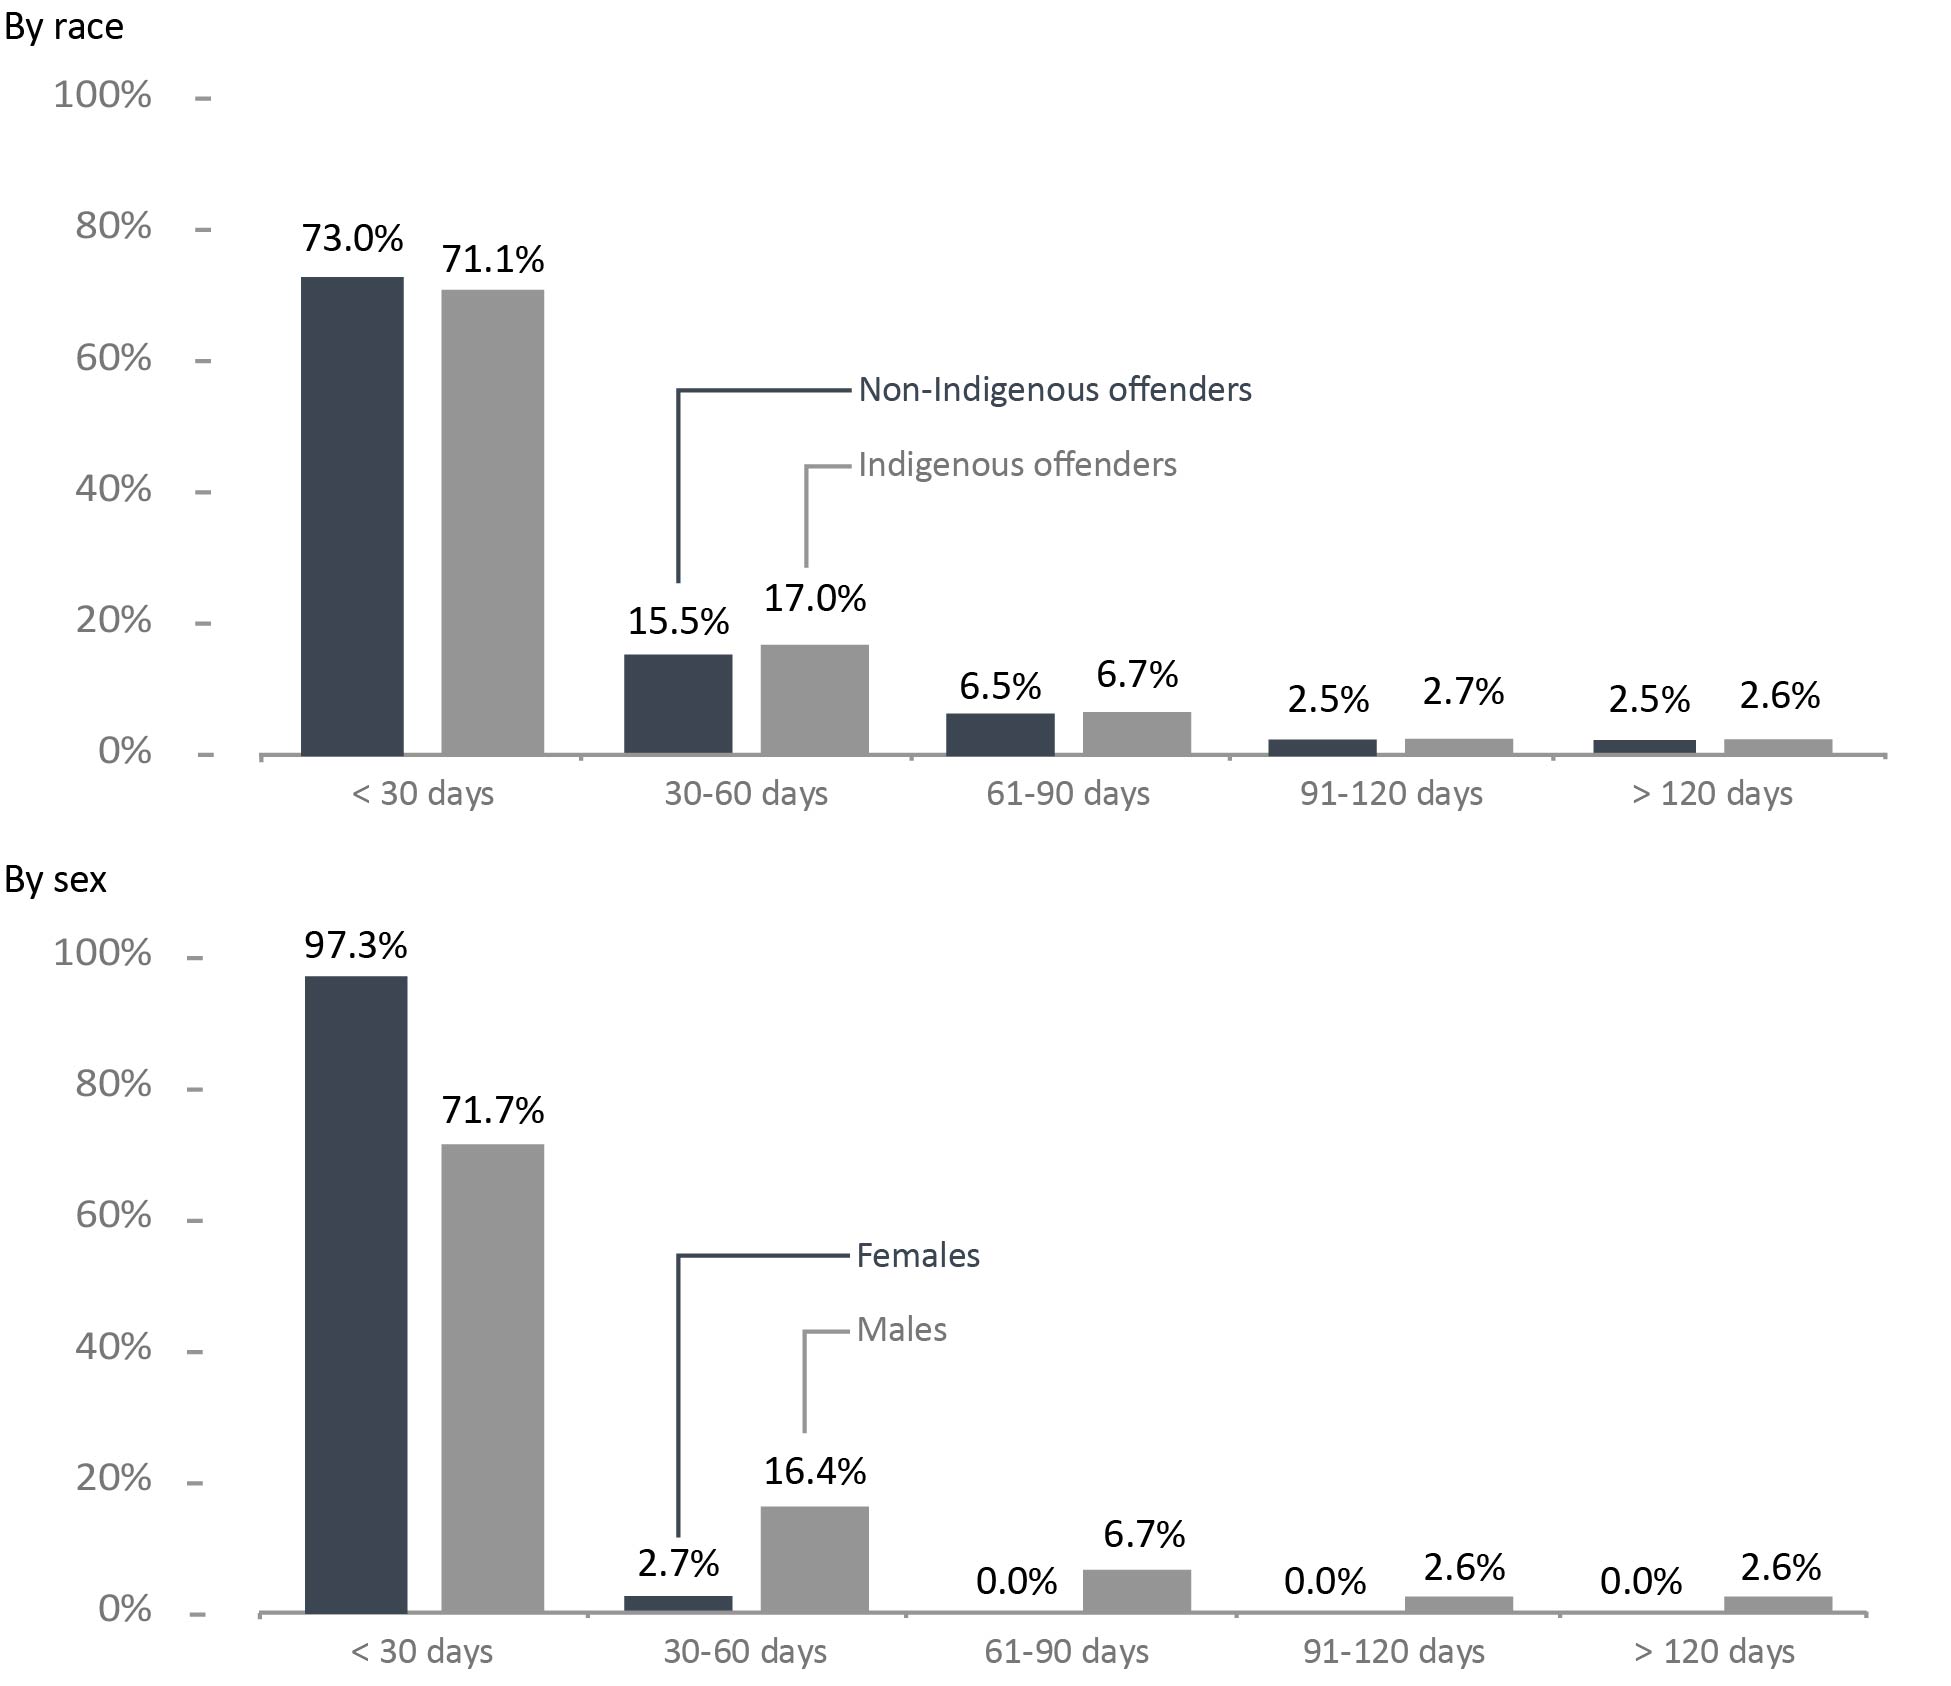
Image description
By race |
Non-Indigenous Offenders Percent |
Indigenous Offenders Percent |
|||
|---|---|---|---|---|---|
Less than 30 days |
73 |
71.1 |
|||
| 30-60 days | 15.5 |
17.0 |
|||
| 61-90 days | 6.5 |
6.7 |
|||
| 91-120 days | 2.5 |
2.7 |
|||
| More than 120 days | 2.5 |
2.6 |
|||
By sex |
Females Percent |
Males Percent |
|||
Less than 30 days |
97.3 |
71.7 |
|||
30-60 days |
2.7 |
16.4 |
|||
61-90 days |
0.0 |
6.7 |
|||
91-120 days |
0.0 |
2.6 |
|||
More than 120 days |
0.0 |
2.6 |
|||
Figure C18 Notes:
Source: Correctional Service of Canada.
- Between April 1, 2019 and November 30, 2019, there were 3,216 administrative segregationFigure C18 footnote * periods that ended in federal institutions. Most (72.2%) placements in administrative segregationFigure C18 footnote * ended in less than 30 days, and 16.1% lasted between 30 and 60 days. 2.5% of placements in administrative segregationFigure C18 footnote * ended after more than 120 days.
- 97.3% of placements of female in administrative segregationFigure C18 footnote * ended in less than 30 days.
- The number of admissions to administrative segregationFigure C18 footnote * that resulted in placements lasting more than 120 days in administrative segregation was 2.6% for Indigenous and 2.5% for non-Indigenous offenders.
These reports count admissions, not offenders. Offenders admitted multiple times to segregation are counted once for each admission.
Length of Stay in Administrative SegregationTable C18 footnote * |
By Sex |
By Race |
Total |
|||||||
|---|---|---|---|---|---|---|---|---|---|---|
Females |
Males |
Indigenous |
Non- Indigenous |
|||||||
2019-20 |
# |
% |
# |
% |
# |
% |
# |
% |
# |
% |
< 30 days |
71 |
97.3 |
2,252 |
71.7 |
909 |
71.1 |
1,414 |
73.0 |
2,323 |
72.2 |
30-60 days |
2 |
2.7 |
515 |
16.4 |
217 |
17.0 |
300 |
15.5 |
517 |
16.1 |
61-90 days |
0 |
0.0 |
212 |
6.7 |
86 |
6.7 |
126 |
6.5 |
212 |
6.6 |
91-120 days |
0 |
0.0 |
83 |
2.6 |
34 |
2.7 |
49 |
2.5 |
83 |
2.6 |
> 120 days |
0 |
0.0 |
81 |
2.6 |
33 |
2.6 |
48 |
2.5 |
81 |
2.5 |
Total |
73 |
100 |
3,143 |
100 |
1,279 |
100 |
1,937 |
100 |
3,216 |
100 |
Table C18 Notes:
Source: Correctional Service of Canada.
These reports count admissions, not offenders. Offenders admitted multiple times to segregation are counted once for each admission.
The number of offender deaths while in custody
Figure C19: The number of deaths in federal and provincial/territorial custody by cause of death
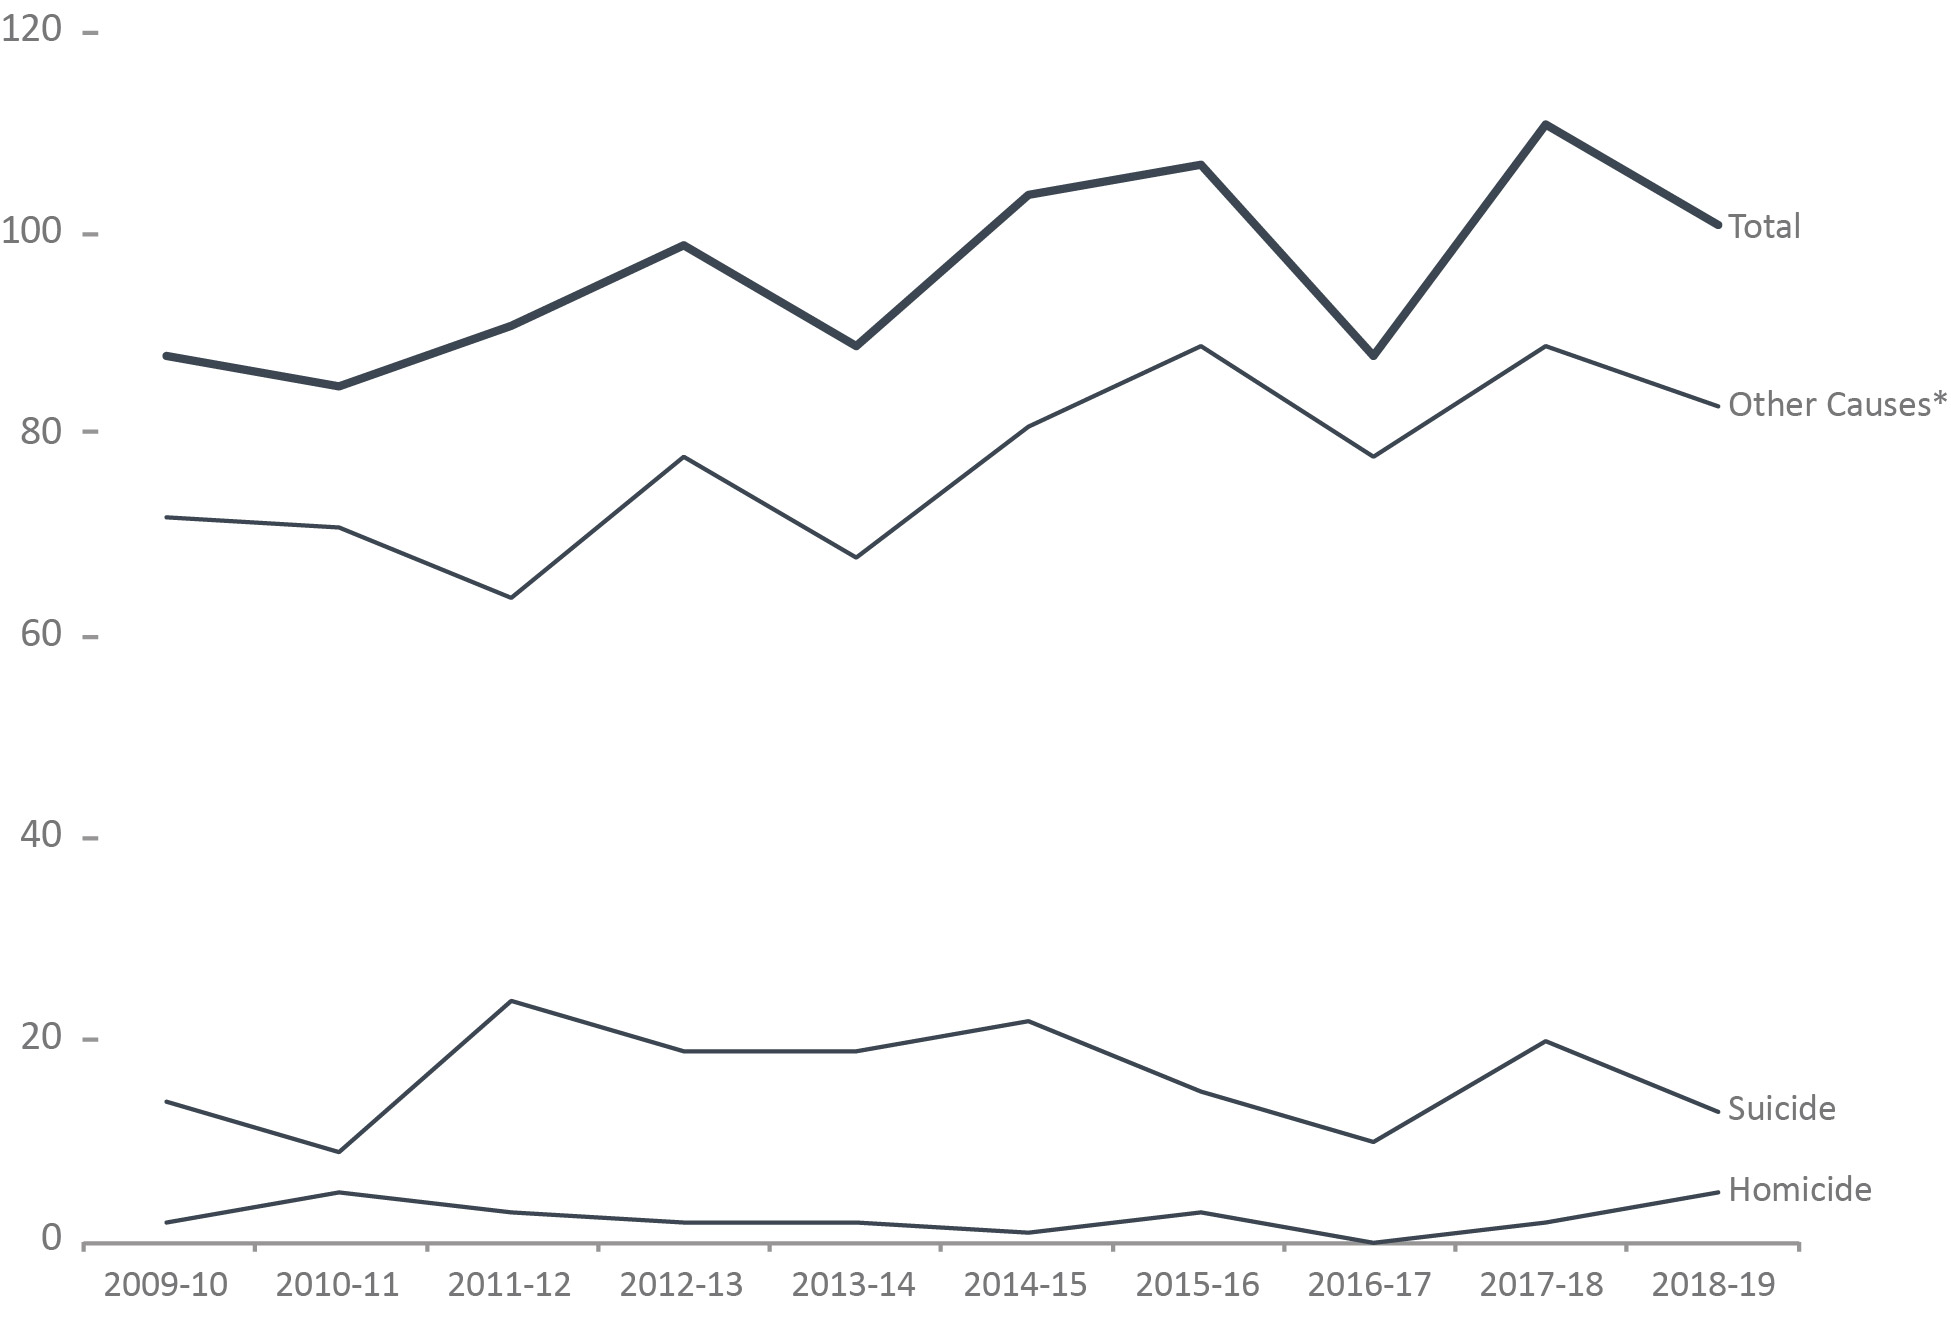
Image description
| Year | Homicide | Suicide | Other Causes* | Total | |||
|---|---|---|---|---|---|---|---|
| Federal | # | % | # | % | # | % | # |
| 2009/2010 | 1 | 2 | 9 | 18.4 | 39 | 79.6 | 49 |
| 2010/2011 | 5 | 10 | 4 | 8 | 41 | 82 | 50 |
| 2011/2012 | 3 | 5.7 | 8 | 15.1 | 42 | 79.2 | 53 |
| 2012/2013 | 1 | 1.8 | 11 | 20 | 43 | 78.2 | 55 |
| 2013/2014 | 1 | 2.1 | 9 | 18.8 | 38 | 79.2 | 48 |
| 2014/2015 | 1 | 1.5 | 13 | 19.4 | 53 | 79.1 | 67 |
| 2015/2016 | 3 | 4.6 | 9 | 13.8 | 53 | 81.5 | 65 |
| 2016/2017 | 0 | 0 | 3 | 6.4 | 44 | 93.6 | 47 |
| 2017/2018 | 2 | 3.6 | 6 | 10.9 | 47 | 85.5 | 55 |
| 2018/2019 | 5 | 9.8 | 6 | 11.8 | 40 | 78.4 | 51 |
| Total | 22 | 4.1 | 78 | 14.4 | 440 | 81.5 | 540 |
| Provincial and Territories | # | % | # | % | # | % | # |
| 2009/2010 | 1 | 2.6 | 5 | 12.8 | 33 | 84.6 | 39 |
| 2010/2011 | 0 | 0 | 5 | 14.3 | 30 | 85.7 | 35 |
| 2011/2012 | 0 | 0 | 16 | 42.1 | 22 | 57.9 | 38 |
| 2012/2013 | 1 | 2.3 | 8 | 18.2 | 35 | 79.5 | 44 |
| 2013/2014 | 1 | 2.4 | 10 | 24.4 | 30 | 73.2 | 41 |
| 2014/2015 | 0 | 0 | 9 | 24.3 | 28 | 75.7 | 37 |
| 2015/2016 | 0 | 0 | 6 | 14.3 | 36 | 85.7 | 42 |
| 2016/2017 | 0 | 0 | 7 | 17.1 | 34 | 82.9 | 41 |
| 2017/2018 | 0 | 0 | 14 | 25 | 42 | 75 | 56 |
| 2018/2019 | 0 | 0 | 7 | 14 | 43 | 86 | 50 |
| Total | 3 | 0.7 | 87 | 20.6 | 333 | 78.7 | 423 |
| Total Federal and Provincial Offender Deaths | 25 | 4.8 | 165 | 35 | 773 | 160.2 | 963 |
Figure C19 Notes:
Source: Adult Correctional Services Survey, Canadian Centre for Justice and Community Safety Statistics, Statistics Canada.
- In the ten-year period from 2009-10 to 2018-19, a total of 540 federal offenders and 423 provincial/territorial offenders died while in custody. During this time period, suicides accounted for 14.4% of federal offender deaths and 20.6% of provincial offender deaths. The suicide rate** was approximately 55 per 100,000 for incarcerated federal offenders, and approximately 36 per 100,000 for incarcerated provincial offenders. These rates are significantly higher than the 2009 rate of 11.5 suicides per 100,000 people in Canada.
- Between 2009-10 and 2018-19, 4.1% of federal offender deaths and 0.7% of provincial offender deaths were due to homicide. The homicide rate for incarcerated federal offenders was approximately 13.0 per 100,000 and 1.6 per 100,000 for incarcerated provincial offenders. The federal rate is significantly higher than the national homicide rate of 1.8 per 100,000 people in 2018.
The data on cause of death are subject to change following an official review or investigation, and should be used/interpreted with caution. The data presented were provided by the Canadian Centre for Justice and Community Safety Statistics at Statistics Canada, and may not reflect the outcome of recent reviews or investigations or cause of death.
The figure includes data from the most recent year available at the time of publication.
Year |
Homicide |
Suicide |
Other CausesTable C19 footnote * |
Total |
||||
|---|---|---|---|---|---|---|---|---|
# |
% |
# |
% |
# |
% |
# |
||
Federal |
2009/2010 |
1 |
2.0 |
9 |
18.4 |
39 |
79.6 |
49 |
2010/2011 |
5 |
10.0 |
4 |
8.0 |
41 |
82.0 |
50 |
|
2011/2012 |
3 |
5.7 |
8 |
15.1 |
42 |
79.2 |
53 |
|
2012/2013 |
1 |
1.8 |
11 |
20.0 |
43 |
78.2 |
55 |
|
2013/2014 |
1 |
2.1 |
9 |
18.8 |
38 |
79.2 |
48 |
|
2014/2015 |
1 |
1.5 |
13 |
19.4 |
53 |
79.1 |
67 |
|
2015/2016 |
3 |
4.6 |
9 |
13.8 |
53 |
81.5 |
65 |
|
2016/2017 |
0 |
0.0 |
3 |
6.4 |
44 |
93.6 |
47 |
|
2017/2018 |
2 |
3.6 |
6 |
10.9 |
47 |
85.5 |
55 |
|
2018/2019 |
5 |
9.8 |
6 |
11.8 |
40 |
78.4 |
51 |
|
Total |
22 |
4.1 |
78 |
14.4 |
440 |
81.5 |
540 |
|
Provincial and Territories |
2009/2010 |
1 |
2.6 |
5 |
12.8 |
33 |
84.6 |
39 |
2010/2011 |
0 |
0.0 |
5 |
14.3 |
30 |
85.7 |
35 |
|
2011/2012 |
0 |
0.0 |
16 |
42.1 |
22 |
57.9 |
38 |
|
2012/2013 |
1 |
2.3 |
8 |
18.2 |
35 |
79.5 |
44 |
|
2013/2014 |
1 |
2.4 |
10 |
24.4 |
30 |
73.2 |
41 |
|
2014/2015 |
0 |
0.0 |
9 |
24.3 |
28 |
75.7 |
37 |
|
2015/2016 |
0 |
0.0 |
6 |
14.3 |
36 |
85.7 |
42 |
|
2016/2017 |
0 |
0.0 |
7 |
17.1 |
34 |
82.9 |
41 |
|
2017/2018 |
0 |
0.0 |
14 |
25.0 |
42 |
75.0 |
56 |
|
2018/2019 |
0 |
0.0 |
7 |
14.0 |
43 |
86.0 |
50 |
|
Total |
3 |
0.7 |
87 |
20.6 |
333 |
78.7 |
423 |
|
Total Federal and Provincial Offender Deaths |
25 |
4.8 |
165 |
35.0 |
773 |
160.2 |
963 |
|
Table C19 Notes:
Source: Adult Correctional Services Survey, Canadian Centre for Justice and Community Safety Statistics, Statistics Canada.
The data on cause of death are subject to change following an official review or investigation, and should be used/interpreted with caution. The data presented were provided by the Canadian Centre for Justice and Community Safety Statistics at Statistics Canada and may not reflect the outcome of recent reviews or investigations on cause of death.
The number of escapees from federal institutions
Figure C20: Number of escapees from federal institutions
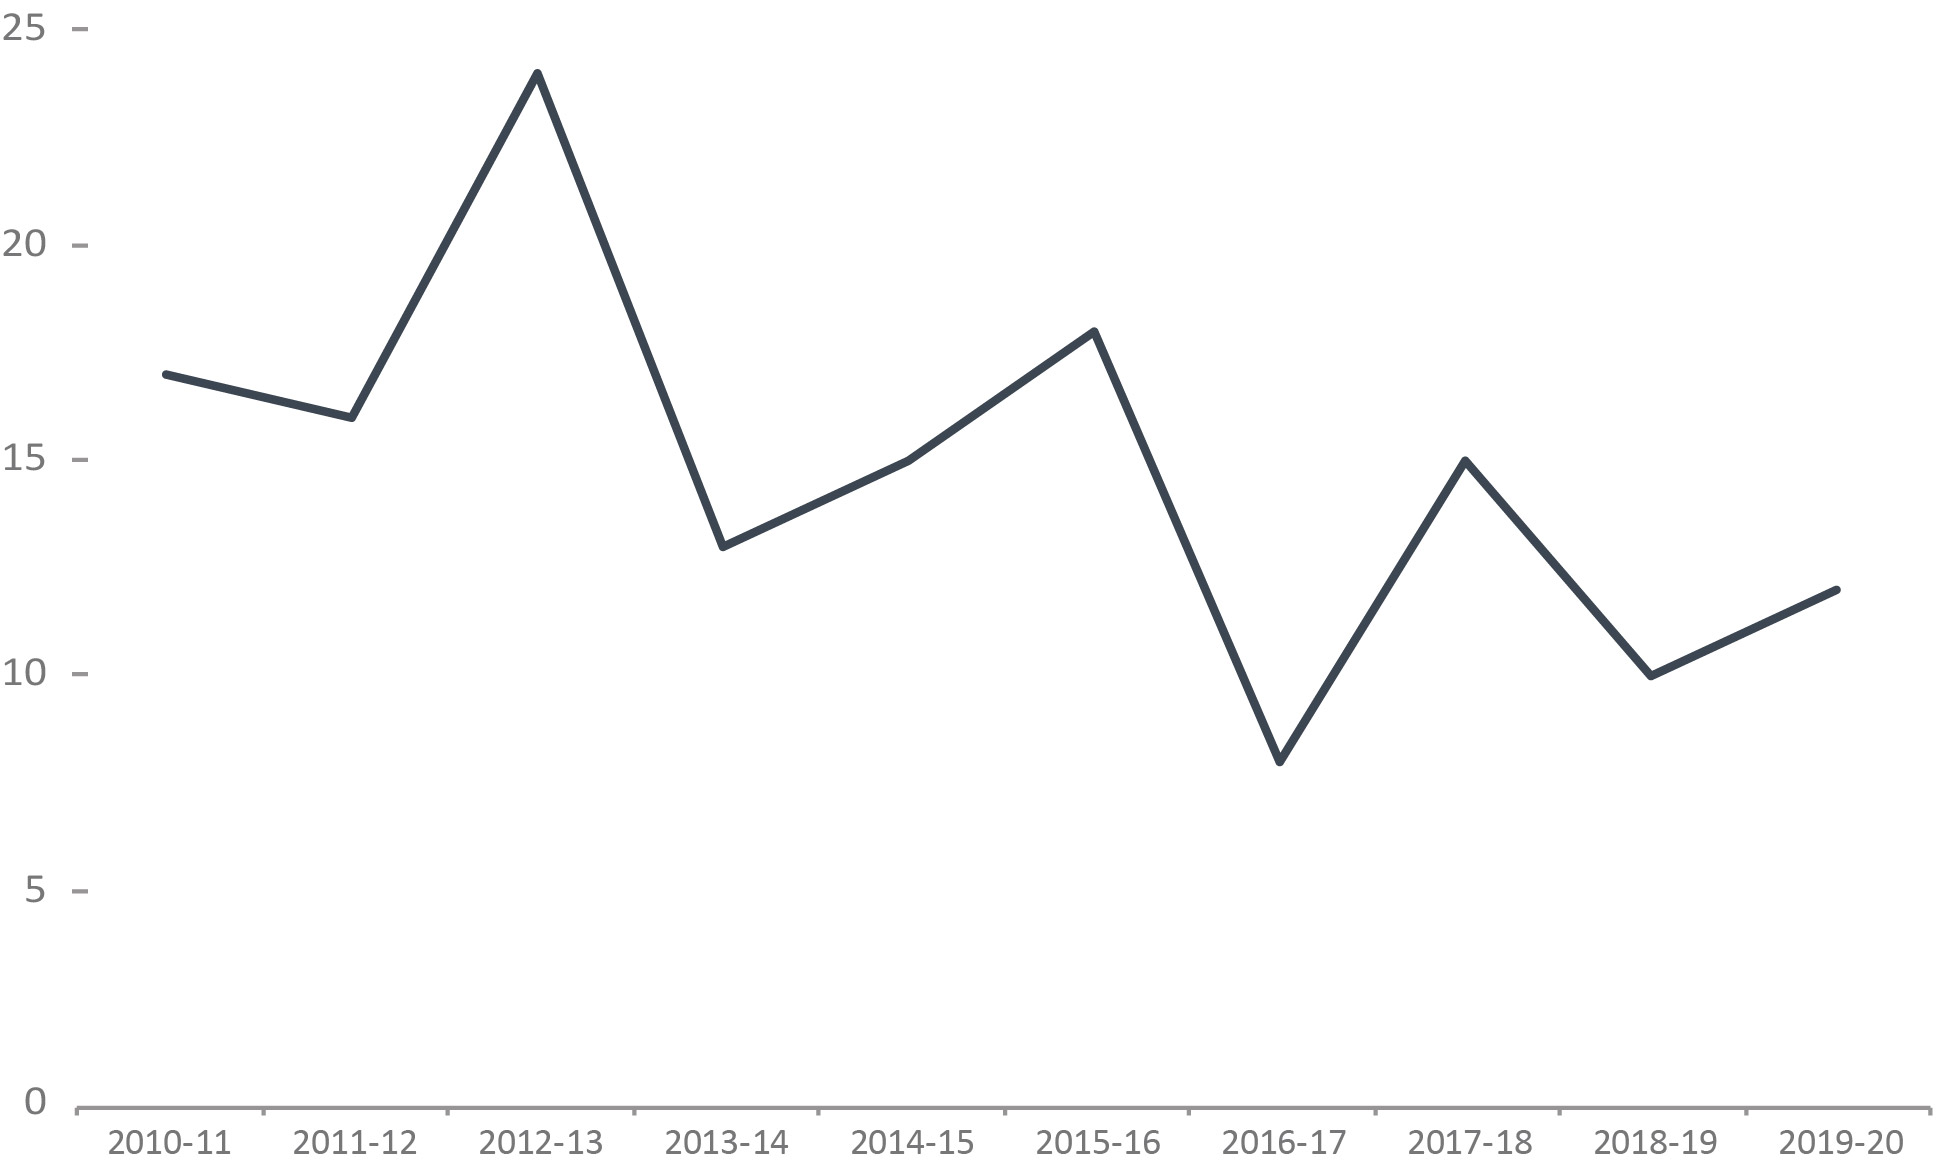
Image description
Exercice |
Total Number of Escapees |
|---|---|
2010-11 |
17 |
2011-12 |
16 |
2012-13 |
24 |
2013-14 |
13 |
2014-15 |
15 |
2015-16 |
18 |
2016-17 |
8 |
2017-18 |
15 |
2018-19 |
10 |
2019-20 |
12 |
Figure C20 Notes:
Source: Correctional Service of Canada.
- In 2019-20, there were 10 escape incidents involving a total of 12 offenders. All of the 12 offenders were recaptured.
- Offenders who escaped from federal institutions in 2019-20 represented 0.1% of the in-custody population.
The data represent the number of escape incidents from federal facilities during each fiscal year. An escape can involve more than one offender.
These numbers are subject to change further to new information becoming available.
A fiscal year runs from April 1 to March 31 of the following year.
Escapes |
2014-15 |
2015-16 |
2016-17 |
2017-18 |
2018-19 |
2019-20 |
|---|---|---|---|---|---|---|
Total Number of Escape Incidents |
14 |
15 |
8 |
11 |
10 |
10 |
Total Number of Escapees |
15 |
18 |
8 |
15 |
10 |
12 |
Table C20 Notes:
Source: Correctional Service of Canada.
The data represent the number of escape incidents from federal facilities during each fiscal year. An escape can involve more than one offender.
These numbers are subject to change further to new information becoming available.
A fiscal year runs from April 1 to March 31 of the following year.
The population of offenders in the community under supervision by CSC has increased
Figure C21: In community under supervision population at fiscal year endFigure C21 footnote *
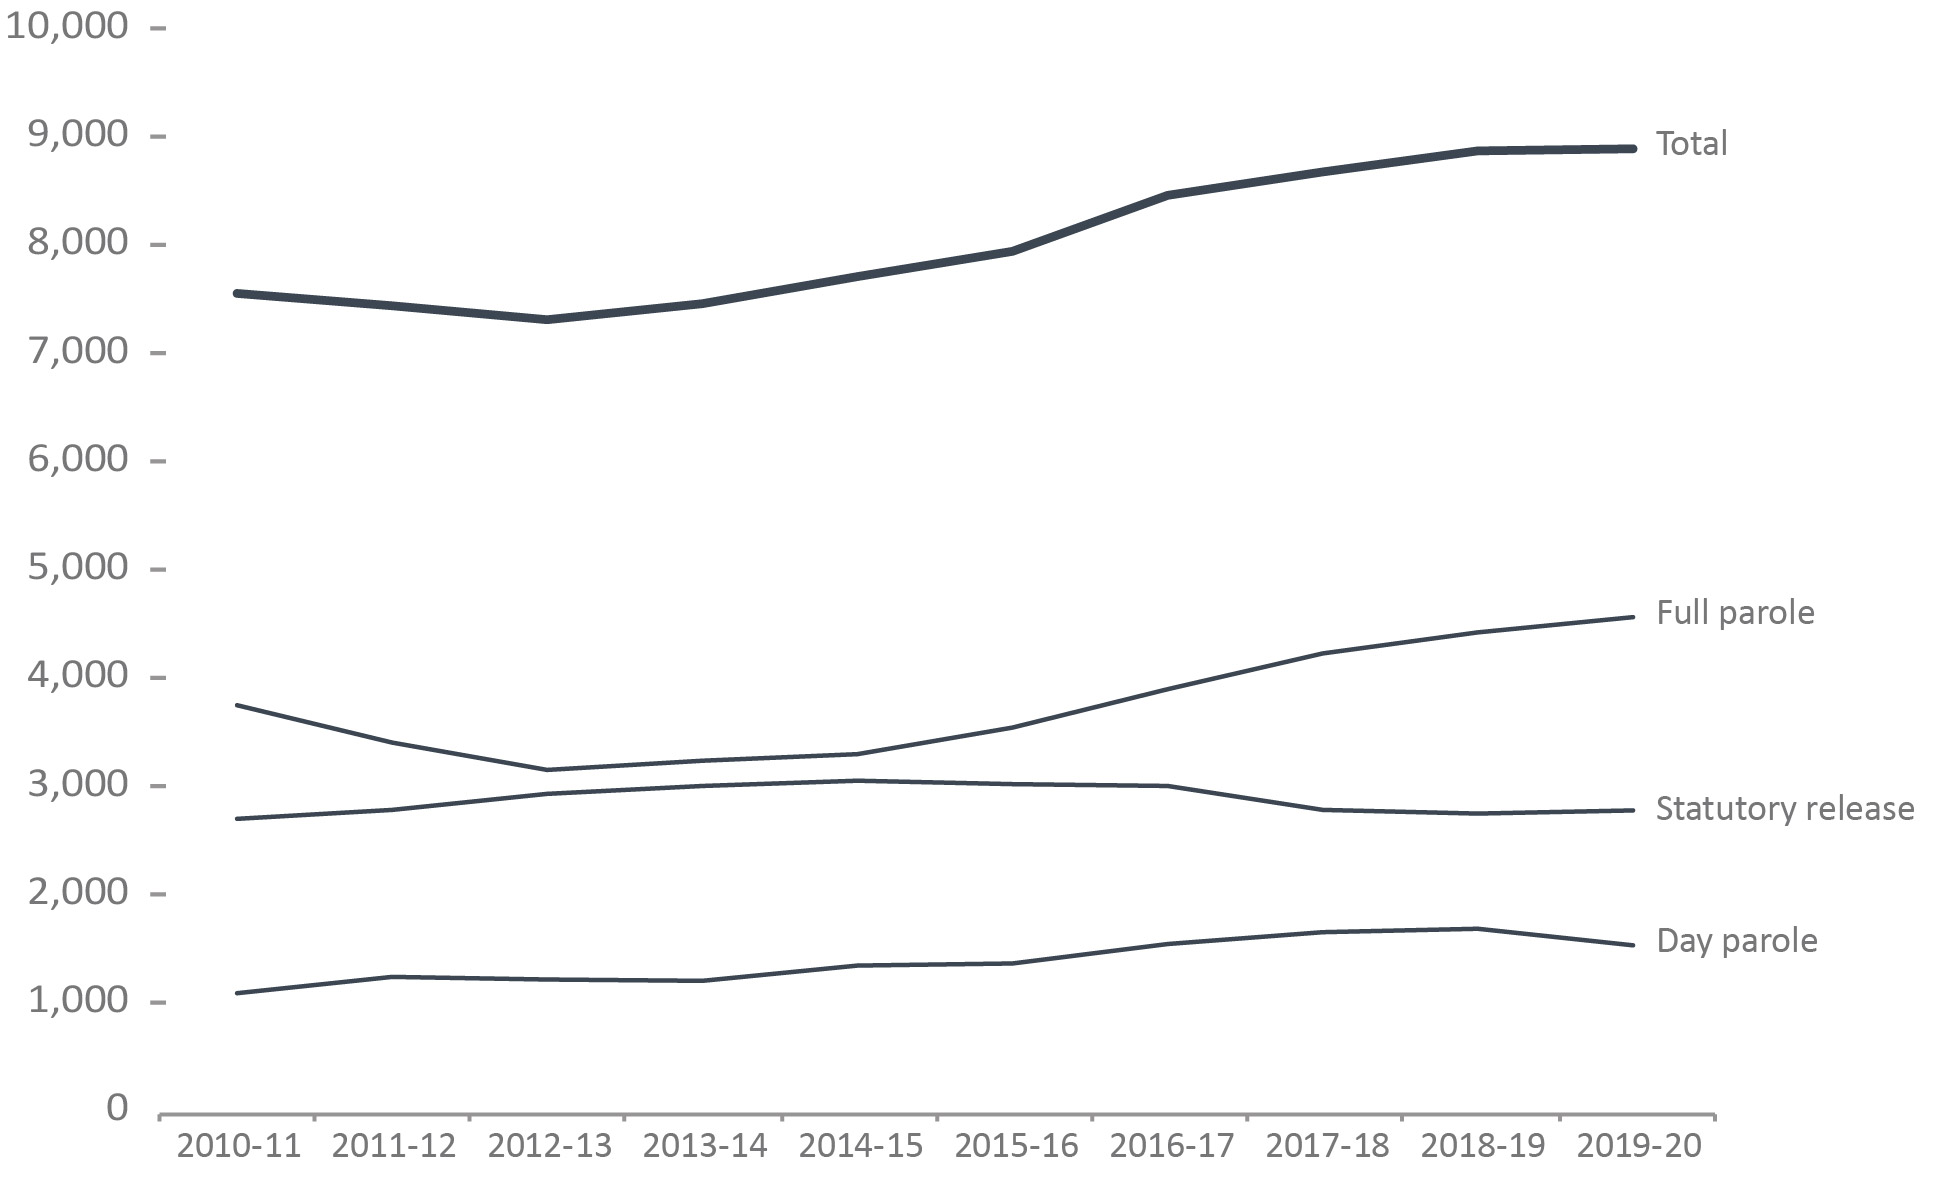
Image description
Year |
Total |
Full Parole |
Statutory Release |
Day Parole |
|---|---|---|---|---|
2010-11 |
7558 |
3755 |
2707 |
1096 |
2011-12 |
7445 |
3411 |
2788 |
1246 |
2012-13 |
7316 |
3157 |
2937 |
1222 |
2013-14 |
7463 |
3242 |
3011 |
1210 |
2014-15 |
7714 |
3304 |
3059 |
1351 |
2015-16 |
7947 |
3549 |
3026 |
1372 |
2016-17 |
8463 |
3903 |
3010 |
1550 |
2017-18 |
8681 |
4233 |
2789 |
1659 |
2018-19 |
8875 |
4429 |
2754 |
1692 |
2019-20 |
8894 |
4570 |
2784 |
1539 |
Figure C21 Notes:
Source: Correctional Service of Canada.
- Over the past 5 years, the total offender population supervised in the community increased by 11.9%. For the same period, the total number of offenders on full parole increased by 28.8% while the proportion of offenders on statutory release decreased by 8.0%. At the end of fiscal year 2019-20, there were 8,172 male, 721 female and one offender who identified as another sex on active community supervision.
- Over the last 10 years, the total offender population supervised in the community increased by 17.7%. For the same period, the total number of offenders on full parole increased by 21.7% and the proportion of offenders on statutory release increased by 2.8%.
The data reflect the offender population in the community under supervision which includes all active offenders on day parole, full parole, statutory release, offenders who are temporarily detained in a non-CSC facility, offenders who are unlawfully at large for less than 90 days, offenders on remand in a non-CSC facility, and offenders supervised and subject to an immigration hold by Canada Border Services Agency.
The data presented above do not include offenders who were on long term supervision orders (See Figure/Table E4).
Day parole is a type of conditional release granted by the Parole Board of Canada whereby offenders are permitted to participate in community-based activities in preparation for full parole or statutory release. The conditions require offenders to return nightly to an institution or half-way house unless otherwise authorized by the Parole Board of Canada.
Full parole is a type of conditional release granted by the Parole Board of Canada whereby the remainder of the sentence is served under supervision in the community.
Statutory release refers to a conditional release that is subject to supervision after the offender has served two-thirds of the sentence.
Percent change is measured from the previous year.
Year |
Day Parole |
Full Parole |
Statutory Release |
Totals |
% changeTable C21 footnote * |
|||||||||
|---|---|---|---|---|---|---|---|---|---|---|---|---|---|---|
Females |
Males |
Another Sex |
Females |
Males |
Another Sex |
Females |
Males |
Another Sex |
Females |
Males |
Another Sex |
Total |
Both |
|
2010-11 |
79 |
1,017 |
NR |
314 |
3,441 |
NR |
109 |
2,598 |
NR |
502 |
7,056 |
NR |
7,558 |
NR |
2011-12 |
123 |
1,123 |
NR |
257 |
3,154 |
NR |
127 |
2,661 |
NR |
507 |
6,938 |
NR |
7,445 |
-1.5 |
2012-13 |
116 |
1,106 |
NR |
225 |
2,932 |
NR |
136 |
2,801 |
NR |
477 |
6,839 |
NR |
7,316 |
-1.7 |
2013-14 |
106 |
1,104 |
NR |
225 |
3,017 |
NR |
153 |
2,858 |
NR |
484 |
6,979 |
NR |
7,463 |
2.0 |
2014-15 |
115 |
1,236 |
NR |
239 |
3,065 |
NR |
150 |
2,909 |
NR |
504 |
7,210 |
NR |
7,714 |
3.4 |
2015-16 |
124 |
1,248 |
NR |
273 |
3,276 |
NR |
177 |
2,849 |
NR |
574 |
7,373 |
NR |
7,947 |
3.0 |
2016-17 |
158 |
1,392 |
NR |
316 |
3,587 |
NR |
154 |
2,856 |
NR |
628 |
7,835 |
NR |
8,463 |
6.5 |
2017-18 |
197 |
1,462 |
NR |
369 |
3,864 |
NR |
145 |
2,644 |
NR |
711 |
7,970 |
NR |
8,681 |
2.6 |
2018-19 |
192 |
1,500 |
NR |
370 |
4,059 |
NR |
159 |
2,595 |
NR |
721 |
8,154 |
NR |
8,875 |
2.2 |
2019-20 |
163 |
1,376 |
0 |
406 |
4,164 |
1 |
152 |
2,632 |
0 |
721 |
8,172 |
1 |
8,894 |
0.2 |
Table C21 Notes:
Source: Correctional Service of Canada.
The data reflect the offender population in the community under supervision which includes all active offenders on day parole, full parole, statutory release, offenders who are temporarily detained in a non-CSC facility, offenders who are unlawfully at large for less than 90 days, offenders on remand in a non-CSC facility, and offenders supervised and subject to an immigration hold by Canada Border Services Agency.
The data presented above do not include offenders who were on long term supervision orders (See Figure/Table E4).
Day parole is a type of conditional release granted by the Parole Board of Canada whereby offenders are permitted to participate in community-based activities in preparation for full parole or statutory release. The conditions require offenders to return nightly to an institution or half-way house unless otherwise authorized by the Parole Board of Canada.
Full parole is a type of conditional release granted by the Parole Board of Canada whereby the remainder of the sentence is served under supervision in the community.
Statutory release refers to a conditional release that is subject to supervision after the offender has served two-thirds of the sentence.
These cases reflect the number of offenders on active supervision at fiscal year end. A fiscal year runs from April 1 to March 31 of the following year.
NR is the short form for not reported.
The provincial/territorial community corrections population has decreased
Figure C22: Average monthly offender counts
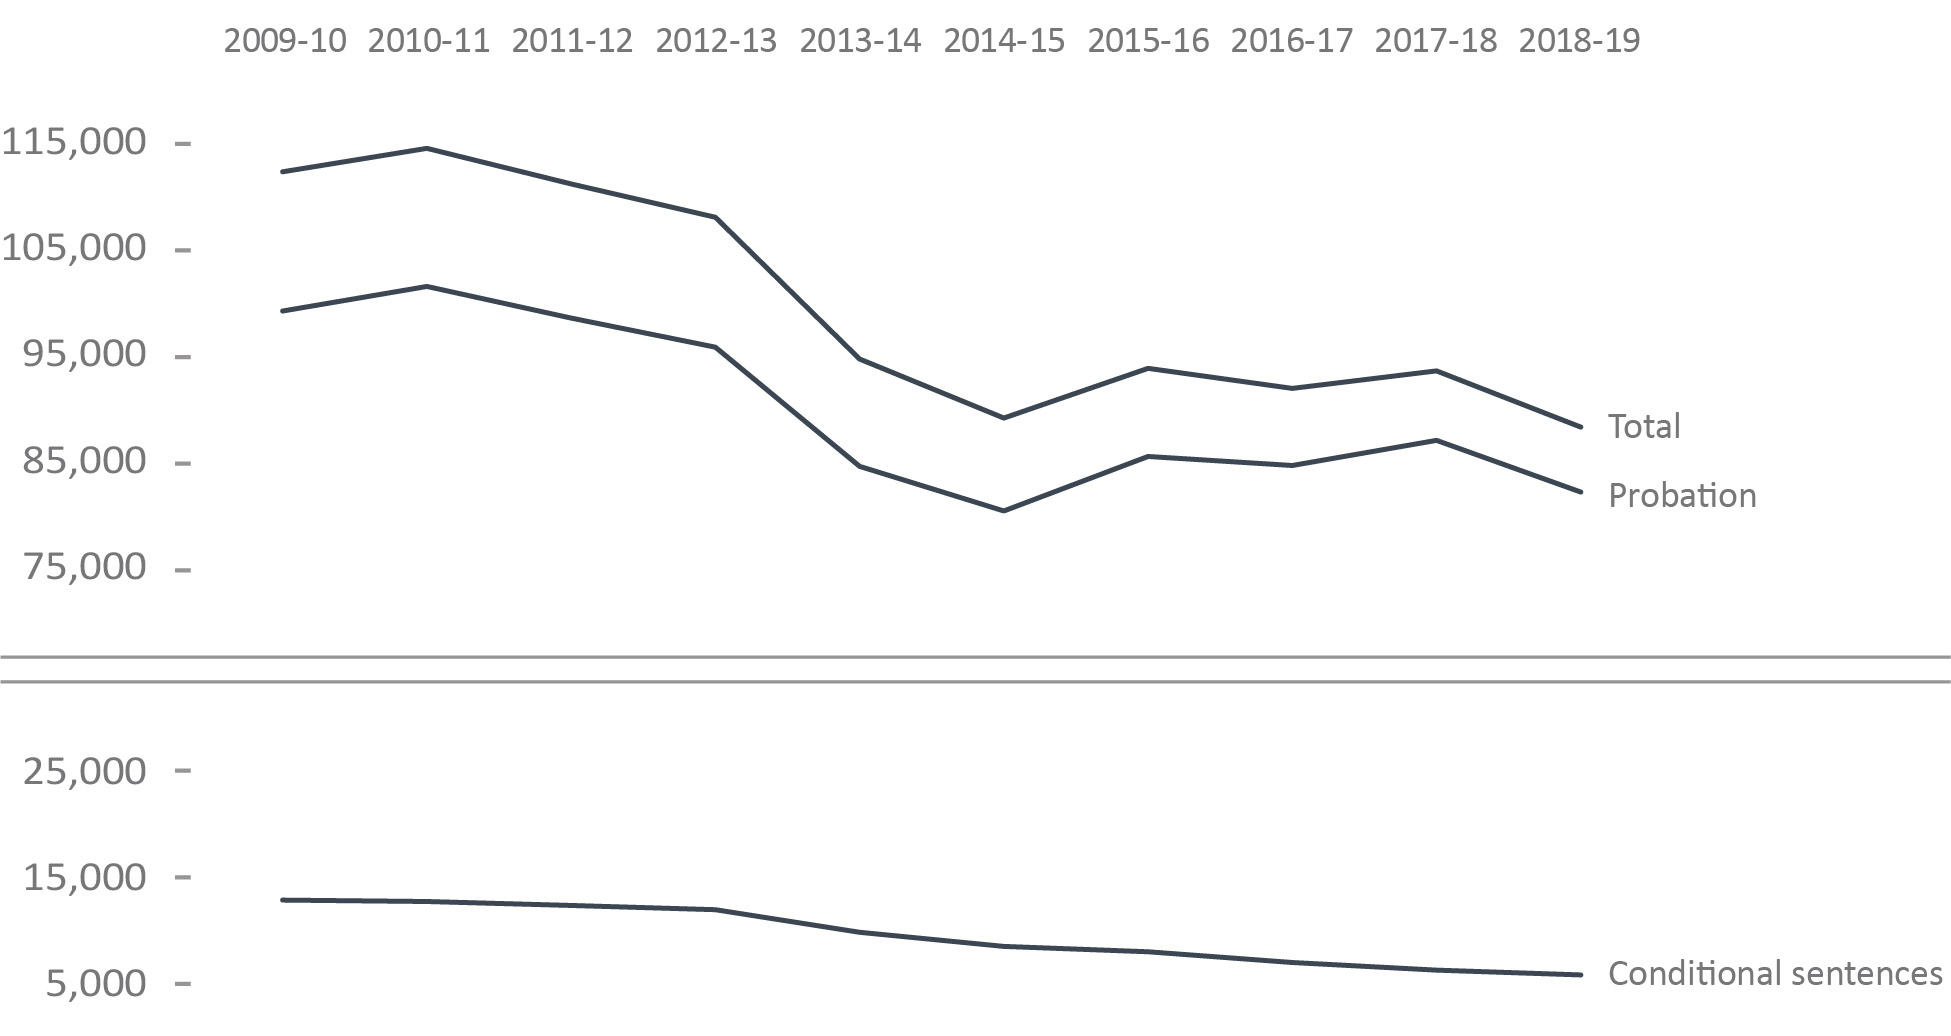
Image description
Year |
Total |
Probation |
Conditional Sentences |
|---|---|---|---|
2009-10 |
112,603 |
99,498 |
13,105 |
2010-11 |
114,794 |
101,825 |
12,969 |
2011-12 |
111,459 |
98,843 |
12,616 |
2012-13 |
108,318 |
96,116 |
12,202 |
2013-14 |
94,982 |
84,905 |
10,077 |
2014-15 |
89,451 |
80,705 |
8,746 |
2015-16 |
94,104 |
85,845 |
8,259 |
2016-17 |
92,227 |
84,978 |
7,249 |
2017-18 |
93,871 |
87,342 |
6,529 |
2018-19 |
88,582 |
82,500 |
6,082 |
Figure C22 Notes:
Source: Table 35-10-0154-01, Corrections Key Indicator Report for Adults and Youth, Canadian Centre for Justice and Community Safety Statistics, Statistics Canada.
- Between 2009-10 to 2018-19 there was a 21.3% decrease in the provincial/territorial community corrections population (from 112,603 to 88,582). The 2018-19 rate was 5.6% lower than in 2017-18 and similar to the rate 5 years prior in 2014-15.
- The number of offenders on conditional sentence orders decreased 53.6% from 13,105 in 2009-10 to 6,082 in 2018-19. The 2018-19 rate was 6.8% lower than 2017-18 and 30.5% lower than the rate 5 years prior in 2014-15.
- The number of offenders on probation decreased 17.1% from 2009-10 to 2018-19 (from 99,498 to 82,500). The 2018-19 rate was 5.5% lower than in 2017-18 and similar to the rate 5 years prior in 2014-15.
A conditional sentence is a disposition of the court where the offender serves a term of imprisonment in the community under specified conditions. This type of sentence can only be imposed in cases where the term of imprisonment would be less than two years. Conditional sentences have been a provincial and territorial sentencing option since September 1996.
The figure includes data from the most recent year available at the time of publication.
Year |
Average Monthly Offender Counts on Probation |
Average Monthly Offender Counts on Conditional Sentence |
Total |
|---|---|---|---|
2008-09 |
97,529 |
13,124 |
110,653 |
2009-10 |
99,498 |
13,105 |
112,603 |
2010-11 |
101,825 |
12,969 |
114,794 |
2011-12 |
98,843 |
12,616 |
111,459 |
2012-13 |
96,116 |
12,202 |
108,318 |
2013-14 |
84,905 |
10,077 |
94,982 |
2014-15 |
80,705 |
8,746 |
89,451 |
2015-16 |
85,845 |
8,259 |
94,104 |
2016-17 |
84,978 |
7,249 |
92,227 |
2017-18 |
87,342 |
6,529 |
93,871 |
2018-19 |
82,500 |
6,082 |
88,582 |
Table C22 Notes:
Source: Table 35-10-0154-01, Corrections Key Indicator Report for Adults and Youth, Canadian Centre for Justice and Community Safety Statistics, Statistics Canada.
A conditional sentence is a disposition of the court where the offender serves a term of imprisonment in the community under specified conditions. This type of sentence can only be imposed in cases where the term of imprisonment would be less than two years. Conditional sentences have been a provincial and territorial sentencing option since September 1996.
The table includes data from the most recent year available at the time of publication.
The number of offenders on provincial parole has increased
Figure C23: Average monthly count of offenders on provincial day or full parole
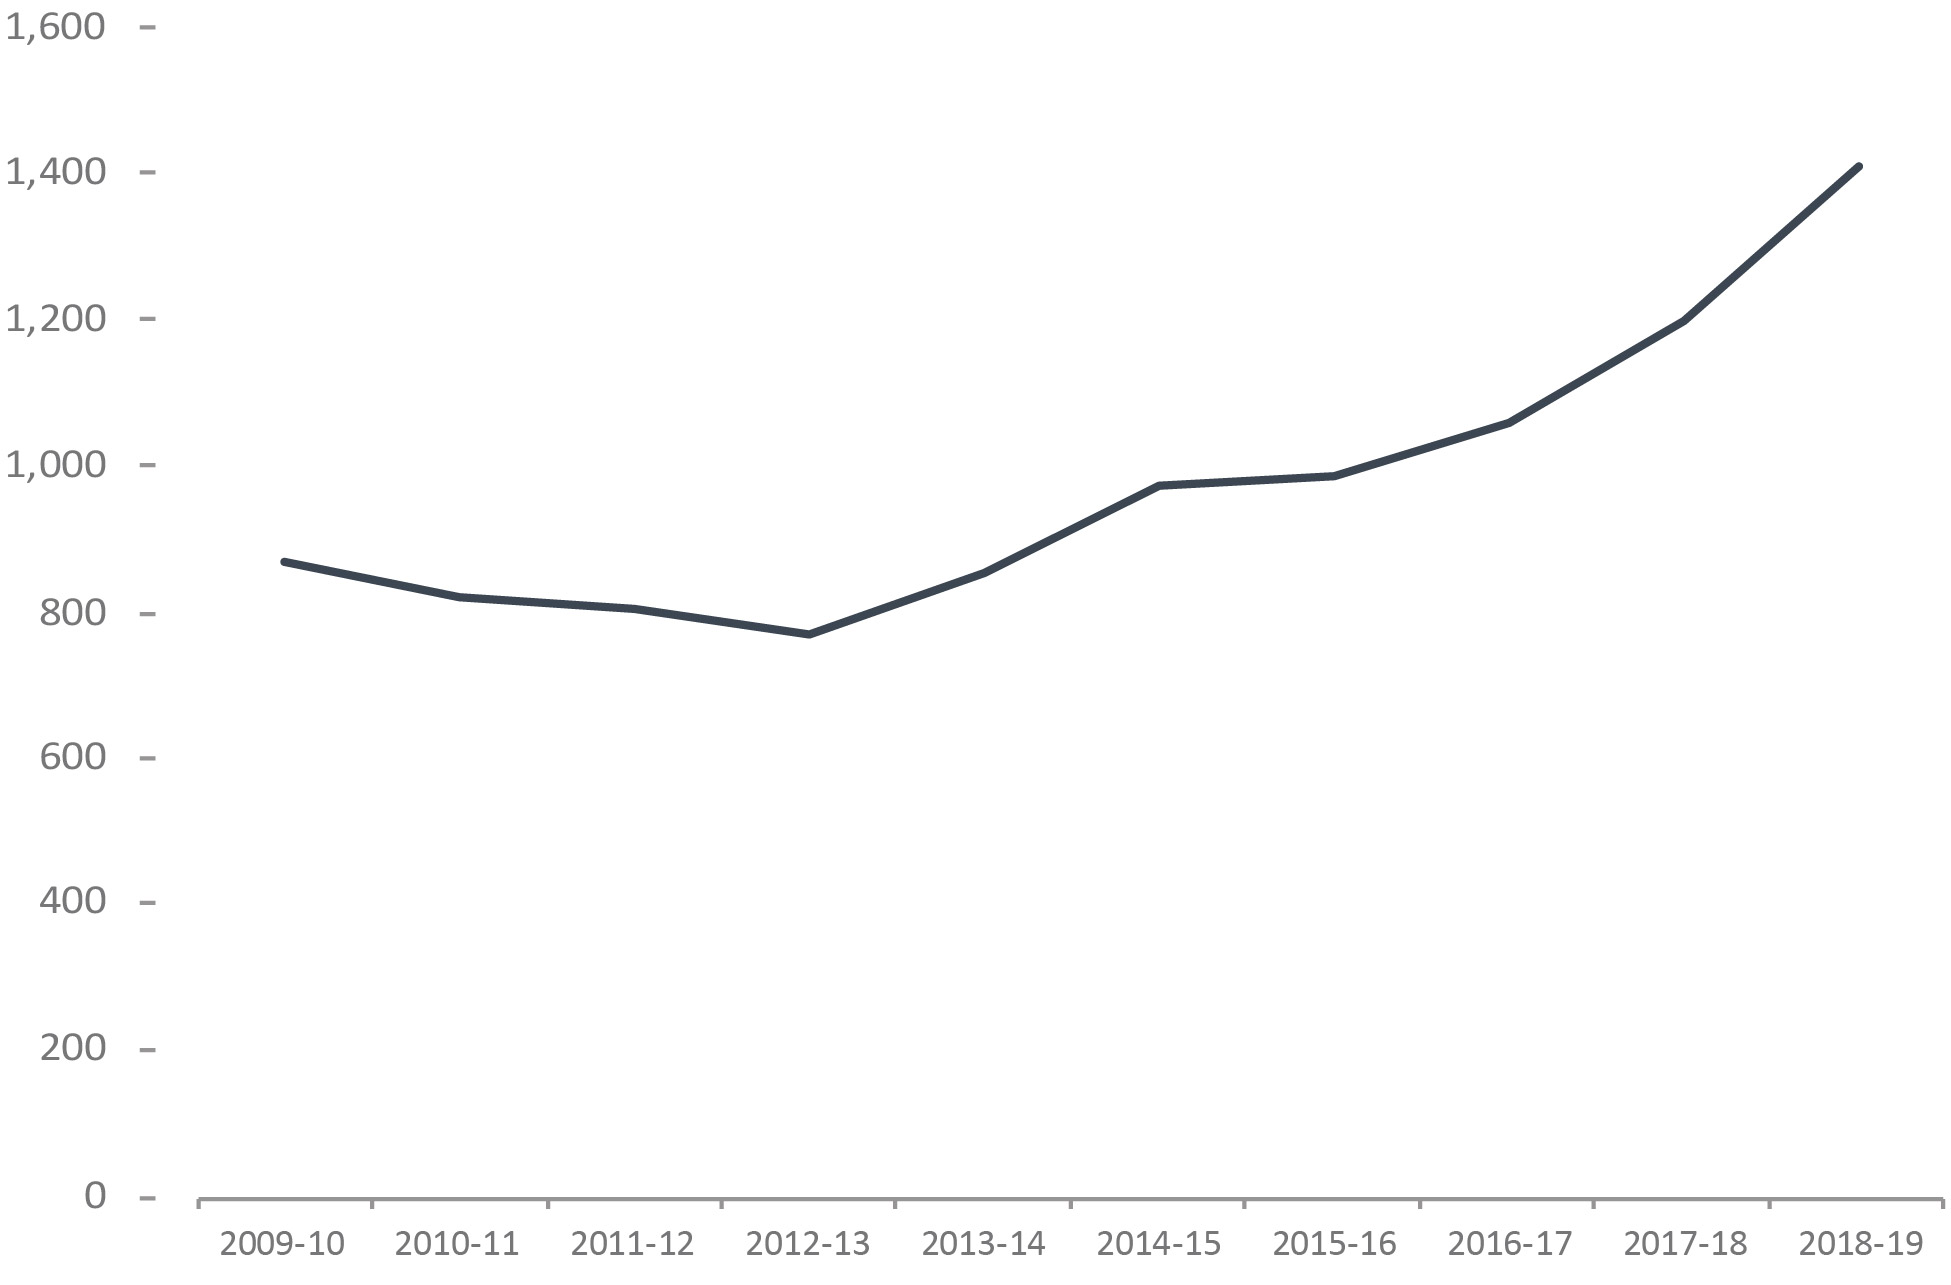
Image description
Year |
Total |
|---|---|
2009-10 |
868 |
2010-11 |
820 |
2011-12 |
804 |
2012-13 |
769 |
2013-14 |
853 |
2014-15 |
972 |
2015-16 |
985 |
2016-17 |
1058 |
2017-18 |
1197 |
2018-19 |
1408 |
Figure C23 Notes:
Source: Table 35-10-0154-01, Corrections Key Indicator Report for Adults and Youth, Canadian Centre for Justice and Community Safety Statistics, Statistics Canada.
- The number of offenders on provincial parole increased by 17.6% from 2017-18 to 2018-19 (1,197 offenders to 1,408).
- In the 5 years between 2014-15 to 2018-19, there was a 44.9% increase in the number of offenders on provincial parole, up from 972 in 2014-15 to 1,408 in 2018-19.
Provincial parole boards operate in Quebec and Ontario. On April 1, 2007, the Parole Board of Canada assumed responsibility for parole decisions relating to offenders serving sentences in British Columbia's provincial correctional facilities. The Parole Board of Canada has jurisdiction over granting parole to provincial offenders in the Atlantic and Prairie provinces, British Columbia, and to territorial offenders in Yukon, Nunavut and the Northwest Territories.
The figure includes data from the most recent year available at the time of publication.
Year |
Provincial Boards |
Parole Board of CanadaTable C23 footnote * |
Total |
% ChangeTable C23 footnote ** |
||
|---|---|---|---|---|---|---|
Quebec |
Ontario |
Total |
||||
2008-09 |
533 |
217 |
750 |
190 |
940 |
|
2009-10 |
506 |
194 |
700 |
168 |
868 |
-8.3 |
2010-11 |
482 |
171 |
653 |
167 |
820 |
-5.9 |
2011-12 |
481 |
179 |
660 |
144 |
804 |
-2.0 |
2012-13 |
462 |
164 |
626 |
143 |
769 |
-4.6 |
2013-14 |
527 |
172 |
699 |
154 |
853 |
9.8 |
2014-15 |
612 |
207 |
821 |
151 |
972 |
12.2 |
2015-16 |
639 |
207 |
846 |
139 |
985 |
1.3 |
2016-17 |
701 |
205 |
907 |
151 |
1,058 |
6.9 |
2017-18 |
792 |
242 |
1,034 |
163 |
1,197 |
11.6 |
2018-19 |
858 |
398 |
1,256 |
152 |
1,408 |
15.0 |
Table C23 Notes:
Source: Table 35-10-0154-01, Corrections Key Indicator Report for Adults and Youth, Canadian Centre for Justice and Community Safety Statistics, Statistics Canada.
On April 1, 2007, the Parole Board of Canada assumed responsibility for parole decisions relating to offenders serving sentences in British Columbia's provincial correctional facilities.
The table includes data from the most recent year available at the time of publication.
Section D. Conditional Release
The percentageFigure D1 footnote * of offenders released from a federal institution or a Healing Lodge on statutory release
Figure D1: PercentageFigure D1 footnote * of offenders released on statutory releaseFigure D1 footnote **
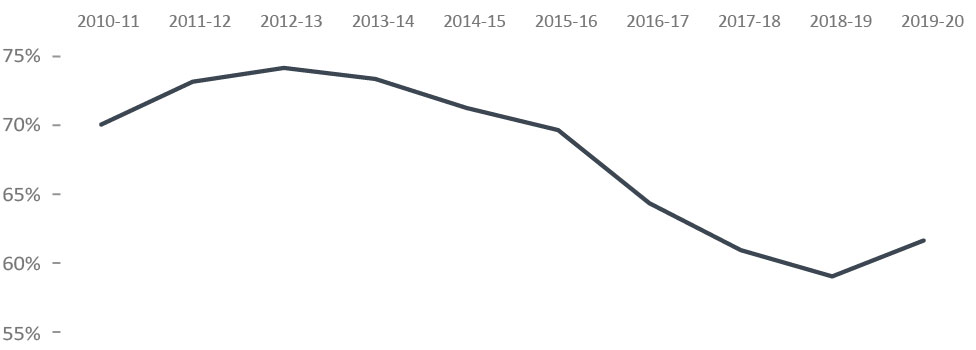
Image description
Year |
Percent |
|---|---|
2010-11 |
70.1 |
2011-12 |
73.2 |
2012-13 |
74.2 |
2013-14 |
73.4 |
2014-15 |
71.3 |
2015-16 |
69.7 |
2016-17 |
64.4 |
2017-18 |
61.0 |
2018-19 |
59.1 |
2019-20 |
61.7 |
Figure D1 Notes:
Source: Correctional Service of Canada.
- In fiscal year 2019-20, 61.7% of all releases from federal institutions were at statutory releaseFigure D1 footnote **.
- In fiscal year 2019-20, 75.0% of releases for Indigenous offenders were at statutory releaseFigure D1 footnote ** compared to 55.8% of releases for Non-Indigenous offenders.
- Over the past ten years, the percentage of releases at statutory releaseFigure D1 footnote ** decreased from 70.1% to 61.7%.
The data includes all releases from a federal institution or Healing Lodge in a given fiscal year excluding offenders with quashed sentences, offenders who died in custody, LTSO releases, offenders released at warrant expiry and offenders transferred to foreign countries. An offender may be released more than once during the reporting timeframe in cases where a previous release was subject to revocation, suspension, temporary detention, interruption or in cases where an offender served more than one sentence.
A fiscal year runs from April 1 to March 31 of the following year.
Year |
Indigenous |
Non-Indigenous |
Total Offender Population |
||||||
|---|---|---|---|---|---|---|---|---|---|
Statutory ReleaseTable D1 footnote ** |
Total Releases |
Statutory ReleaseTable D1 footnote ** |
Total Releases |
Statutory ReleaseTable D1 footnote ** |
Total Releases |
||||
2010-11 |
1,351 |
1,617 |
83.5 |
3,729 |
5,629 |
66.2 |
5,080 |
7,246 |
70.1 |
2011-12 |
1,493 |
1,795 |
83.2 |
3,808 |
5,445 |
69.9 |
5,301 |
7,240 |
73.2 |
2012-13 |
1,617 |
1,944 |
83.2 |
3,971 |
5,589 |
71.1 |
5,588 |
7,533 |
74.2 |
2013-14 |
1,724 |
2,029 |
85.0 |
3,912 |
5,652 |
69.2 |
5,636 |
7,681 |
73.4 |
2014-15 |
1,738 |
2,059 |
84.4 |
3,634 |
5,473 |
66.4 |
5,372 |
7,532 |
71.3 |
2015-16 |
1,674 |
2,027 |
82.6 |
3,634 |
5,589 |
65.0 |
5,308 |
7,616 |
69.7 |
2016-17 |
1,585 |
2,032 |
78.0 |
3,298 |
5,545 |
59.5 |
4,883 |
7,577 |
64.4 |
2017-18 |
1,528 |
2,050 |
74.5 |
2,892 |
5,200 |
55.6 |
4,420 |
7,250 |
61.0 |
2018-19 |
1,420 |
2,008 |
70.7 |
2,754 |
5,056 |
54.5 |
4,174 |
7,064 |
59.1 |
2019-20 |
1,618 |
2,157 |
75.0 |
2,738 |
4,905 |
55.8 |
4,356 |
7,062 |
61.7 |
Table D1 Notes:
Source: Correctional Service of Canada.
The data includes all releases from a federal institution or Healing Lodge in a given fiscal year excluding offenders with quashed sentences, offenders who died in custody, LTSO releases, offenders released at warrant expiry and offenders transferred to foreign countries. An offender may be released more than once during the reporting timeframe in cases where a previous release was subject to revocation, suspension, temporary detention, interruption or in cases where an offender served more than one sentence.
A fiscal year runs from April 1 to March 31 of the following year.
The percentageFigure D2 footnote * of offenders released from a federal institution or a Healing Lodge on day parole and full parole
Figure D2: PercentageFigure D2 footnote * of offenders released from a federal institution or Healing Lodge
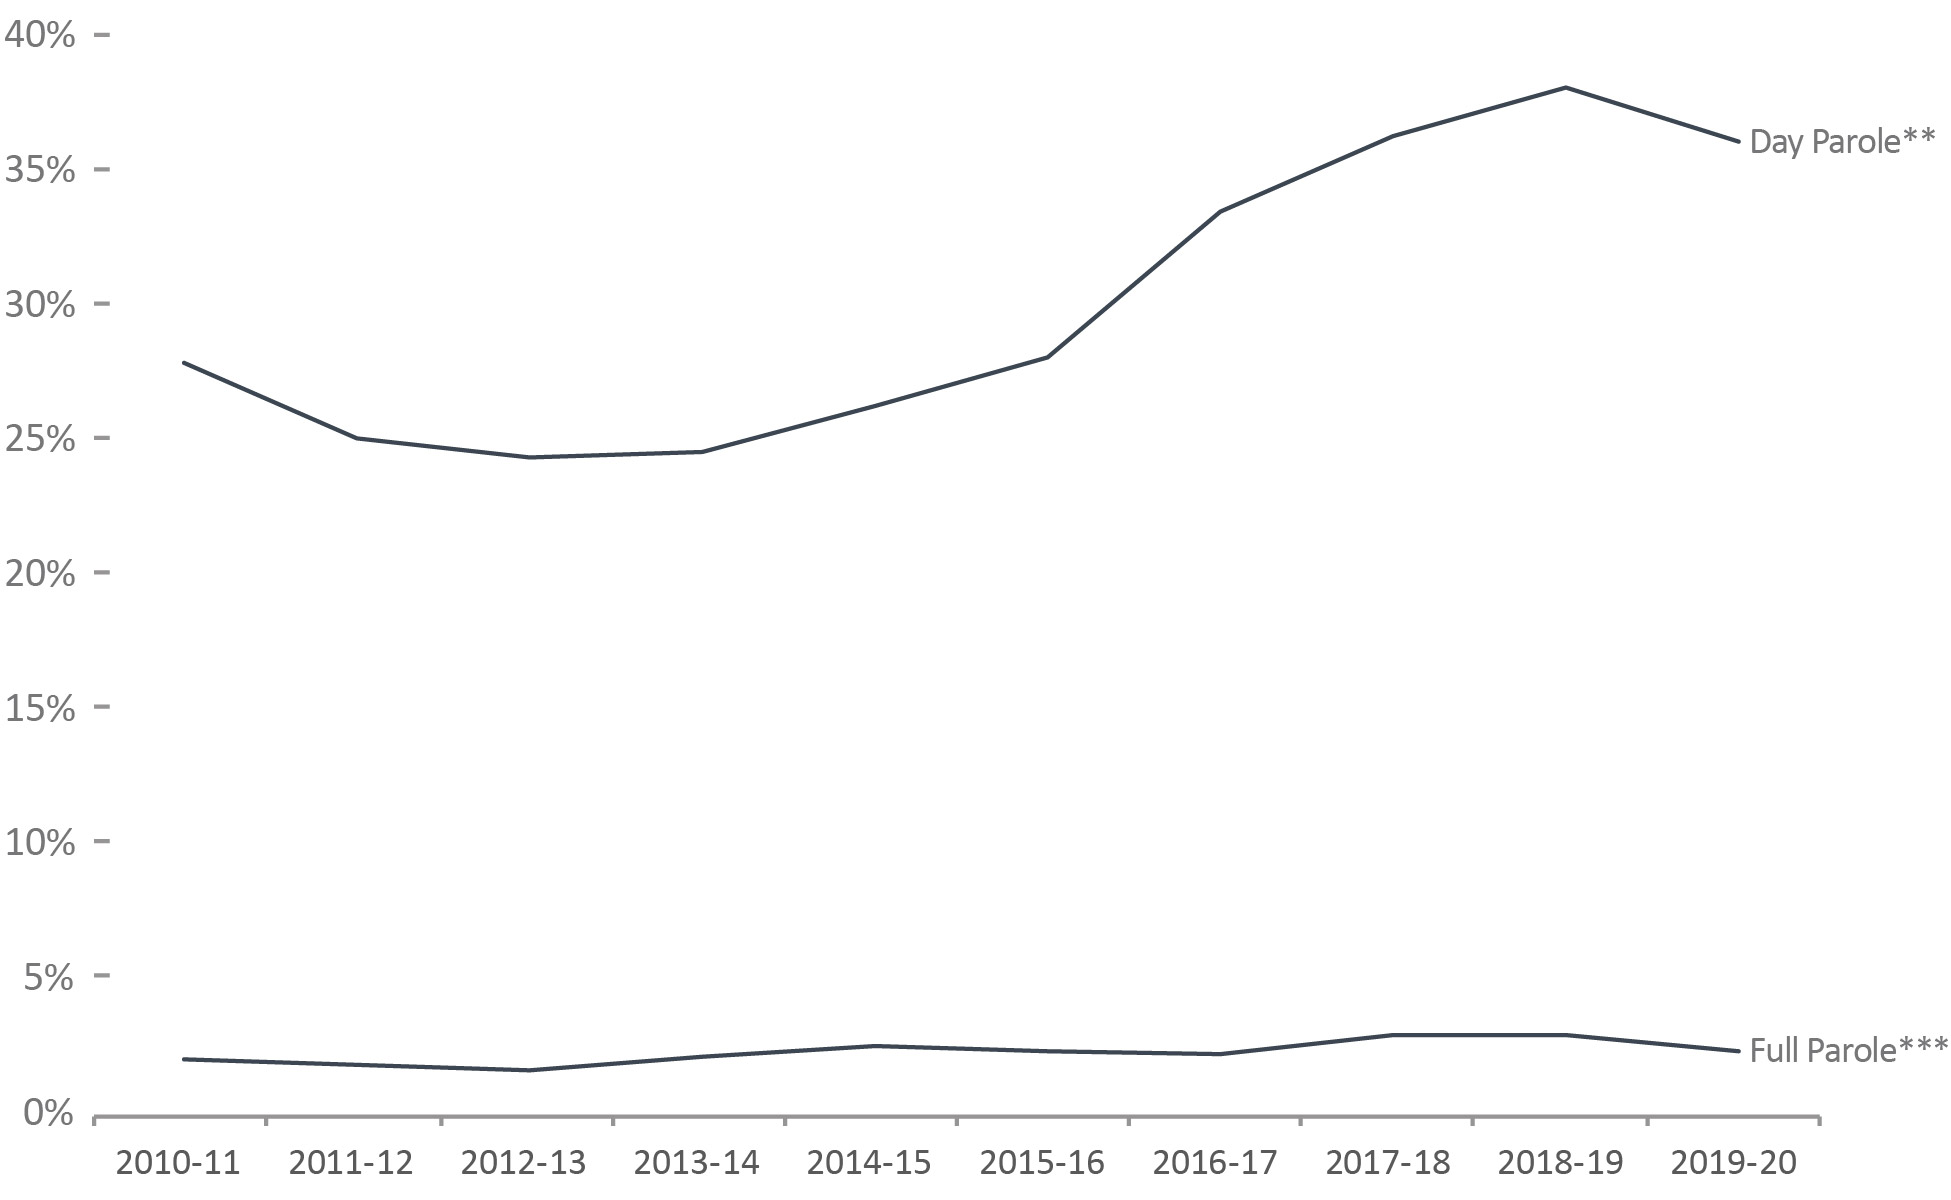
Image description
| Year | Day ParoleFigure D2 footnote ** Percent | Full ParoleFigure D2 footnote *** Percent |
|---|---|---|
| 2010-11 | 27.8 |
2.0 |
| 2011-12 | 25.0 |
1.8 |
| 2012-13 | 24.3 |
1.6 |
| 2013-14 | 24.5 |
2.1 |
| 2014-15 | 26.2 |
2.5 |
| 2015-16 | 28.0 |
2.3 |
| 2016-17 | 33.4 |
2.2 |
| 2017-18 | 36.2 |
2.9 |
| 2018-19 | 38.0 |
2.9 |
| 2019-20 | 36.0 |
2.3 |
Figure D2 Notes:
Source: Correctional Service of Canada.
- In fiscal year 2019-20, 36.0% of all releases from federal institutions were on day paroleFigure D2 footnote ** and 2.3% were on full paroleFigure D2 footnote ***.
- In fiscal year 2019-20, 23.9% of releases for Indigenous offenders were on day paroleFigure D2 footnote ** and 1.1% were on full paroleFigure D2 footnote *** compared to 41.3% and 2.9% respectively for Non-Indigenous offenders.
- Over the past ten years, the percentage of releases on day paroleFigure D2 footnote ** increased from 27.8% to 36.0% and the percentage of releases on full paroleFigure D2 footnote *** increased from 2.0% to 2.3%.
The data includes all releases from a federal institution or Healing Lodge in a given fiscal year excluding offenders with quashed sentences, offenders who died in custody, LTSO releases, offenders released at warrant expiry and offenders transferred to foreign countries. An offender may be released more than once during the reporting timeframe in cases where a previous release was subject to revocation, suspension, temporary detention, interruption or in cases where an offender served more than one sentence.
A fiscal year runs from April 1 to March 31 of the following year.
Year |
Indigenous |
Non-Indigenous |
Total Offender Population |
||||||||
|---|---|---|---|---|---|---|---|---|---|---|---|
DayTable D2 footnote ** Parole |
FullTable D2 footnote *** Parole |
Total Releases |
DayTable D2 footnote ** Parole |
FullTable D2 footnote *** Parole |
Total Releases |
DayTable D2 footnote ** Parole |
FullTable D2 footnote *** Parole |
Total Releases |
|||
2010-11 |
# |
255 |
11 |
1,617 |
1,763 |
137 |
5,629 |
2,018 |
148 |
7,246 |
7,246 |
% |
15.8 |
0.7 |
31.3 |
2.4 |
27.8 |
2.0 |
|||||
2011-12 |
# |
290 |
12 |
1,795 |
1,521 |
116 |
5,445 |
1,811 |
128 |
7,240 |
|
% |
16.2 |
0.7 |
27.9 |
2.1 |
25.0 |
1.8 |
|||||
2012-13 |
# |
320 |
7 |
1,944 |
1,508 |
110 |
5,589 |
1,828 |
117 |
7,533 |
|
% |
16.5 |
0.4 |
27.0 |
2.0 |
24.3 |
1.6 |
|||||
2013-14 |
# |
287 |
18 |
2,029 |
1,595 |
145 |
5,652 |
1,882 |
163 |
7,681 |
|
% |
14.1 |
0.9 |
28.2 |
2.6 |
24.5 |
2.1 |
|||||
2014-15 |
# |
311 |
10 |
2,059 |
1,664 |
175 |
5,473 |
1,975 |
185 |
7,532 |
|
% |
15.1 |
0.5 |
30.4 |
3.2 |
26.2 |
2.5 |
|||||
2015-16 |
# |
339 |
14 |
2,027 |
1,791 |
164 |
5,589 |
2,130 |
178 |
7,616 |
|
% |
16.7 |
0.7 |
32.0 |
2.9 |
28.0 |
2.3 |
|||||
2016-17 |
# |
433 |
14 |
2,032 |
2,094 |
153 |
5,545 |
2,527 |
167 |
7,577 |
|
% |
21.3 |
0.7 |
37.8 |
2.8 |
33.4 |
2.2 |
|||||
2017-18 |
# |
497 |
25 |
2,050 |
2,125 |
183 |
5,200 |
2,622 |
208 |
7,250 |
|
% |
24.2 |
1.2 |
40.9 |
3.5 |
36.2 |
2.9 |
|||||
2018-19 |
# |
555 |
33 |
2,008 |
2,128 |
174 |
5,056 |
2,683 |
207 |
7,064 |
|
% |
27.6 |
1.6 |
42.1 |
3.4 |
38.0 |
2.9 |
|||||
2019-20 |
# |
515 |
24 |
2,157 |
2,027 |
140 |
4,905 |
2,542 |
164 |
7,062 |
|
% |
23.9 |
1.1 |
41.3 |
2.9 |
36.0 |
2.3 |
|||||
Table D2 Notes:
Source: Correctional Service of Canada.
The data includes all releases from a federal institution or Healing Lodge in a given fiscal year excluding offenders with quashed sentences, offenders who died in custody, LTSO releases, offenders released at warrant expiry and offenders transferred to foreign countries. An offender may be released more than once during the reporting timeframe in cases where a previous release was subject to revocation, suspension, temporary detention, interruption or in cases where an offender served more than one sentence.
A fiscal year runs from April 1 to March 31 of the following year.
The federal day and full parole grant rate has increased
Figure D3: Federal parole grant rateFigure D3 footnote *
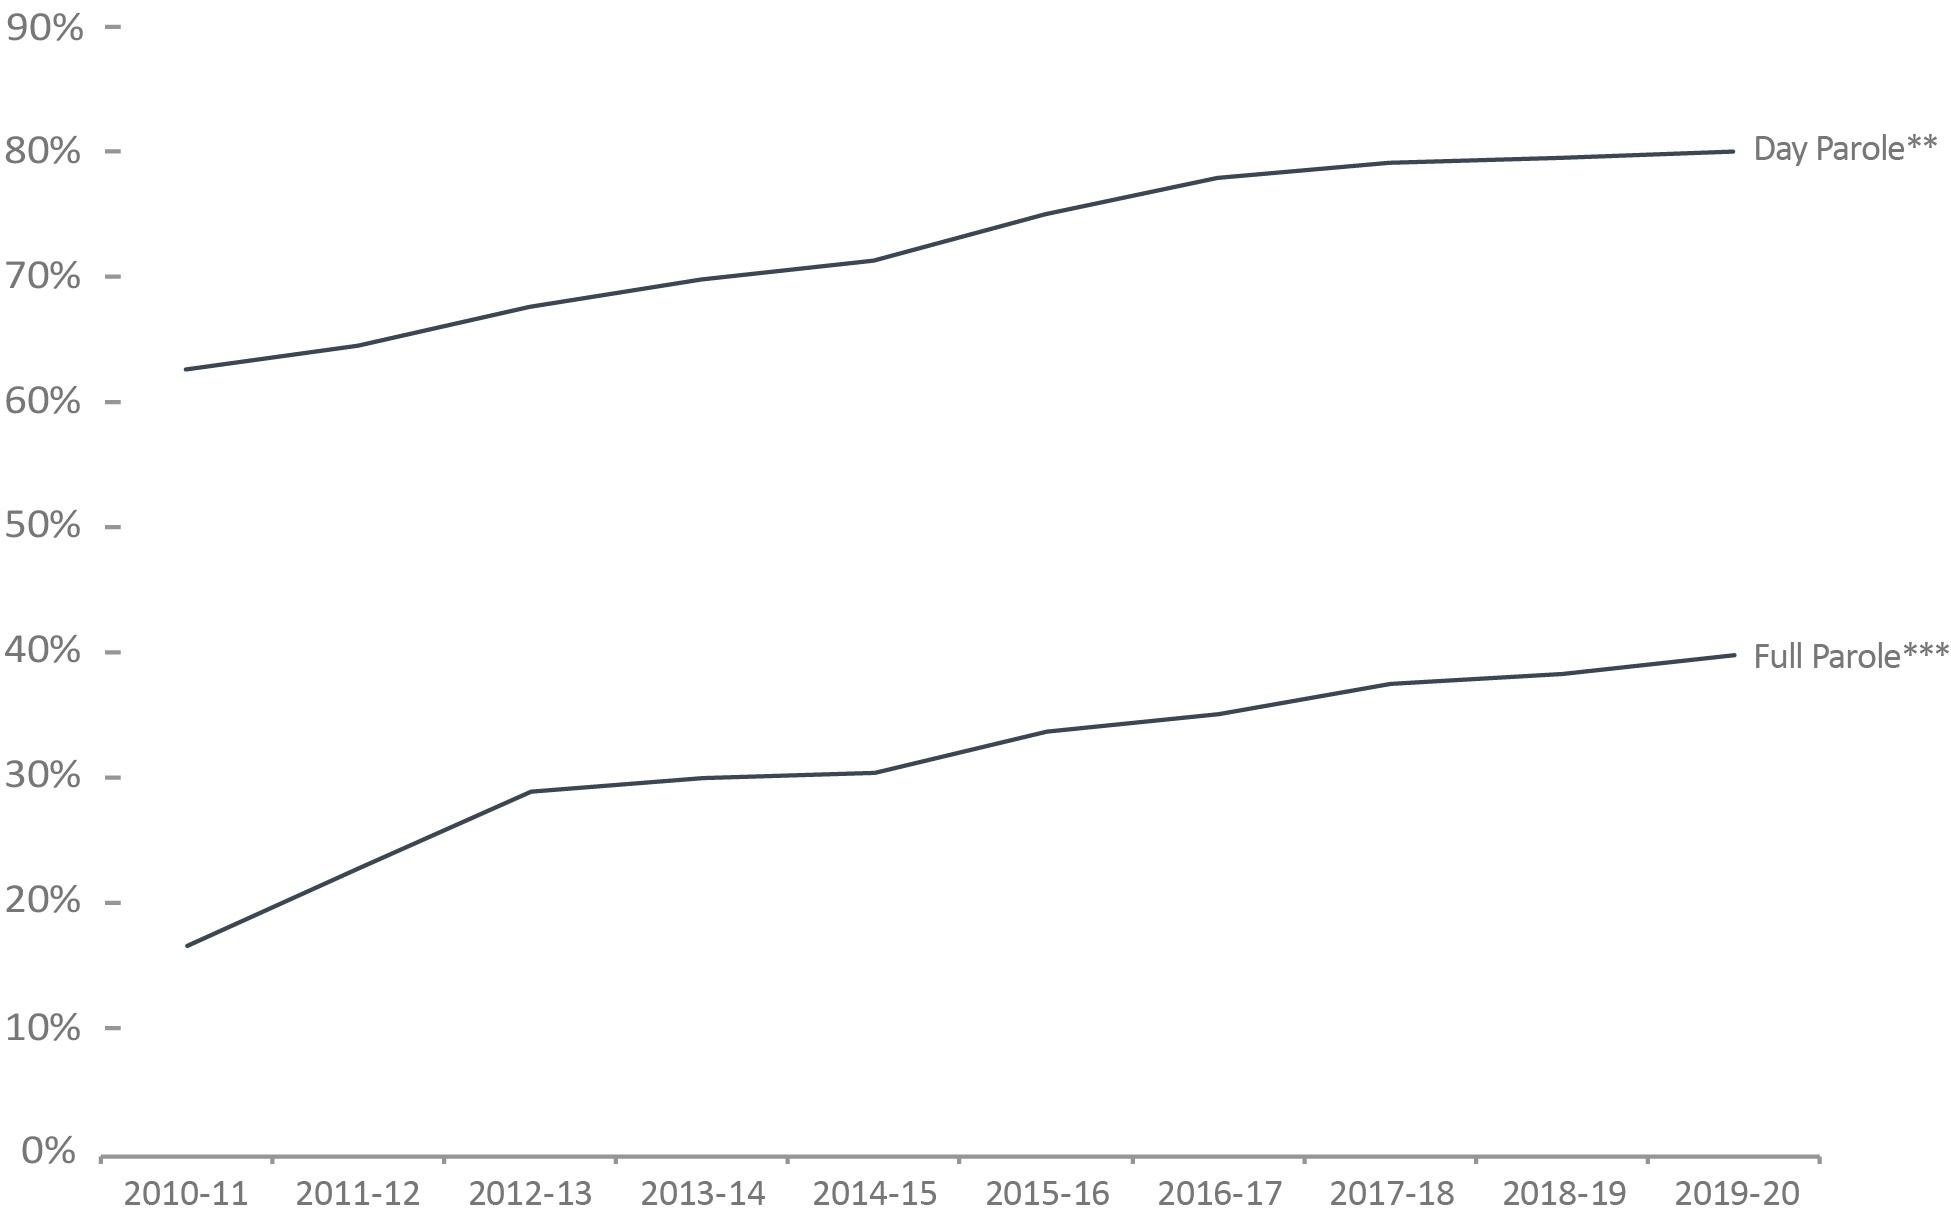
Image description
Year |
Day ParoleFigure D3 footnote ** Percent |
Full ParoleFigure D3 footnote *** Percent |
|---|---|---|
2010-11 |
62.6 |
16.6 |
2011-12 |
64.5 |
22.8 |
2012-13 |
67.6 |
28.9 |
2013-14 |
69.8 |
30.0 |
2014-15 |
71.3 |
30.4 |
2015-16 |
75.0 |
33.7 |
2016-17 |
77.9 |
35.1 |
2017-18 |
79.1 |
37.5 |
2018-19 |
79.5 |
38.3 |
2019-20 |
80.0 |
39.8 |
Figure D3 Notes:
Source: Parole Board of Canada.
- In 2019-20, the federal day paroleFigure D3 footnote ** grant rateFigure D3 footnote * remained stable (80.0%; +0.5%) compared to the previous year.
- In 2019-20, the federal full paroleFigure D3 footnote *** grant rateFigure D3 footnote * increased 1.6 percentage points to 39.8% compared to the previous year.
- Over the last 10 years, women offenders had a much higher grant rateFigure D3 footnote * for federal day paroleFigure D3 footnote ** and full paroleFigure D3 footnote *** (87.2% and 44.4%) than men (72.2% and 31.2%).
Not included were offenders in the category "Other Gender". Between 2010-11 and 2019-20, five offenders in that category were granted/denied day parole and three offenders were granted/denied full parole.
On March 28, 2011, Bill C-59 (Abolition of Early Parole Act) eliminated the accelerated parole review (APR) process, affecting first-time non-violent offenders serving sentences for Schedule II and non-Schedule offences, who in 2011-12 were no longer eligible for an APR review. These offenders are now assessed on general reoffending as compared to the APR risk assessment, which considered the risk of committing a violent offence only. To better illustrate historical trends, APR decisions were excluded.
Even though comparisons were made between federal regular day parole and full parole grant rates only, they nevertheless contain an APR residual effect between 2011-12 and 2015-16 as a sufficiently large proportion of the APR-affected population was granted regular federal day parole and full parole, perhaps inflating the grant rates.
The federal day and full parole grant rate has increased.
Type of Release |
Year |
Granted |
Denied |
Grant RateTable D3 footnote * (%) |
||||||
|---|---|---|---|---|---|---|---|---|---|---|
Women |
Men |
Women |
Men |
Women |
Men |
Total |
Directed |
Total |
||
Day ParoleTable D3 footnote *** |
2010-11 |
136 |
1,854 |
43 |
1,147 |
76.0 |
61.8 |
62.6 |
970 |
1,591 |
2011-12 |
249 |
2,491 |
66 |
1,441 |
79.0 |
63.4 |
64.5 |
0 |
0 |
|
2012-13 |
289 |
2,821 |
73 |
1,415 |
79.8 |
66.6 |
67.6 |
14 |
21 |
|
2013-14 |
248 |
2,824 |
52 |
1,274 |
82.7 |
68.9 |
69.8 |
39 |
47 |
|
2014-15 |
297 |
3,022 |
51 |
1,282 |
85.3 |
70.2 |
71.3 |
38 |
45 |
|
2015-16 |
291 |
3,092 |
52 |
1,078 |
84.8 |
74.1 |
75.0 |
86 |
90 |
|
2016-17 |
399 |
3,445 |
47 |
1,041 |
89.5 |
76.8 |
77.9 |
80 |
83 |
|
2017-18 |
437 |
3,612 |
30 |
1,039 |
93.6 |
77.7 |
79.1 |
100 |
106 |
|
2018-19 |
471 |
3,735 |
27 |
1,056 |
94.6 |
78.0 |
79.5 |
56 |
58 |
|
2019-20 |
437 |
3,590 |
35 |
972 |
92.6 |
78.7 |
80.0 |
48 |
48 |
|
Full ParoleTable D3 footnote **** |
2010-11 |
20 |
436 |
87 |
2,205 |
18.7 |
16.5 |
16.6 |
1,046 |
1,059 |
2011-12 |
77 |
644 |
127 |
2,316 |
37.7 |
21.8 |
22.8 |
0 |
0 |
|
2012-13 |
90 |
914 |
142 |
2,328 |
38.8 |
28.2 |
28.9 |
26 |
26 |
|
2013-14 |
84 |
904 |
103 |
2,202 |
44.9 |
29.1 |
30.0 |
126 |
142 |
|
2014-15 |
87 |
969 |
105 |
2,307 |
45.3 |
29.6 |
30.4 |
119 |
137 |
|
2015-16 |
96 |
1,062 |
127 |
2,154 |
43.0 |
33.0 |
33.7 |
166 |
185 |
|
2016-17 |
138 |
1,237 |
157 |
2,383 |
46.8 |
34.2 |
35.1 |
122 |
126 |
|
2017-18 |
153 |
1,363 |
175 |
2,357 |
46.6 |
36.6 |
37.5 |
161 |
165 |
|
2018-19 |
157 |
1,451 |
175 |
2,420 |
47.3 |
37.5 |
38.3 |
66 |
67 |
|
2019-20 |
182 |
1,385 |
159 |
2,208 |
53.4 |
38.5 |
39.8 |
60 |
60 |
|
Table D3 Notes:
Source: Parole Board of Canada.
Even though comparisons were made between federal regular day parole and full parole grant rates only, they nevertheless contain an APR residual effect between 2011-12 and 2015-16 as a sufficiently large proportion of the APR-affected population was granted regular federal day parole and full parole, perhaps inflating the grant rates.
Not included were offenders in the category "Other Gender". Between 2010-11 and 2019-20, five offenders in that category were granted/denied day parole and three offenders were granted/denied full parole.
The federal full parole grant rate for Indigenous offenders has increased
Figure D4: Federal parole grant rateFigure D4 footnote *
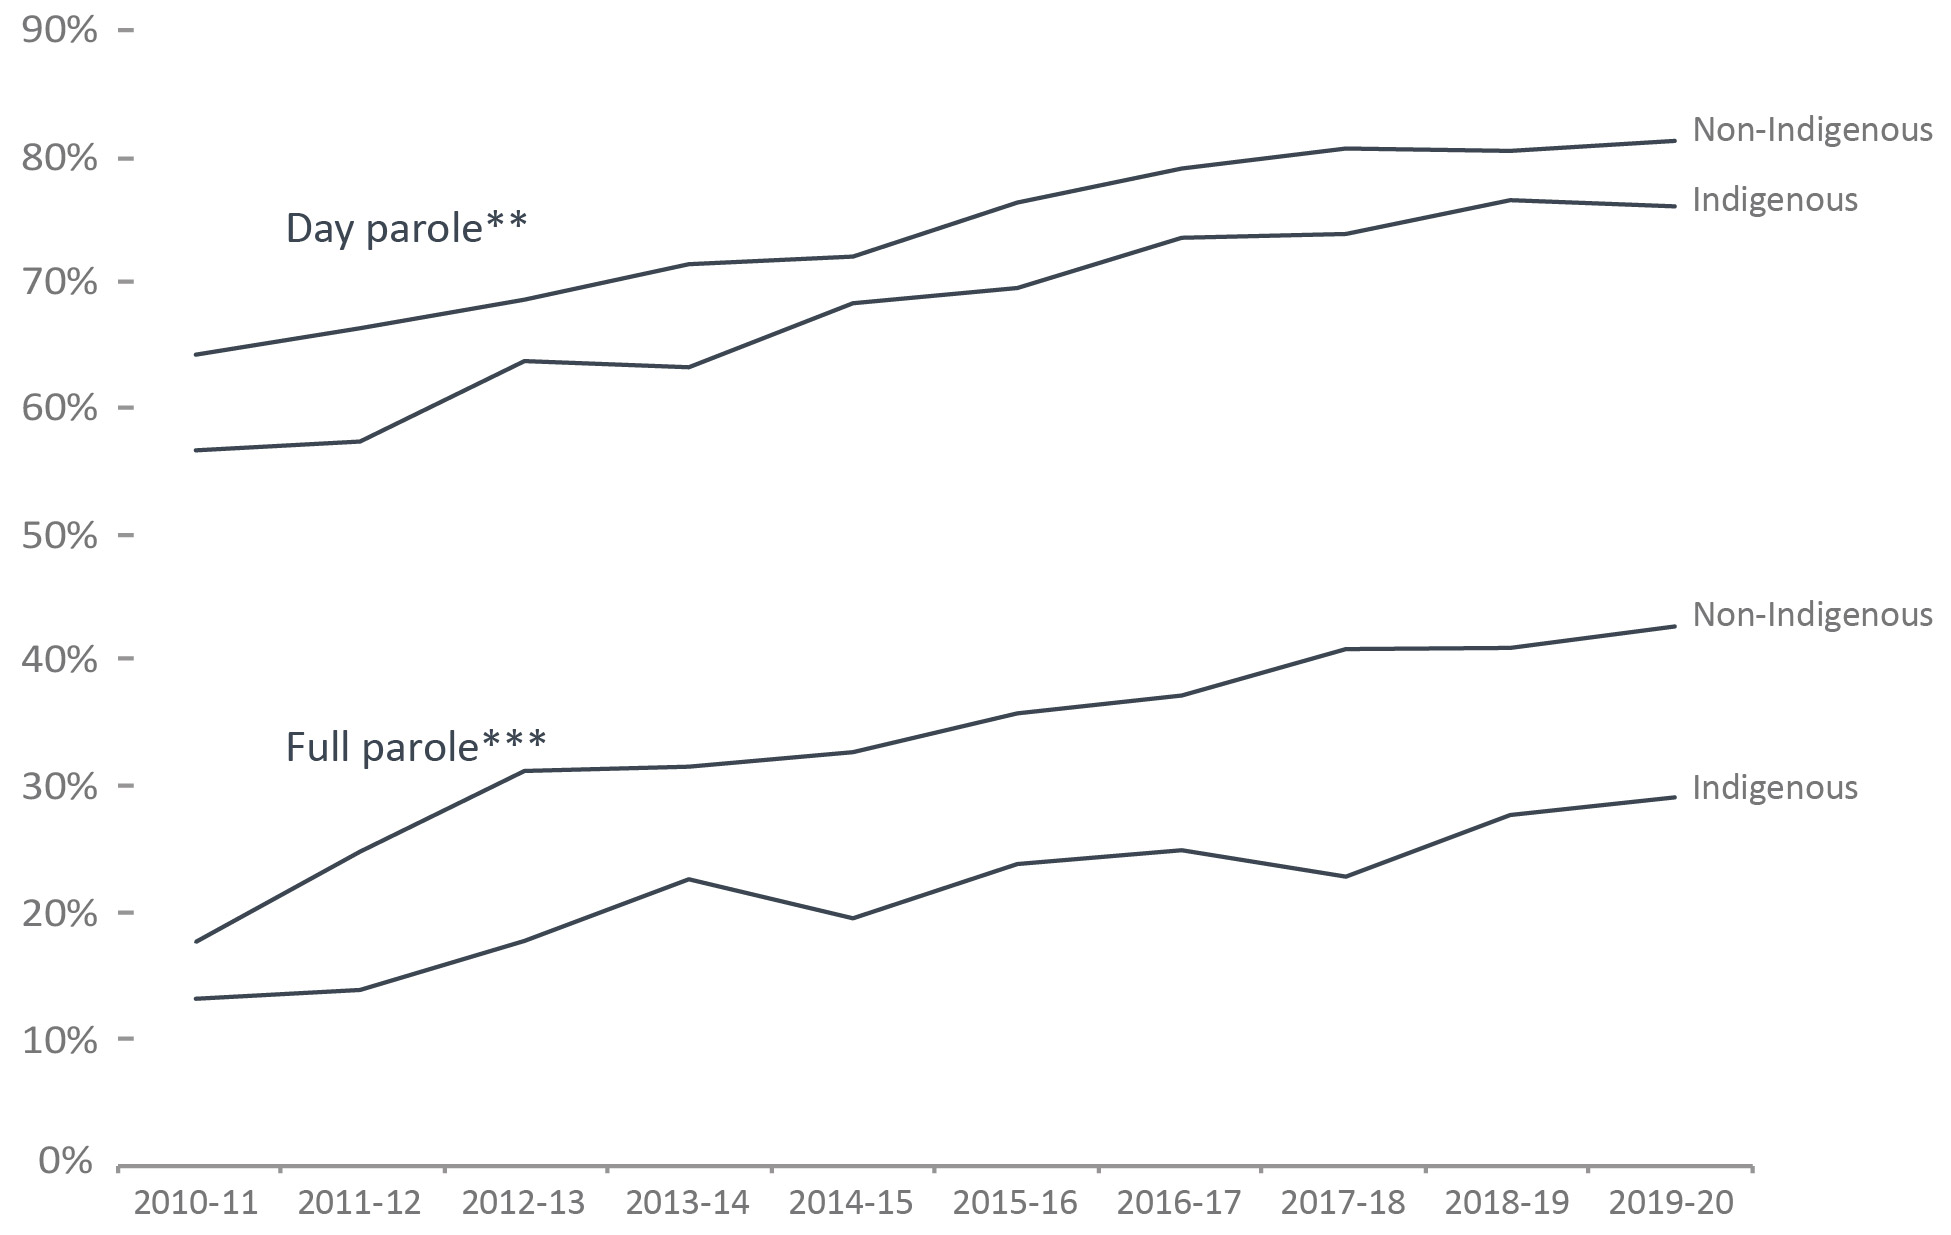
Image description
Day ParoleFigure D4 footnote ** Percent |
||
|---|---|---|
Year |
Indigenous |
Non-Indigenous |
2010-11 |
56.6 |
64.2 |
2011-12 |
57.3 |
66.3 |
2012-13 |
63.7 |
68.6 |
2013-14 |
63.2 |
71.4 |
2014-15 |
68.3 |
72.0 |
2015-16 |
69.5 |
76.3 |
2016-17 |
73.5 |
79.0 |
2017-18 |
73.8 |
80.6 |
2018-19 |
76.5 |
80.4 |
2019-20 |
76.0 |
81.2 |
Full ParoleFigure D4 footnote *** Percent |
||
Year |
Indigenous |
Non-Indigenous |
2010-11 |
13.0 |
17.5 |
2011-12 |
13.7 |
24.7 |
2012-13 |
17.6 |
31.1 |
2013-14 |
22.5 |
31.5 |
2014-15 |
19.4 |
32.6 |
2015-16 |
23.7 |
35.7 |
2016-17 |
24.8 |
37.1 |
2017-18 |
22.7 |
40.8 |
2018-19 |
27.6 |
40.9 |
2019-20 |
29.0 |
42.6 |
Figure D4 Notes:
Source: Parole Board of Canada.
- In 2019-20, the federal day paroleFigure D4 footnote ** grant rateFigure D4 footnote * for Indigenous offenders (76.0%; -0.6%) and non-Indigenous offenders (81.2%; +0.8%) remained stable compared to 2018-19.
- In 2019-20, the federal full paroleFigure D4 footnote *** grant rateFigure D4 footnote * increased for Indigenous offenders (29.0%; +1.4%) and for non-Indigenous offenders (42.6%; +1.7%) compared to 2018-19.
- Over the last 10 years, lower federal dayFigure D4 footnote ** and full paroleFigure D4 footnote *** grant ratesFigure D4 footnote * were reported for Indigenous offenders (68.9%; 22.0%) than for non-Indigenous offenders (74.6%; 34.3%).
On March 28, 2011, Bill C-59 (Abolition of Early Parole Act) eliminated the accelerated parole review (APR) process, affecting first-time non-violent offenders serving sentences for schedule II and non-scheduled offences, who in 2011-12 were no longer eligible for an APR review. These offenders are now assessed on general reoffending as compared to the APR risk assessment, which considered the risk of committing a violent offence only. To better illustrate historical trends, APR were excluded. Grant rates should be read with caution. Even though comparisons were made between federal regular day parole and full parole grant rates only, they nevertheless contain an APR residual effect between 2011-12 and 2015-16 as a sufficiently large proportion of the APR-affected population were granted regular federal day parole and full parole, perhaps inflating the grant rates.
The federal full parole grant rate for Indigenous offenders has increased.
Type of Release |
Year |
Granted |
Denied |
Grant RateTable D4 footnote * (%) |
Total |
||||
|---|---|---|---|---|---|---|---|---|---|
Indigenous |
Non-Ind. |
Indigenous |
Non-Ind. |
Indigenous |
Non-Ind. |
Granted/Denied |
Grant RateTable D4 footnote * (%) |
||
Day ParoleTable D4 footnote ** |
2010-11 |
379 |
1,611 |
291 |
900 |
56.6 |
64.2 |
3,181 |
62.6 |
2011-12 |
475 |
2,265 |
354 |
1,153 |
57.3 |
66.3 |
4,247 |
64.5 |
|
2012-13 |
567 |
2,543 |
323 |
1,165 |
63.7 |
68.6 |
4,598 |
67.6 |
|
2013-14 |
530 |
2,542 |
309 |
1,017 |
63.2 |
71.4 |
4,398 |
69.8 |
|
2014-15 |
573 |
2,748 |
266 |
1,067 |
68.3 |
72.0 |
4,654 |
71.4 |
|
2015-16 |
611 |
2,773 |
268 |
862 |
69.5 |
76.3 |
4,514 |
75.0 |
|
2016-17 |
715 |
3,129 |
258 |
831 |
73.5 |
79.0 |
4,933 |
77.9 |
|
2017-18 |
819 |
3,230 |
291 |
778 |
73.8 |
80.6 |
5,118 |
79.1 |
|
2018-19 |
942 |
3,264 |
289 |
794 |
76.5 |
80.4 |
5,289 |
79.5 |
|
2019-20 |
901 |
3,126 |
285 |
722 |
76.0 |
81.2 |
5,034 |
80.0 |
|
Full ParoleTable D4 footnote *** |
2010-11 |
72 |
384 |
483 |
1,809 |
13.0 |
17.5 |
2,748 |
16.6 |
2011-12 |
76 |
645 |
477 |
1,966 |
13.7 |
24.7 |
3,164 |
22.8 |
|
2012-13 |
102 |
902 |
476 |
1,994 |
17.6 |
31.1 |
3,474 |
28.9 |
|
2013-14 |
124 |
864 |
427 |
1,878 |
22.5 |
31.5 |
3,293 |
30.0 |
|
2014-15 |
109 |
947 |
452 |
1,961 |
19.4 |
32.6 |
3,469 |
30.4 |
|
2015-16 |
136 |
1,023 |
439 |
1,842 |
23.7 |
35.7 |
3,440 |
33.7 |
|
2016-17 |
154 |
1,221 |
467 |
2,074 |
24.8 |
37.1 |
3,916 |
35.1 |
|
2017-18 |
169 |
1,347 |
574 |
1,958 |
22.7 |
40.8 |
4,048 |
37.5 |
|
2018-19 |
233 |
1,375 |
611 |
1,984 |
27.6 |
40.9 |
4,203 |
38.3 |
|
2019-20 |
232 |
1,335 |
568 |
1,799 |
29.0 |
42.6 |
3,934 |
39.8 |
|
Table D4 Notes:
Source: Parole Board of Canada.
On March 28, 2011, Bill C-59 (Abolition of Early Parole Act) eliminated the accelerated parole review (APR) process, affecting first-time non-violent offenders serving sentences for schedule II and non-scheduled offences, who in 2011-12 were no longer eligible for an APR review. These offenders are now assessed on general reoffending as compared to the APR risk assessment, which considered the risk of committing a violent offence only. To better illustrate historical trends, APR were excluded. Grant rates should be read with caution. Even though comparisons were made between federal regular day parole and full parole grant rates only, they nevertheless contain an APR residual effect between 2011-12 and 2015-16 as a sufficiently large proportion of the APR-affected population were granted regular federal day parole and full parole, perhaps inflating the grant rates.
The number of federal Elder-Assisted parole hearings have increased
Figure D5: Federal Elder-AssistedFigure D5 footnote * parole hearings
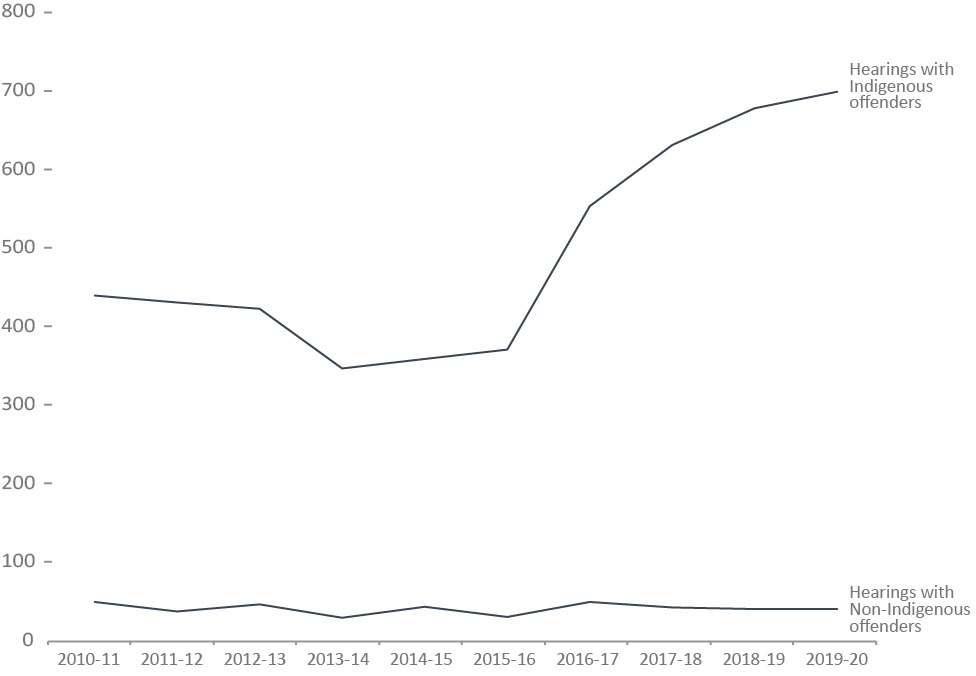
Image description
Year |
Hearings with Indigenous Offenders |
Hearings with Non-Indigenous Offenders |
|---|---|---|
2010-11 |
440 |
49 |
2011-12 |
431 |
37 |
2012-13 |
423 |
46 |
2013-14 |
347 |
29 |
2014-15 |
359 |
43 |
2015-16 |
371 |
30 |
2016-17 |
554 |
49 |
2017-18 |
632 |
42 |
2018-19 |
679 |
40 |
2019-20 |
700 |
40 |
Figure D5 Notes:
Source: Parole Board of Canada.
- The number of federal Elder-AssistedFigure D5 footnote * parole hearings increased by 2.9% in 2019-20 from 2018-19.
- In 2019-20, 44.0% (700) of all federal parole hearings with Indigenous offenders, and 0.9% (40) of all federal parole hearings for offenders who did not self-identify as Indigenous were Elder AssistedFigure D5 footnote * Hearings.
The presence of an Elder is an alternative approach to the traditional parole hearing, and was introduced by the Parole Board of Canada to ensure that conditional release hearings are sensitive to Indigenous cultural values and traditions. This type of hearing is available to both Indigenous and non-Indigenous offenders.
Year |
Indigenous Offenders |
Non-Indigenous Offenders |
All Offenders |
||||||
|---|---|---|---|---|---|---|---|---|---|
Total Hearings |
With an ElderTable D5 footnote * |
Total Hearings |
With an ElderTable D5 footnote * |
Total Hearings |
With an ElderTable D5 footnote * |
||||
# |
# |
% |
# |
# |
% |
# |
# |
% |
|
2010-11 |
1,248 |
440 |
35.3 |
4,296 |
49 |
1.1 |
5,544 |
489 |
8.8 |
2011-12 |
1,282 |
431 |
33.6 |
4,597 |
37 |
0.8 |
5,879 |
468 |
8.0 |
2012-13 |
1,319 |
423 |
32.1 |
4,625 |
46 |
1.0 |
5,944 |
469 |
7.9 |
2013-14 |
935 |
347 |
37.1 |
3,652 |
29 |
0.8 |
4,587 |
376 |
8.2 |
2014-15 |
888 |
359 |
40.4 |
3,812 |
43 |
1.1 |
4,700 |
402 |
8.6 |
2015-16 |
959 |
371 |
38.7 |
3,951 |
30 |
0.8 |
4,910 |
401 |
8.2 |
2016-17 |
1,295 |
554 |
42.8 |
4,485 |
49 |
1.1 |
5,780 |
603 |
10.4 |
2017-18 |
1,542 |
632 |
41.0 |
4,843 |
42 |
0.9 |
6,385 |
674 |
10.6 |
2018-19 |
1,629 |
679 |
41.7 |
4,931 |
40 |
0.8 |
6,560 |
719 |
11.0 |
2019-20 |
1,590 |
700 |
44.0 |
4,542 |
40 |
0.9 |
6,132 |
740 |
12.1 |
Table D5 Notes:
Source: Parole Board of Canada.
The presence of an Elder is an alternative approach to the traditional parole hearing, and was introduced by the Parole Board of Canada to ensure that conditional release hearings are sensitive to Indigenous cultural values and traditions. This type of hearing is available to both Indigenous and non-Indigenous offenders.
Proportion of sentence served prior to being released on parole
Figure D6: Percentage of sentence served
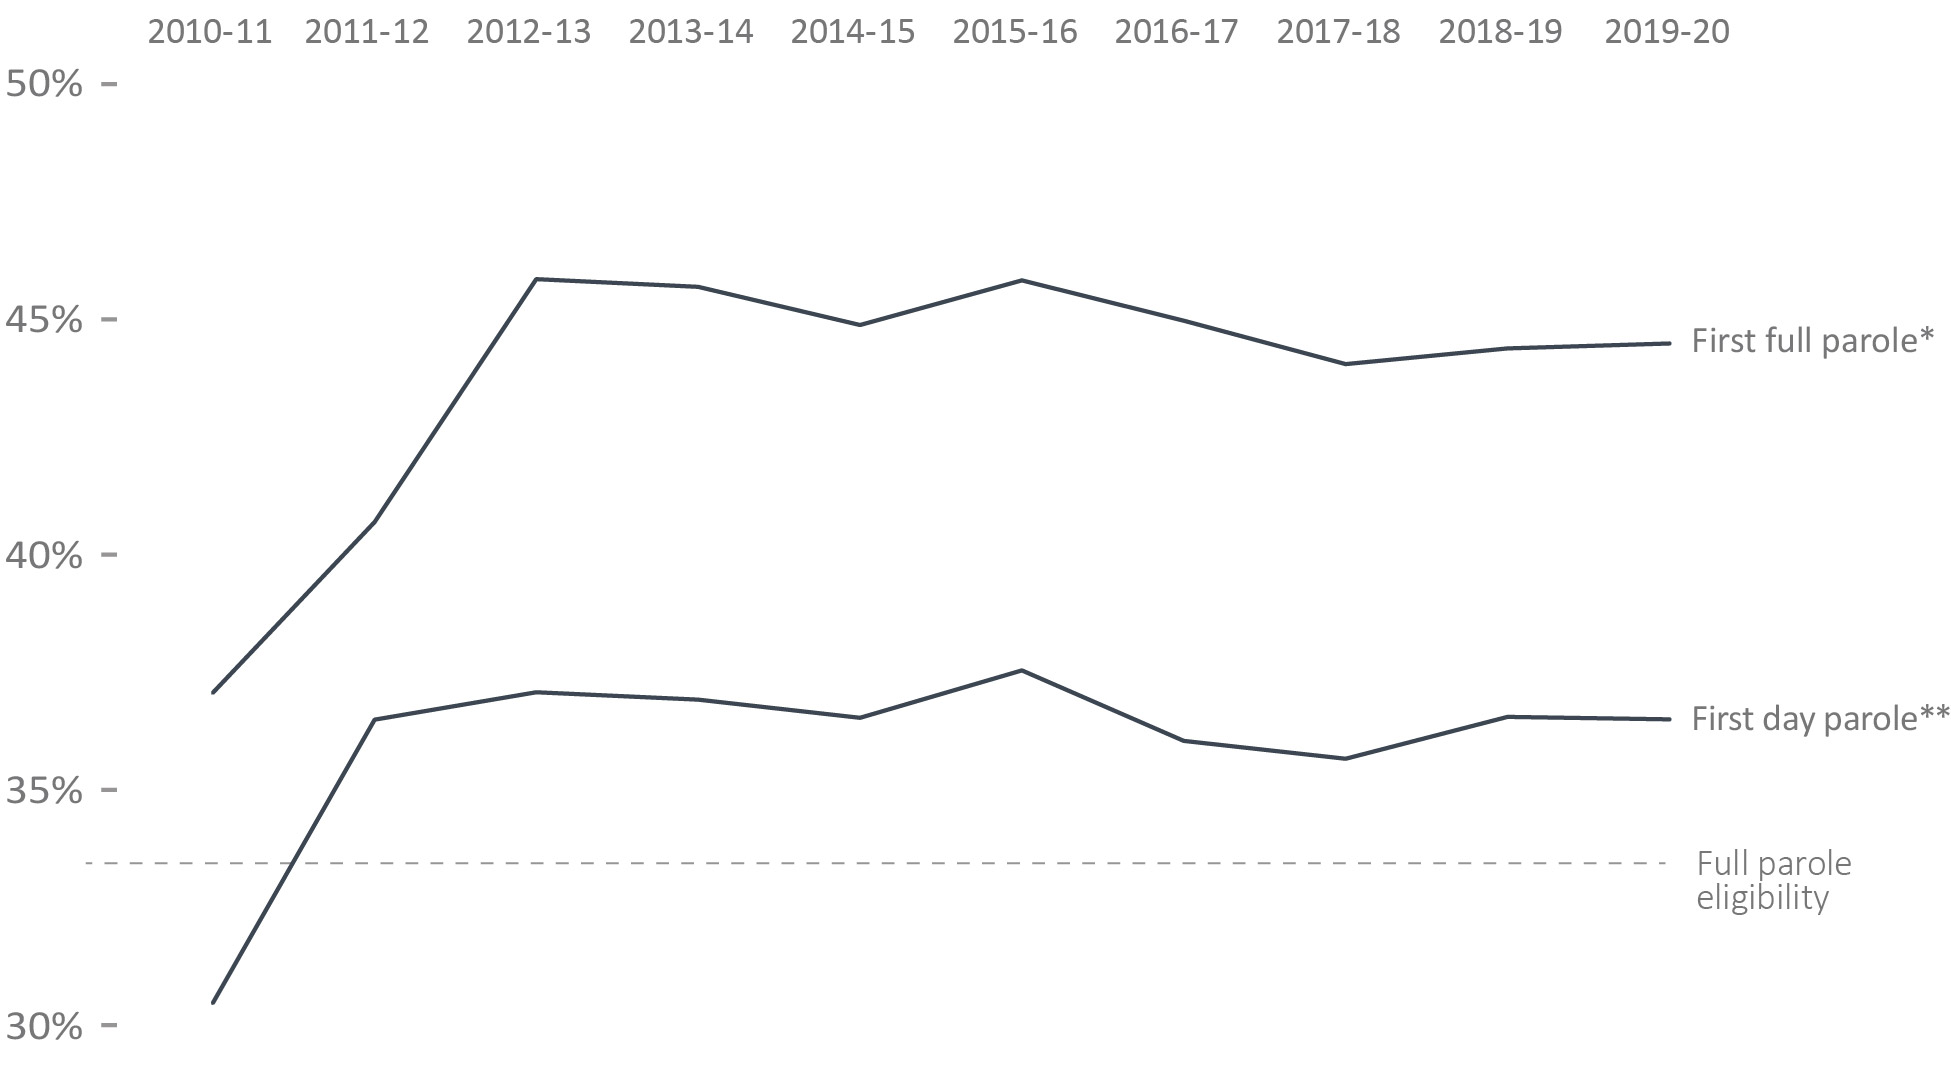
Image description
Year |
First Full ParoleFigure D6 footnote * Percent |
First Day ParoleFigure D6 footnote ** Percent |
|---|---|---|
2010-11 |
37.1 |
30.5 |
2011-12 |
40.7 |
36.5 |
2012-13 |
45.9 |
37.1 |
2013-14 |
45.7 |
36.9 |
2014-15 |
44.9 |
36.5 |
2015-16 |
45.8 |
37.5 |
2016-17 |
45 |
36 |
2017-18 |
44.1 |
35.7 |
2018-19 |
44.4 |
36.6 |
2019-20 |
44.5 |
36.5 |
Figure D6 Notes:
Source: Parole Board of Canada.
- In 2019-20, the average proportion of sentence served before the first federal day parole** release for offenders serving determinate sentences remained stable (36.5%; -0.1%) from the previous year.
- The proportion of sentences served prior to first federal full parole* release for offenders serving determinate sentences remained stable (44.5%; +0.1%) in 2019-20 when compared to the previous year.
- In 2019-20, men offenders served a higher proportion of their sentences before being released on their first federal day parole** and full parole* (37.3%; 45.0%) than women offenders (30.6%; 41.3%).
- In 2019-20, women offenders and men offenders served an average of 2.3 and 6.6 percentage points more of their sentences before their first federal day parole** release and 5.6 and 7.8 percentage points more of their sentences before their first federal full parole* release compared to 2010-11.
Timing of parole in the sentence refers to the percentage of the sentence served at the time the first day parole or full parole starts during the sentence. In most cases a full parole is preceded by a day parole. These calculations are based on sentences under federal jurisdiction, excluding life sentences and indeterminate sentences. Offenders (other than those serving life or indeterminate sentences or subject to judicial determination) normally become eligible for full parole after serving 1/3 of their sentence or seven years, whichever is less. Eligibility for day parole is normally at six months before full parole eligibility.
The increases in the average proportion of time served after 2010-11 are in part due to the effect of Bill C-59 and were driven primarily by offenders serving sentences for Schedule II and non-Schedule offences (some of whom were former APR-eligible offenders).
Year |
First Federal Day ParoleTable D6 footnote * |
First Federal Full ParoleTable D6 footnote ** |
||||
|---|---|---|---|---|---|---|
Women |
Men |
Total |
Women |
Men |
Total |
|
2010-11 |
28.3 |
30.7 |
30.5 |
35.7 |
37.2 |
37.1 |
2011-12 |
34.2 |
36.8 |
36.5 |
39.9 |
40.8 |
40.7 |
2012-13 |
37.8 |
37.0 |
37.1 |
44.9 |
46.0 |
45.9 |
2013-14 |
33.9 |
37.2 |
36.9 |
43.3 |
45.9 |
45.7 |
2014-15 |
34.3 |
36.8 |
36.5 |
43.8 |
45.0 |
44.9 |
2015-16 |
36.1 |
37.7 |
37.5 |
44.6 |
46.0 |
45.8 |
2016-17 |
32.6 |
36.5 |
36.0 |
42.9 |
45.3 |
45.0 |
2017-18 |
32.2 |
36.2 |
35.7 |
41.5 |
44.4 |
44.1 |
2018-19 |
31.8 |
37.2 |
36.6 |
41.2 |
44.8 |
44.4 |
2019-20 |
30.6 |
37.3 |
36.5 |
41.3 |
45.0 |
44.5 |
Table D6 Notes:
Source: Parole Board of Canada.
Timing of parole in the sentence refers to the percentage of the sentence served at the time the first day parole or full parole starts during the sentence. In most cases a full parole is preceded by a day parole. These calculations are based on sentences under federal jurisdiction, excluding life sentences and indeterminate sentences. Offenders (other than those serving life or indeterminate sentences or subject to judicial determination) normally become eligible for full parole after serving 1/3 of their sentence or seven years, whichever is less. Eligibility for day parole is normally at six months before full parole eligibility.
The increases in the average proportion of time served after 2010-11 are in part due to the effect of Bill C-59 and were driven primarily by offenders serving sentences for Schedule II and non-Schedule offences (some of whom were former APR-eligible offenders).
Indigenous offenders served a higher proportion of their sentences before being released on parole
Figure D7: Percentage of sentence served in custody before first federal parole
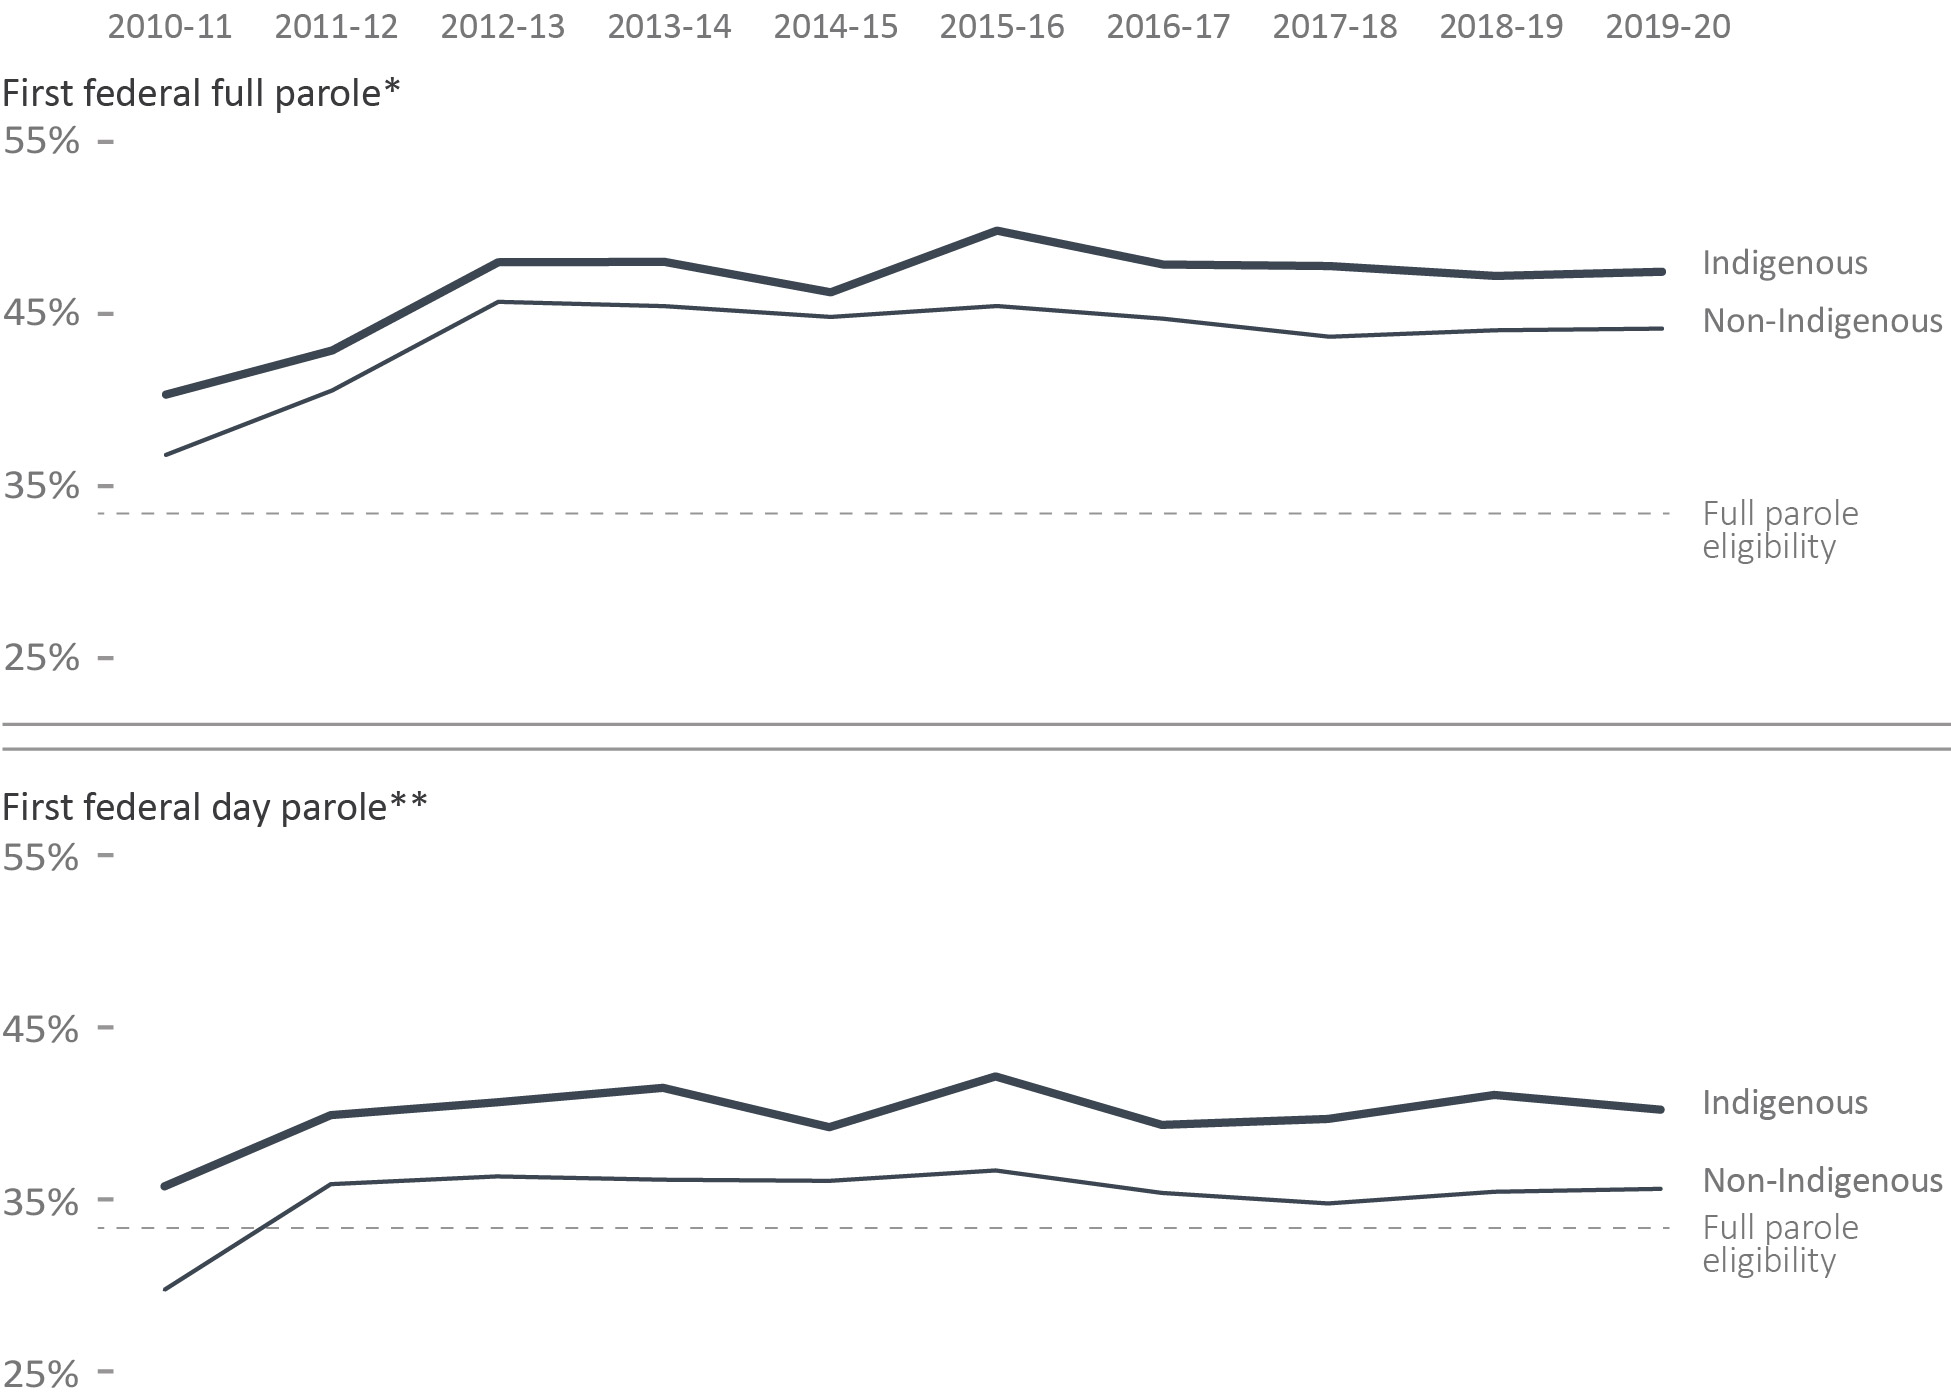
Image description
First Federal Full ParoleFigure D7 footnote * Percent |
||
|---|---|---|
Year |
Indigenous |
Non-Indigenous |
2010-11 |
40.3 |
36.8 |
2011-12 |
42.8 |
40.5 |
2012-13 |
48 |
45.7 |
2013-14 |
48 |
45.4 |
2014-15 |
46.2 |
44.8 |
2015-16 |
49.8 |
45.4 |
2016-17 |
47.8 |
44.7 |
2017-18 |
47.7 |
43.6 |
2018-19 |
47.2 |
44 |
2019-20 |
47.4 |
44.1 |
First Federal Day ParoleFigure D7 footnote ** Percent |
||
Year |
Indigenous |
Non- Indigenous |
2010-11 |
35.7 |
29.7 |
2011-12 |
39.9 |
35.9 |
2012-13 |
40.6 |
36.3 |
2013-14 |
41.5 |
36.1 |
2014-15 |
39.2 |
36.1 |
2015-16 |
42.1 |
36.7 |
2016-17 |
39.3 |
35.4 |
2017-18 |
39.7 |
34.8 |
2018-19 |
41.1 |
35.4 |
2019-20 |
40.2 |
35.6 |
Notes:
Source: Parole Board of Canada.
- In 2019-20, Indigenous offenders served higher proportions of their sentences before being released on their first federal day parole** and full parole* (40.2%; 47.4%), than non-Indigenous offenders (35.6%; 44.1%).
- In 2019-20, Indigenous and non-Indigenous offenders served an average of 4.4 and 5.9 percentage points more of their sentences before their first federal day parole** release and 7.1 and 7.3 percentage points more of their sentence before their first federal full parole* release compared to 2010-11.
Timing of parole in the sentence refers to the percentage of the sentence served at the time the first day parole or full parole starts during the sentence. In most cases a full parole is preceded by a day parole.
These calculations are based on sentences under federal jurisdiction, excluding life sentences and indeterminate sentences.
Offenders (other than those serving life or indeterminate sentences or subject to judicial determination) normally become eligible for full parole after serving 1/3 of their sentence or seven years, whichever is less. Eligibility for day parole is normally at six months before full parole eligibility.
The increases in the average proportion of time served after 2010-11 are in part due to the effect of Bill C-59 and were driven primarily by offenders serving sentences for Schedule II and non-Schedule offences (some of whom were former APR-eligible offenders).
Year |
First Federal Day ParoleTable D7 footnote * |
First Federal Full ParoleTable D7 footnote ** |
||||
|---|---|---|---|---|---|---|
Indigenous |
Non-Indigenous |
Total |
Indigenous |
Non-Indigenous |
Total |
|
2010-11 |
35.7 |
29.7 |
30.5 |
40.3 |
36.8 |
37.1 |
2011-12 |
39.9 |
35.9 |
36.5 |
42.8 |
40.5 |
40.7 |
2012-13 |
40.6 |
36.3 |
37.1 |
48.0 |
45.7 |
45.9 |
2013-14 |
41.5 |
36.1 |
36.9 |
48.0 |
45.4 |
45.7 |
2014-15 |
39.2 |
36.1 |
36.5 |
46.2 |
44.8 |
44.9 |
2015-16 |
42.1 |
36.7 |
37.5 |
49.8 |
45.4 |
45.8 |
2016-17 |
39.3 |
35.4 |
36.0 |
47.8 |
44.7 |
45.0 |
2017-18 |
39.7 |
34.8 |
35.7 |
47.7 |
43.6 |
44.1 |
2018-19 |
41.1 |
35.4 |
36.6 |
47.2 |
44.0 |
44.4 |
2019-20 |
40.2 |
35.6 |
36.5 |
47.4 |
44.1 |
44.5 |
Table D7 Notes:
Source: Parole Board of Canada.
Timing of parole in the sentence refers to the percentage of the sentence served at the time the first day parole or full parole starts during the sentence. In most cases a full parole is preceded by a day parole.
These calculations are based on sentences under federal jurisdiction, excluding life sentences and indeterminate sentences.
Offenders (other than those serving life or indeterminate sentences or subject to judicial determination) normally become eligible for full parole after serving 1/3 of their sentence or seven years, whichever is less. Eligibility for day parole is normally at six months before full parole eligibility.
The increases in the average proportion of time served after 2010-11 are in part due to the effect of Bill C-59 and were driven primarily by offenders serving sentences for Schedule II and non-Schedule offences (some of whom were former APR-eligible offenders).
The successful completion rate of federal day parole supervision periods has remained stable
Figure D8 : Day parole outcomesFigure D8 footnote * – 10-year trend
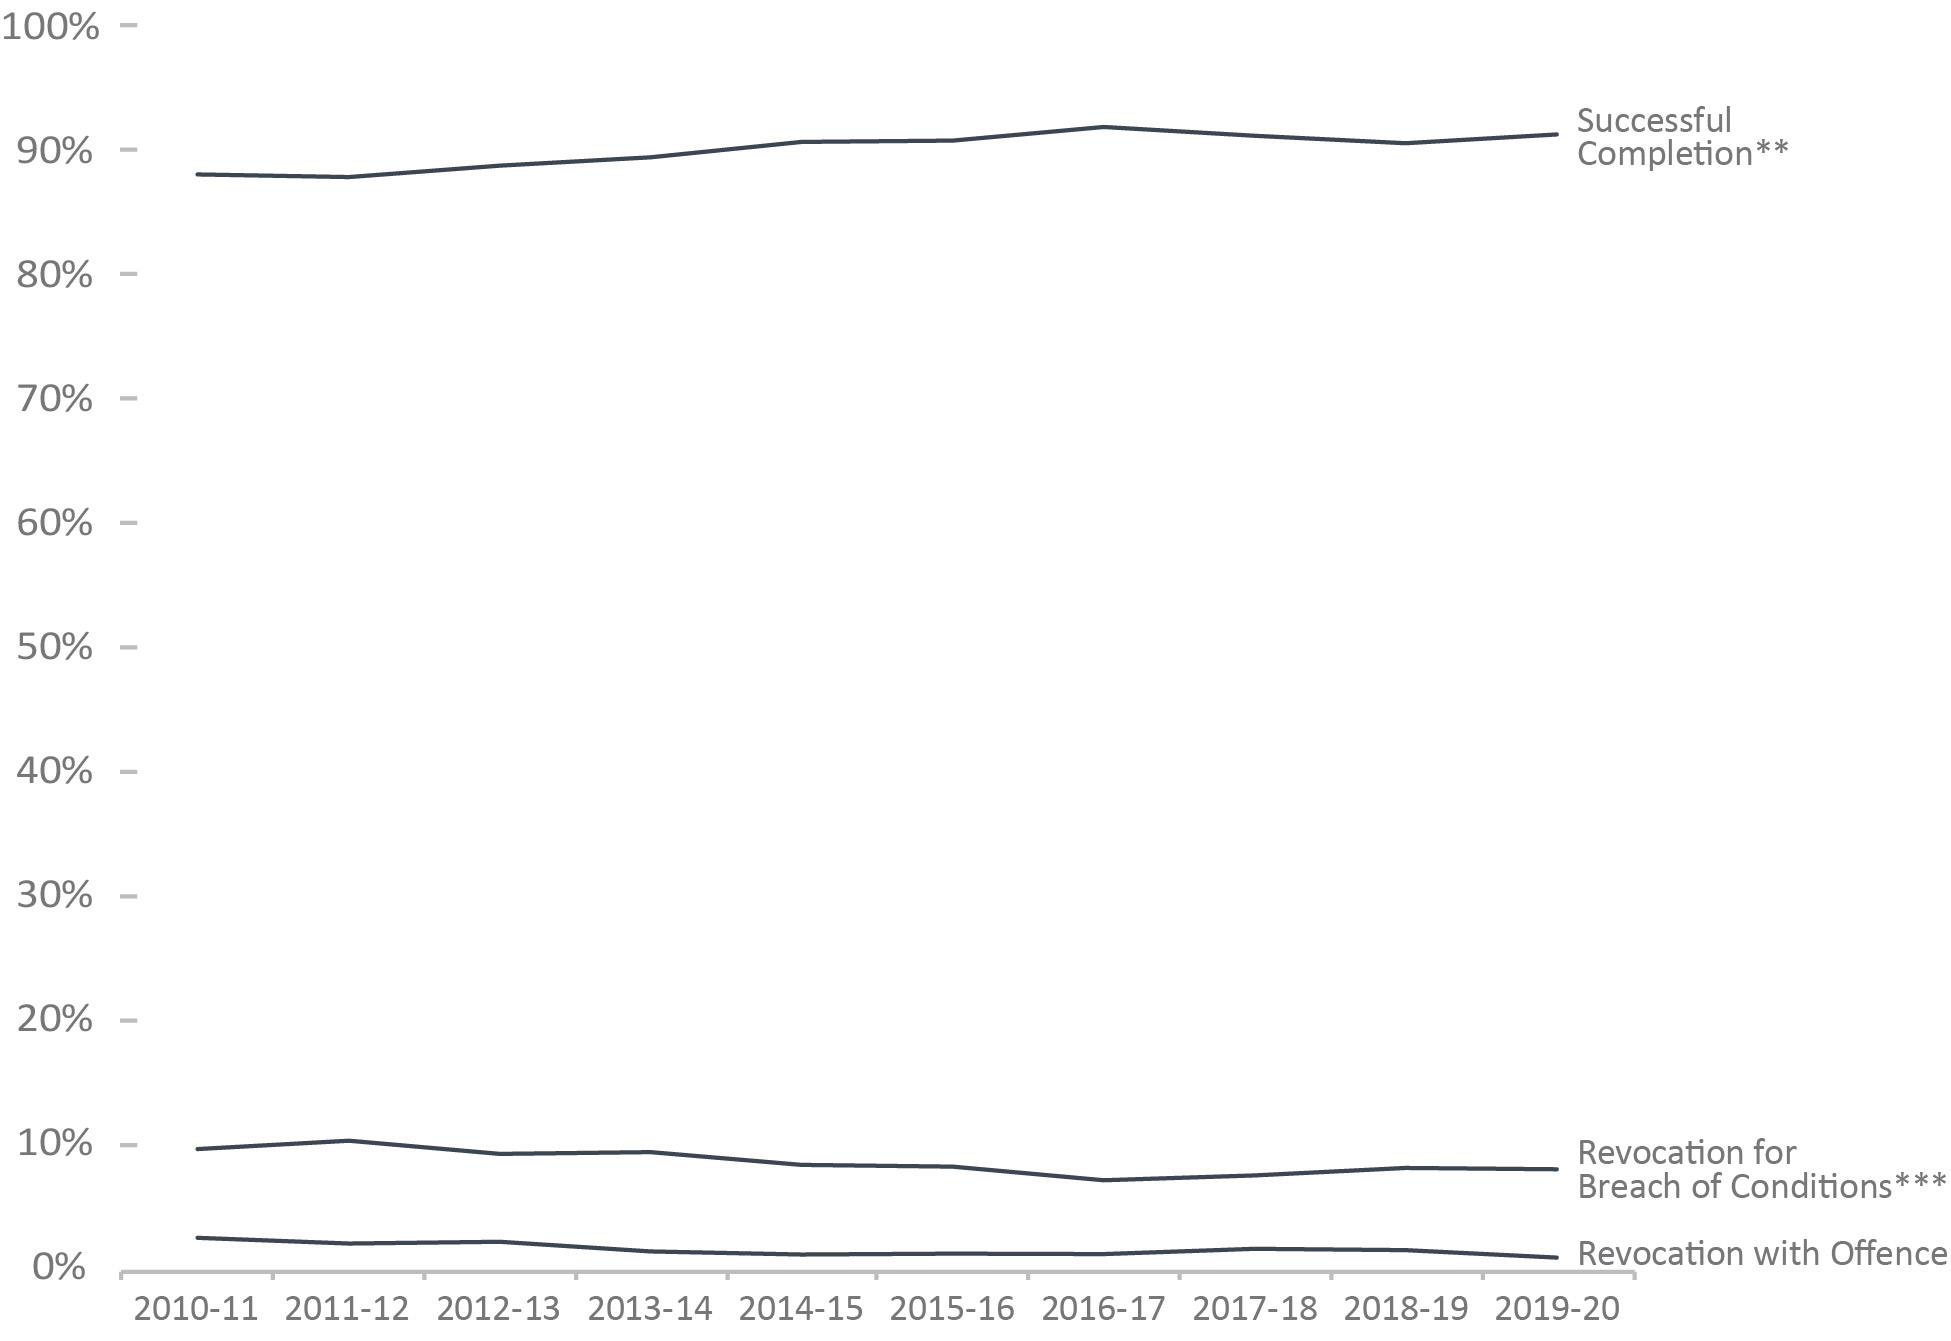
Image description
|
2010-11 Percent |
2011-12 Percent |
2012-13 Percent |
2013-14 Percent |
2014-15 Percent |
2015-16 Percent |
2016-17 Percent |
2017-18 Percent |
2018-19 Percent |
2019-20 Percent |
|---|---|---|---|---|---|---|---|---|---|---|
Successful CompletionFigure D8 footnote ** |
87.9 |
87.7 |
88.6 |
89.3 |
90.5 |
90.6 |
91.7 |
91.0 |
90.4 |
91.1 |
Revocation for Breach of ConditionsFigure D8 footnote *** |
9.6 |
10.3 |
9.2 |
9.4 |
8.3 |
8.2 |
7.1 |
7.5 |
8.1 |
8.0 |
Revocation with Offence |
2.5 |
2.0 |
2.2 |
1.4 |
1.2 |
1.2 |
1.2 |
1.6 |
1.5 |
0.9 |
Figure D8 Notes:
Source: Parole Board of Canada.
- In the last 10 years, the successful completionFigure D8 footnote ** rate of federal day parole supervision periods has been over 85.0%.
- In 2019-20, the successful completionFigure D8 footnote ** rate of federal day parole supervision periods remained relatively stable (91.1%; +0.7%) compared to 2018-19.
- During the five-year period (between 2015-16 and 2019-20), the successful completionFigure D8 footnote ** rate of federal regular day parole supervision periods was on average 5.7 percentage points lower than the rate of federal APR day parole supervision periods (90.9% and 96.6%, respectively).
- The rate of violentFigure D8 footnote **** reoffending of federal day parole supervision periods has been very low in the last five years, averaging 0.2%.
Federal Day Parole Outcomes |
2015-16 |
2016-17 |
2017-18 |
2018-19 |
2019-20 |
||||||
|---|---|---|---|---|---|---|---|---|---|---|---|
# |
% |
# |
% |
# |
% |
# |
% |
# |
% |
||
Successful CompletionTable D8 footnote ** |
Regular |
2,982 |
90.5 |
3,172 |
91.5 |
3,466 |
90.9 |
3,626 |
90.3 |
3,696 |
91.1 |
Accelerated |
38 |
100 |
86 |
97.7 |
84 |
93.3 |
75 |
98.7 |
57 |
95.0 |
|
Total |
3,020 |
90.6 |
3,258 |
91.7 |
3,550 |
91.0 |
3,701 |
90.4 |
3,753 |
91.1 |
|
Revocation for Breach of ConditionsTable D8 footnote *** |
Regular |
272 |
8.3 |
249 |
7.2 |
286 |
7.5 |
330 |
8.2 |
327 |
8.1 |
Accelerated |
0 |
0.0 |
2 |
2.3 |
6 |
6.7 |
1 |
1.3 |
3 |
5.0 |
|
Total |
272 |
8.2 |
251 |
7.1 |
292 |
7.5 |
331 |
8.1 |
330 |
8.0 |
|
Revocation with Non-Violent Offence |
Regular |
32 |
1.0 |
37 |
1.1 |
54 |
1.4 |
52 |
1.3 |
32 |
0.8 |
Accelerated |
0 |
0.0 |
0 |
0.0 |
0 |
0.0 |
0 |
0.0 |
0 |
0.0 |
|
Total |
32 |
1.0 |
37 |
1.0 |
54 |
1.4 |
52 |
1.3 |
32 |
0.8 |
|
Revocation with Violent OffenceTable D8 footnote **** |
Regular |
9 |
0.3 |
7 |
0.2 |
7 |
0.2 |
8 |
0.2 |
4 |
0.1 |
Accelerated |
0 |
0.0 |
0 |
0.0 |
0 |
0.0 |
0 |
0.0 |
0 |
0.0 |
|
Total |
9 |
0.3 |
7 |
0.2 |
7 |
0.2 |
8 |
0.2 |
4 |
0.1 |
|
Total Regular |
3,295 |
98.9 |
3,465 |
97.5 |
3,813 |
97.7 |
4,016 |
98.1 |
4,059 |
98.5 |
|
Total Accelerated |
38 |
1.1 |
88 |
2.5 |
90 |
2.3 |
76 |
1.9 |
60 |
1.5 |
|
Total (Regular and Accelerated) |
3,333 |
100 |
3,553 |
100 |
3,903 |
100 |
4,092 |
100 |
4,119 |
100 |
|
Table D8 Notes:
Source: Parole Board of Canada.
The successful completion rate of federal full parole supervision periods has remained stable
Figure D9: Full parole outcomesFigure D9 footnote * – 10-year trend

Image description
|
2010-11 Percent |
2011-12 Percent |
2012-13 Percent |
2013-14 Percent |
2014-15 Percent |
2015-16 Percent |
2016-17 Percent |
2017-18 Percent |
2018-19 Percent |
2019-20 Percent |
|---|---|---|---|---|---|---|---|---|---|---|
Successful CompletionFigure D9 footnote ** |
76.4 |
78.6 |
84.9 |
85.0 |
86.9 |
87.4 |
89.6 |
90.4 |
87.8 |
88.0 |
Revocation for Breach of ConditionsFigure D9 footnote *** |
16.6 |
15.3 |
10.5 |
10.5 |
9.1 |
8.9 |
7.0 |
6.8 |
9.5 |
9.8 |
Revocation with Offence |
7.1 |
6.1 |
4.6 |
4.5 |
4.0 |
3.7 |
3.4 |
2.8 |
2.8 |
2.2 |
Figure D9 Notes:
Source: Parole Board of Canada.
- In 2019-20, the successful completion rateFigure D9 footnote ** of federal full parole supervision periods for offenders serving determinate sentences remained stable (88.0%; +0.3%) compared to 2018-19.
- During the five-year period (between 2015-16 and 2019-20), the successful completion rateFigure D9 footnote ** of federal regular full parole supervision periods was on average 1.7 percentage points lower than the rate of federal APR full parole supervision periods (88.4% and 90.1%, respectively).
- The rate of violentFigure D9 footnote **** reoffending of federal full parole supervision periods has been relatively low in the last five years, averaging 0.5%.
Federal Full Parole Outcomes |
2015-16 |
2016-17 |
2017-18 |
2018-19 |
2019-20 |
||||||
|---|---|---|---|---|---|---|---|---|---|---|---|
# |
% |
# |
% |
# |
% |
# |
% |
# |
% |
||
Successful CompletionTable D9 footnote ** |
Regular |
757 |
87.5 |
848 |
89.7 |
968 |
90.6 |
1,061 |
87.0 |
1,168 |
87.8 |
Accelerated |
95 |
86.4 |
87 |
87.9 |
102 |
88.7 |
114 |
95.8 |
104 |
91.2 |
|
Total |
852 |
87.4 |
935 |
89.6 |
1,070 |
90.4 |
1,175 |
87.8 |
1,272 |
88.0 |
|
Revocation for Breach of ConditionsTable D9 footnote *** |
Regular |
76 |
8.8 |
64 |
6.8 |
73 |
6.8 |
123 |
10.1 |
132 |
9.9 |
Accelerated |
11 |
10.0 |
9 |
9.1 |
8 |
7.0 |
4 |
3.4 |
9 |
7.9 |
|
Total |
87 |
8.9 |
73 |
7.0 |
81 |
6.8 |
127 |
9.5 |
141 |
9.8 |
|
Revocation with Non-Violent Offence |
Regular |
25 |
2.9 |
28 |
3.0 |
23 |
2.2 |
27 |
2.2 |
26 |
2.0 |
Accelerated |
4 |
3.6 |
2 |
2.0 |
5 |
4.3 |
1 |
0.8 |
1 |
0.9 |
|
Total |
29 |
3.0 |
30 |
2.9 |
28 |
2.4 |
28 |
2.1 |
27 |
1.9 |
|
Revocation with Violent OffenceTable D9 footnote **** |
Regular |
7 |
0.8 |
5 |
0.5 |
5 |
0.5 |
9 |
0.7 |
5 |
0.4 |
Accelerated |
0 |
0.0 |
1 |
1.0 |
0 |
0.0 |
0 |
0.0 |
0 |
0.0 |
|
Total |
7 |
0.7 |
6 |
0.6 |
5 |
0.4 |
9 |
0.7 |
5 |
0.3 |
|
Total Regular |
865 |
88.7 |
945 |
90.5 |
1,069 |
90.3 |
1,220 |
91.1 |
1,331 |
92.1 |
|
Total Accelerated |
110 |
11.3 |
99 |
9.5 |
115 |
9.7 |
119 |
8.9 |
114 |
7.9 |
|
Total (Regular and Accelerated) |
975 |
100 |
1,044 |
100 |
1,184 |
100 |
1,339 |
100 |
1,445 |
100 |
|
Table D9 Notes:
Source: Parole Board of Canada.
The successful completion rate of statutory release supervision periods has remained stable
Figure D10: Statutory release outcomesFigure D10 footnote * – 10-year trend
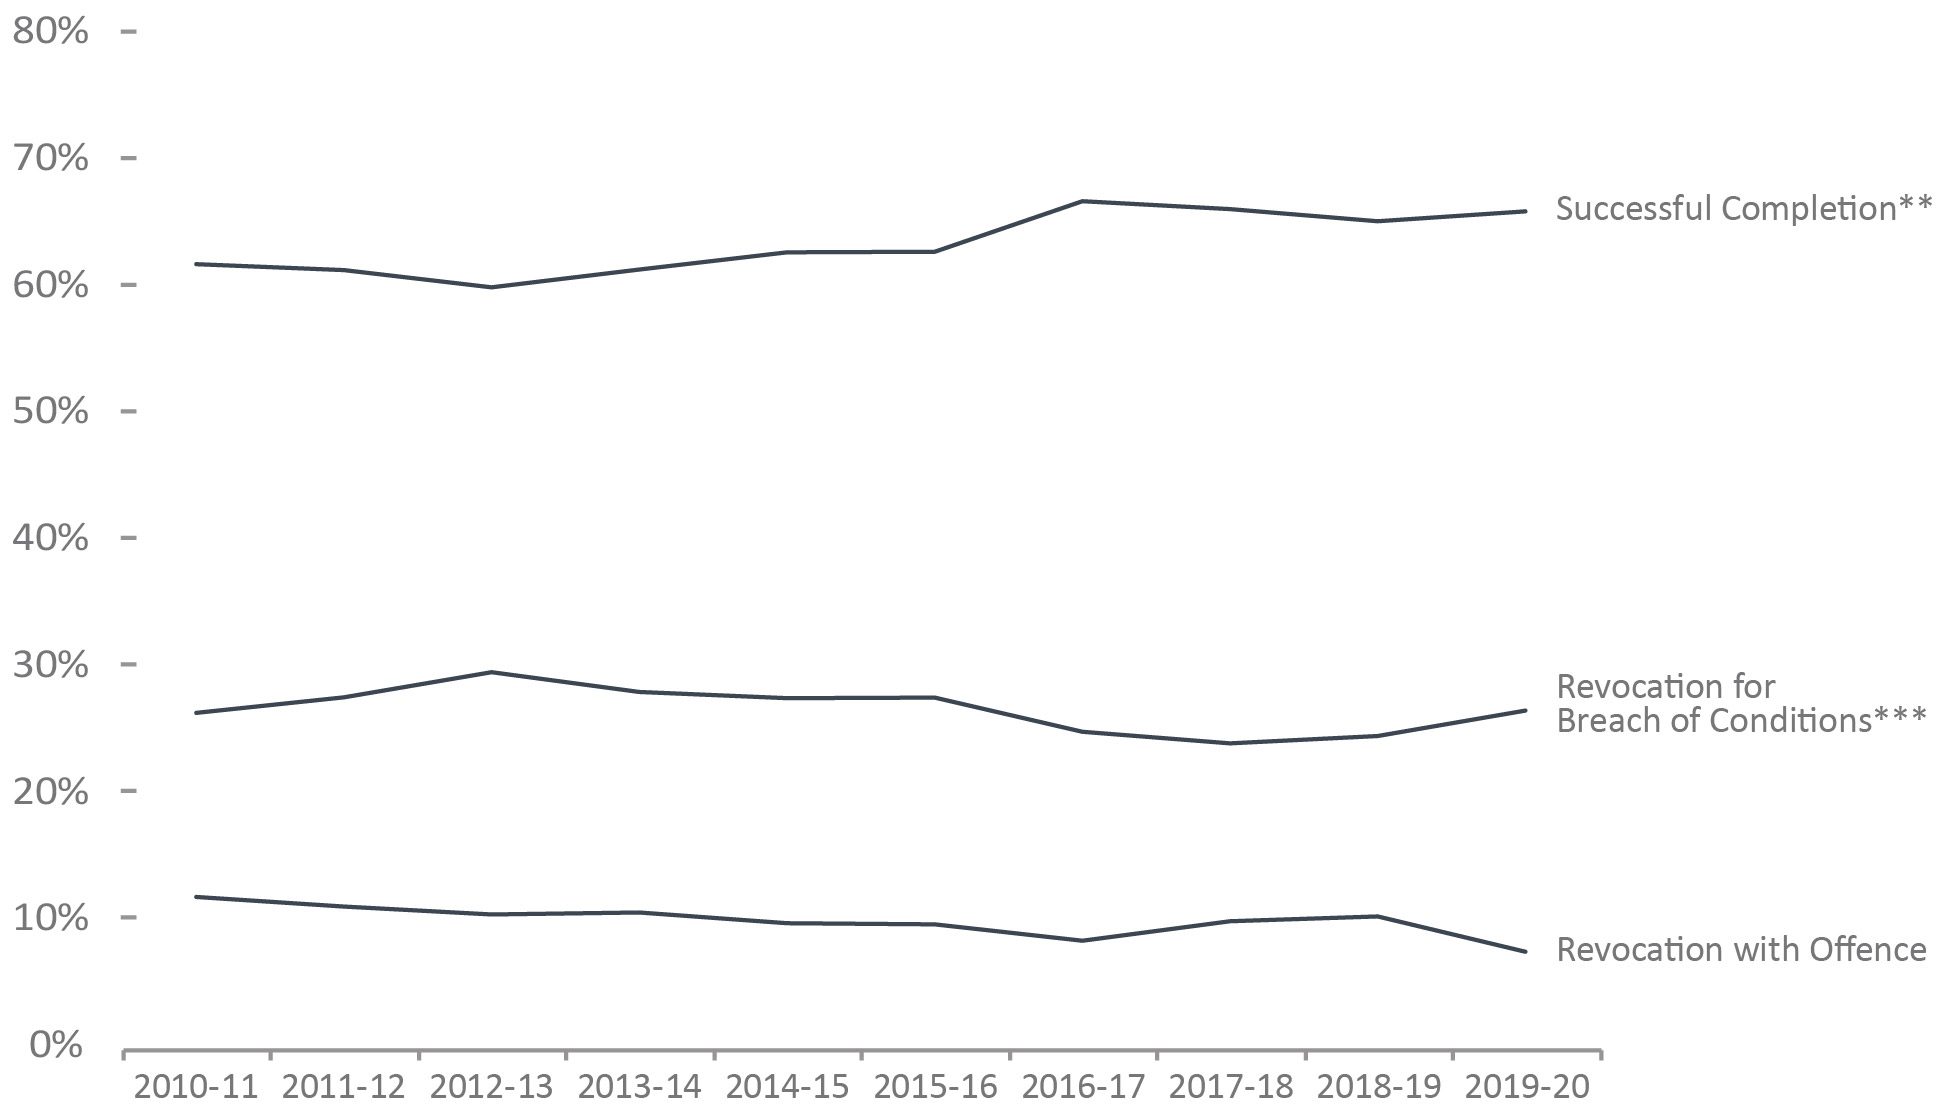
Image description
| 2010-11 Percent | 2011-12 Percent | 2012-13 Percent | 2013-14 Percent | 2014-15 Percent | 2015-16 Percent | 2016-17 Percent | 2017-18 Percent | 2018-19 Percent | 2019-20 Percent | |
|---|---|---|---|---|---|---|---|---|---|---|
| Successful CompletionFigure D10 footnote ** | 61.8 |
61.3 |
59.9 |
61.3 |
62.7 |
62.7 |
66.7 |
66.1 |
65.1 |
65.9 |
| Revocation for Breach of ConditionsFigure D10 footnote *** | 26.4 |
27.6 |
29.6 |
28.0 |
27.5 |
27.6 |
24.9 |
24.0 |
24.5 |
26.5 |
| Revocation with Offence | 11.9 |
11.1 |
10.5 |
10.6 |
9.8 |
9.7 |
8.4 |
9.9 |
10.3 |
7.5 |
Figure D10 Notes:
Source: Parole Board of Canada.
- In 2019-20, the successful completionFigure D10 footnote ** rate of statutory releaseFigure D10 footnote * supervision periods remained stable (65.9%; +0.8%) compared to 2018-19.
- Over the last five years, the revocation with violent offenceFigure D10 footnote **** rates were, on average, eight times higher for offenders on statutory releaseFigure D10 footnote * than for offenders on federal day parole and 2.8 times higher than for offenders on federal full parole.
- The rate of revocation with a violent offenceFigure D10 footnote **** of statutory releaseFigure D10 footnote * supervision periods was on average 1.5% in the last five years.
An offender serving a determinate sentence, if he/she is not detained, will be subject to statutory release after serving 2/3 of his/her sentence if he/she is not on full parole at that time. On statutory release, an offender is subject to supervision until the end of his/her sentence.
Statutory Release Outcomes |
2015-16 |
2016-17 |
2017-18 |
2018-19 |
2019-20 |
|||||
|---|---|---|---|---|---|---|---|---|---|---|
# |
% |
# |
% |
# |
% |
# |
% |
# |
% |
|
Successful CompletionTable D10 footnote ** |
3,778 |
62.7 |
3,776 |
66.7 |
3,562 |
66.1 |
3,303 |
65.1 |
3,372 |
65.9 |
Revocation for Breach of ConditionsTable D10 footnote *** |
1,661 |
27.6 |
1,407 |
24.9 |
1,291 |
24.0 |
1,244 |
24.5 |
1,358 |
26.5 |
Revocation with Non-Violent Offence |
485 |
8.1 |
386 |
6.8 |
456 |
8.5 |
444 |
8.8 |
328 |
6.4 |
Revocation with Violent OffenceTable D10 footnote **** |
98 |
1.6 |
89 |
1.6 |
79 |
1.5 |
79 |
1.6 |
57 |
1.1 |
Total |
6,022 |
100 |
5,658 |
100 |
5,388 |
100 |
5,070 |
100 |
5,115 |
100 |
Table D10 Notes:
Source: Parole Board of Canada.
An offender serving a determinate sentence, if he/she is not detained, will be subject to statutory release after serving 2/3 of his/her sentence if he/she is not on full parole at that time. On statutory release, an offender is subject to supervision until the end of his/her sentence.
Over the last ten years, the rates of conviction for violent offences for offenders on federal conditional release have declined
Figure D11: Rate of conviction for violent offencesFigure D11 footnote * per 1,000 supervised offendersFigure D11 footnote **
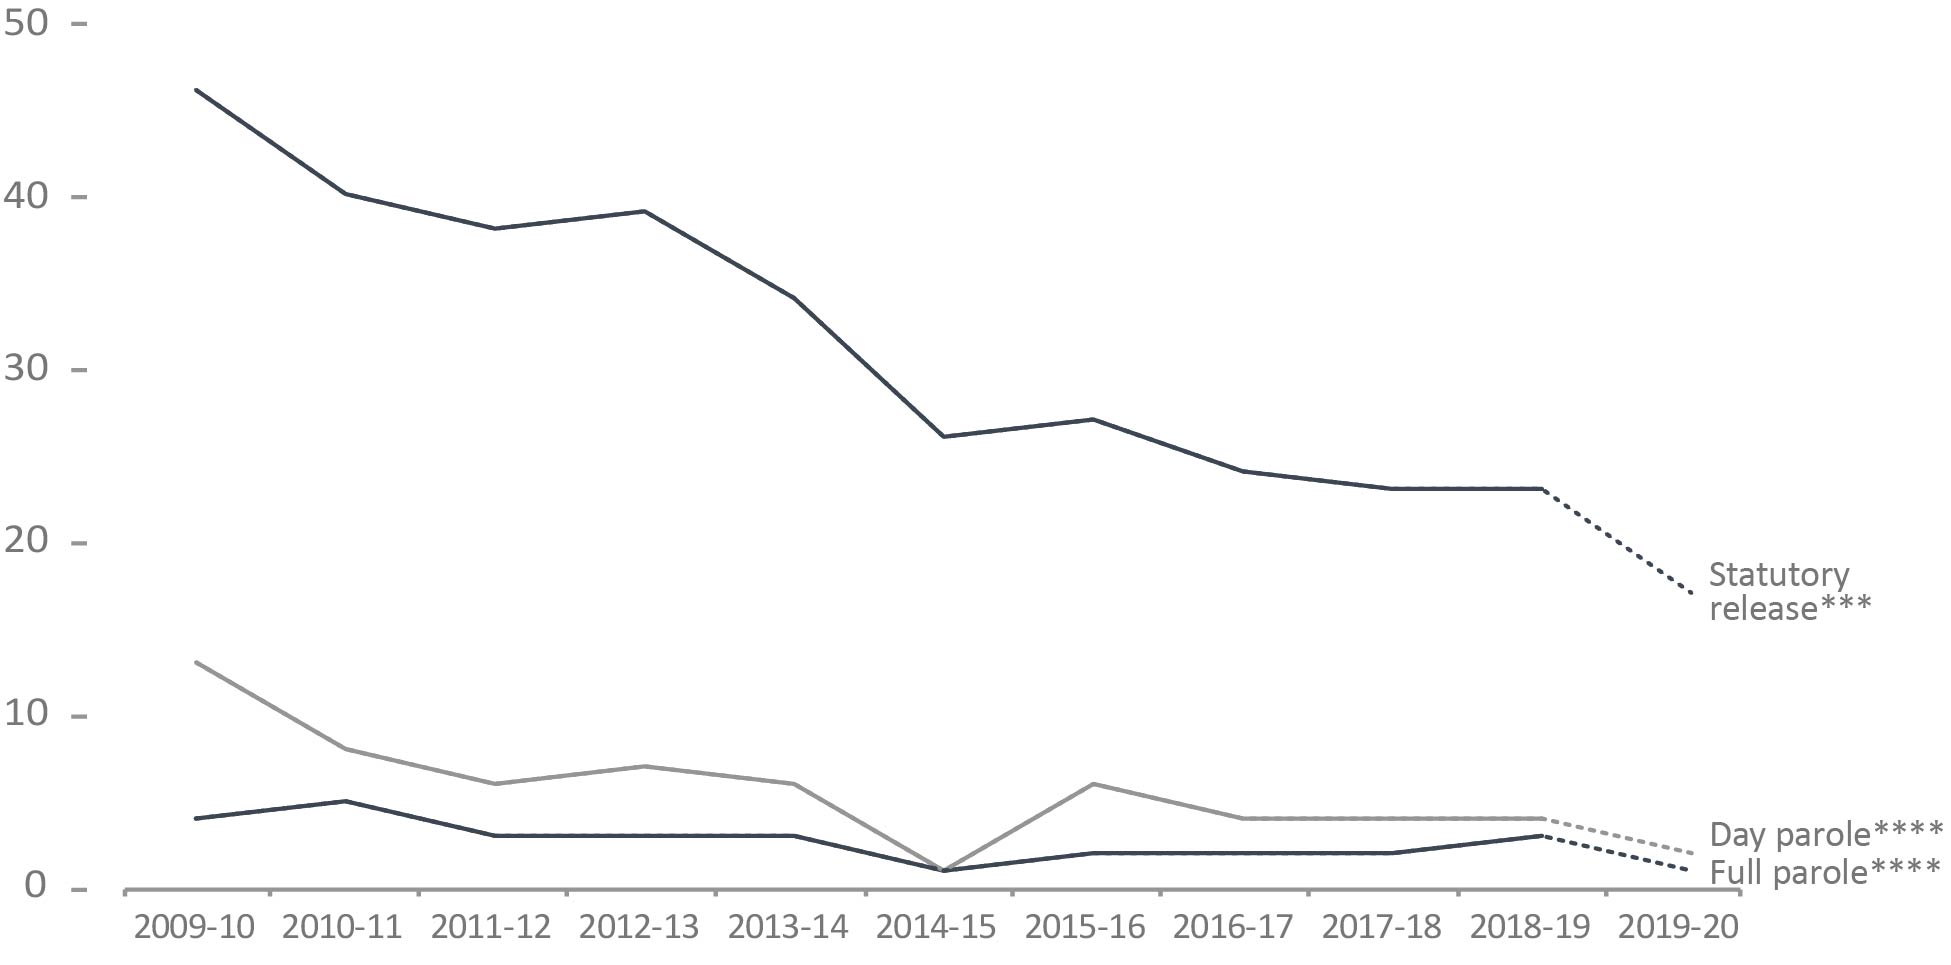
Image description
Year |
Statutory ReleaseFigure D11 footnote *** |
Day ParoleFigure D11 footnote **** |
Full ParoleFigure D11 footnote **** |
|---|---|---|---|
2009-10 |
46 |
13 |
4 |
2010-11 |
40 |
8 |
5 |
2011-12 |
38 |
6 |
3 |
2012-13 |
39 |
7 |
3 |
2013-14 |
34 |
6 |
3 |
2014-15 |
26 |
1 |
1 |
2015-16 |
27 |
6 |
2 |
2016-17 |
24 |
4 |
2 |
2017-18 |
23 |
4 |
2 |
2018-19 |
23 |
4 |
3 |
2019-20Figure D11 footnote ** |
17 |
2 |
1 |
Figure D11 Notes:
Source: Parole Board of Canada.
- During the ten year period between 2009-10 and 2018-19, the number of convictions for a violent offenceFigure D11 footnote * for offenders on federal conditional release decreased 45% (from 182 in 2009-10 to 100 in 2018-19). Day parolees averaged 8 convictions for violent offencesFigure D11 footnote * annually and full parolees, 11 convictions compared to 116 by offenders on statutory releaseFigure D11 footnote ***.
- During the ten year period between 2009-10 and 2018-19, convictions for violentFigure D11 footnote * offences on statutory releaseFigure D11 footnote *** accounted for 85% of all convictions by offenders on federal conditional release.
- When comparing the rates of conviction for violentFigure D11 footnote * offences per 1,000 supervised offendersFigure D11 footnote ** (between 2009-10 and 2018-19), offenders on statutory releaseFigure D11 footnote *** were 11.4 times more likely to commit a violent offence during their supervision periods than offenders on full parole, and 5.4 times more likely to commit a violent offence than offenders on day parole.
The dotted line between 2018-19 and 2019-20 is intended to signify that due to delays in the court process, these numbers under-represent the actual number of convictions, as verdicts may not have been reached by year-end.
Year |
# of Convictions for Violent OffencesTable D11 footnote * |
Rates per 1,000 Supervised OffendersTable D11 footnote ** |
|||||
|---|---|---|---|---|---|---|---|
Day ParoleTable D11 footnote *** |
Full ParoleTable D11 footnote *** |
Statutory ReleaseTable D11 footnote **** |
Total |
Day ParoleTable D11 footnote *** |
Full ParoleTable D11 footnote *** |
Statutory ReleaseTable D11 footnote **** |
|
2009-10 |
17 |
16 |
149 |
182 |
13 |
4 |
46 |
2010-11 |
10 |
19 |
129 |
158 |
8 |
5 |
40 |
2011-12 |
8 |
10 |
135 |
153 |
6 |
3 |
38 |
2012-13 |
9 |
11 |
136 |
156 |
7 |
3 |
39 |
2013-14 |
7 |
10 |
120 |
137 |
6 |
3 |
34 |
2014-15 |
1 |
4 |
92 |
97 |
1 |
1 |
26 |
2015-16 |
9 |
9 |
98 |
116 |
6 |
2 |
27 |
2016-17 |
7 |
9 |
89 |
105 |
4 |
2 |
24 |
2017-18 |
7 |
7 |
79 |
93 |
4 |
2 |
23 |
2018-19 |
8 |
13 |
79 |
100 |
4 |
3 |
23 |
2019-20 |
4 |
5 |
57 |
66 |
2 |
1 |
17 |
Table D11 Notes:
Source: Parole Board of Canada.
The number of CSC offenders granted temporary absences
Figure D12: Number of offenders granted temporary absencesFigure D12 footnote * and work releasesFigure D12 footnote **
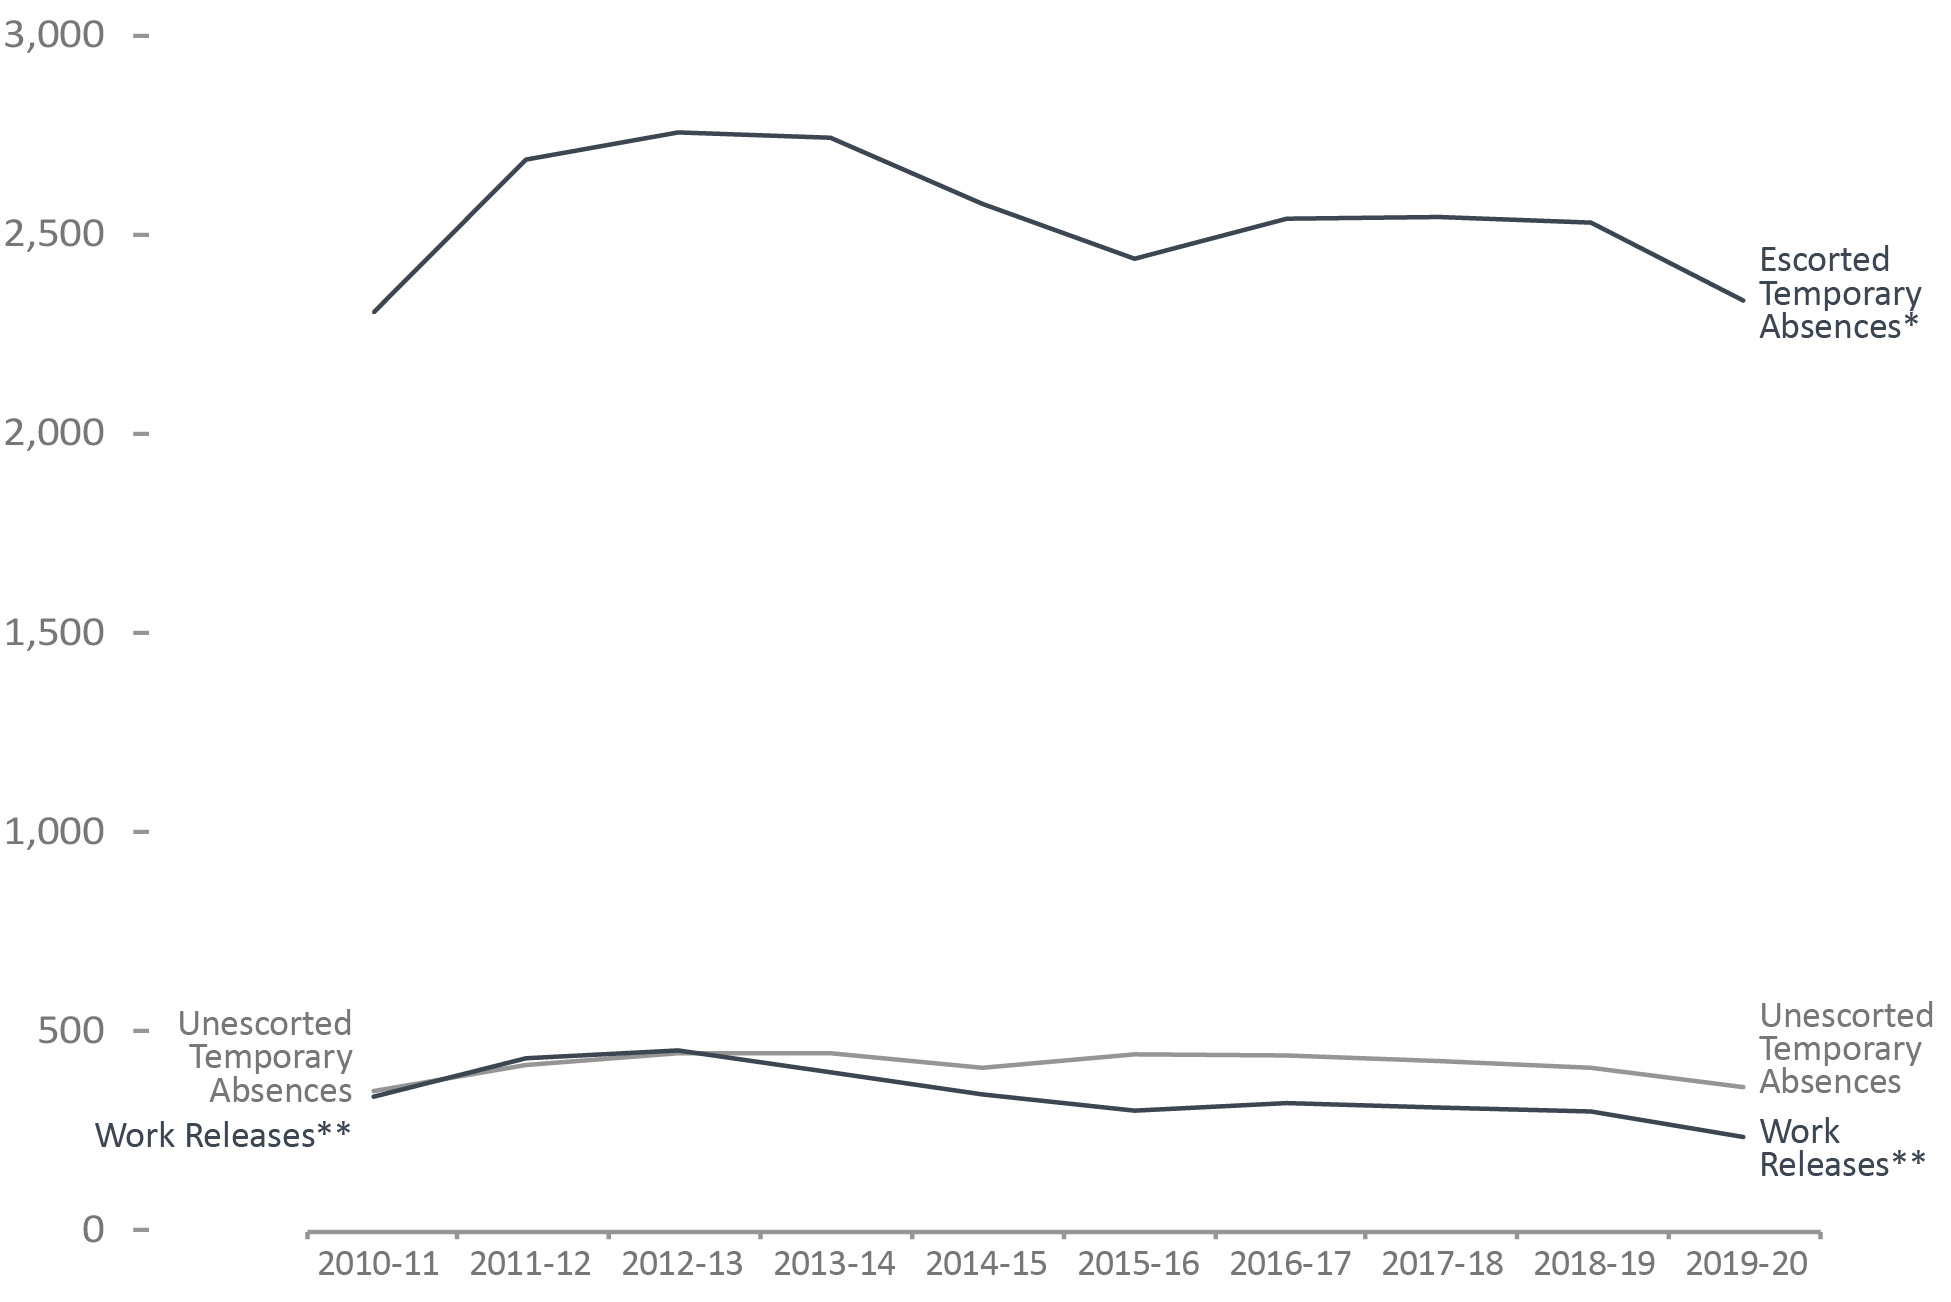
Image description
| Year | Temporary AbsencesFigure D12 footnote * | Work ReleasesFigure D12 footnote ** | |
|---|---|---|---|
| Escorted | Unescorted | ||
| # of Offenders | # of Offenders | # of Offenders | |
| 2010-11 | 2,303 | 353 | 339 |
| 2011-12 | 2,685 | 418 | 435 |
| 2012-13 | 2,753 | 448 | 455 |
| 2013-14 | 2,740 | 448 | 400 |
| 2014-15 | 2,574 | 411 | 345 |
| 2015-16 | 2,437 | 445 | 304 |
| 2016-17 | 2,537 | 442 | 323 |
| 2017-18 | 2,541 | 428 | 312 |
| 2018-19 | 2,527 | 411 | 302 |
| 2019-20 | 2,332 | 363 | 238 |
Figure D12 Notes:
Source: Correctional Service of Canada.
- The number of offenders that received escorted temporary absencesTable D12 footnote * decreased, from 2,527 in 2018-19 to 2,332 in 2019-20. There was a decrease in the number of offenders receiving unescorted temporary absencesTable D12 footnote *, from 411 in 2018-19 to 363 in 2019-20.
- The number of offenders receiving work releasesTable D12 footnote ** has decreased by 21.2%, from 302 in 2018-19 to 238 in 2019-20.
- For the past 10 years, the average successful completion rates for escorted temporary absencesTable D12 footnote * was 99.6%, 98.8% for unescorted temporary absencesTable D12 footnote * and 94.7% for work releasesTable D12 footnote **.
These numbers depict the number of offenders who received at least one temporary absence permit (excluding those for medical purposes) or at least one work release. An offender may be granted more than one temporary absence permit or work release over a period of time.
Year |
Temporary AbsencesTable D12 footnote * |
Work ReleasesTable D12 footnote ** |
||||
|---|---|---|---|---|---|---|
Escorted |
Unescorted |
|||||
# of Offenders |
# of Permits |
# of Offenders |
# of Permits |
# of Offenders |
# of Permits |
|
2010-11 |
2,303 |
40,070 |
353 |
3,117 |
339 |
1,343 |
2011-12 |
2,685 |
44,396 |
418 |
3,891 |
435 |
875 |
2012-13 |
2,753 |
47,814 |
448 |
3,709 |
455 |
815 |
2013-14 |
2,740 |
49,502 |
448 |
4,005 |
400 |
643 |
2014-15 |
2,574 |
49,630 |
411 |
3,563 |
345 |
489 |
2015-16 |
2,437 |
47,072 |
445 |
4,077 |
304 |
418 |
2016-17 |
2,537 |
48,569 |
442 |
3,778 |
323 |
481 |
2017-18 |
2,541 |
50,483 |
428 |
3,165 |
312 |
443 |
2018-19 |
2,527 |
55,929 |
411 |
2,819 |
302 |
434 |
2019-20 |
2,332 |
51,188 |
363 |
2,910 |
238 |
333 |
Table D12 Notes:
Source: Correctional Service of Canada.
Section E. Statistics on Special Applications of Criminal Justice
The number of initial detention reviews
Figure E1: Number of initial detention reviews
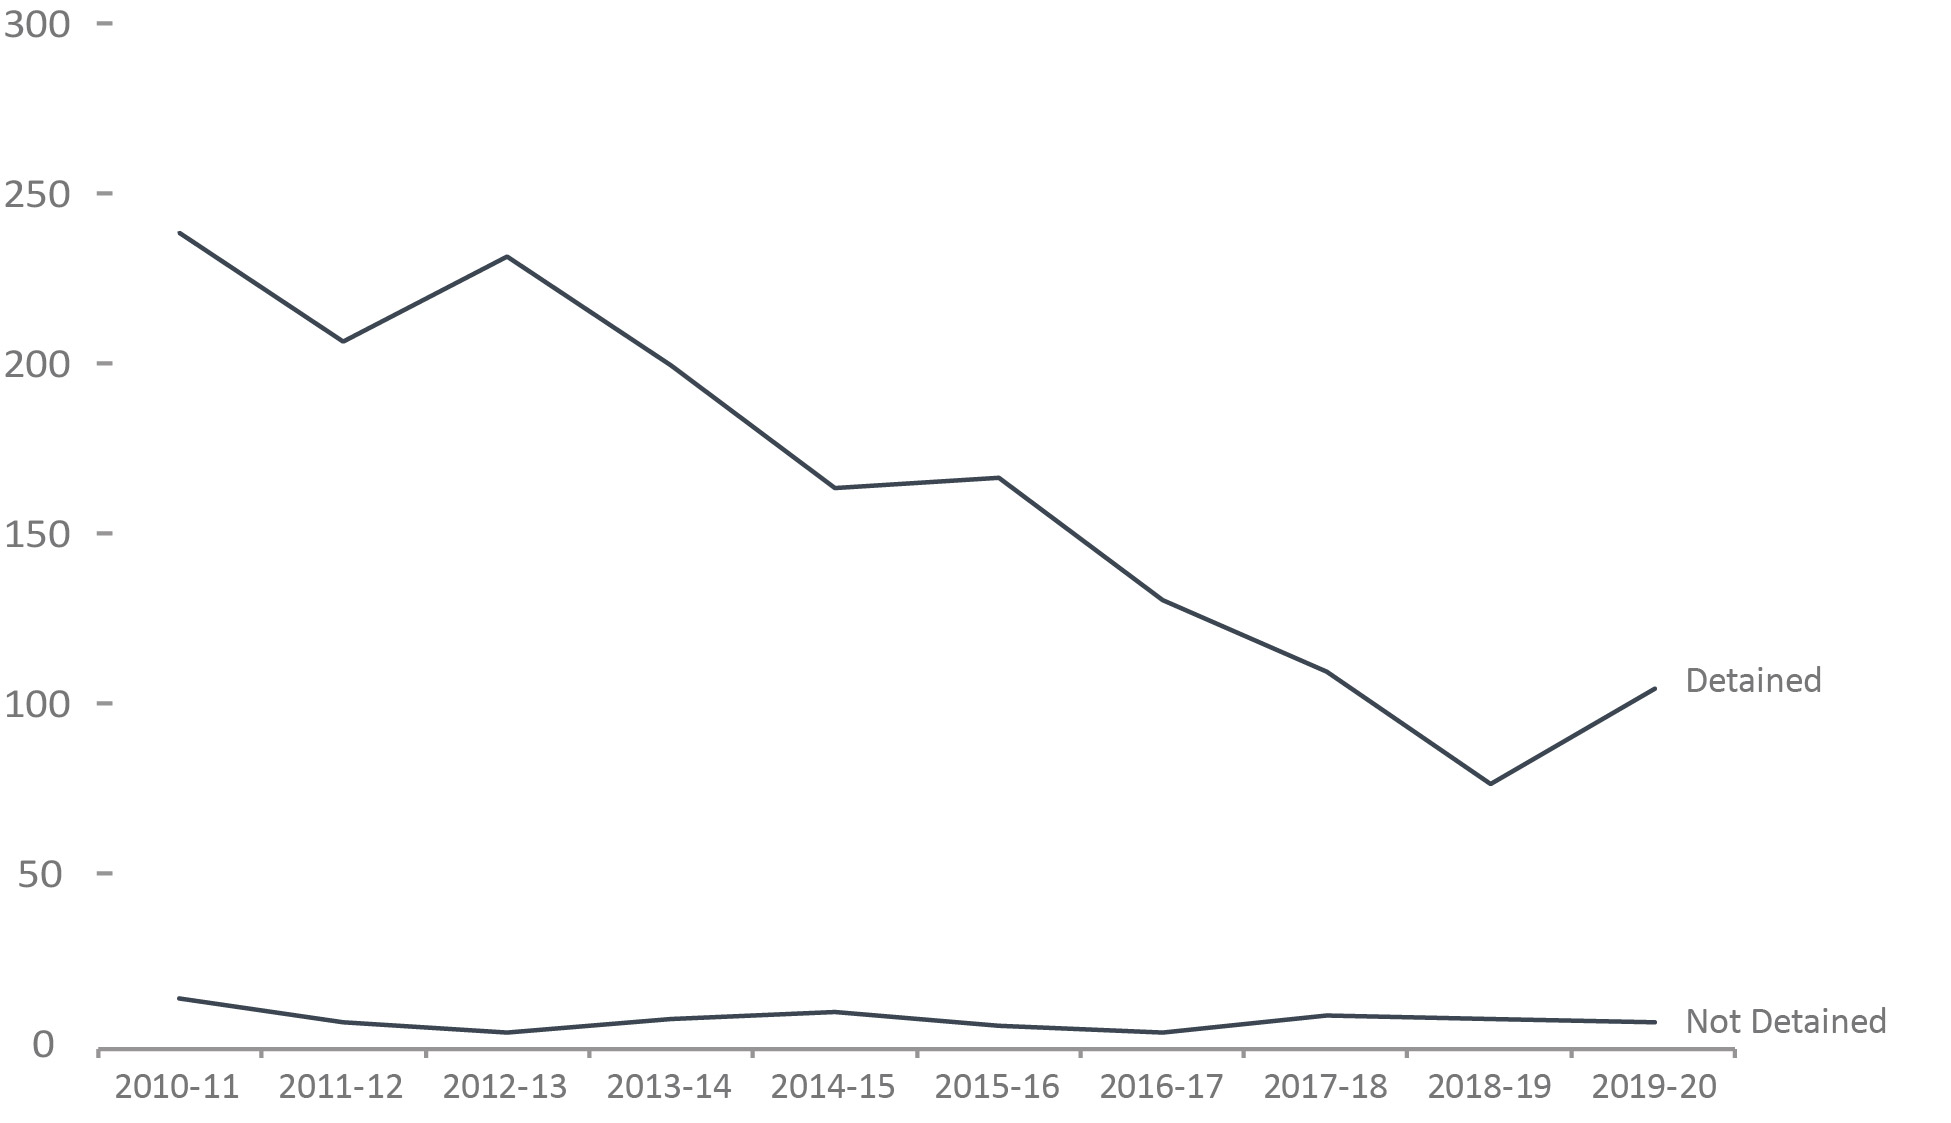
Image description
| Year | Detained | Not Detained |
|---|---|---|
| 2010-11 | 239 |
14 |
| 2011-12 | 207 |
7 |
| 2012-13 | 232 |
4 |
| 2013-14 | 200 |
8 |
| 2014-15 | 164 |
10 |
| 2015-16 | 167 |
6 |
| 2016-17 | 131 |
4 |
| 2017-18 | 110 |
9 |
| 2018-19 | 77 |
8 |
| 2019-20 | 105 |
7 |
Figure E1 Notes:
Source: Parole Board of Canada.
- In 2019-20, the number of referrals for detention increased to 112 (from 85) when compared to 2018-19.
- The proportion of Indigenous (92.2%; +3.8%) and non-Indigenous (95.1%; +2.2%) offenders detained as a result of a detention review increased compared to the previous year.
- In 2019-20, Indigenous offenders accounted for 30.5% of federal incarcerated offenders serving determinate sentences while they accounted for 45.5% of offenders referred for detention.
According to the Corrections and Conditional Release Act, an offender entitled to statutory release after serving two-thirds of the sentence may be held in custody until warrant expiry if it is established that the offender is likely to commit, before the expiry of his/her sentence, an offence causing death or serious harm, a serious drug offence or a sex offence involving a child.
Year |
Detained |
Statutory Release |
Total |
Total |
|||||||
|---|---|---|---|---|---|---|---|---|---|---|---|
Non- Ind.Table E1 footnote ** |
Total |
% |
Non- Ind.Table E1 footnote ** |
Total |
% |
Non- Ind.Table E1 footnote ** |
|||||
2010-11 |
112 |
127 |
239 |
94.5 |
5 |
9 |
14 |
5.5 |
117 |
136 |
253 |
2011-12 |
89 |
118 |
207 |
96.7 |
3 |
4 |
7 |
3.3 |
92 |
122 |
214 |
2012-13 |
91 |
141 |
232 |
98.3 |
4 |
0 |
4 |
1.7 |
95 |
141 |
236 |
2013-14 |
88 |
112 |
200 |
96.2 |
4 |
4 |
8 |
3.8 |
92 |
116 |
208 |
2014-15 |
70 |
94 |
164 |
94.3 |
5 |
5 |
10 |
5.7 |
75 |
99 |
174 |
2015-16 |
74 |
93 |
167 |
96.5 |
2 |
4 |
6 |
3.5 |
76 |
97 |
173 |
2016-17 |
55 |
76 |
131 |
97.0 |
2 |
2 |
4 |
3.0 |
57 |
78 |
135 |
2017-18 |
51 |
59 |
110 |
92.4 |
5 |
4 |
9 |
7.6 |
56 |
63 |
119 |
2018-19 |
38 |
39 |
77 |
90.6 |
5 |
3 |
8 |
9.4 |
43 |
42 |
85 |
2019-20 |
47 |
58 |
105 |
93.8 |
4 |
3 |
7 |
6.3 |
51 |
61 |
112 |
Total |
1,162 |
1,689 |
2,851 |
94.1 |
68 |
111 |
179 |
5.9 |
1,230 |
1,800 |
3,030 |
Table E1 Notes:
Source: Parole Board of Canada.
According to the Corrections and Conditional Release Act, an offender entitled to statutory release after serving two-thirds of the sentence may be held in custody until warrant expiry if it is established that the offender is likely to commit, before the expiry of his/her sentence, an offence causing death or serious harm, a serious drug offence or a sex offence involving a child.
76% of judicial review hearings have resulted in earlier parole eligibility
Figure E2: Judicial reviewFigure E2 footnote * hearings at the end of the fiscal year (2019-20)
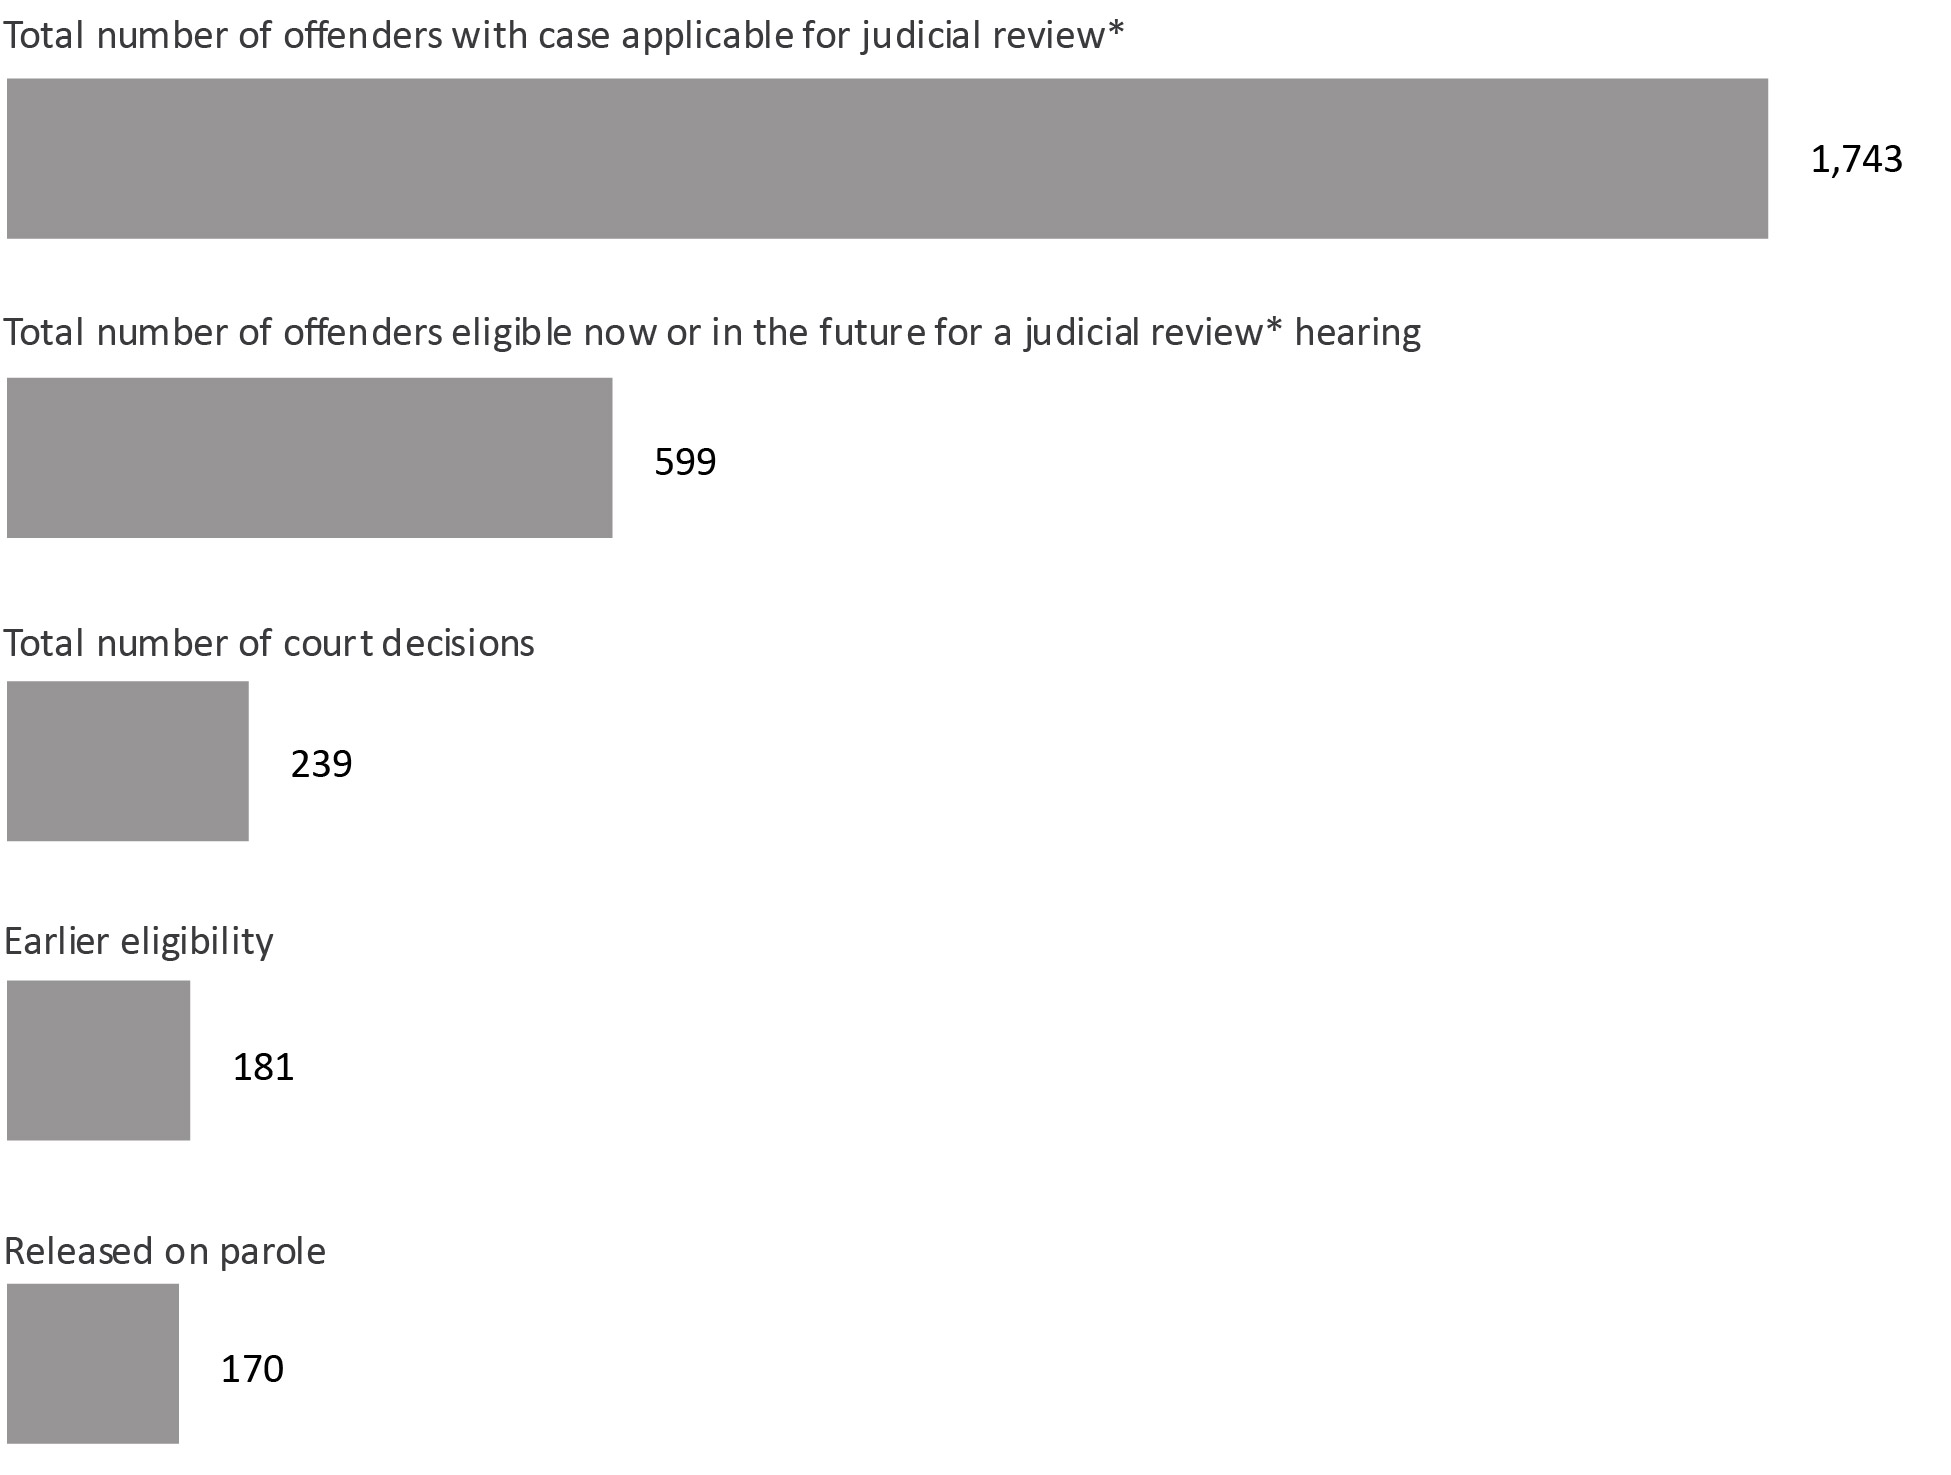
Image description
| Total number of offenders with case applicable for judicial reviewFigure E2 footnote * | 1,743 |
|---|---|
| Total number of offenders eligible now or in the future for a judicial review* hearing | 599 |
| Total number of court decisions | 239 |
| Earlier eligibility | 181 |
| Released on parole | 170 |
Table E2 Notes:
Source: Correctional Service of Canada.
- Since the first judicial reviewFigure E2 footnote * hearing in 1987, there have been a total of 239 court decisions.
- Of these cases, 75.7% of the court decisions resulted in a reduction of the period that must be served before parole eligibility.
- Of the 599 offenders eligible to apply for a judicial reviewFigure E2 footnote *, 263 had already served 15 years of their sentence, whereas 336 had not.
- Of the 181 offenders who had their parole eligibility date moved closer, 177 had reached their revised Day Parole eligibility date. Of these offenders, 170 were released on parole, and 117 were being actively supervised in the communityFigure E2 footnote **.
- A higher percentage of second degree (83.3%) than first degree (74.9%) murder cases have resulted in a reduction of the period required to be served before parole eligibility.
Province/Territory of Judicial ReviewTable E2 footnote * |
Parole Ineligibility Reduced by Court |
Reduction Denied by Court |
Total |
|||
|---|---|---|---|---|---|---|
1st Degree Murder |
2nd Degree Murder |
1st Degree Murder |
2nd Degree Murder |
1st Degree Murder |
2nd Degree Murder |
|
British Columbia |
26 |
1 |
7 |
0 |
33 |
1 |
Alberta |
19 |
0 |
7 |
1 |
26 |
1 |
Saskatchewan |
7 |
0 |
3 |
0 |
10 |
0 |
Manitoba |
8 |
3 |
1 |
0 |
9 |
3 |
Ontario |
23 |
0 |
29 |
1 |
52 |
1 |
Quebec |
76 |
15 |
6 |
2 |
82 |
17 |
New Brunswick |
1 |
0 |
0 |
0 |
1 |
0 |
Nova Scotia |
1 |
1 |
1 |
0 |
2 |
1 |
Prince Edward Island |
0 |
0 |
0 |
0 |
0 |
0 |
Newfoundland & Labrador |
0 |
0 |
0 |
0 |
0 |
0 |
Yukon |
0 |
0 |
0 |
0 |
0 |
0 |
Northwest Territories |
0 |
0 |
0 |
0 |
0 |
0 |
Nunavut |
0 |
0 |
0 |
0 |
0 |
0 |
Sub-total |
161 |
20 |
54 |
4 |
215 |
24 |
Total |
181 |
58 |
239 |
|||
Table E2 Notes:
Source: Correctional Service of Canada.
The number of Dangerous Offender designations
Figure E3: Number of Dangerous OffendersFigure E3 footnote * designated
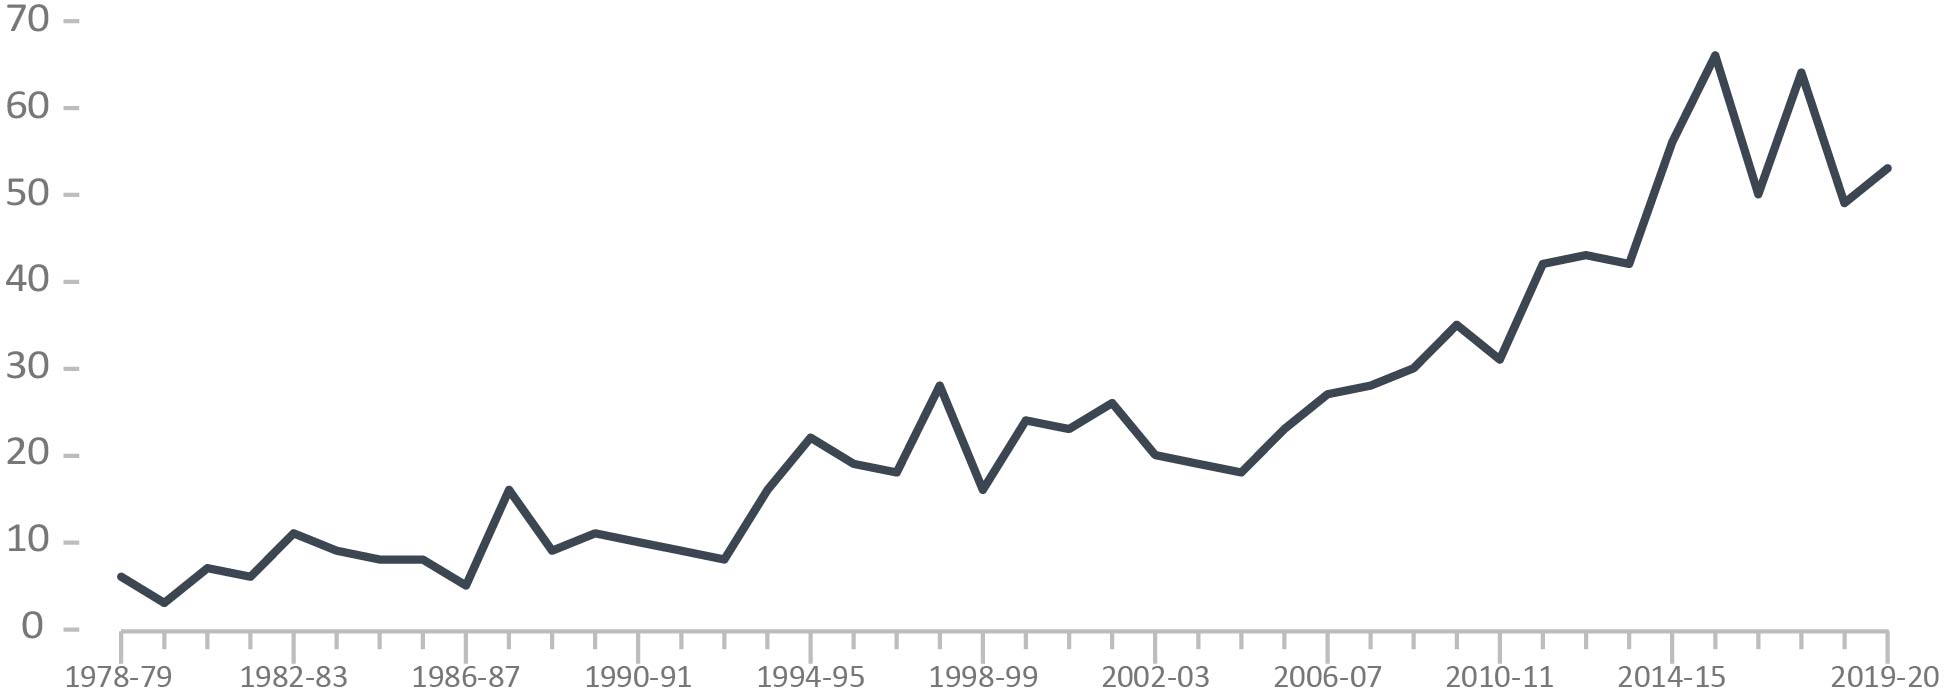
Image description
Fiscal Year |
Number of Offenders |
|---|---|
1978-1979 |
6 |
1979-1980 |
3 |
1980-1981 |
7 |
1981-1982 |
6 |
1982-1983 |
11 |
1983-1984 |
9 |
1984-1985 |
8 |
1985-1986 |
8 |
1986-1987 |
5 |
1987-1988 |
16 |
| 1988-1989 | 9 |
1989-1990 |
11 |
1990-1991 |
10 |
1991-1992 |
9 |
1992-1993 |
8 |
1993-1994 |
16 |
1994-1995 |
22 |
1995-1996 |
19 |
1996-1997 |
18 |
1997-1998 |
28 |
1998-1999 |
16 |
1999-2000 |
24 |
2000-2001 |
23 |
2001-2002 |
26 |
2002-2003 |
20 |
2003-2004 |
19 |
2004-2005 |
18 |
2005-2006 |
23 |
| 2006-2007 | 27 |
2007-2008 |
28 |
2008-2009 |
30 |
2009-2010 |
35 |
2010-2011 |
31 |
2011-2012 |
42 |
2012-2013 |
43 |
2013-2014 |
42 |
2014-2015 |
56 |
2015-2016 |
66 |
2016-2017 |
50 |
2017-2018 |
64 |
2018-2019 |
49 |
2019-2020 |
53 |
Figure E3 Notes:
Source: Correctional Service of Canada.
- At the end of fiscal year 2019-20, there were 1,014 offenders designated as Dangerous Offenders (DOs)Figure E3 footnote * since 1978. Of these, 67.1% had at least one current conviction for a sexual offence.
- At the end of fiscal year 2019-20 there were 860 DOsFigure E3 footnote * under the responsibility of Correctional Service of Canada, and of those, 77.0% had indeterminate sentences.
- Of these 860 DOsFigure E3 footnote *, 736 were in custody (representing 5.4% of the total in custody population) and 124 were in the community under supervision. There were nine female offenders with a Dangerous OffenderFigure E3 footnote * designation. Indigenous offenders accounted for 36.3% of DOsFigure E3 footnote * and 26.1% of the total offender population.
In addition to the DOs, there were 11 Dangerous Sexual Offenders and 3 offenders with an Habitual Offender designation under the responsibility of Correctional Service of Canada at the end of fiscal 2019-20.
The number of Dangerous Offenders designated per year does not include overturned decisions.
Offenders who have died since receiving designations are no longer classified as "active"; however, they are still represented in the above graph, which depicts the total number of offenders '"designated".
Determinate sentence for Dangerous Offenders must be a minimum punishment of imprisonment for a term of two years — and have an order that the offender be subject to long-term supervision for a period that does not exceed 10 years.
Province/Territory of Designation |
All Designations (Designated Since 1978) |
Active Dangerous OffendersTable E3 footnote * |
||
|---|---|---|---|---|
# of Indeterminate Offenders |
# of Determinate OffendersTable E3 footnote ** |
Total |
||
British Columbia |
168 |
114 |
21 |
135 |
Alberta |
69 |
53 |
6 |
59 |
Saskatchewan |
105 |
57 |
37 |
94 |
Manitoba |
31 |
25 |
3 |
28 |
Ontario |
439 |
280 |
93 |
373 |
Quebec |
134 |
93 |
27 |
120 |
New Brunswick |
8 |
4 |
0 |
4 |
Nova Scotia |
26 |
16 |
3 |
19 |
Prince Edward Island |
0 |
0 |
0 |
0 |
Newfoundland & Labrador |
14 |
8 |
2 |
10 |
Yukon |
6 |
1 |
3 |
4 |
Northwest Territories |
11 |
10 |
1 |
11 |
Nunavut |
3 |
1 |
2 |
3 |
Total |
1,014 |
662 |
198 |
860 |
Table E3 Notes:
Source: Correctional Service of Canada.
In addition to the DOs, there were 11 Dangerous Sexual Offenders and 3 offenders with an Habitual Offender designation under the responsibility of Correctional Service of Canada at the end of fiscal 2019-20.
The number of Dangerous Offenders designated per year does not include overturned decisions.
Offenders who have died since receiving designations are no longer classified as "active"; however, they are still represented in the above graph, which depicts the total number of offenders '"designated".
Numbers presented are current up to the end of fiscal year 2019-20.
Most long-term supervision orders were for a 10-year period
Figure E4: Number of long-term supervision ordersFigure E4 footnote * imposed (2019-20)
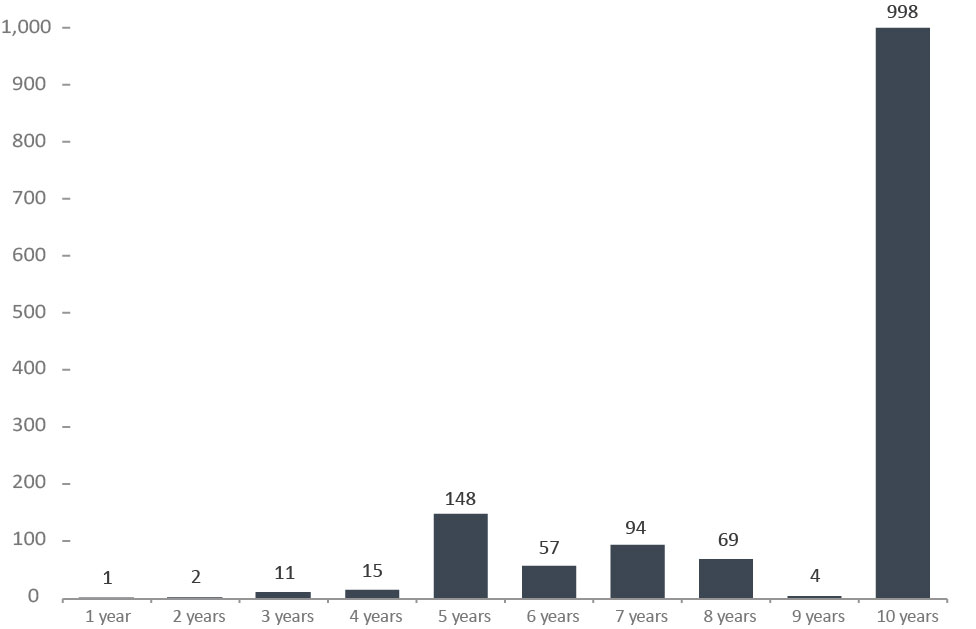
Image description
Length of Supervision Order (Years) |
1 |
2 |
3 |
4 |
5 |
6 |
7 |
8 |
9 |
10 |
|---|---|---|---|---|---|---|---|---|---|---|
Total |
1 |
2 |
11 |
15 |
148 |
57 |
94 |
69 |
4 |
998 |
Figure E4 Notes:
Source: Correctional Service of Canada.
- At the end of fiscal year 2019-20, the courts had imposed 1,399 long term supervision ordersFigure E4 footnote *. Of these, 71.3% were for a period of 10 years.
- At the end of fiscal year 2019-20, there were 952 offenders with long term supervision ordersFigure E4 footnote * under the responsibility of Correctional Service of Canada, and of these, 599 (62.9%) had at least one current conviction for a sexual offence. There were 18 female with long term supervision ordersFigure E4 footnote * under the responsibility of Correctional Service of Canada.
- There were 487 offenders being supervised in the community on their long term supervision orderFigure E4 footnote * at the end of the fiscal year 2019-20. Of these, 415 offenders were supervised in the community, 18 offenders were temporarily detained, 42 offenders were on remand and 12 offenders were unlawfully at large for less than 90 days.
Ninety-five offenders under these provisions have died, and 284 offenders have completed their long term supervision period.
Province or Territory of Order |
Length of Supervision Order (Years) |
Current Status 2019-20 |
|||||||||||||||
|---|---|---|---|---|---|---|---|---|---|---|---|---|---|---|---|---|---|
1 |
2 |
3 |
4 |
5 |
6 |
7 |
8 |
9 |
10 |
Total |
Incarcerated |
DP, FP or SRTable E4 footnote ** |
LTSO period |
LTSOTable E4 footnote *** interrupted |
Total |
||
Sentencing Province |
British Columbia |
0 |
0 |
0 |
2 |
14 |
4 |
5 |
7 |
0 |
130 |
162 |
31 |
5 |
56 |
7 |
99 |
Alberta |
0 |
0 |
0 |
0 |
9 |
1 |
1 |
1 |
0 |
73 |
85 |
13 |
2 |
29 |
7 |
51 |
|
Saskatchewan |
0 |
1 |
0 |
1 |
11 |
10 |
13 |
11 |
2 |
84 |
133 |
44 |
7 |
36 |
14 |
101 |
|
Manitoba |
0 |
0 |
0 |
0 |
1 |
2 |
3 |
1 |
0 |
39 |
46 |
5 |
0 |
12 |
5 |
22 |
|
Ontario |
0 |
0 |
1 |
7 |
21 |
16 |
23 |
27 |
0 |
312 |
407 |
75 |
15 |
162 |
32 |
284 |
|
Quebec |
1 |
1 |
9 |
5 |
79 |
21 |
45 |
16 |
2 |
304 |
483 |
127 |
24 |
157 |
33 |
341 |
|
New Brunswick |
0 |
0 |
1 |
0 |
2 |
0 |
0 |
1 |
0 |
8 |
12 |
1 |
0 |
3 |
3 |
7 |
|
Nova Scotia |
0 |
0 |
0 |
0 |
5 |
0 |
1 |
3 |
0 |
14 |
23 |
1 |
2 |
6 |
3 |
12 |
|
Prince Edward Island |
0 |
0 |
0 |
0 |
1 |
0 |
0 |
0 |
0 |
1 |
2 |
0 |
0 |
0 |
0 |
0 |
|
Newfoundland & Labrador |
0 |
0 |
0 |
0 |
0 |
0 |
0 |
1 |
0 |
11 |
12 |
2 |
1 |
7 |
0 |
10 |
|
Yukon |
0 |
0 |
0 |
0 |
2 |
0 |
3 |
0 |
0 |
16 |
21 |
2 |
1 |
12 |
1 |
16 |
|
Northwest Territories |
0 |
0 |
0 |
0 |
1 |
1 |
0 |
0 |
0 |
3 |
5 |
1 |
0 |
1 |
1 |
3 |
|
Nunavut |
0 |
0 |
0 |
0 |
2 |
2 |
0 |
1 |
0 |
3 |
8 |
0 |
0 |
6 |
0 |
6 |
|
Total |
1 |
2 |
11 |
15 |
148 |
57 |
94 |
69 |
4 |
998 |
1,399 |
302 |
57 |
487 |
106 |
952 |
|
Table E4 Notes:
Source: Correctional Service of Canada.
Remand is the temporary detention of a person while awaiting trial, sentencing or the commencement of a custodial disposition.
The number of record suspension applications received
Figure E5: Number of record suspension and pardon applications receivedFigure E5 footnote *

Image description
Year |
Total |
|---|---|
2015-16 |
12,384 |
2016-17 |
11,566 |
2017-18 |
14,662 |
2018-19 |
13,827 |
2019-20 |
12,441 |
Figure E5 Notes:
Source: Parole Board of Canada.
- In 2019-20, the Board received 7,019 record suspension applications and accepted 5,227 applications for processing. The Board also received 5,422 pardon applicationsFigure E5 footnote * and accepted 4,360 applications for processing. The acceptance rate was 77.1%.
- In 2019-20, the Board rendered 4,919 pardon decisions, granting/issuing a pardon in 95.7% of cases and denying a pardon in 4.3% of cases.
- In 2019-20, the Board made 5,496 record suspension decisions; 96.2% of record suspensions were ordered and 3.8% were refused.
- Since 1970, when the pardon/record suspension process began, 545,613 pardons/record suspensions have been granted/issued and ordered.
On March 13, 2012, Bill C-10 amended the CRA by replacing the term "pardon" with the term "record suspension". The Record Suspension and Clemency program involves the review of record suspension applications, the ordering of record suspensions and the making of clemency recommendations. The amendments to the CRA increased the waiting periods for a record suspension to five years for all summary convictions and to ten years for all indictable offences. Individuals convicted of sexual offences against minors (with certain exceptions) and those who have been convicted of more than three indictable offences, each with a sentence of two or more years, became ineligible for a record suspension.
2015-16 |
2016-17 |
2017-18 |
2018-19 |
2019-20 |
||
|---|---|---|---|---|---|---|
Record Suspension Applications Processed |
Received |
12,384 |
11,563 |
9,460 |
7,364 |
7,019 |
Accepted |
8,875 |
8,153 |
6,502Table E5 footnote ** |
5,347 |
5,227 |
|
% Accepted |
71.7% |
70.5% |
68.7% |
72.6% |
74.5% |
|
Record Suspensions |
Ordered |
8,427 |
8,340 |
7,037 |
6,028 |
5,287 |
Refused |
523 |
438 |
142 |
225 |
209 |
|
Total Ordered/Refused |
8,950 |
8,778 |
7,179 |
6,253 |
5,496 |
|
% Ordered |
94.2% |
95.0% |
98.0% |
96.4% |
96.2% |
|
Pardon Applications Processed |
Received |
NA |
NA |
5,202 |
6,463 |
5,422 |
Accepted |
NA |
NA |
4,366 |
5,184 |
4,360 |
|
% Accepted |
NA |
NA |
83.9% |
80.2% |
80.4% |
|
Pardons |
Granted |
1,628 |
3,740 |
227 |
2,631 |
3,157 |
Issued |
NA |
NA |
1,730 |
1,772 |
1,552 |
|
Denied |
348 |
125 |
133 |
42 |
210 |
|
Total Granted/Issued/Denied |
||||||
% Granted |
82.4% |
96.8% |
93.6% |
99.1% |
95.7% |
|
Pardon/Record Suspension Revocations/Cessations |
RevocationsTable E5 footnote ***** |
667 |
501 |
85 |
59 |
410 |
Cessations |
634 |
769 |
690 |
527 |
440 |
|
Total Revocations/Cessations |
1,301 |
1,270 |
775 |
586 |
850 |
|
Cumulative # Granted/Issued and OrderedTable E5 footnote ****** |
504,112 |
516,192 |
525,186 |
535,617 |
545,613 |
|
Cumulative # Revocations/CessationsTable E5 footnote ****** |
24,638 |
25,908 |
26,683 |
27,269 |
28,119 |
|
Table E5 Notes:
Source: Parole Board of Canada.
The number of applications accepted is lower than in previous reports as discontinued pardons and record suspensions were excluded.
NA is the short form for not applicable.
Section F. Victims of Crime
The most common type of self-reported victimization was theft of personal property
Figure F1: Victims of self-reported crime by type rate per 1,000 (2019)
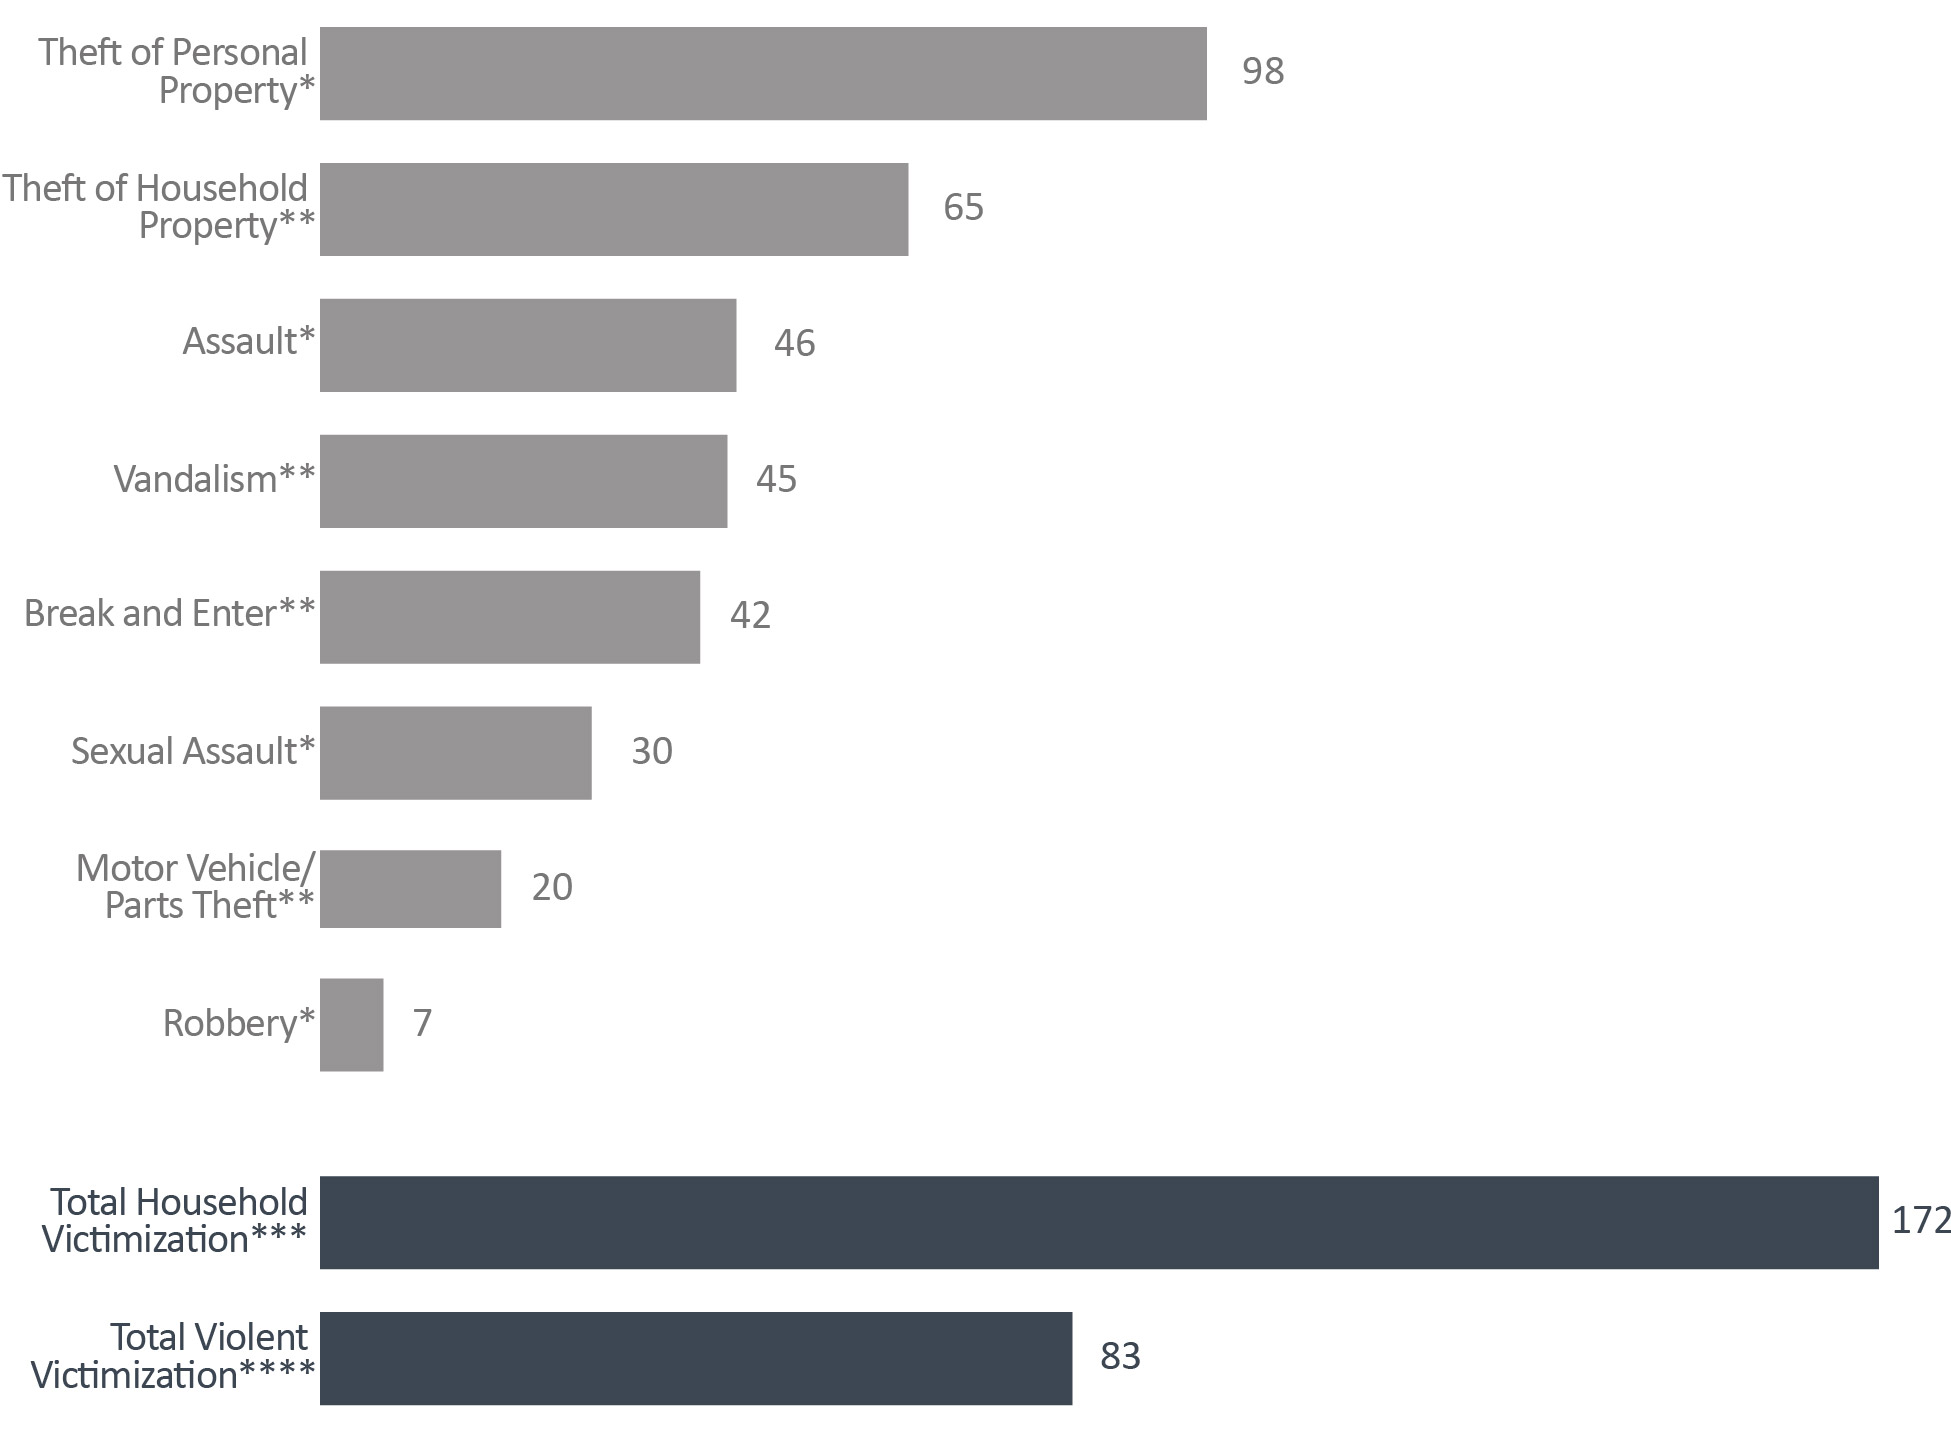
Image description
Type of Violent Victimization |
Rate |
|---|---|
Theft of Personal PropertyFigure F1 footnote * |
98 |
Theft of Household PropertyFigure F1 footnote ** |
65 |
Physical AssaultFigure F1 footnote * |
46 |
VandalismFigure F1 footnote ** |
45 |
Break and EnterFigure F1 footnote ** |
42 |
Sexual AssaultFigure F1 footnote * |
30 |
Motor Vehicle/Parts TheftFigure F1 footnote ** |
20 |
RobberyFigure F1 footnote * |
7 |
Total Household VictimizationFigure F1 footnote *** |
172 |
Total Violent VictimizationFigure F1 footnote **** |
83 |
Figure F1 Notes:
Source: General Social Survey (GSS), Statistics Canada.
- In 2019, theft of personal propertyFigure F1 footnote * was the most common self-reported crime followed by theft of household propertyFigure F1 footnote **.
- AssaultFigure F1 footnote * was the third most common self-reported crime and the most common violent crime.
Excludes those under age 15.
The most common type of self-reported victimization was theft of personal property
Type of Violent Victimization |
Rate |
|---|---|
Theft of Personal PropertyTable F1 footnote * |
98 |
Theft of Household PropertyTable F1 footnote ** |
65 |
Physical AssaultTable F1 footnote * |
46 |
VandalismTable F1 footnote ** |
45 |
Break and EnterTable F1 footnote ** |
42 |
Sexual AssaultTable F1 footnote * |
30 |
Motor Vehicle/Parts TheftTable F1 footnote ** |
20 |
RobberyTable F1 footnote * |
7 |
Total Household VictimizationTable F1 footnote *** |
172 |
Total Violent VictimizationTable F1 footnote **** |
83 |
Table F1 Notes:
Source: General Social Survey (GSS), Statistics Canada.
Excludes those under age 15.
Women were more likely to be victims of violent crime than men, this gap is larger at younger ages
Figure F2a: Self-reported violent victimization rate per 1,000 population by type and gender

Image description
Type of Violent Victimization |
Women |
Men |
|---|---|---|
Robbery |
7 |
7 |
Sexual Assault |
50 |
9 |
Physical Assault |
49 |
43 |
Total Violent VictimizationFigure F2 footnote * |
106 |
59 |
Figure F2b. Self-reported violent victimization rate per 1,000 population by age

Image description
Age Group |
Women |
Men |
|---|---|---|
15 to 24 |
257 |
103 |
25 to 34 |
179 |
91 |
35 to 44 |
83 |
75 |
45 to 54 |
98 |
42 |
55 to 64 |
45 |
39 |
65 and older |
24 |
15 |
Figure F2a and F2b Notes:
Source: General Social Survey (GSS), Statistics Canada.
- Women were more likely to experience violent victimization than men. When broken down into types of crime, the gender difference is largely due to the substantially higher number of women who report sexual assault.
- The gender difference in self-reported crime was greatest at ages 15 to 24 (with a difference of 154 per 1,000), followed by ages 25 to 34 (with a difference of 88 per 1,000).
Excludes those under age 15.
Type of Violent Victimization |
Women |
Men |
|---|---|---|
Sexual Assault |
50 |
9 |
Robbery |
7 |
7 |
Physical Assault |
49 |
43 |
Total Violent VictimizationTable F2 footnote * |
106 |
59 |
Age Group |
Women |
Men |
|---|---|---|
15 to 24 |
257 |
103 |
25 to 34 |
179 |
91 |
35 to 44 |
83 |
75 |
45 to 54 |
98 |
42 |
55 to 64 |
45 |
39 |
65 and older |
24 |
15 |
Table F2a and F2b Notes:
Source: General Social Survey (GSS), Statistics Canada.
Excludes those under age 15.
Sexual assault was the least likely crime to be reported to police
Figure F3: Percentage of self-reported crime reported to police (2019)
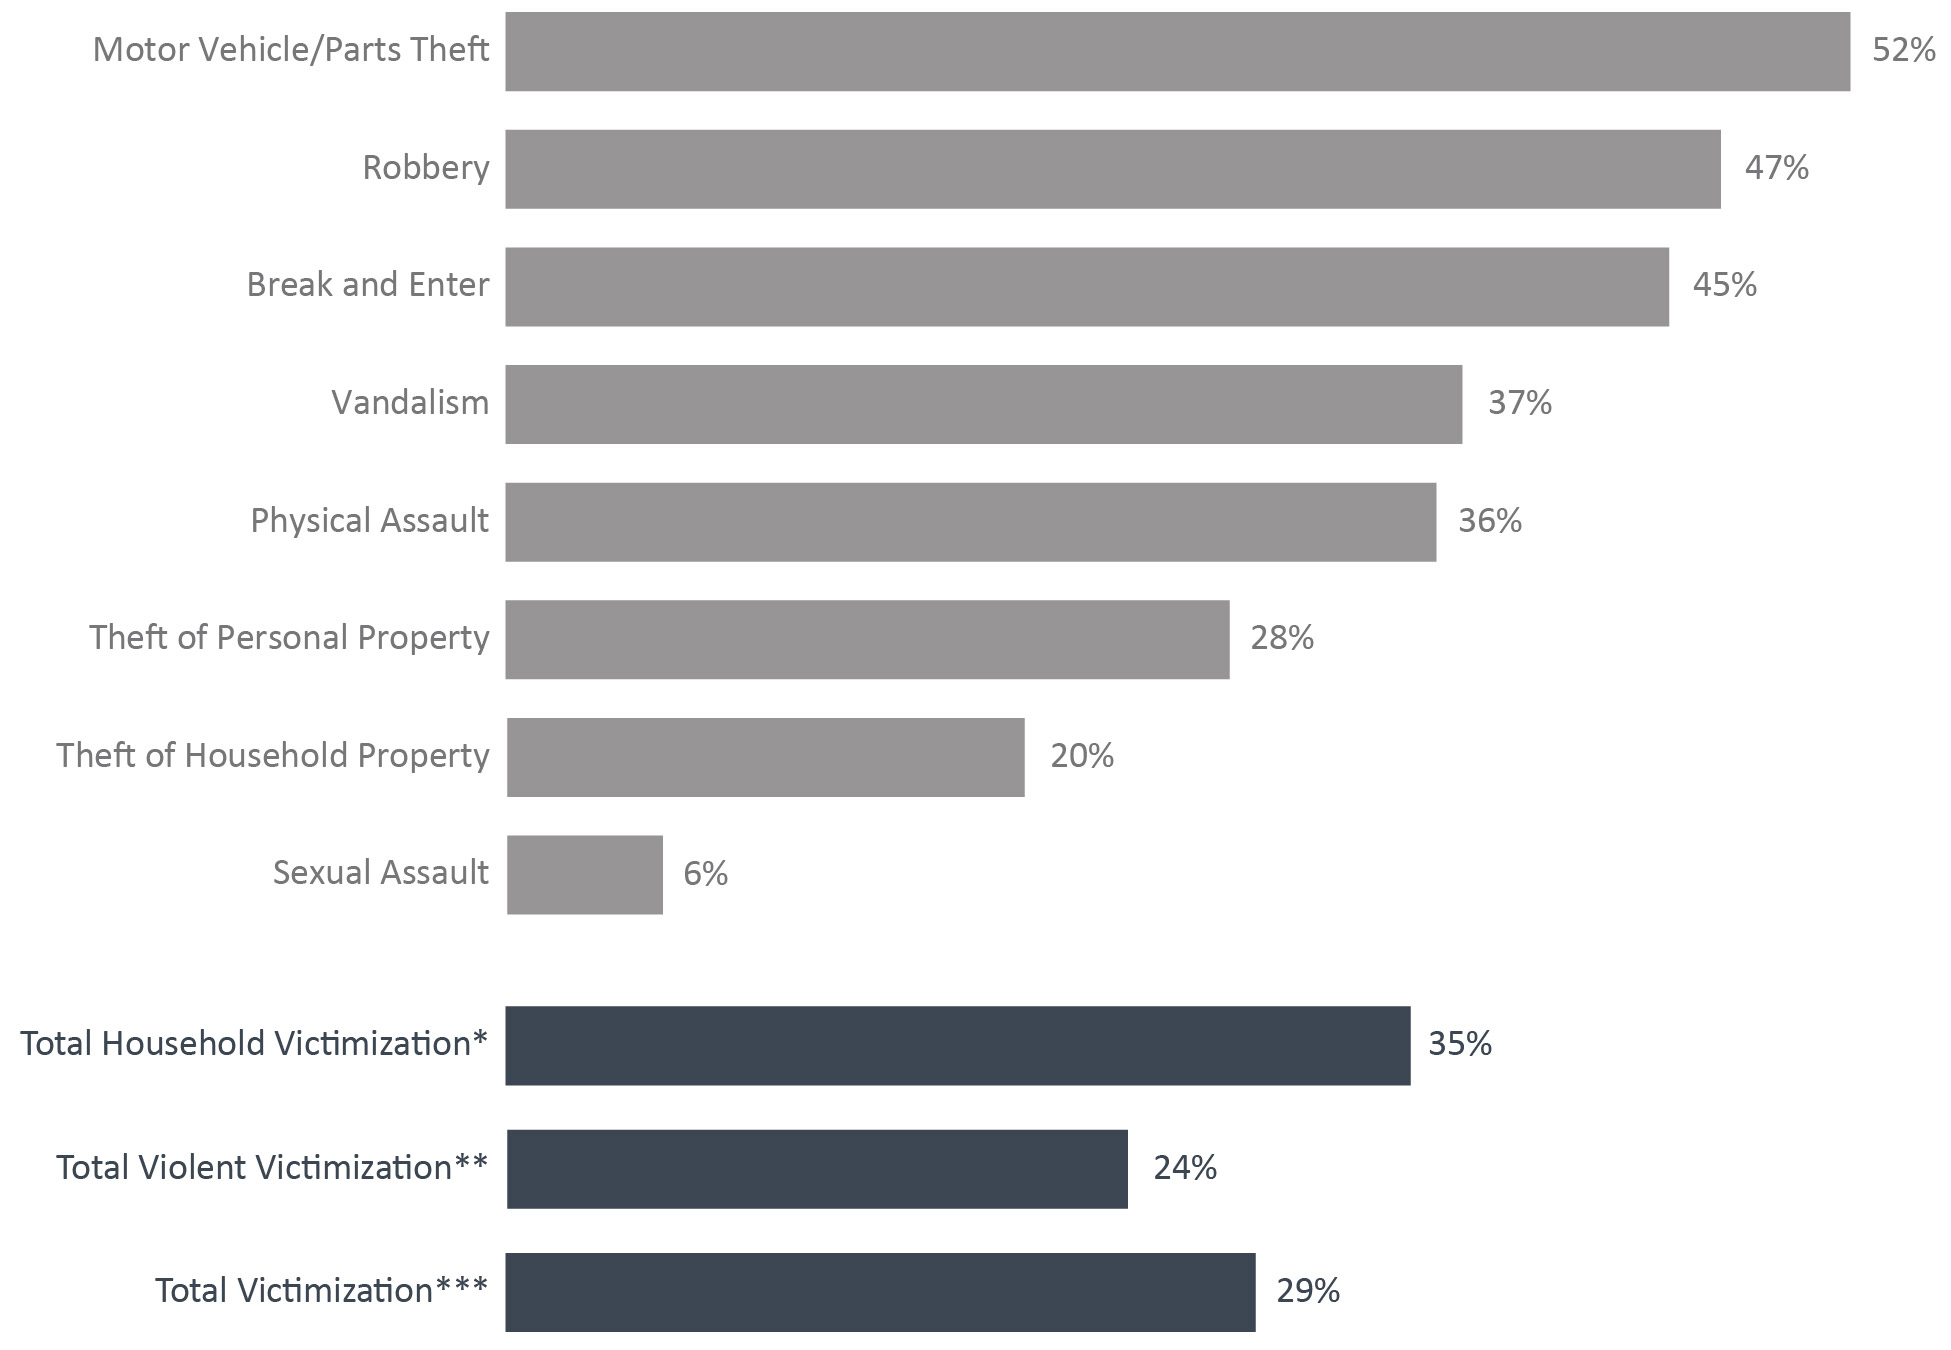
Image description
Type of Victimization |
Percent Reported to Police |
|---|---|
Motor Vehicle/Parts Theft |
52 |
Robbery |
47 |
Break and Enter |
45 |
Vandalism |
37 |
Physical Assault |
36 |
Theft of Personal Property |
28 |
Theft of Household Property |
20 |
Sexual Assault |
6 |
Total Household VictimizationFigure F3 footnote * |
35 |
Total Violent VictimizationFigure F3 footnote ** |
24 |
Total VictimizationFigure F3 footnote *** |
29 |
Figure F3 Notes:
Source: General Social Survey (GSS), Statistics Canada.
- Motor vehicle/parts theft was most frequently reported to police with 52% of self-reported motor vehicle/parts theft reported to police. Sexual assault was least frequently reported to police, with only 6% of self-reported sexual assaults reported to police.
- Self-reported household victimization was more commonly reported to police than self-reported violent victimization.
Excludes those under age 15.
Type of Victimization |
Percent Reported to Police |
|---|---|
Motor Vehicle/Parts Theft |
52 |
Robbery |
47 |
Break and Enter |
45 |
Vandalism |
37 |
Physical Assault |
36 |
Theft of Personal Property |
28 |
Theft of Household Property |
20 |
Sexual Assault |
6 |
Total Household VictimizationTable F3 footnote * |
35 |
Total Violent VictimizationTable F3 footnote ** |
24 |
Total VictimizationTable F3 footnote *** |
29 |
Table F3 Notes:
Source: General Social Survey (GSS), Statistics Canada.
Excludes those under age 15.
Police-reported violent victimization has increased
Figure F4: Police-reported violent victimization from 2015 to 2019
Image description
Type of Crime |
2015 |
2016 |
2017 |
2018 |
2019 |
|---|---|---|---|---|---|
Assaults |
215,011 |
218,252 |
225,365 |
234,419 |
258,399 |
Other violent violations |
92,987 |
92,186 |
95,581 |
96,326 |
102,653 |
Sexual assault (levels 1, 2, 3) |
20,388 |
20,748 |
23,908 |
27,562 |
30,035 |
Sexual violations against childrenFigure F4 footnote * |
4,640 |
6,428 |
7,424 |
8,240 |
9,014 |
Criminal Code traffic violations causing death or bodily harmFigure F4 footnote **. |
2,970 |
2,910 |
2,883 |
2,842 |
2,703 |
Violations causing death and attempted murder |
1,446 |
1,472 |
1,538 |
1,579 |
1,597 |
Total |
337,442 |
341,996 |
356,699 |
370,968 |
404,401 |
Notes:
Source: Table 35-10-0049-01, Uniform Crime Reporting Survey, Canadian Centre for Justice and Community Safety Statistics, Statistics Canada.
- Police-reported violent victimization increased 19.8% in the last 5 years (from 2015 to 2019) and 9.0% in the last year (from 2018 to 2019).
- Police-reported sexual violations against childrenFigure F4 footnote * increased 94.3% in the last 5 years (from 2015 to 2019). This was the largest increase during this period. Police-reported sexual assault increased 47.3% in the last 5 years (from 2015 to 2019). Police-reported assaults increased 20.2% in the last 5 years (from 2015 to 2019) and 10.2% in the last year (from 2018 to 2019).
- Police-reported criminal code traffic violations causing death or bodily harmFigure F4 footnote ** declined 9.0% in the last 5 years (from 2015 to 2019) and 4.9% in the last year (from 2018 to 2019). This was the only category of violent offence that did not increase.
Excludes victims where age is over 89.
Type of Crime |
2015 |
2016 |
2017 |
2018 |
2019 |
|---|---|---|---|---|---|
Assaults |
215,011 |
218,252 |
225,365 |
234,419 |
258,399 |
Other violent violations |
92,987 |
92,186 |
95,581 |
96,326 |
102,653 |
Sexual assault (levels 1, 2, 3) |
20,388 |
20,748 |
23,908 |
27,562 |
30,035 |
Sexual violations against childrenTable F4 footnote * |
4,640 |
6,428 |
7,424 |
8,240 |
9,014 |
Criminal Code traffic violations causing death or bodily harmTable F4 footnote **. |
2,970 |
2,910 |
2,883 |
2,842 |
2,703 |
Violations causing death and attempted murder |
1,446 |
1,472 |
1,538 |
1,579 |
1,597 |
Total |
337,442 |
341,996 |
356,699 |
370,968 |
404,401 |
Table F4 Notes:
Source: Table 35-10-0049-01, Uniform Crime Reporting Survey, Canadian Centre for Justice and Community Safety Statistics, Statistics Canada.
Excludes victims where age is over 89.
Police-reported violent victimization was most frequent amongst 12-17 year olds
Figure F5a: Police-reported victimization of non-sexual violent offencesFigure F5 footnote * by age. Rate per 1,000
Image description
Year |
Total Age |
Under 12 |
Age 12 - 17 |
Ages 18+ |
|||||||||
|---|---|---|---|---|---|---|---|---|---|---|---|---|---|
Total Sex |
Male |
Female |
Total Sex |
Male |
Female |
Total Sex |
Male |
Female |
Total Sex |
Male |
Female |
||
Victimization of non-sexual violent offencesFigure F5 footnote * |
2015-16 |
8.8 |
8.6 |
9.1 |
2.2 |
1.8 |
2.6 |
13.0 |
12.1 |
13.8 |
9.5 |
9.4 |
9.6 |
2016-17 |
8.8 |
8.5 |
9.0 |
2.2 |
1.8 |
2.6 |
13.1 |
12.4 |
13.7 |
9.5 |
9.3 |
9.6 |
|
2017-18 |
9.0 |
8.7 |
9.2 |
2.4 |
2.0 |
2.8 |
13.7 |
12.8 |
14.3 |
9.7 |
9.5 |
9.7 |
|
2018-19 |
9.1 |
8.9 |
9.3 |
2.5 |
2.1 |
2.8 |
13.5 |
12.8 |
13.9 |
9.8 |
9.7 |
9.9 |
|
2019-20 |
9.8 |
9.6 |
10.0 |
2.9 |
2.4 |
3.3 |
15.0 |
14.2 |
15.6 |
10.4 |
10.3 |
10.5 |
|
Figure F5b: Police-reported victimization of sexual violent offencesFigure F5 footnote ** by age. Rate per 1,000
Image description
Year |
Total Age |
Under 12 |
Age 12 - 17 |
Ages 18+ |
|||||||||
|---|---|---|---|---|---|---|---|---|---|---|---|---|---|
Total Sex |
Male |
Female |
Total Sex |
Male |
Female |
Total Sex |
Male |
Female |
Total Sex |
Male |
Female |
||
Victimization of sexual violent offencesFigure F5 footnote ** |
2015-16 |
0.7 |
0.2 |
1.2 |
1.1 |
0.6 |
1.6 |
3.6 |
0.8 |
6.6 |
0.4 |
0.7 |
0.8 |
2016-17 |
0.8 |
0.2 |
1.3 |
1.1 |
0.6 |
1.6 |
3.9 |
0.8 |
7.1 |
0.5 |
0.7 |
0.8 |
|
2017-18 |
0.9 |
0.2 |
1.5 |
1.2 |
0.6 |
1.8 |
4.6 |
0.9 |
8.5 |
0.5 |
0.1 |
0.9 |
|
2018-19 |
1.0 |
0.2 |
1.7 |
1.3 |
0.6 |
2.0 |
5.1 |
1.0 |
9.3 |
0.6 |
0.1 |
1.1 |
|
2019-20 |
1.1 |
0.3 |
1.8 |
1.4 |
0.7 |
2.2 |
5.6 |
1.1 |
10.2 |
0.6 |
0.1 |
1.1 |
|
Figure F5a and F5b Notes:
Source: Table 35-10-0049-01, Uniform Crime Reporting Survey, Canadian Centre for Justice and Community Safety Statistics, Statistics Canada.
- The rate of police-reported violent victimization increased for all age groups in the past 5 years (2014-15 to 2018-19).
- Youth ages 12-17 have consistently had the highest rate of victimization in the past 5 years (2014-15 to 2018-19).
- Children under age 12 had the highest increase in the rate of victimization in the past year. The rate of non-sexually violent offences increased by 16.0% and the rate of sexually violent victimization increased by 11.1% in the last year.
Excludes victims where age is over 89.
Year |
Total Age |
Under 12 |
Age 12 - 17 |
Ages 18+ |
|||||||||
|---|---|---|---|---|---|---|---|---|---|---|---|---|---|
Total Sex |
Male |
Female |
Total Sex |
Male |
Female |
Total Sex |
Male |
Female |
Total Sex |
Male |
Female |
||
Victimization of non-sexual violent offencesTable F5 footnote * |
2015-16 |
8.8 |
8.6 |
9.1 |
2.2 |
1.8 |
2.6 |
13.0 |
12.1 |
13.8 |
9.5 |
9.4 |
9.6 |
2016-17 |
8.8 |
8.5 |
9.0 |
2.2 |
1.8 |
2.6 |
13.1 |
12.4 |
13.7 |
9.5 |
9.3 |
9.6 |
|
2017-18 |
9.0 |
8.7 |
9.2 |
2.4 |
2.0 |
2.8 |
13.7 |
12.8 |
14.3 |
9.7 |
9.5 |
9.7 |
|
2018-19 |
9.1 |
8.9 |
9.3 |
2.5 |
2.1 |
2.8 |
13.5 |
12.8 |
13.9 |
9.8 |
9.7 |
9.9 |
|
2019-20 |
9.8 |
9.6 |
10.0 |
2.9 |
2.4 |
3.3 |
15.0 |
14.2 |
15.6 |
10.4 |
10.3 |
10.5 |
|
Victimization of sexual violent offencesTable F5 footnote ** |
2015-16 |
0.7 |
0.2 |
1.2 |
1.1 |
0.6 |
1.6 |
3.6 |
0.8 |
6.6 |
0.4 |
0.7 |
0.8 |
2016-17 |
0.8 |
0.2 |
1.3 |
1.1 |
0.6 |
1.6 |
3.9 |
0.8 |
7.1 |
0.5 |
0.7 |
0.8 |
|
2017-18 |
0.9 |
0.2 |
1.5 |
1.2 |
0.6 |
1.8 |
4.6 |
0.9 |
8.5 |
0.5 |
0.1 |
0.9 |
|
2018-19 |
1.0 |
0.2 |
1.7 |
1.3 |
0.6 |
2.0 |
5.1 |
1.0 |
9.3 |
0.6 |
0.1 |
1.1 |
|
2019-20 |
1.1 |
0.3 |
1.8 |
1.4 |
0.7 |
2.2 |
5.6 |
1.1 |
10.2 |
0.6 |
0.1 |
1.1 |
|
Table F5 Notes:
Source: Table 35-10-0049-01, Uniform Crime Reporting Survey, Canadian Centre for Justice and Community Safety Statistics, Statistics Canada.
Excludes victims where age is over 89.
The most common type of police-reported violent crime was assault
Figure F6a: Victims of police-reported violent crime by type (2019)
Image description
Type of Crime |
Total |
|---|---|
Assaults |
258,399 |
Other violent violations |
102,653 |
Sexual assault |
30,035 |
Sexual violations against childrenFigure F6a footnote * |
9,014 |
Criminal Code traffic violations causing death or bodily harmFigure F6a footnote ** |
2,703 |
Violations causing death and attempted murder |
1,597 |
Figure F6b: Victims of police-reported violent crime by type and sex of victim (2019)
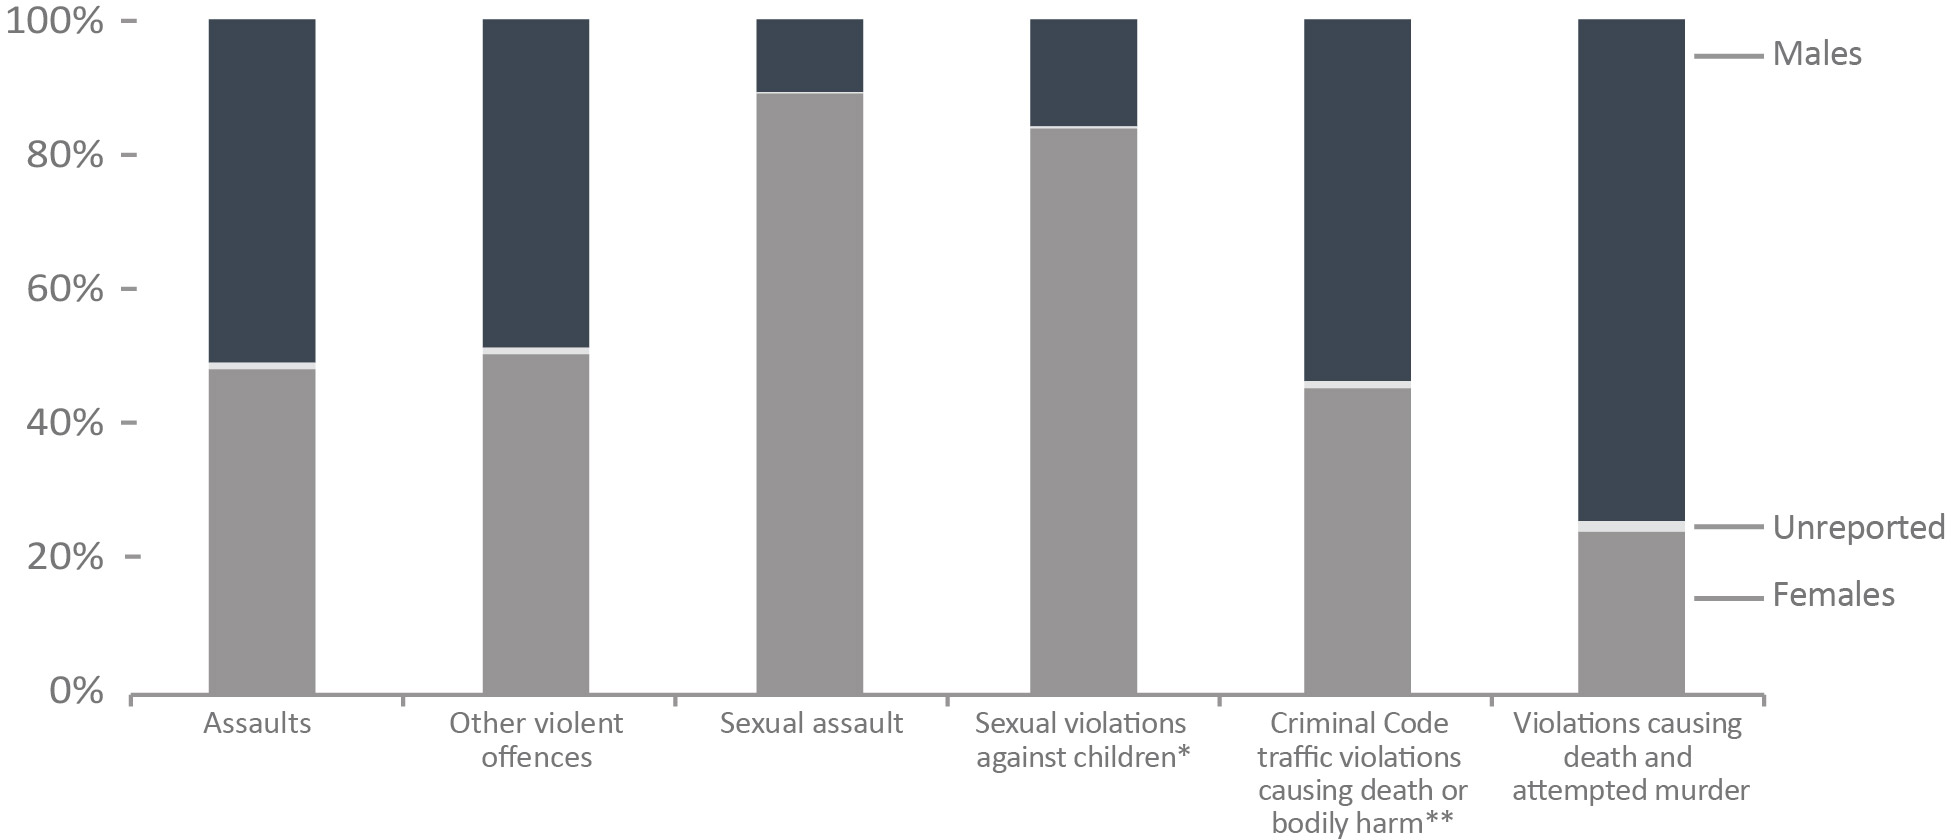
Image description
Type of Crime |
Percent Females |
Percent Males |
Percent Not Reported |
|---|---|---|---|
Assaults |
48.5 |
51.3 |
1.0 |
Other violent violations |
50.8 |
49.1 |
1.0 |
Sexual assault |
89.0 |
10.8 |
0.2 |
Sexual violations against childrenFigure F6b footnote * |
83.9 |
15.9 |
0.3 |
Criminal Code traffic violations causing death or bodily harmFigure F6b footnote ** |
45.7 |
54.1 |
1.1 |
Violations causing death and attempted murder |
23.7 |
73.2 |
1.5 |
Figure F6a and F6b Notes:
Source: Table 35-10-0049-01, Uniform Crime Reporting Survey, Canadian Centre for Justice and Community Safety Statistics, Statistics Canada
- Physical assaults accounted for nearly two-thirds of all police-reported violent crime.
- Females accounted for slightly more than half (52.7%) of violent crime. Males were more likely to be victims of violations causing death (73.2%) and females were more likely to be victims of sexual violence.
Excludes victims where age is over 89.
Type of Crime |
Sex of Victim |
Total |
||||||
|---|---|---|---|---|---|---|---|---|
Females |
Males |
Not Reported |
||||||
# |
% |
# |
% |
# |
% |
# |
% |
|
Assaults |
125,206 |
48.5 |
132,556 |
51.3 |
637 |
1 |
258,399 |
64 |
Other violent violations |
52,168 |
50.8 |
50,364 |
49.1 |
121 |
1 |
102,653 |
25 |
Sexual assault |
26,728 |
89 |
3,245 |
10.8 |
62 |
0.2 |
30,035 |
7 |
Sexual violations against childrenTable F6 footnote * |
7,567 |
83.9 |
1,432 |
15.9 |
15 |
0.3 |
9,014 |
2 |
Criminal Code traffic violations causing death or bodily harmTable F6 footnote **. |
1,235 |
45.7 |
1,462 |
54.1 |
6 |
1.1 |
2,703 |
1 |
Violations causing death and attempted murder |
378 |
23.7 |
1,169 |
73.2 |
50 |
1.5 |
1,597 |
0 |
Total |
213,282 |
190,228 |
891 |
404,401 |
||||
Table F6 Notes:
Source: Table 35-10-0049-01, Uniform Crime Reporting Survey, Canadian Centre for Justice and Community Safety Statistics, Statistics Canada
Excludes victims where age is over 89.
The number of registered victims with the federal correctional system has increased in the last 3 years
Figure F7: Number of registered victims and offenders with a registered victim

Image description
Year |
Number of Registered Victims |
Number of Offenders with a Registered Victim |
|---|---|---|
2017-18 |
8,041 |
4,570 |
2018-19 |
8,477 |
4,847 |
2019-20 |
8,857 |
5,045 |
Figure F7 Notes:
Source: Data Warehouse, Correctional Service of Canada.
- In order to register to receive information, a victim must meet the definition of a victim under the Corrections and Conditional Release Act (CCRA). Victims of federal offenders must be at least 18 years-old or legally emancipated or demonstrate they can act for themselves. Victims can register with the Correctional Service of Canada or the Parole Board of Canada.
- The number of victims registered with the federal correctional system increased by 10.1%, from 8,041 in 2017-18 to 8,857 in 2019-20.
- The number of offenders with a registered victim increased by 10.4% from 4,570 in 2017-18 to 5,045 in 2019-20.
Victim Contact records are from the new Victims Application Module (VAM). This data cannot be compared to victim data prior to 2017 due to a change in how victims are counted. This was done because CSC changed from management of victim files within OMS, offender file based, to the newly built Victims Application Module (VAM), victim file based and no data was available until year end due to data migration. When Victim Services used OMS as its database, the prior indicator could not account for victims who were registered for more than one offender. Since the move to VAM, CSC can accurately capture the number of registered victims. For example, in the old system (OMS), one victim who was registered for six offenders would have counted as six registered victims; whereas in the new system (VAM), one registered victim who is registered for six offenders is accurately counted as one registered victim.
Year |
Number of Registered Victims |
Number of Offenders with a Registered Victim |
|---|---|---|
2017-18 |
8,041 |
4,570 |
2018-19 |
8,477 |
4,847 |
2019-20 |
8,857 |
5,045 |
Table F7 Notes:
Source: Data Warehouse, Correctional Service of Canada.
In order to register to receive information, a person must meet the definition of a victim in the Corrections and Conditional Release Act (CCRA) and register with the Correctional Service of Canada or the Parole Board of Canada. Victims must be at least 18 years-old or legally emancipated or demonstrate they can act for themselves.
Victim Contact records are from the new Victims Application Module (VAM). This data cannot be compared to victim data prior to 2017 due to a change in how victims are counted. This was done because CSC changed from management of victim files within OMS, offender file based, to the newly built Victims Application Module (VAM), victim file based and no data was available until year end due to data migration. When Victim Services used OMS as its database, the prior indicator could not account for victims who were registered for more than one offender. Since the move to VAM, CSC can accurately capture the number of registered victims. For example, in the old system (OMS), one victim who was registered for six offenders would have counted as six registered victims; whereas in the new system (VAM), one registered victim who is registered for six offenders is accurately counted as one registered victim.
Registered victims are impacted by serious offences
Figure F8: Offences of victimizationFigure F8 footnote * (2019-20)
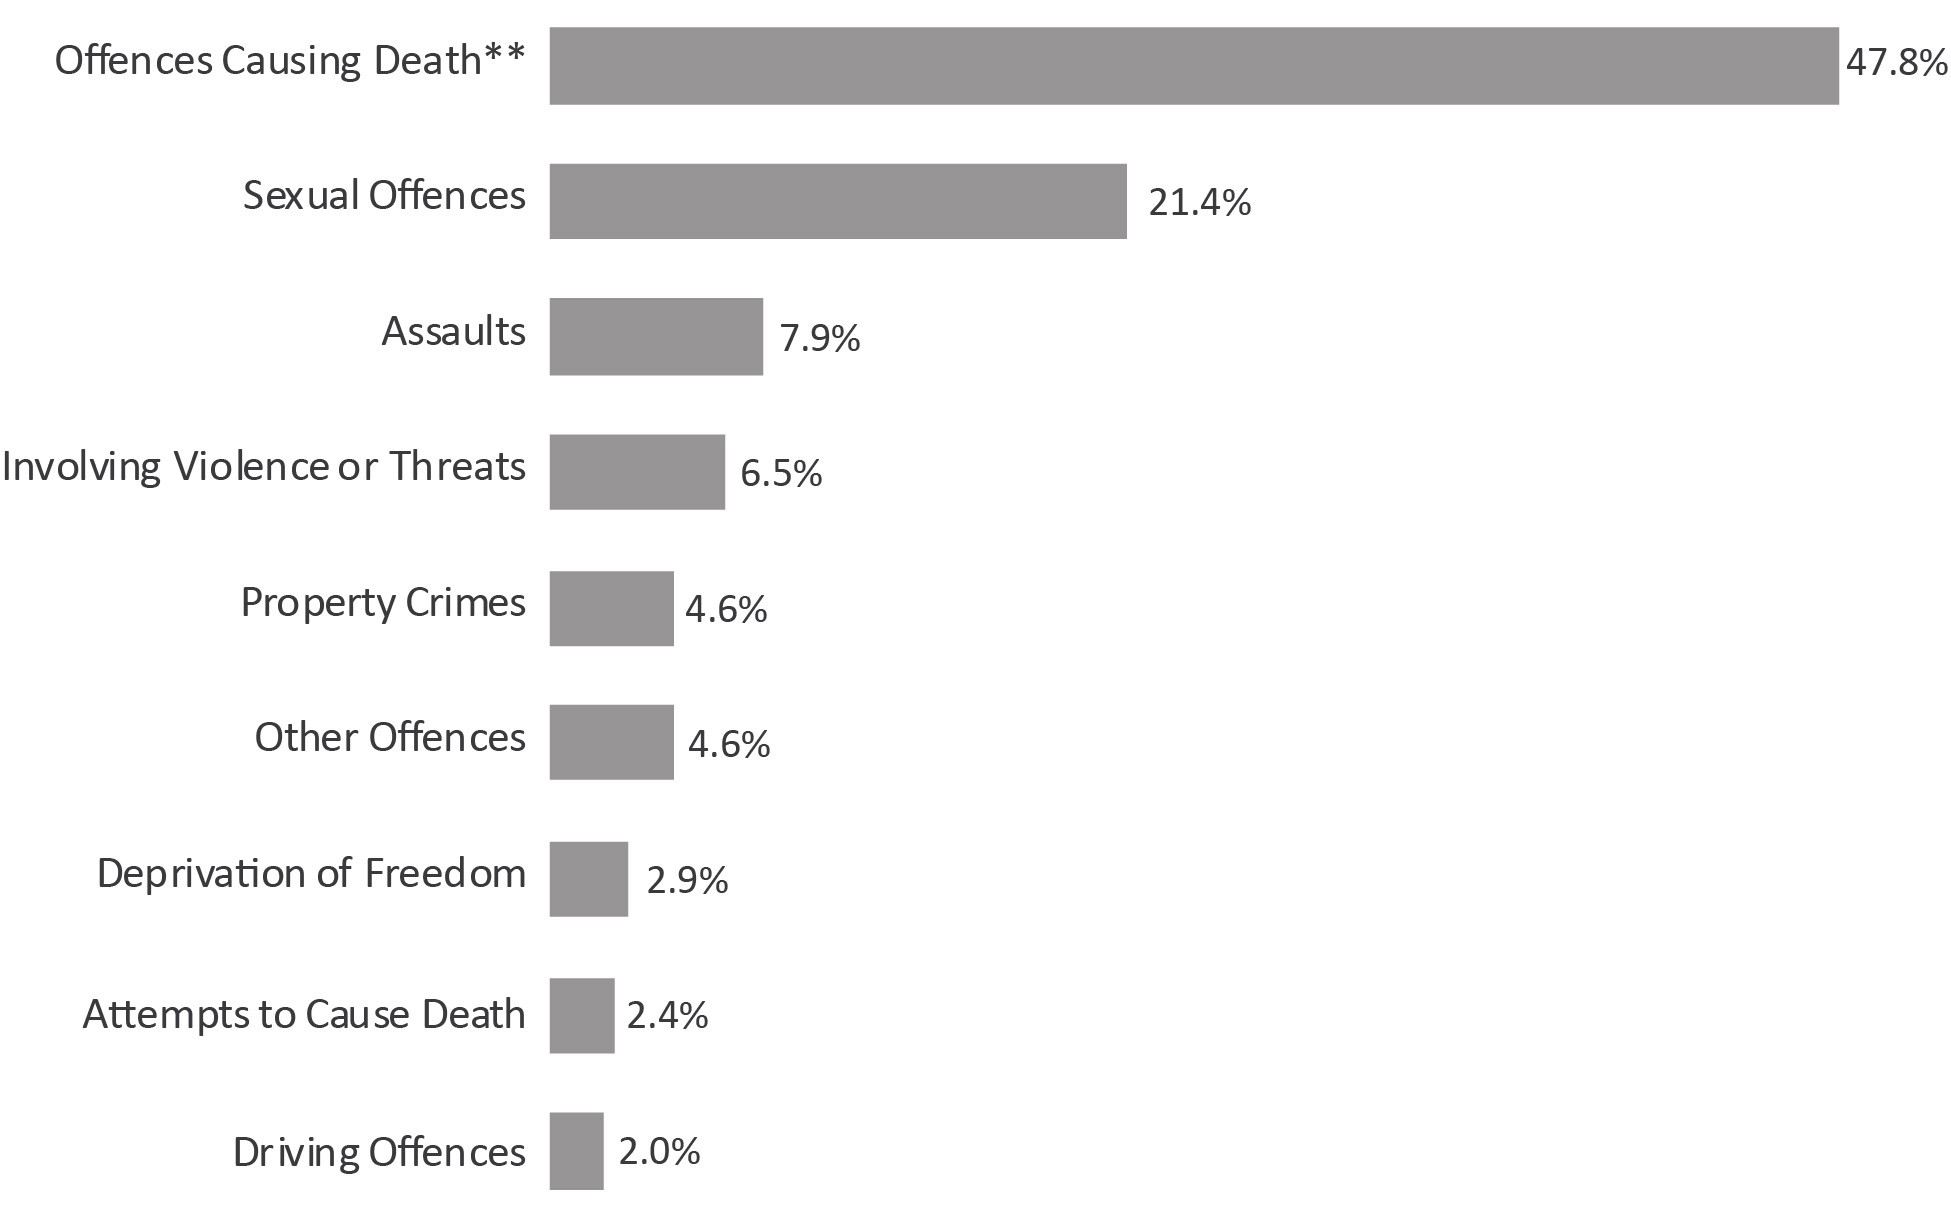
Image description
|
Percent |
|---|---|
Offences Causing DeathFigure F8 footnote ** |
47.8 |
Sexual Offenses |
21.4 |
Assaults |
7.9 |
Involving violence or Threats |
6.5 |
Property Crimes |
4.6 |
Other Offenses |
4.6 |
Deprivation of Freedom |
2.9 |
Attempts to Cause Death |
2.4 |
Driving Offenses |
2.0 |
Figure F8 Notes:
Source: Data Warehouse, Correctional Service of Canada.
- Offences causing death accounted for almost half of offences of victimizationFigure F8 footnote * (47.8%).
- Sexual offences were the second most common offence of victimizationFigure F8 footnote * (21.4%).
More than one offence of victimization may be recorded for each victim of crime.
2017-18 |
2018-19 |
2019-20 |
||||
|---|---|---|---|---|---|---|
# |
% |
# |
% |
# |
% |
|
Offences Causing DeathTable F8 footnote ** |
5,153 |
49.8 |
5,413 |
48.5 |
5,643 |
47.8 |
Sexual Offences |
2,141 |
20.7 |
2,381 |
21.3 |
2,528 |
21.4 |
Assaults |
788 |
7.6 |
883 |
7.9 |
938 |
7.9 |
Involving Violence or Threats |
606 |
5.9 |
688 |
6.2 |
767 |
6.5 |
Property Crimes |
485 |
4.7 |
504 |
4.5 |
541 |
4.6 |
Deprivation of Freedom |
296 |
2.9 |
317 |
2.8 |
338 |
2.9 |
Attempts to Cause Death |
250 |
2.4 |
263 |
2.4 |
281 |
2.4 |
Driving Offences |
160 |
1.5 |
214 |
1.9 |
233 |
2 |
Other Offences |
464 |
4.5 |
509 |
4.6 |
540 |
4.6 |
Total Number of OffencesTable F8 footnote *** |
10,343 |
11,172 |
11,809 |
|||
Table F8 Notes:
Source: Data Warehouse, Correctional Service of Canada.
Most registered victims were between the ages of 41 and 70
Figure F9: Number of registered victimsFigure F9 footnote * by age (2019-20)
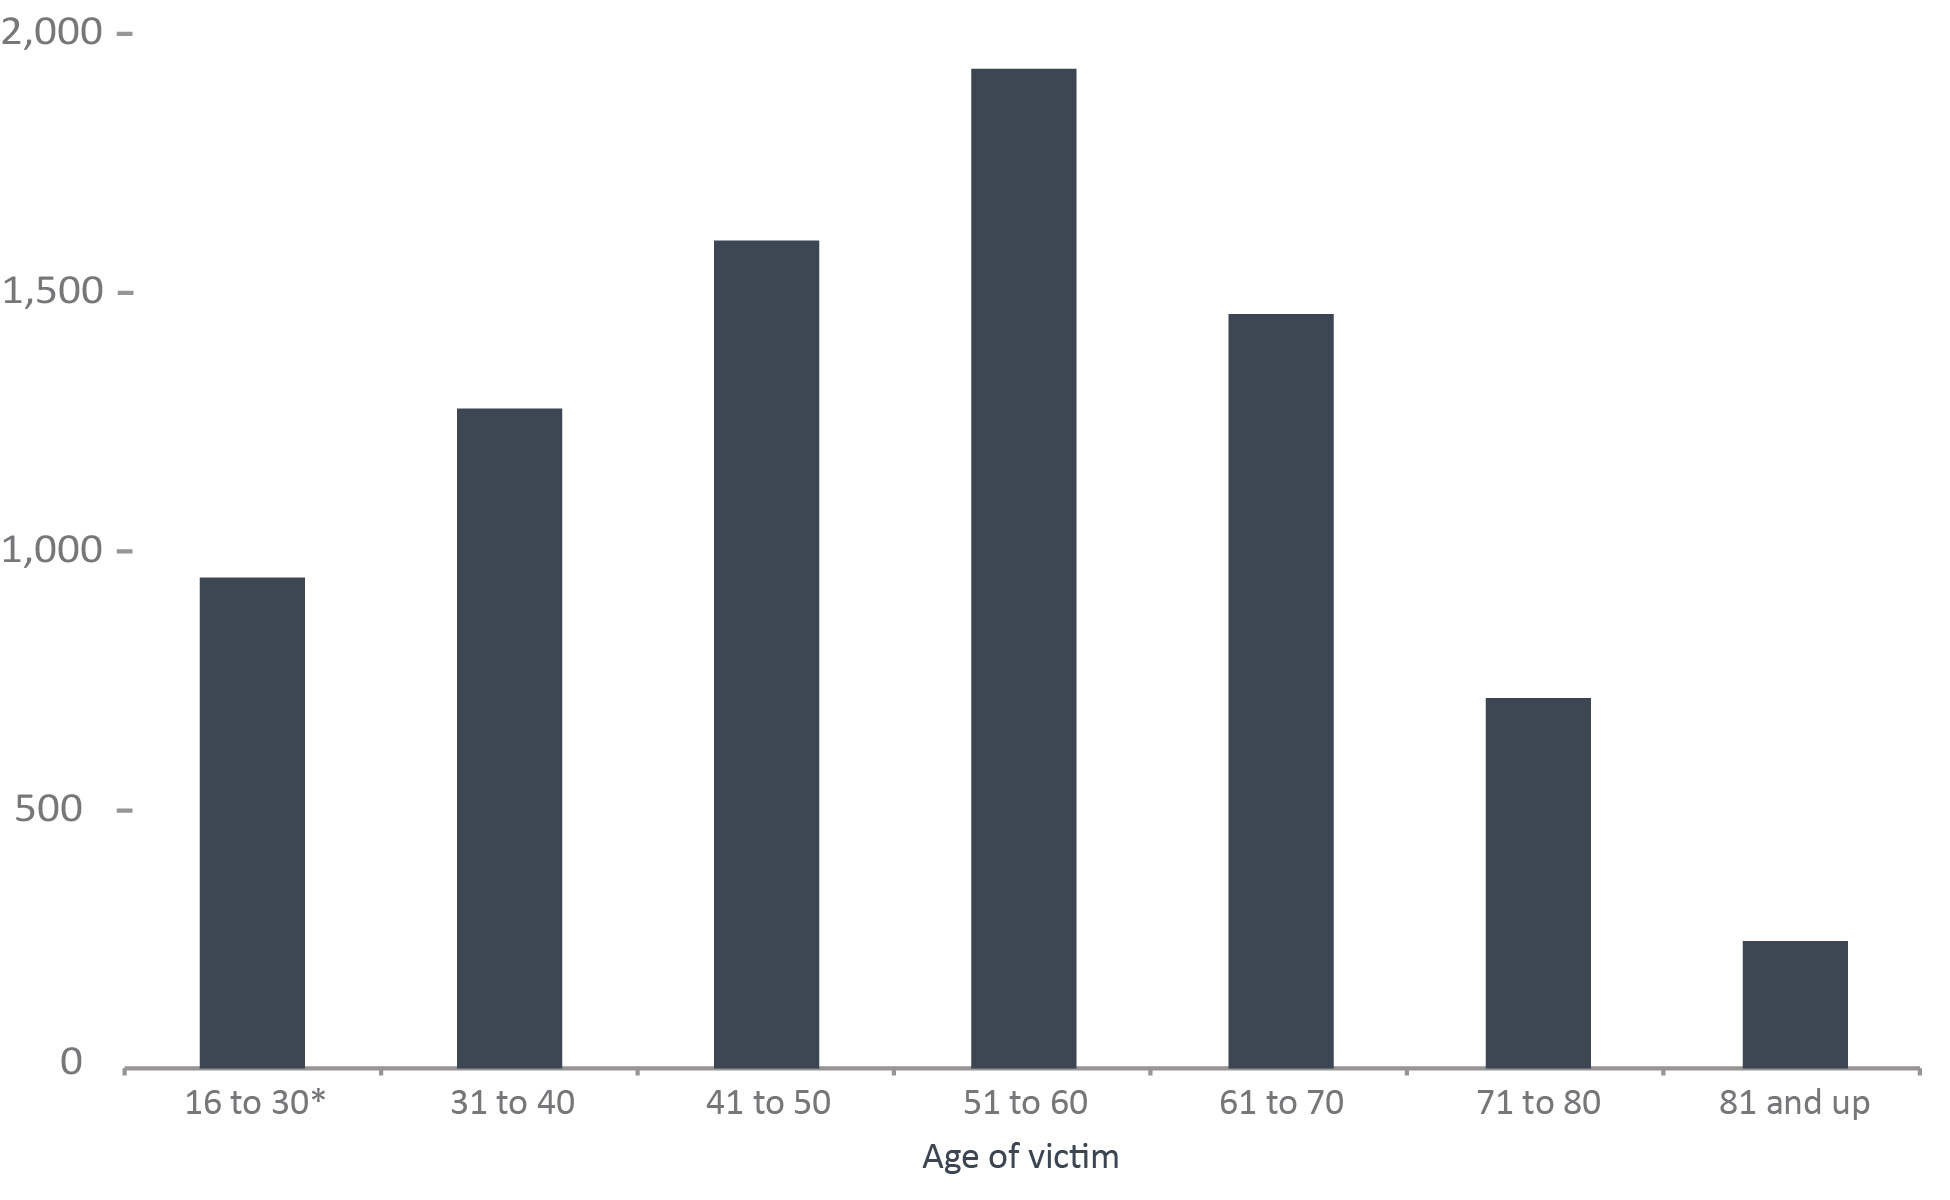
Image description
Age |
Number |
Percent |
|---|---|---|
16 to 30Figure F9 footnote * |
948 |
11.6 |
31 to 40 |
1,274 |
15.6 |
41 to 50 |
1,599 |
19.6 |
51 to 60 |
1,931 |
23.6 |
61 to 70 |
1,457 |
17.8 |
71 to 80 |
715 |
8.8 |
81 and up |
246 |
3.0 |
Figure F9 Notes:
Source: Data Warehouse, Correctional Service of Canada.
- In 2019-20, 61.0% of registered victimsFigure F9 footnote * were aged 41 to 70. The greatest proportion of victims was in the 51-60 age group (23.6%). This pattern has remained fairly consistent in the last three years.
Demographic information was voluntarily self-reported, by victims who have registered to receive information about the offender that harmed them. The information does not represent victims that have not been in contact with Correctional Service of Canada or those who choose not to register.
Response rates ranged from 89.0% in 2017-18 to 91.6% in 2019-20.
2017-18 |
2018-19 |
2019-20 |
||||
|---|---|---|---|---|---|---|
# |
% |
# |
% |
# |
% |
|
16 to 30Table F9 footnote * |
812 |
11.2 |
883 |
11.4 |
948 |
11.6 |
31 to 40 |
1,158 |
16 |
1,225 |
15.8 |
1,274 |
15.6 |
41 to 50 |
1,430 |
19.7 |
1,521 |
19.6 |
1,599 |
19.6 |
51 to 60 |
1,846 |
25.5 |
1,885 |
24.3 |
1,931 |
23.6 |
61 to 70 |
1,216 |
16.8 |
1,375 |
17.7 |
1,457 |
17.8 |
71 to 80 |
595 |
8.2 |
651 |
8.4 |
715 |
8.8 |
81 and up |
188 |
2.6 |
214 |
2.8 |
246 |
3.0 |
Table F9 Notes:
Source: Data Warehouse, Correctional Service of Canada.
Demographic information was voluntarily self-reported, by victims who have registered to receive information about the offender that harmed them. The information does not represent victims that have not been in contact with Correctional Service of Canada or those who choose not to register.
Response rates ranged from 89.0% in 2017-18 to 91.6% in 2019-20.
The proportion of registered victims who identified as female or male remained relatively stable
Figure F10: Number of registered victimsFigure F10 footnote * by sex
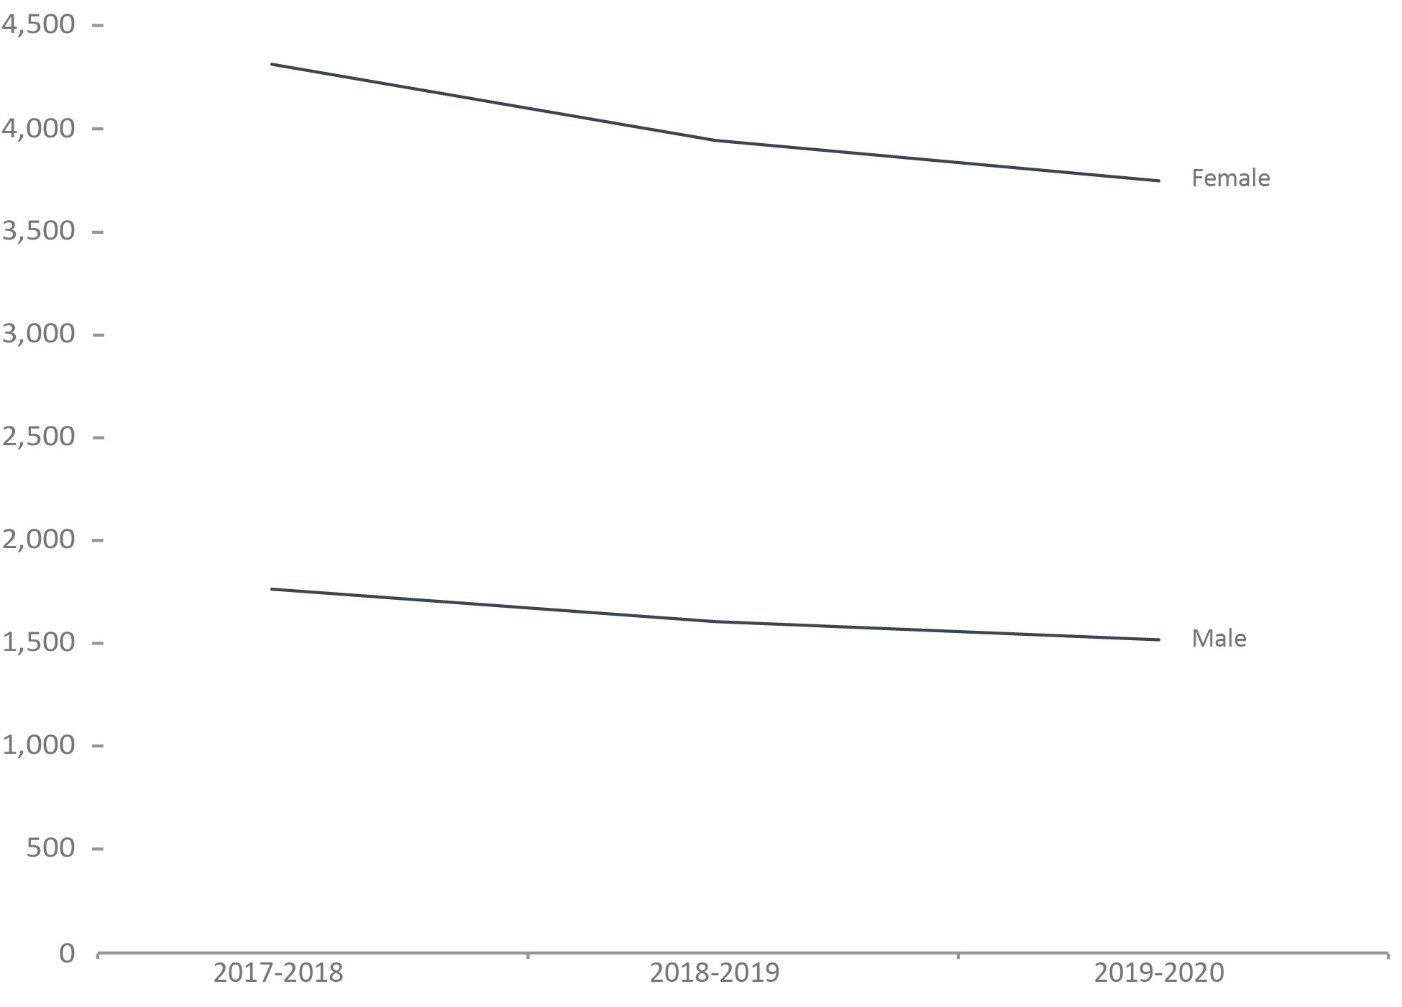
Image description
2017-18 |
2018-19 |
2019-20 |
||||
|---|---|---|---|---|---|---|
# |
% |
# |
% |
# |
% |
|
Female |
4,317 |
71 |
3,947 |
71.1 |
3,750 |
71.2 |
Male |
1,764 |
29 |
1,606 |
28.9 |
1,517 |
28 |
Figure F10 Notes:
Source: Data Warehouse, Correctional Service of Canada.
- Most registered victimsFigure F10 footnote * identified as female (71.2%). The split between male and female victims has remained fairly consistent in the last 3 years.
*Victims need to be either age 18 to register or demonstrate they can act for themselves or are legally emancipated. Registered victims refer to victims registered with the federal correctional system (Table F7).
Demographic information was voluntarily self-reported, by victims who have registered to receive information about the offender that harmed them. The information does not represent victims that have not been in contact with CSC or those who choose not to register.
Response rates for victim sex fell from 75.6% in 2017-18 to 59.5% in 2019-20.
2017-18 |
2018-19 |
2019-20 |
||||
|---|---|---|---|---|---|---|
# |
% |
# |
% |
# |
% |
|
Male |
1,764 |
29 |
1,606 |
28.9 |
1,517 |
28 |
Female |
4,317 |
71 |
3,947 |
71.1 |
3,750 |
71.2 |
Table F10 Notes:
Source: Data Warehouse, Correctional Service of Canada.
Demographic information was voluntarily self-reported, by victims who have registered to receive information about the offender that harmed them. The information does not represent victims that have not been in contact with CSC or those who choose not to register.
Response rates for victim sex fell from 75.6% in 2017-18 to 59.5% in 2019-20.
Most registered victims were White
Figure F11: Number of registered victimsFigure F11 footnote * by ethnicity (2019-20)
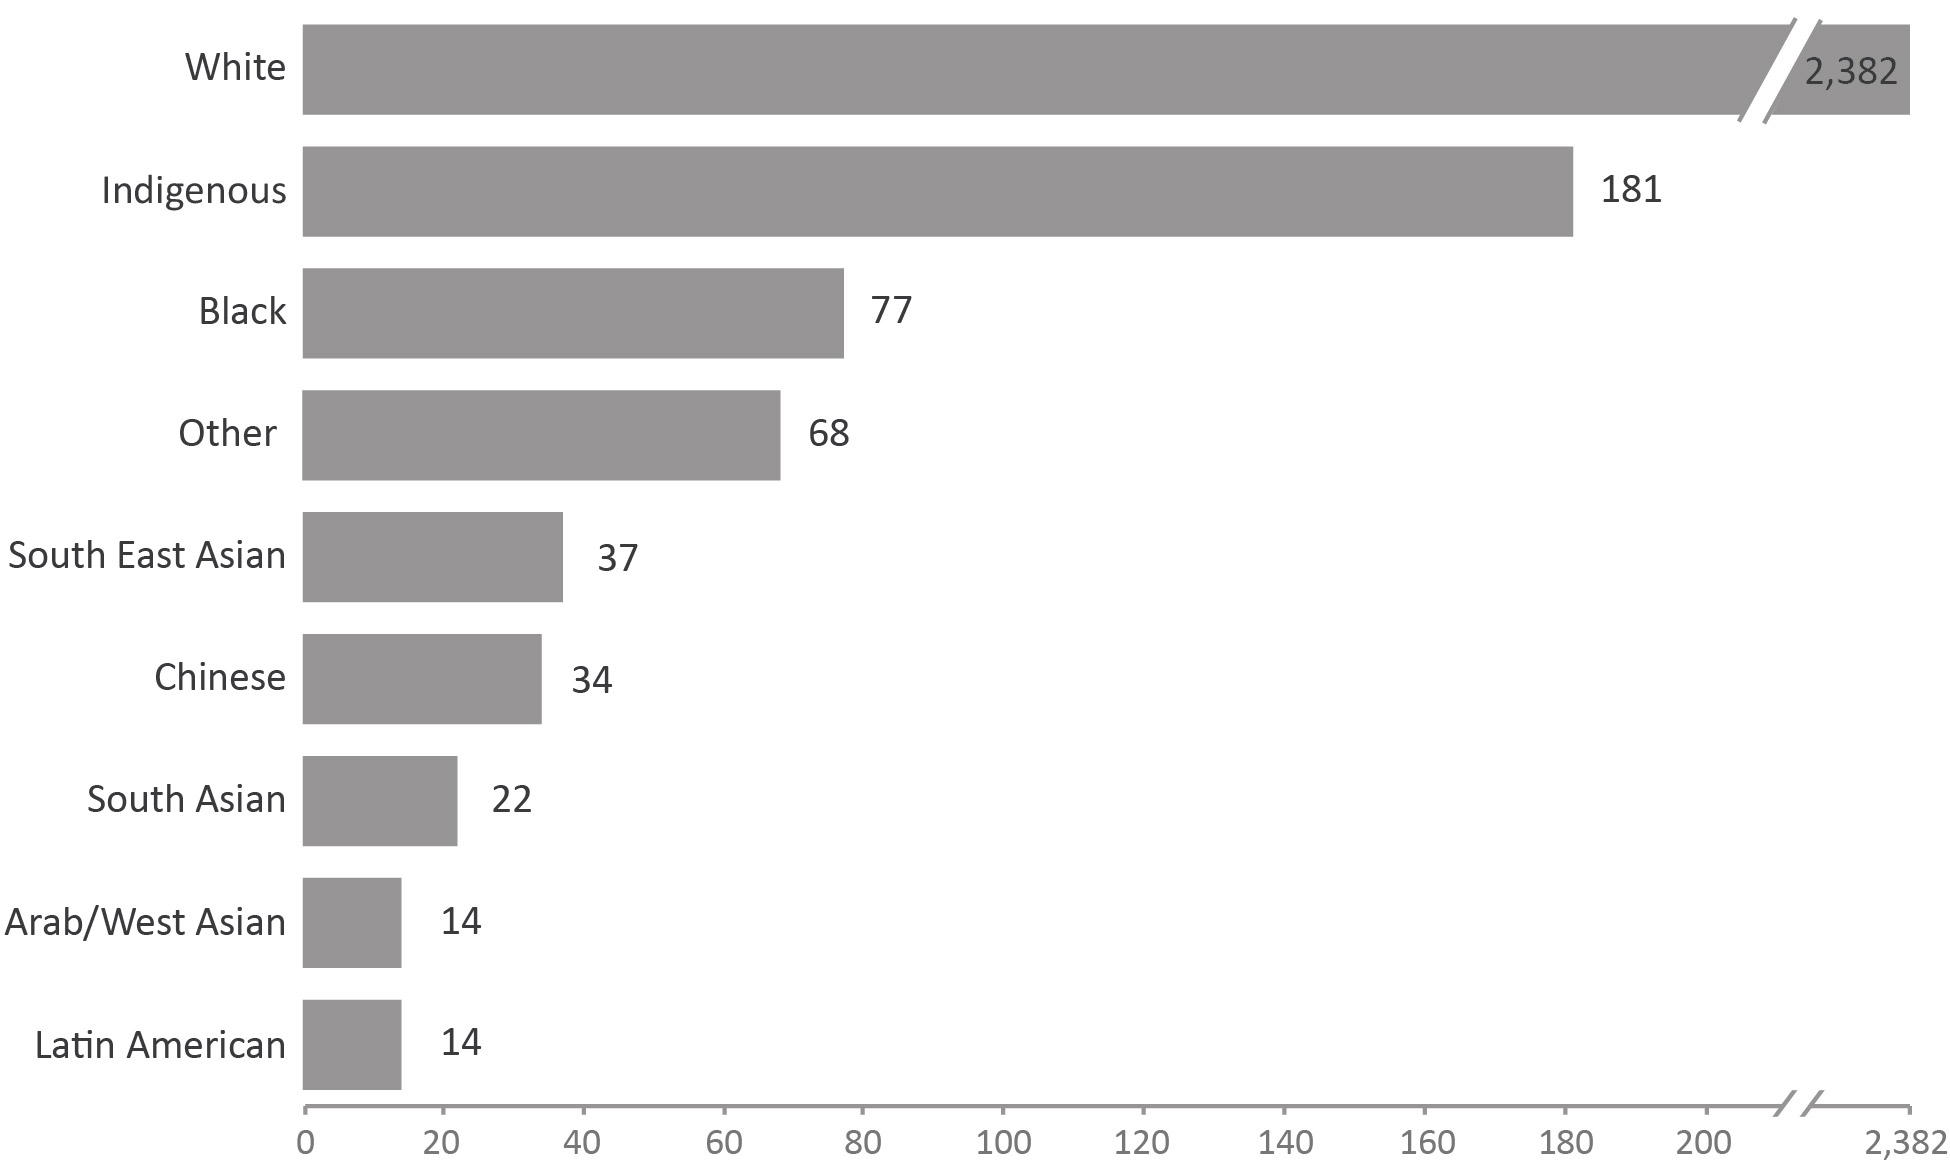
Image description
Ethnicity |
Number |
Percent |
|---|---|---|
White |
2,382 |
84.2 |
Indigenous |
181 |
6.4 |
Black |
77 |
2.7 |
South Asian |
22 |
0.8 |
Chinese |
34 |
1.2 |
South East Asian |
37 |
1.3 |
Arab/West Asian |
14 |
0.5 |
Latin American |
14 |
0.5 |
Other |
68 |
2.4 |
Figure F11 Notes:
Source: Data Warehouse, Correctional Service of Canada.
- Most registered victimsFigure F11 footnote * (84.2%) identified as White. The next most common ethnicity was Indigenous (6.4%).
Demographic information was voluntarily self-reported, by victims who have registered to receive information about the offender that harmed them. The information does not represent victims that have not been in contact with CSC or those who choose not to register.
Response rates for victim ethnicity ranged from 60.3% in 2017-18 to 68.1% in 2019-20.
2017-18 |
2018-19 |
2019-20 |
||||
|---|---|---|---|---|---|---|
# |
% |
# |
% |
# |
% |
|
White |
2,721 |
85.1 |
2,487 |
84.8 |
2,382 |
84.2 |
Indigenous |
191 |
6.0 |
182 |
6.2 |
181 |
6.4 |
Black |
77 |
2.4 |
75 |
2.6 |
77 |
2.7 |
South Asian |
39 |
1.2 |
24 |
0.8 |
22 |
0.8 |
Chinese |
33 |
1 |
34 |
1.2 |
34 |
1.2 |
South East Asian |
41 |
1.3 |
35 |
1.1 |
37 |
1.3 |
Arab/West Asian |
16 |
0.5 |
16 |
0.5 |
14 |
0.5 |
Latin American |
15 |
0.5 |
16 |
0.5 |
14 |
0.5 |
Other |
66 |
2.1 |
65 |
2.2 |
68 |
2.4 |
Table F11 Notes:
Source: Data Warehouse, Correctional Service of Canada.
Demographic information was voluntarily self-reported, by victims who have registered to receive information about the offender that harmed them. The information does not represent victims that have not been in contact with CSC or those who choose not to register.
Response rates for victim ethnicity ranged from 60.3% in 2017-18 to 68.1% in 2019-20.
The number of notifications to registered victims has increased
Figure F12: Number of notifications to registered victimsFigure F12 footnote *
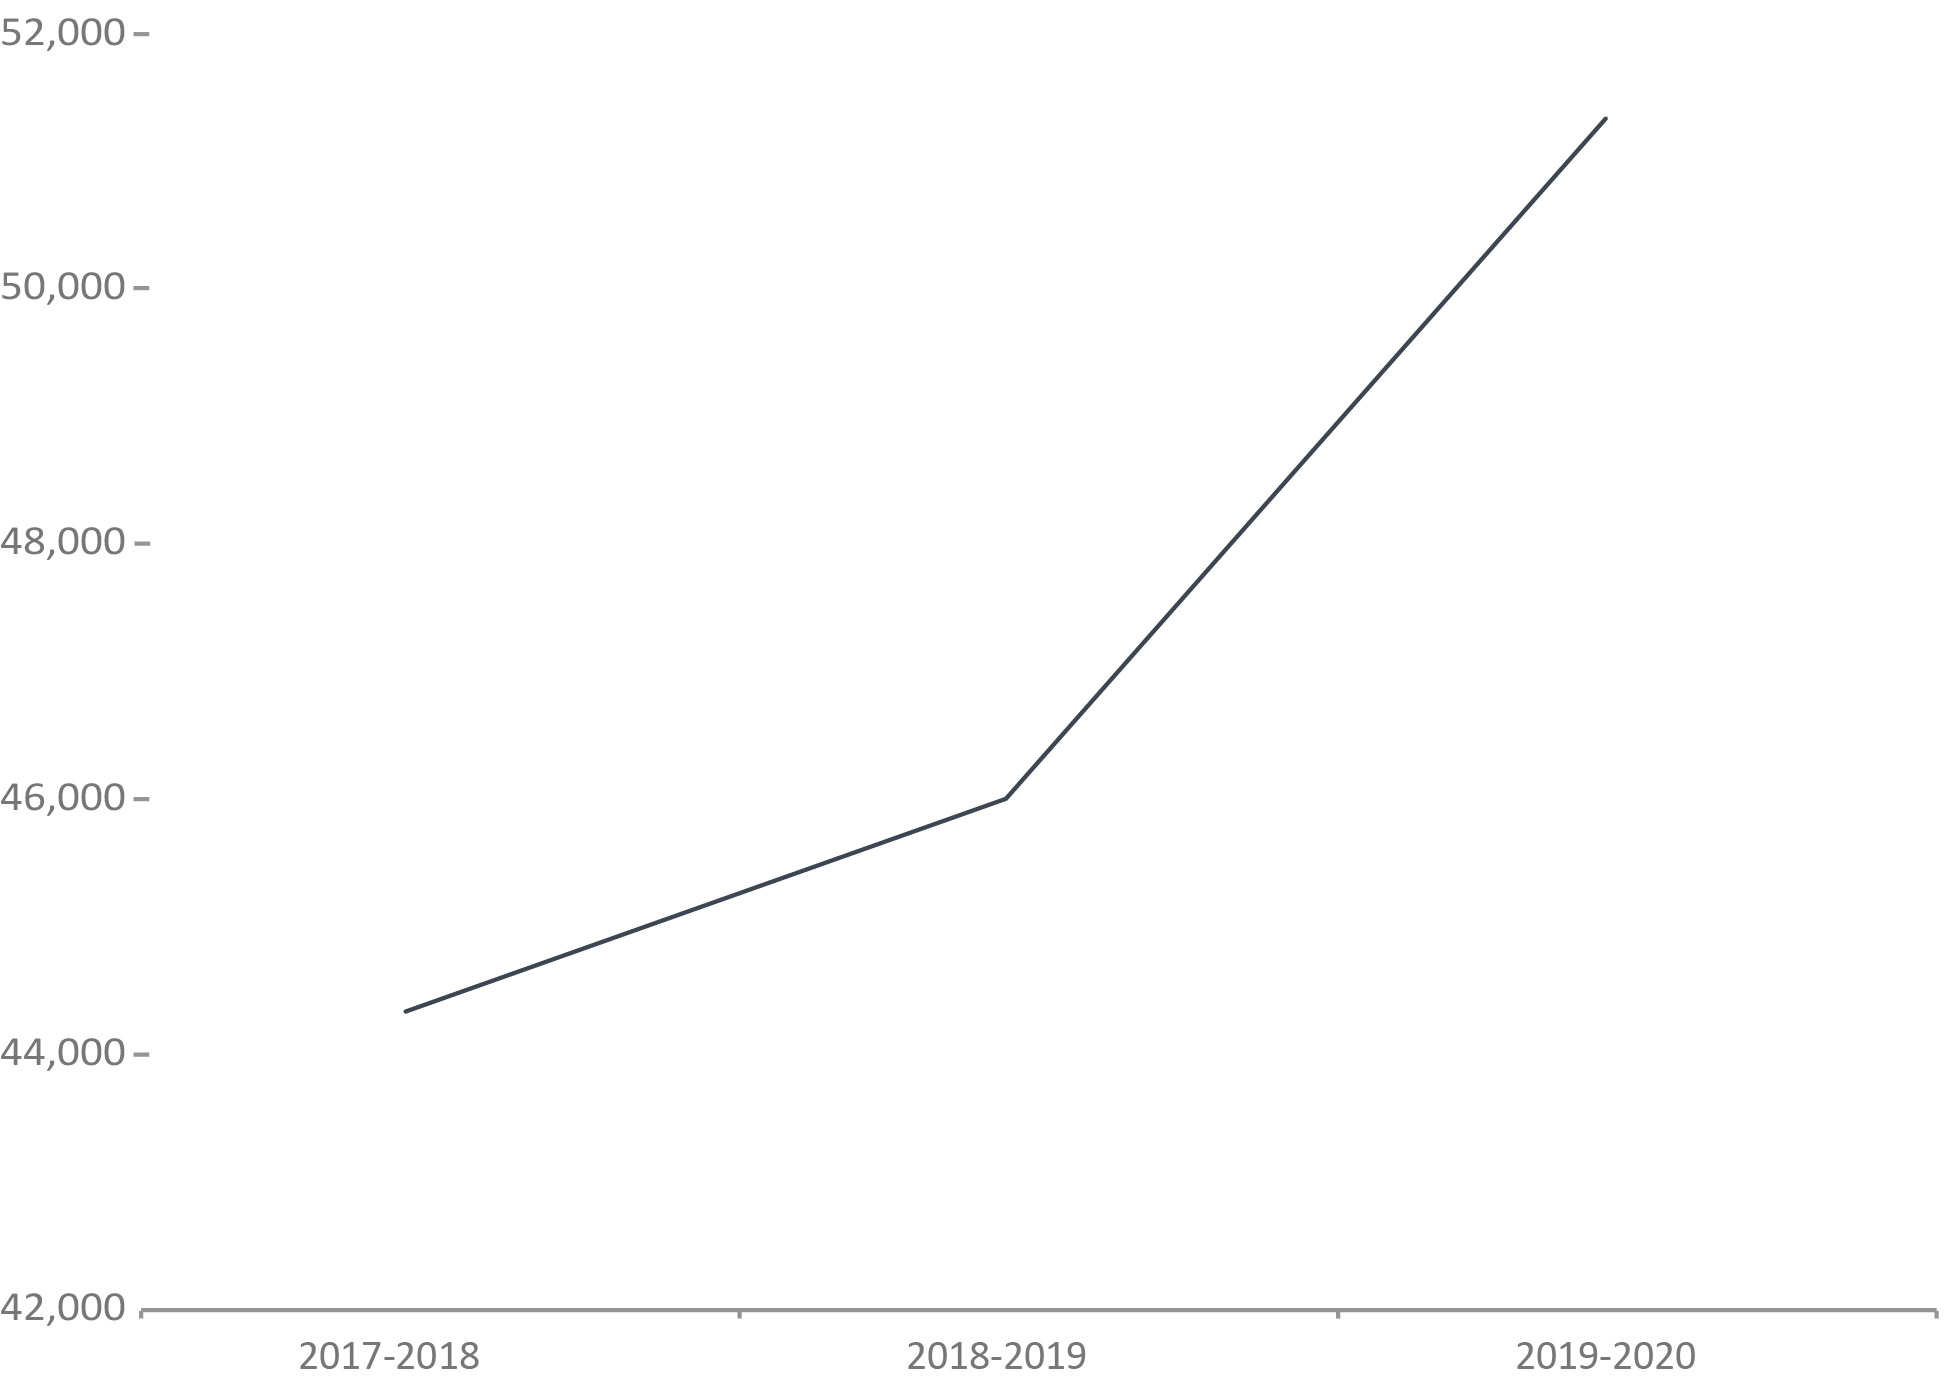
Image description
Year |
# |
|---|---|
2017-18 |
44,331 |
2018-19 |
46,000 |
2019-20 |
51,339 |
Notes:
Source: Data Warehouse, Correctional Service of Canada.
- The number of contacts with registered victimsFigure F12 footnote * for notifications increased by 15.8% from 2017-18 to 2019-20 (44,331 to 51,339).
A notification contact is when the CSC Victim Services Unit sends information to victims. Examples include temporary absences, travel permits, and sentencing information of the offender.
Year |
# |
|---|---|
2017-18 |
44,331 |
2018-19 |
46,000 |
2019-20 |
51,339 |
Table F12 Notes:
Source: Data Warehouse, Correctional Service of Canada.
A notification contact is when the CSC Victim Services Unit sends information to victims. Examples include temporary absences, travel permits, and sentencing information of the offender.
The number of victim statements received for consideration in release decisions has fluctuated
Figure F13: Number of victim statements received for consideration in release decisions
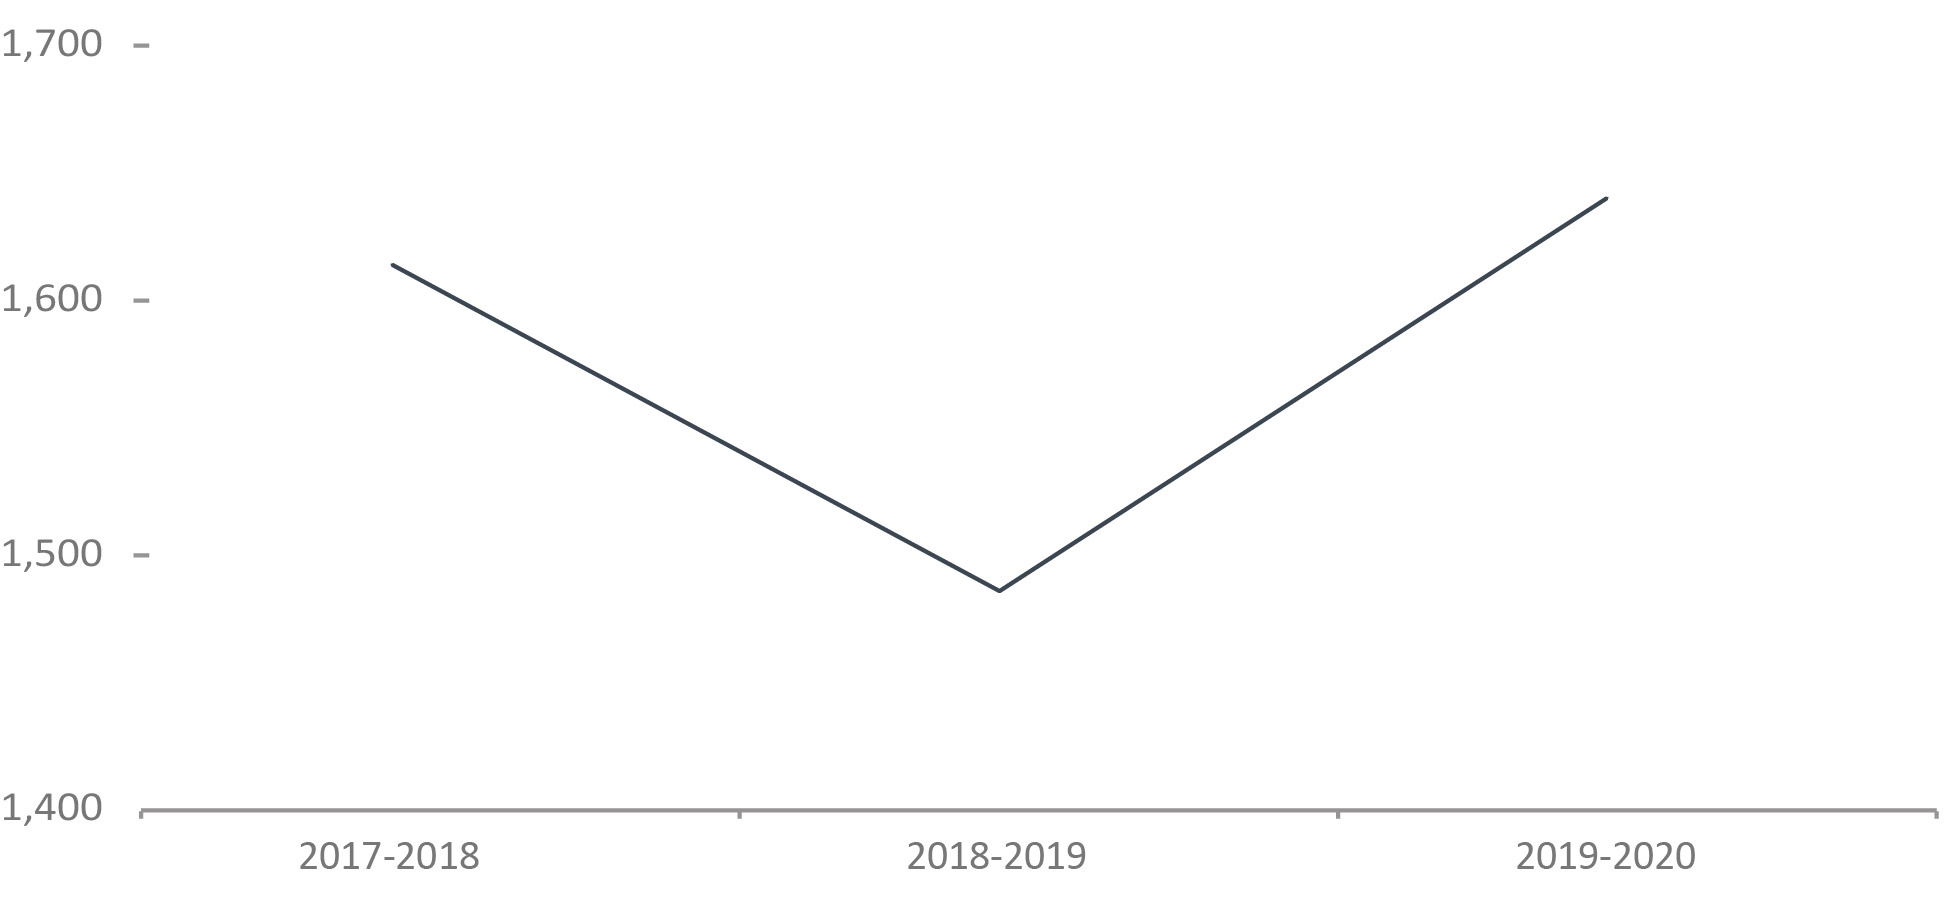
Image description
Year |
# |
|---|---|
2017-18 |
1,614 |
2018-19 |
1,486 |
2019-20 |
1,640 |
Figure F13 Notes:
Source: Data Warehouse, Correctional Service of Canada.
- The number of victim statements received for consideration in 2019-20 is consistent with 2017-18. There was a slight dip in the number of statements in 2018-19.
The number of statements received for consideration in release decisions reflects the number of statements received. This is different than the number of victim statements considered when release decisions are made.
Year |
# |
|---|---|
2017-18 |
1,614 |
2018-19 |
1,486 |
2019-20 |
1,640 |
Table F13 Notes:
Source: Data Warehouse, Correctional Service of Canada.
The number of statements received for consideration in release decisions reflects the number of statements received. This is different than the number of victim statements considered when release decisions are made.
The number of victims who request financial assistance to attend parole hearings has fluctuated
Figure F14: Number of requests for financial assistance to attend parole hearings
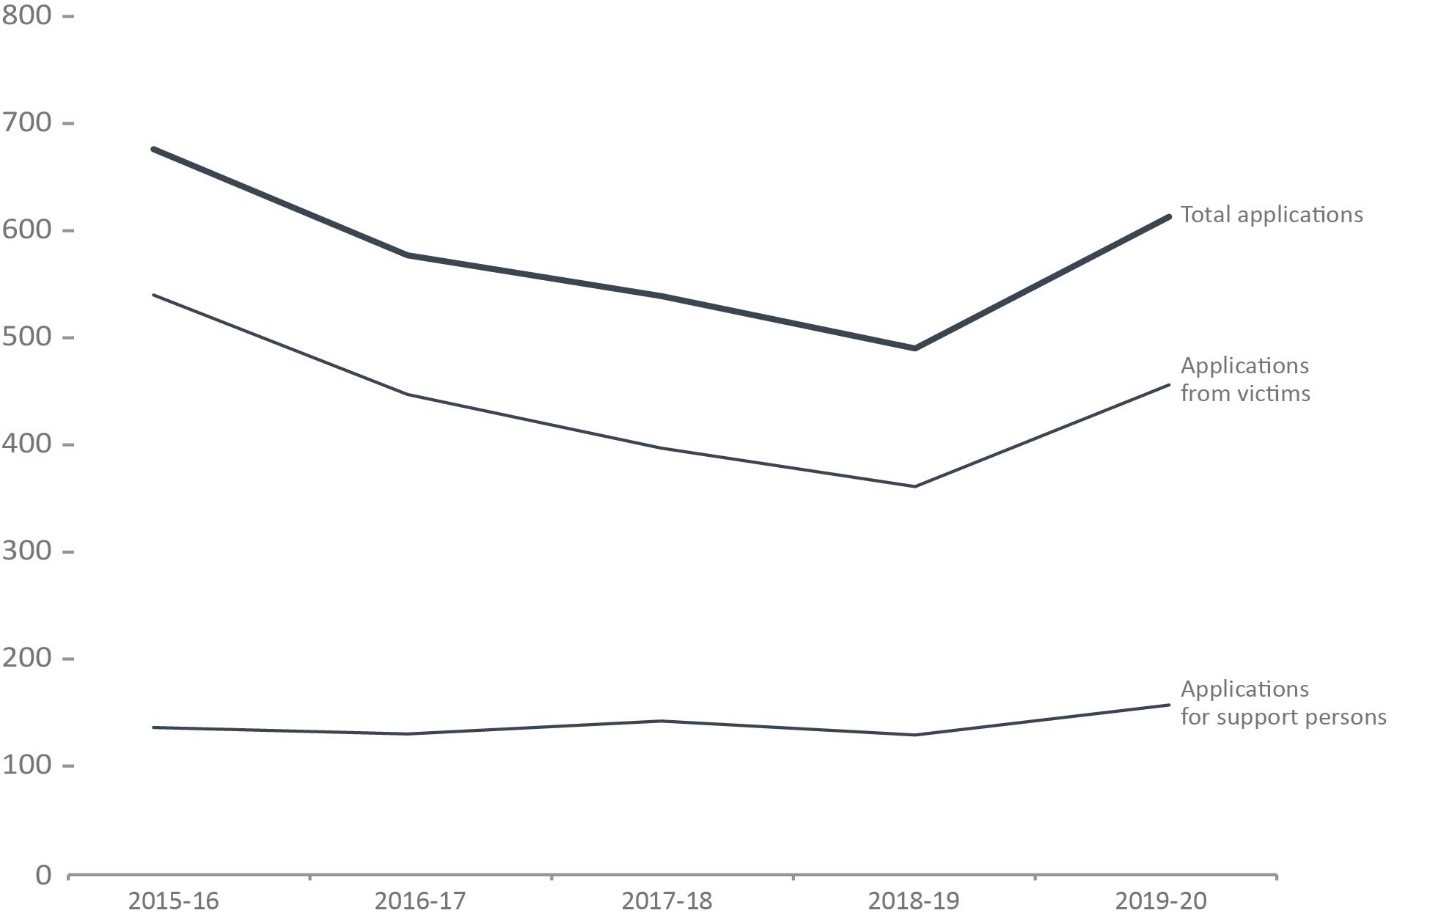
Image description
2015-16 |
2016-17 |
2017-18 |
2018-19 |
2019-20 |
|
|---|---|---|---|---|---|
Number of applications for financial assistance received from victims |
540 |
447 |
397 |
361 |
456 |
Number of applications for financial assistance received from support personsFigure F14 footnote * |
136 |
130 |
142 |
129 |
157 |
Total number of applications |
676 |
577 |
539 |
490 |
613 |
Figure F13 Notes:
Source: Justice Canada
- The number of victim applications for financial assistance declined from 2015-16 to 2018-19 and then increased from 2018-19 to 2019-20.
- Victims can apply for financial assistance for a support person to accompany them to a parole hearing.
2015-16 |
2016-17 |
2017-18 |
2018-19 |
2019-20 |
|
|---|---|---|---|---|---|
Number of applications for financial assistance received from victims |
540 |
447 |
397 |
361 |
456 |
Number of applications for financial assistance received from support personsTable F14 footnote * |
136 |
130 |
142 |
129 |
157 |
Total number of applications |
676 |
577 |
539 |
490 |
613 |
Table F14 Notes:
Source: Justice Canada
Number of Parole Board of Canada contacts with victims
Figure F15: Total number of PBC contactsFigure F15 footnote * with victims
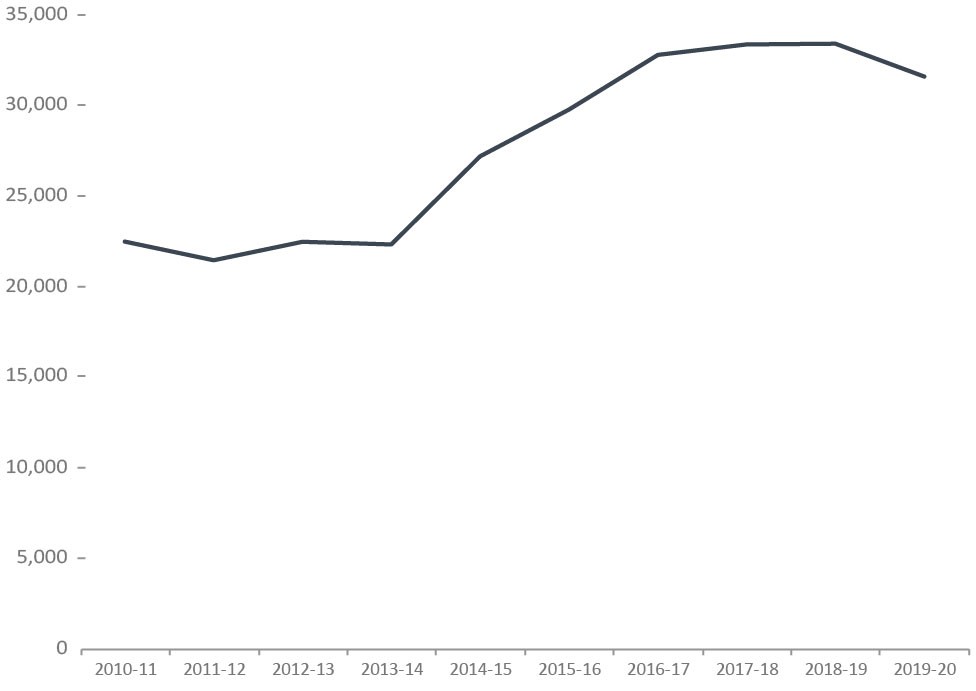
Image description
Year |
Total Number of ContactsTable F15 footnote * |
|---|---|
2010-11 |
22,483 |
2011-12 |
21,449 |
2012-13 |
22,475 |
2013-14 |
22,323 |
2014-15 |
27,191 |
2015-16 |
29,771 |
2016-17 |
32,786 |
2017-18 |
33,370 |
2018-19 |
33,408 |
2019-20 |
31,587 |
Figure F15 Notes:
Source: Parole Board of Canada.
- In 2019-20, the Parole Board of Canada (PBC) reported 31,587 contactsFigure F15 footnote * with victims, a decrease of 5.5% compared to the previous year.
- In the last 10 years, the number of PBC contactsFigure F15 footnote * with victims increased by 40.5% (9,104 more contacts).
Year |
Total Number of ContactsTable F15 footnote * |
|---|---|
2010-11 |
22,483 |
2011-12 |
21,449 |
2012-13 |
22,475 |
2013-14 |
22,323 |
2014-15 |
27,191 |
2015-16 |
29,771 |
2016-17 |
32,786 |
2017-18 |
33,370 |
2018-19 |
33,408 |
2019-20 |
31,587 |
Table F15 Notes:
Source: Parole Board of Canada.
Victims presenting a statement at PBC hearings
Figure F16: Total number of victim presentations vs. the number of hearings with victim presentations
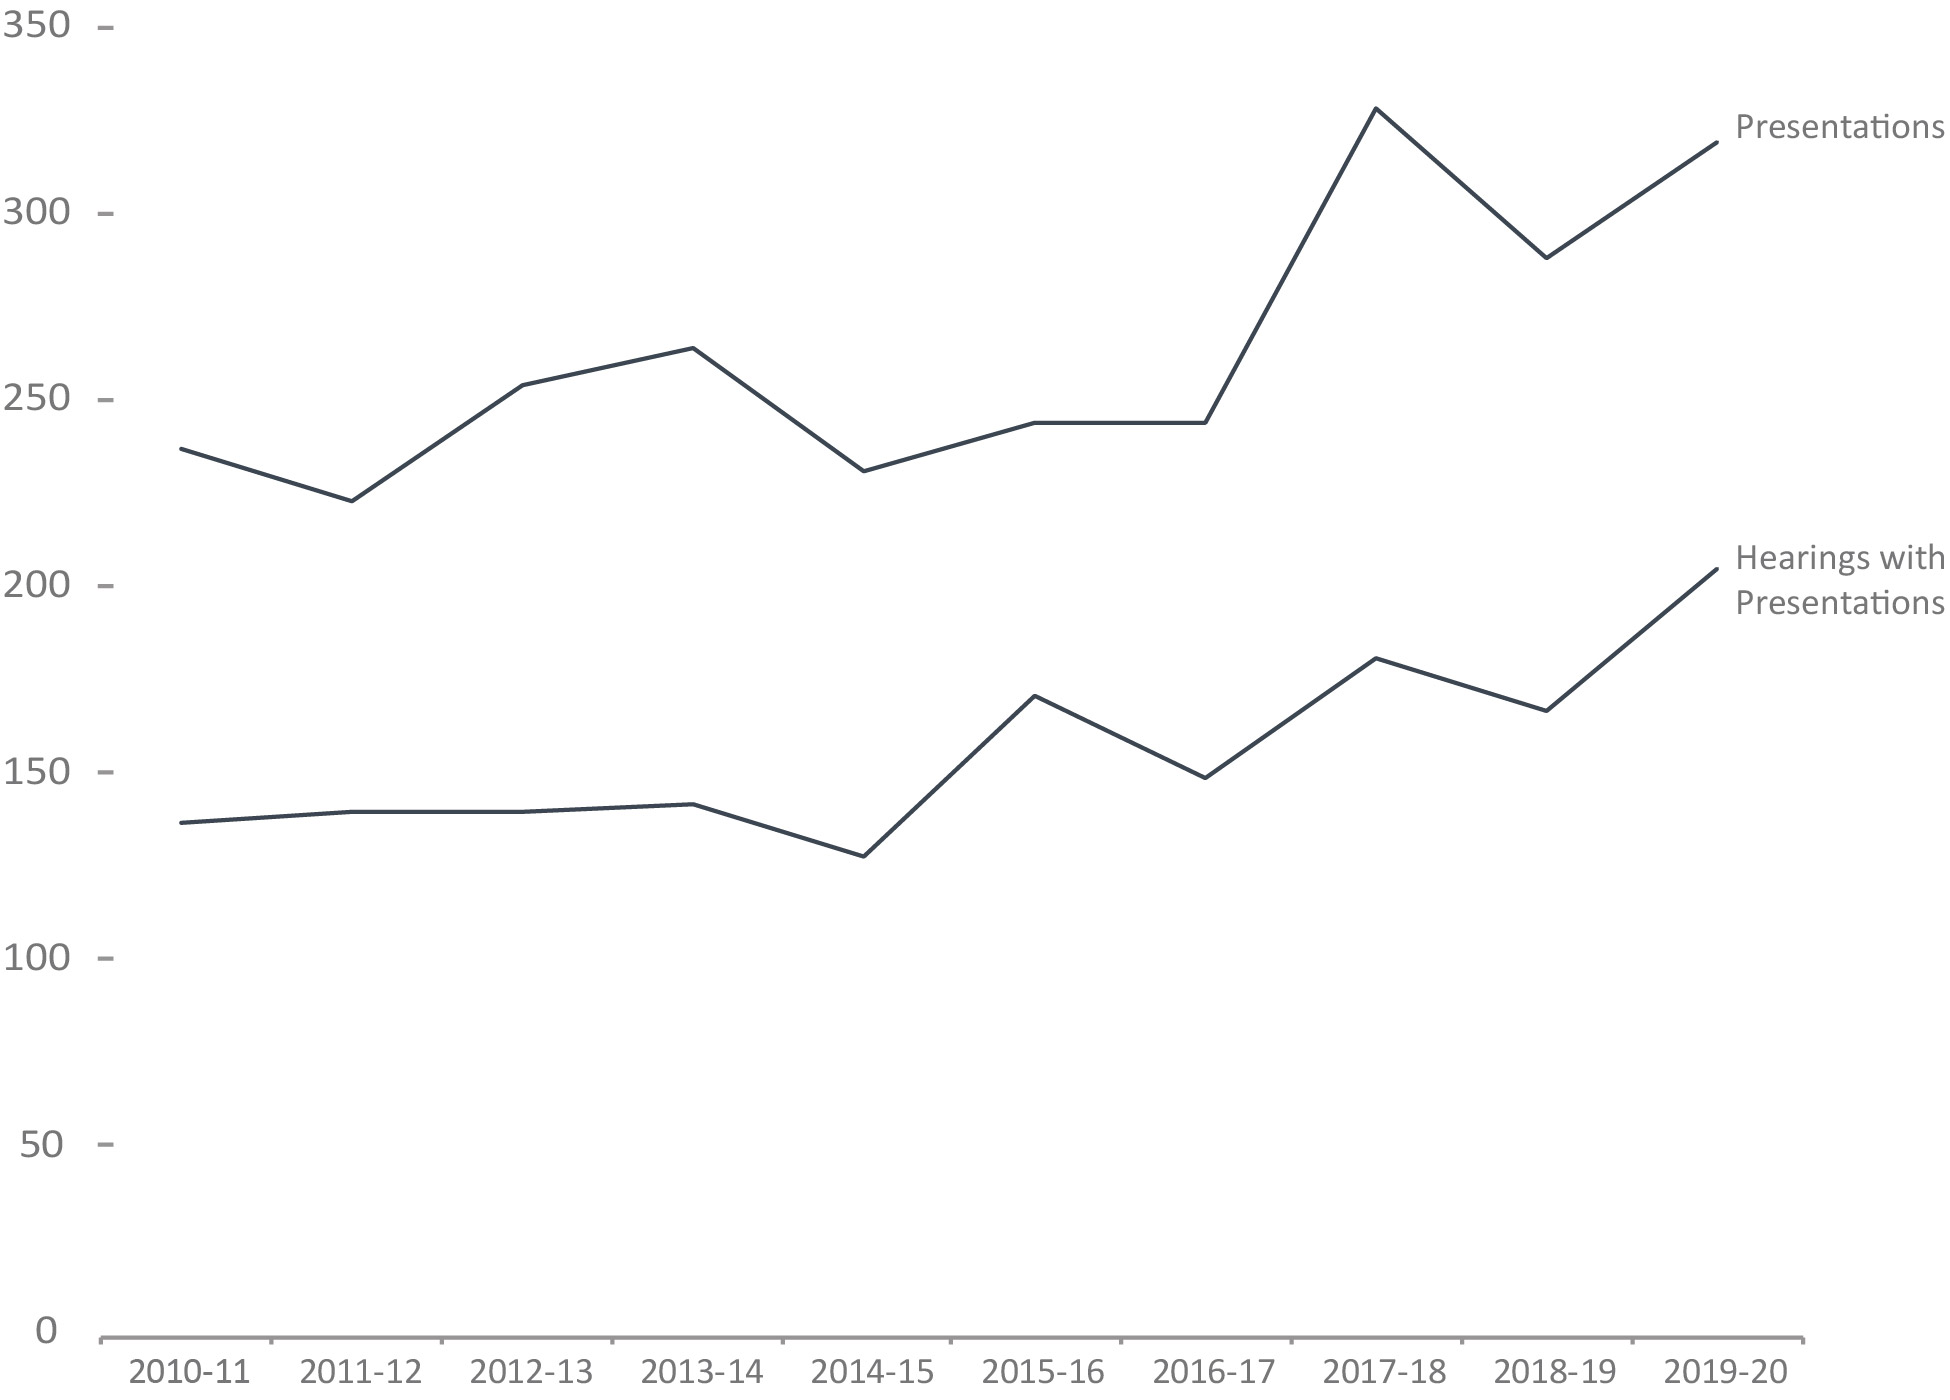
Image description
Year |
Number of Presentations |
Number of Hearings with Presentations |
|
|---|---|---|---|
2010-11 |
237 |
137 |
|
2011-12 |
223 |
140 |
|
2012-13 |
254 |
140 |
|
2013-14 |
264 |
142 |
|
2014-15 |
231 |
128 |
|
2015-16 |
244 |
171 |
|
2016-17 |
244 |
149 |
|
2017-18 |
328 |
181 |
|
2018-19 |
288 |
167 |
|
2019-20 |
319 |
205 |
|
Figure F16 Notes:
Source: Parole Board of Canada.
- In 2019-20, victims made 319 presentations (+10.8% or +31) at 205 hearings (+22.8% or +38) compared to 2018-19.
- In the last 10 years, the number of victims who presented a statement at hearings has been fluctuating. In 2019-20, the number of victims who presented a statement at hearings increased by 34.6% (82 more presentations) compared to 2010-11.
- Between 2010-11 and 2019-20, the majority of presentations were done in person (88.8%) followed by presentations via video conferencing or tele conferencing (7.8%) and pre-recorded presentations (audiotape or videotape/DVD) (3.4%).
- The major offence of victimization for victims making presentations in 2019-20 was most likely to have been murder (56.7%), sexual assault (11.6%) and manslaughter (4.4%).
Year |
Number of Hearings with Presentations |
Number of Presentations |
|---|---|---|
2010-11 |
137 |
237 |
2011-12 |
140 |
223 |
2012-13 |
140 |
254 |
2013-14 |
142 |
264 |
2014-15 |
128 |
231 |
2015-16 |
171 |
244 |
2016-17 |
149 |
244 |
2017-18 |
181 |
328 |
2018-19 |
167 |
288 |
2019-20 |
205 |
319 |
Table F16 Notes:
Source: Parole Board of Canada.
Victims requesting access to the decision registry
Figure F17: Total number of requests for access to the decision registryFigure F17 footnote * vs. requests for access made by victims
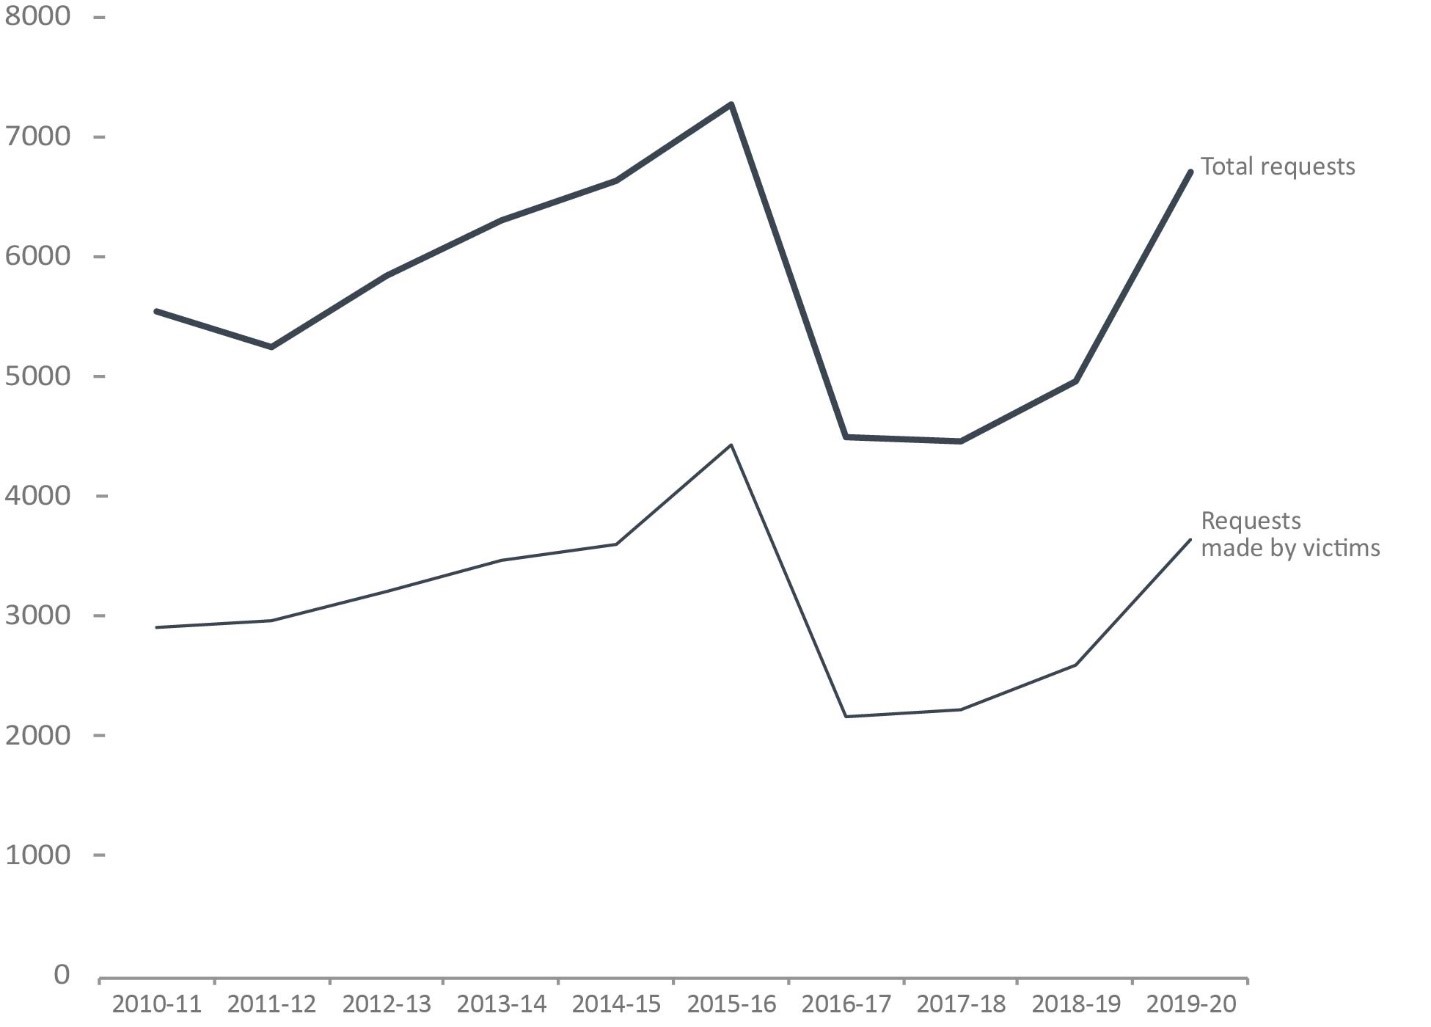
Image description
Year |
Requests made by victims |
Total number of requests |
|
|---|---|---|---|
# |
% |
||
2010-11 |
2,914 |
52.5 |
5,550 |
2011-12 |
2,970 |
56.5 |
5,252 |
2012-13 |
3,214 |
55.0 |
5,848 |
2013-14 |
3,474 |
55.1 |
6,309 |
2014-15 |
3,608 |
54.3 |
6,640 |
2015-16 |
4,436 |
61.0 |
7,276 |
2016-17 |
2,169 |
48.2 |
4,502 |
2017-18 |
2,227 |
49.9 |
4,467 |
2018-19 |
2,601 |
52.4 |
4,967 |
2019-20 |
3,649 |
54.4 |
6,713 |
Source: Parole Board of Canada.
- In 2019-20, the number of requests to access the decision registryFigure F17 footnote * made by victims increased by 40.3% to 3,649 and the proportion of requests made by victims increased two percentage points to 54.4% compared to 2018-19.
- When averaged over the last ten years (between 2010-11 and 2019-20), 54.3% of request to access the decision registryFigure F17 footnote * were made by victims.
Figure F17 Notes:
Victims also include victims' agents and victims' organizations.
Year |
Requests made by victims |
Total number of requests |
|
|---|---|---|---|
# |
% |
||
2010-11 |
2,914 |
52.5 |
5,550 |
2011-12 |
2,970 |
56.5 |
5,252 |
2012-13 |
3,214 |
55.0 |
5,848 |
2013-14 |
3,474 |
55.1 |
6,309 |
2014-15 |
3,608 |
54.3 |
6,640 |
2015-16 |
4,436 |
61.0 |
7,276 |
2016-17 |
2,169 |
48.2 |
4,502 |
2017-18 |
2,227 |
49.9 |
4,467 |
2018-19 |
2,601 |
52.4 |
4,967 |
2019-20 |
3,649 |
54.4 |
6,713 |
Table F17 Notes:
Source: Parole Board of Canada.
Victims also include victims' agents and victims' organizations.
- Date modified: