Public Safety Canada Quarterly Financial Report for the quarter ended September 30, 2018
Table of Contents
- 1.0 Introduction
- 2.0 Highlights of Fiscal Quarter and Fiscal Year-to-Date (YTD) Results
- 3.0 Risks and Uncertainty
- 4.0 Significant Changes in Relation to Operations, Programs and Personnel
- 5.0 Approval by Senior Officials
- 6.0 Statement of Authorities (unaudited)
- 7.0 Departmental budgetary expenditures by Standard Object (unaudited)
1.0 Introduction
This quarterly financial report for the period ending September 30, 2018 has been prepared by management as required by section 65.1 of the Financial Administration Act, in the form and manner prescribed by Treasury Board. The report should be read in conjunction with the Main Estimates as well as Equality and Growth a Strong Middle Class (Budget 2018).
This quarterly financial report has not been subject to an external audit or review. However, it has been reviewed by the Departmental Audit Committee prior to approval by senior officials.
Information on the mandate, roles, responsibilities and programs of Public Safety Canada can be found in the 2018-19 Departmental Plan and the 2018-19 Main Estimates.
1.1 Basis of Presentation
This quarterly report has been prepared using an expenditure basis of accounting. The accompanying Statement of Authorities table includes the Department's spending authorities granted by Parliament, or received from Treasury Board Central Votes, and those used by the Department consistent with the Main Estimates and the Budget 2018 for the 2018-19 fiscal year. This quarterly report has been prepared using a special purpose financial reporting framework designed to meet the information needs concerning the use of spending authorities.
The authority of Parliament is required before funds can be spent by the Government. Approvals are given in the form of annually approved limits through Appropriation Acts or through legislation in the form of statutory spending authority for specific purposes.
Public Safety Canada uses the full accrual method of accounting to prepare and present its annual departmental financial statements that are part of the departmental performance reporting process. However, the spending authorities voted by Parliament remain on an expenditure basis, as do the expenditures presented in this report.
2.0 Highlights of Fiscal Quarter and Fiscal Year-to-Date (YTD) Results
The following graph provides a comparison of the net budgetary authorities and expenditures as of September 30, 2018 and September 30, 2017 for the Department's combined:
- Vote 1: Operating Expenditures;
- Vote 5: Grants and Contributions;
- Statutory Votes:
- Employee Benefit Plans; and
- Minister's Salary and Car Allowance.
Budgetary Authorities and Expenditures Comparison
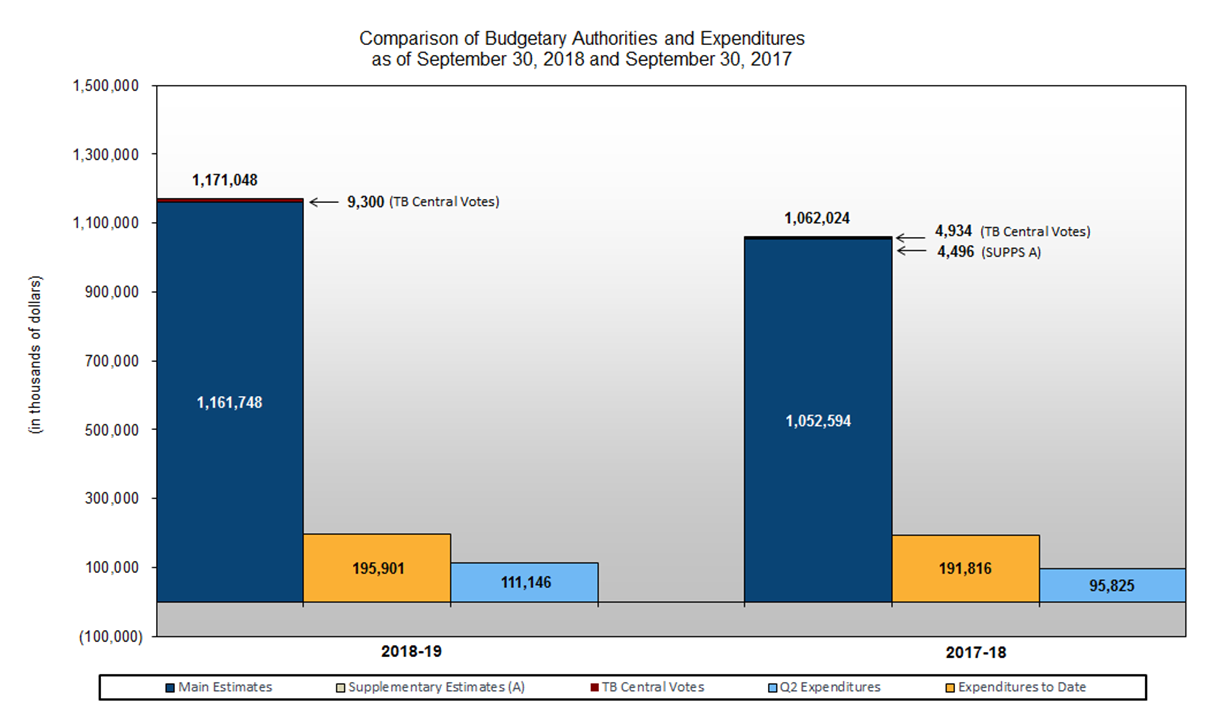
Note: The 2018-19 TB Central Votes include $3,127K for Budget 2018 authorities and $6,173K for the Operating Budget Carry Forward.
Image description
Starting from the left hand side, the “first” column in the graph indicates that the Department authorities are at $1,171.0 million for fiscal year 2018-19. The year-to-date expenditures of $195.9 million reported at the end of the second quarter of the 2018-19 fiscal year are shown under the “second” column. The expenditures of $111.1 for the period ended September 30, 2018 (i.e. second quarter) are presented under the “third” column. The “fourth” column in the graph depicts the 2017-18 authorities which were at $1,062.0 million at the end of September 2017. The 2017-18 year-to-date expenditures of $191.8 million are shown under the “fifth” column. The Departments’ actual expenditures incurred in the second quarter of 2017-18 were $95.8 million and are shown under the “sixth” column of the graph.
2.1 Significant Changes to Authorities
For the period ending September 30, 2018, the authorities provided to the Department include Main Estimates, Budget 2018 authorities, and TB Central Vote transfers. The 2017-18 authorities for the same period included Main Estimates, Supplementary Estimates (A), and TB Central Vote transfers. The Statement of Authorities table presents a net increase of $109.0 million (10.3 percent) compared to those of the same period of the previous year (from $1,062.0 million to $1,171.0 million).
Operating Expenditures authorities have increased by $15.9 million (12.1 percent) (from $131.4 million to $147.3 million) mainly due to:
- An increase of $4.7 million for negotiated salary adjustment;
- An increase of $2.5 million in funding level for the Government Operations Centre (GOC) Accommodations Project (Budget 2016);
- An increase of $2.2 million in the Department's Operating Budget Carry Forward;
- An increase of $1.8 million for the creation of the Memorial Grant Program for First Responders (Budget 2017);
- An increase of $1.8 million for the implementation of an initiative to build capacity to address drug impaired driving in Canada (horizontal item);
- An increase of $1.7 million in funding level for the ongoing Phase II of Canada's Cyber Security Strategy, which will introduce actions to secure cyber systems outside of the Government of Canada;
- An increase of $1.7 million in funding level to enhance the Passenger Protect Program (Budget 2018);
- An increase of $1.5 million in funding level in support of Canada's 2018 G7 Presidency in Charlevoix, Quebec in June 2018 (Budget 2018) (horizontal item); and
- An increase of $1.1 million for the implementation of Canada's new legal framework to strictly regulate and restrict access to cannabis (horizontal item).
These increases are offset by the following decreases:
- A decrease of $2.4 million for new funding to explore options for the potential deployment of a public safety broadband network in Canada (Budget 2015); and
- A decrease of $0.7 million for a one-year renewal of funding for the Investment Canada Act (ICA) National Security Review (NSR) Program.
Grants and Contributions (G&C) authorities have increased by $92.3 million (10.1 percent) (from $915.5 million to $1,007.9 million) mainly due to:
- An increase of $77.5 million in funding level in support of Canada's 2018 G7 Presidency Charlevoix, Quebec in June 2018 (Budget 2018) (horizontal item);
- An increase of $21.6 million for the creation of the Memorial Grant Program for First Responders (Budget 2017);
- An increase of $21.1 million in additional contribution funding for the First Nations Policing Program;
- An increase of $20.3 million for the National Disaster Mitigation Program, aimed at reducing the impacts of natural disasters on Canadians (Budget 2014);
- An increase of $17.3 million for the Implementation of an initiative to build capacity to address drug impaired driving in Canada (horizontal item);
- An increase of $2.0 million for the creation of the office for community outreach and countering radicalization to violence (Budget 2016);
- An increase of $1.1 million in support of addressing the needs of vulnerable offenders in the federal correctional system (Budget 2017) (horizontal item);
- An increase of $1.0 million in additional funding for the Security Infrastructure Program in support of the Safer Communities Initiative (Budget 2017);
- A net increase of $0.9 million for other initiatives of lesser value; and
- An increase of $0.8 million to implement the Strategy to prevent and address gender-based violence (Budget 2017) (horizontal item).
These increases are offset by the following decreases:
- A decrease of $70.3 million for non-discretionary requirements to address existing and future obligations under the Disaster Financial Assistance Arrangements program; and
- A decrease of $1.0 million for supporting the Canadian Red Cross' Spring 2017 flood relief efforts across Canada.
Budgetary Statutory authorities have increased by $0.8 million (5.2 percent) in 2018-19 mostly as a result of the Employee Benefit Plan (EBP) costs associated with the change in the Department budgetary requirements for salary and EBP.
2.2 Significant Variances from Previous Year Expenditures
Year-to-Date Expenditures
For the period ending September 30, 2018, the Departmental Budgetary Expenditures by Standard Object table presents a net increase of $4.1 million (2.1 percent) in Public Safety's year-to-date (YTD) expenditures compared to the previous year (from $191.8 million to $195.9 million). This increase is mostly due to:
- An increase of $5.4 million in transfer payments expenditures mainly related to the timing of payouts for the Biology Casework Analysis contribution program and the National Crime Prevention Strategy; and
- An increase of $2.1 million in professional and special services dedicated primarily to information technology services.
These increases are offset by:
- A decrease of $2.8 million in personnel expenditures related to retroactive salary payments in 2017-18 as a result of the signing of collective bargaining agreements; and
- A decrease of $0.6 million for other expenditure variances of lesser value.
Second Quarter Expenditures
Compared to the previous year, expenditures used during the quarter ended September 30, 2018 have increased by $15.3 million (16.0 percent) (from $95.8 million to $111.1 million) as reflected in the Departmental Budgetary Expenditures by Standard Object table.
- Personnel expenditures have decreased by $5.1 million (15.3 percent) mainly due to:
- A decrease of $5.2 million in expenditures as a result of retroactive payments for collective bargaining renewals taking place in the second quarter of the previous fiscal year 2017-18.
- Other operating expenditures have increased by $0.9 million (11.9 percent) mainly due to:
- An increase of $1.0 million for expenditures related to information technology services.
- Transfer payments expenditures have increased by $19.2 million (34.7 percent) mainly as a result of timing of grant and contribution payouts for the following programs:
- An increase of $12.6 million in expenditures for the First Nations Policing Program;
- An increase of $3.5 million for the Biology Casework Analysis Contribution Program;
- An increase of $1.9 million in payments in grants and contributions for the National Crime Prevention Strategy;
- An increase of $1.0 million in payments related to the Search and Rescue New Initiatives Fund;
- An increase of $0.9 million in expenditures related to the Heavy Urban Search and Rescue contribution program;
- An increase of $0.9 million in payments under the Disaster Financial Assistance Arrangements contribution program; and
- An increase of $0.1 million for other expenditure variances of lesser value.
Offset by the following decrease:
- A decrease of $1.7 million in expenditures for the Grant Program to National Voluntary Organization.
3.0 Risks and Uncertainty
The Department's mandate spans from public safety and security, intelligence and national security functions, social interventions for youth-at-risk, to readiness for all manner of emergencies. The Department is called, on behalf of the Government of Canada, to rapidly respond to emerging threats and ensure the safety and security of Canadians. The Department's ability to deliver its programs and services is subject to several risk sources, such as the rapidly changing asymmetrical threat environment, its ability to respond to natural or man-made disasters, government priorities, and government-wide or central agency initiatives. To deliver this mandate effectively, the collaboration of many departments and agencies, provincial and territorial governments, international partners, private sector and first responders is required.
Disaster Financial Assistance Arrangements
The Disaster Financial Assistance Arrangements (DFAA) contribution program presents a greater level of uncertainty than other Public Safety Canada (PS) grants and contributions programs given that it represents a significant portion of the PS budget and that it is subject to unforeseen events. The DFAA contribution program was established in 1970 to provide a consistent and equitable mechanism for federal sharing of provincial and territorial costs for natural disaster response and recovery where such costs would place an undue burden on a provincial or territorial economy.
There are currently 76 natural disasters for which Orders-in-Council have been approved, authorizing the provision of federal financial assistance under the DFAA, and for which final payments have not yet been made.
Public Safety's total outstanding share of liability under the DFAA in regards to these 76 events is $2.06 billion as of September 30, 2018, the majority of which is expected to be paid out over the next five years.
The following are the most significant events within Public Safety Canada's DFAA liability:
- Manitoba 2011 Spring Flood ($444.3 million);
- Alberta 2013 June Flood ($339.8 million);
- Quebec 2017 Spring Flood ($246.5 million);
- British Columbia 2017 July Wildfires ($186.4 million);
- Alberta 2016 Wildfires ($118.6 million); and
- Manitoba 2014 June Rainstorm ($117.1 million).
Phoenix Pay Modernization Project
In April 2016, PS moved to the new Phoenix federal public service pay system. In transitioning to the new pay system, large backlogs and delays at the centralized Pay Centre have led to a significant increase in pay-related issues reported by employees.
To support employees at highest risk, the Department continues to work on a range of issues that falls within the department's scope of control to support employees who are experiencing difficulties with their pay, including: providing emergency salary advances, analyzing and resolving integration issues between the department's Human Resource Management System and the Phoenix pay system. Issues affecting PS employees and the measures the Department is able to take to help mitigate them have been discussed with the unions at local and national level management consultation committees. At these meetings, union representatives have been engaged to ensure that employees' perspectives are shared with Management.
The Department is closely monitoring pay transactions to identify and address over and under payments in a timely manner and continues to apply ongoing mitigating controls which were implemented in 2016.
4.0 Significant Changes in Relation to Operations, Programs and Personnel
On August 28, 2018 the Honourable Bill Blair was appointed by the Prime Minister as the Minister of Border Security and Organized Crime Reduction within the Public Safety Canada portfolio.
Budget 2018 announced funding for the Communications Security Establishment (CSE) to create the new Canadian Centre for Cyber Security. On the recommendation of the Prime Minister and in compliance with the Order in Council signed and published on August 23, 2018, Public Safety Canada is to transfer the control and supervision of the Canadian Cyber Incident Response Centre (CCIRC) to the CSE effective on October 1, 2018. The financial impacts of the transfer will be reflected in future quarterly financial reports.
5.0 Approval by Senior Officials
Approved as required by the Policy on Financial Resource Management, Information and Reporting:
Malcolm Brown
Deputy Minister
Public Safety Canada
Ottawa (Canada)
Date: November 19, 2018
Caroline Weber
Chief Financial Officer and Assistant Deputy Minister
Corporate Management Branch
Public Safety Canada
Ottawa (Canada)
Date: November 19, 2018
6.0 Statement of Authorities (unaudited)
| Total available for use for the year ending March 31, 2019 (1) | Used during the quarter ended September 30, 2018 | Year to date used at quarter-end | |
|---|---|---|---|
| Vote 1 - Net Operating Expenditures | 147,309,901 | 32,748,870 | 62,202,551 |
| Vote 5 - Grants and Contributions | 1,007,864,906 | 74,504,638 | 125,912,264 |
| Employee Benefit Plans (EBP) | 15,787,374 | 3,871,411 | 7,742,822 |
| Minister's Salary and Motor Car Allowance | 86,000 | 21,500 | 43,000 |
| Total Authorities | 1,171,048,181 | 111,146,419 | 195,900,636 |
| (1) Includes only authorities available for use and granted by Parliament at quarter end. | |||
| Total available for use for the year ended March 31, 2018 (1) | Used during the quarter ended September 30, 2017 | Year to date used at quarter-end | |
|---|---|---|---|
| Vote 1 - Net Operating Expenditures | 131,400,054 | 36,819,362 | 63,860,908 |
| Vote 5 - Grants and Contributions | 915,540,358 | 55,300,489 | 120,544,318 |
| Employee Benefit Plans (EBP) | 14,999,364 | 3,684,485 | 7,368,970 |
| Minister's Salary and Motor Car Allowance | 84,400 | 21,150 | 42,300 |
| Total Authorities | 1,062,024,176 | 95,825,486 | 191,816,496 |
| (1) Includes only authorities available for use and granted by Parliament at quarter end. | |||
7.0 Departmental budgetary expenditures by Standard Object (unaudited)
| Planned expenditures for the year ending March 31, 2019 (1) | Expended during the quarter ended September 30, 2018 | Year to date used at quarter-end | |
|---|---|---|---|
| Expenditures: | |||
| Personnel | 119,261,262 | 28,505,566 | 58,514,512 |
| Transportation and communications | 4,907,300 | 713,719 | 1,294,539 |
| Information | 4,055,129 | 711,323 | 1,068,273 |
| Professional and special services | 25,063,959 | 5,520,655 | 7,517,210 |
| Rentals | 6,575,983 | 440,010 | 1,182,193 |
| Repair and maintenance | 1,161,310 | 72,805 | 107,004 |
| Utilities, material and supplies | 1,256,686 | 115,346 | 185,514 |
| Acquisition of land, buildings and works | - | - | - |
| Acquisition of machinery and equipment | 3,412,974 | 361,420 | 592,763 |
| Transfer payments | 1,007,864,906 | 74,504,638 | 125,912,264 |
| Public debt charges | - | - | - |
| Other subsidies and payments | 188,672 | 264,937 | 833,627 |
| Total gross budgetary expenditures | 1,173,748,181 | 111,210,419 | 197,207,899 |
| Less Revenues netted against expenditures: | |||
| Interdepartmental Provision of Internal Support Services | 2,700,000 | 64,000 | 1,307,262 |
| Total net budgetary expenditures | 1,171,048,181 | 111,146,419 | 195,900,637 |
| (1) Includes only planned expenditures against authorities for use and granted by Parliament at quarter end. | |||
| Planned expenditures for the year ended March 31, 2018 (1) | Expended during the quarter ended September 30, 2017 | Year to date used at quarter-end | |
|---|---|---|---|
| Expenditures: | |||
| Personnel | 110,263,117 | 33,647,357 | 61,274,599 |
| Transportation and communications | 4,057,918 | 655,160 | 1,136,896 |
| Information | 2,060,052 | 573,508 | 799,726 |
| Professional and special services | 21,489,046 | 3,710,122 | 5,556,220 |
| Rentals | 4,875,420 | 1,705,852 | 2,227,532 |
| Repair and maintenance | 777,775 | 250,188 | 282,439 |
| Utilities, material and supplies | 1,444,130 | 97,762 | 173,623 |
| Acquisition of land, buildings and works | - | - | - |
| Acquisition of machinery and equipment | 4,103,509 | 154,743 | 672,003 |
| Transfer payments | 915,540,358 | 55,300,489 | 120,544,318 |
| Public debt charges | - | - | - |
| Other subsidies and payments | 112,850 | 182,490 | 622,575 |
| Total gross budgetary expenditures | 1,064,724,176 | 96,277,671 | 193,289,931 |
| Less Revenues netted against expenditures: | |||
| Interdepartmental Provision of Internal Support Services | 2,700,000 | 452,185 | 1,473,435 |
| Total net budgetary expenditures | 1,062,024,176 | 95,825,486 | 191,816,496 |
| (1) Includes only planned expenditures against authorities for use and granted by Parliament at quarter end. | |||
- Date modified: