Public Safety Canada Quarterly Financial Report for the quarter ended December 31, 2023
Table of Contents
- 1.0 Introduction
- 2.0 Highlights of Fiscal Quarter and Fiscal Year-to-Date (YTD) Results
- 3.0 Risks and Uncertainty
- 4.0 Significant Changes in Relation to Operations, Programs and Personnel
- 5.0 Approval by Senior Officials
- 6.0 Statement of Authorities (unaudited)
- 7.0 Departmental budgetary expenditures by Standard Object (unaudited)
1.0 Introduction
This quarterly financial report for the period ending December 31, 2023 has been prepared by management as required by section 65.1 of the Financial Administration Act, in the form and manner prescribed by Treasury Board. The report should be read in conjunction with the Main Estimates.
This quarterly financial report has not been subject to an external audit or review. However, it has been reviewed by the Departmental Audit Committee prior to approval by the Deputy Minister.
Information on the mandate, roles, responsibilities and programs of Public Safety Canada can be found in the 2023-24 Departmental Plan and the 2023-24 Main Estimates.
1.1 Basis of Presentation
This quarterly report has been prepared using an expenditure basis of accounting. The accompanying Statement of Authorities table includes the Department’s spending authorities granted by Parliament, or received from Treasury Board Central Votes, and those used by the Department consistent with the Main Estimates for the 2023-24 fiscal year. This quarterly report has been prepared using a special purpose financial reporting framework designed to meet the information needs concerning the use of spending authorities.
The authority of Parliament is required before funds can be spent by the Government. Approvals are given in the form of annually approved limits through Appropriation Acts or through legislation in the form of statutory spending authority for specific purposes.
Public Safety Canada uses the full accrual method of accounting to prepare and present its annual departmental financial statements that are part of the departmental performance reporting process. However, the spending authorities voted by Parliament remain on an expenditure basis, as do the expenditures presented in this report.
2.0 Highlights of Fiscal Quarter and Fiscal Year-to-Date (YTD) Results
The following graph provides a comparison of the net budgetary authorities and expenditures as of December 31, 2023 and December 31, 2022 for the Department’s combined:
- Vote 1: Operating Expenditures;
- Vote 5: Grants and Contributions;
- Statutory Votes:
- Employee Benefit Plans; and
- Minister’s Salary and Car Allowance.
The net budgetary authorities are $546.3 million (16.5 percent) lower and expenditures to date are $736.0 million (56.8 percent) lower compared to the same period of previous year. These variances are primarily attributable to a decrease in funding for the Disaster Financial Assistance Arrangements (DFAA) program based on forecasts from provinces and territories, as well as a decrease in advanced payment requirements related to the DFAA based on the timing of disbursements.
Comparison of Budgetary Authorities, Year to Date Expenditures and Quarterly Expenditures as of December 31, 2022 and December 31, 2023 (in thousands of dollars)
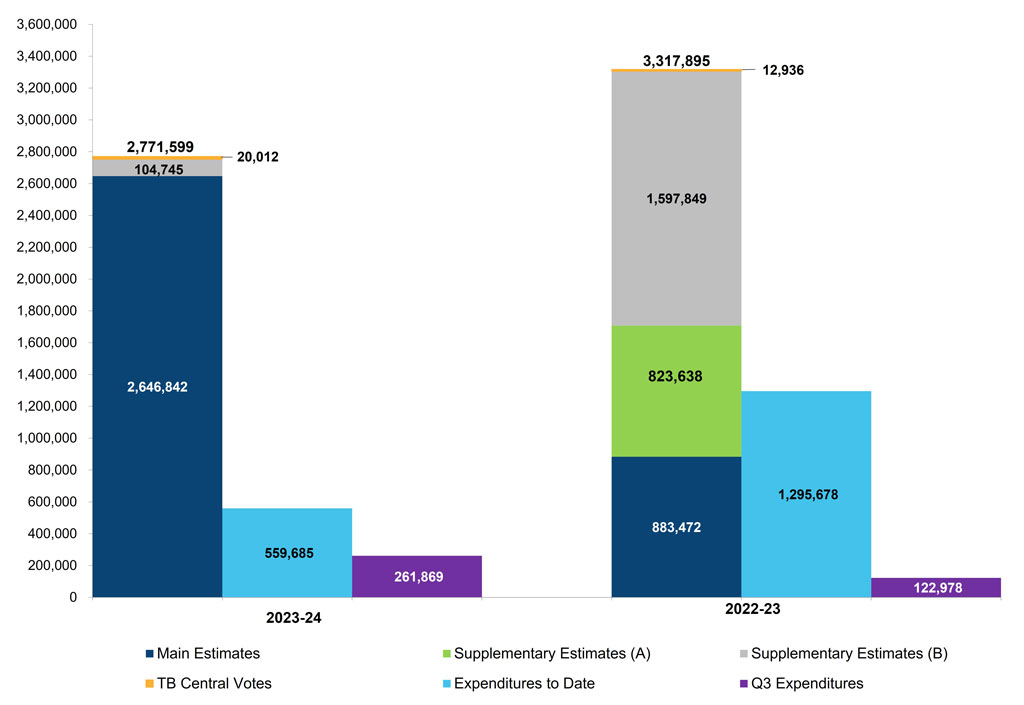
Image description
Starting from the left hand side, the “first” column in the graph indicates that the Department authorities are at $2,771.6 million for fiscal year 2023-24. The year-to-date expenditures of $559.7 million reported at the end of the third quarter of the 2023-24 fiscal year are shown under the “second” column. The expenditures of $261.9 million for the period ended December 31, 2023 (i.e. third quarter) are presented under the “third” column. The “fourth” column in the graph depicts the 2022-23 authorities which were at $3,317.9 million at the end of December 2022. The 2022-23 year-to-date expenditures of $1,295.7 million reported at the end of the third quarter of the 2022-23 fiscal year are shown under the “fifth” column. The Departments’ actual expenditures incurred in the third quarter of 2022-23 were $123.0 million and are shown under the “sixth” column of the graph.
2.1 Significant Changes to Authorities
For the period ending December 31, 2023, the authorities provided to the Department include Main Estimates, Supplementary Estimates (B) and TB Central Vote transfers. The 2022-23 authorities for the same period included the Main Estimates, Supplementary Estimates (A), Supplementary Estimates (B) and TB Central Vote transfers. The Statement of Authorities table presents a net decrease of $546.3 million (16.5 percent) compared to those of the same period of the previous year (from $3,317.9 million to $2,771.6 million).
Operating Expenditures authorities have decreased by $8.2M (3.2 percent) (from $254.5 million to $246.3 million), which is primarily attributable to:
- A decrease of $15.5 million in funding for the First Nations and Inuit Policing Program. The decrease reflects a return to the original reference level for this program, following the receipt of extraordinary one-time funding made available in 2022-23;
- A decrease of $15.4 million for the relocation and accommodations of the Government Operations Centre (Budget 2016) as a result of the progression of the project;
- A decrease of $4.1 million for the operating budget carry-forward, as a result of a smaller lapse in 2022-23;
- A decrease of $3.5 million in funding for Government advertising programs;
- A decrease of $2.9 million in funding to continue the support to advance Canada’s Flood Risk Plan;
- A decrease of $2.9 million in funding to support the design and development of the Firearms Buyback Program for prohibited assault style firearms; and
- A decrease of $1.8 million in funding for the Anti-Money Laundering Action, Coordination and Enforcement (ACE) Team.
These decreases are primarily offset by the following increases:
- An increase of $11.0 million in funding for compensation adjustments following signatures of new collective bargaining agreements;
- An increase of $9.2 million in new funding to enhance natural disaster resilience;
- An increase of $6.4 million in new funding for the Firearms Compensation Program Web Portal and Case Management System;
- An increase of $5.0 million in additional funding to improve the federal emergency management capacity;
- An increase of $2.3 million in new funding to build Canada’s Research Security Capacity; and
- An increase of $1.8 million for the renewal of the Indigenous Community Correctional Initiative to address the needs of vulnerable offenders in the federal correctional system.
Grants and Contributions (G&C) authorities have decreased by $540.2 million (17.8 percent) (from $3,043.0 million to $2,502.8 million), which is primarily attributable to:
- A net decrease of $698.7 million related to the Disaster Financial Assistance Arrangements (DFAA) program. This is mainly due to a decrease of $950.0 million in funding levels to support the 2021 natural disasters in British-Columbia offset by an increase of $251.3 million in new funding based on forecasts from provinces and territories for expected disbursements under the DFAA for 2023-24; and
- A decrease of $41.4 million for the Supporting a Humanitarian Workforce to Respond to COVID-19 and Other Large-Scale Emergencies contribution.
These decreases are primarily offset by the following increases:
- An increase of $70.8 million in funding level for First Nations and Inuit Policing Program;
- An increase of $55.5 million in additional funding for the Memorial Grant Program for First Responders;
- An increase of $30.8 million in funding for the renewal of the Initiative to Take Action Against Gun and Gang Violence;
- An increase of $11.8 million in additional funding for the First Nations and Inuit Policing Facilities;
- An increase of $11.4 million related to one year funding for safety and security-related expenses for the July 2022 Papal visit;
- An increase of $8.3 million in funding to match donations raised by the Canadian Red Cross in response to the 2021 British Columbia flood and wildfire events; and
- An increase of $5.2 million for the renewal of the Indigenous Community Correctional Initiative to address the needs of vulnerable offenders in the federal correctional system.
Budgetary Statutory authorities have increased by $2.1 million (10.3 percent) in 2023-24 primarily attributable to the Employee Benefits Plan associated with new salary funding received in Main Estimates.
2.2 Significant Variances from Previous Year Expenditures
Year-to-Date Expenditures
For the period ending December 31, 2023, the Departmental Budgetary Expenditures by Standard Object table presents a net decrease of $736.0 million (56.8 percent) in Public Safety’s year-to-date (YTD) expenditures compared to the previous year (from $1,295.7 million to $559.7 million). This decrease is primarily attributable to:
- A decrease of $752.9 million due to a decrease in advanced payment requirements related to natural disasters for the Disaster Financial Assistance Arrangements (DFAA) program. The program is currently projecting a significant surplus as a result of forecasts from provinces and territories. The surplus is expected to be reprofiled into future years;
- A decrease of $29.8 million in support of payments for the Initiative to Take Action Against Gun and Gang Violence; and
- A decrease of $16.5 million in support of payments for the Humanitarian Workforce to respond to COVID-19 and Other Large-Scale Emergencies.
These decreases are primarily offset by the following increases:
- An increase of $32.7 million for personnel expenditures primarily attributable to new collective agreements and an increase in staffing requirements to support advancement of the department’s agenda;
- An increase of $11.8 million in support of payments for the Building Safer Communities Fund; and
- An increase of $7.9 million in support of payments for the Memorial Grant Program for First Responders.
Third Quarter Expenditures
Compared to the previous year, expenditures used during the quarter ended December 31, 2023 have increased by $138.9 million (112.9 percent) (from $123.0 million to $261.9 million) as reflected in the Departmental Budgetary Expenditures by Standard Object table.
- Operating expenditures have increased by $12.7 million (23.4 percent) primarily attributable to:
- Personnel expenditures have increased by $17.2 million, primarily due to new collective agreements and an increase in staffing requirements to support advancement of the department’s agenda;
- Offset by Other operating expenditures have decrease by $4.5 million, primarily due to a decrease in spending for the Government Operations Centre (GOC) repairs and maintenance.
- Transfer payments expenditures have increased by $126.7 million (183.7 percent) primarily attributable to:
- An increase of $96.0 million due to the timing of payments for the Disaster Financial Assistance Arrangements (DFAA) program. The program is currently projecting a significant surplus as a result of forecasts from provinces and territories. The surplus is expected to be reprofiled into future years;
- An increase of $14.9 million mainly due to the timing of payments for the Memorial Grant Program for First Responders;
- An increase of $6.9 million due to the timing of payments for the Biology Casework Analysis Contribution Program;
- An increase of $6.8 million due to the timing of payments for the Humanitarian Workforce to Respond to COVID-19 and Other Large-Scale Emergencies;
- An increase of $3.3 million due to timing of payments for the Initiative to Take Action Against Gun and Gang Violence; and
- An increase of $3.3 million in support of payments for the Building Safer Communities fund.
Primarily offset by the following decrease:
- A decrease of $4.2 million due to the timing of payments for First Nations and Inuit Policing Facilities program.
3.0 Risks and Uncertainty
Disaster Financial Assistance Arrangements
The Disaster Financial Assistance Arrangements (DFAA) contribution program presents a greater level of uncertainty than other PS grants and contributions programs given that it represents a significant portion of the PS budget and that it is subject to unforeseen events. The DFAA contribution program was established in 1970 to provide a consistent and equitable mechanism for federal sharing of provincial and territorial costs for natural disaster response and recovery where such costs would place an undue burden on a provincial or territorial economy.
There are currently 72 active natural disasters for which Orders in Council (OiC) have been approved, authorizing the provision of federal financial assistance under the DFAA, and for which final payments have not yet been made. Public Safety’s total outstanding share of liability under the DFAA with regards to these 72 events is $4.93 billion, the majority of which is expected to be paid out over the next five years.
DFAA liability has slightly increased by $0.11 billion from $4.82 billion in the second quarter of 2023-24 to $4.93 billion in the third quarter. Variations in the DFAA liability are mainly attributable to:
- Changes for newly approved OiCs, which authorize funding related to recent natural disasters for which provinces and territories require federal sharing of costs;
- Changes in the estimates of the existing natural disasters; and
- Changes for payments issued under the existing obligation.
The following are the most significant events within Public Safety Canada’s DFAA liability:
- British Columbia 2021 November Storm ($1.4 billion);
- British Columbia 2021 Flood & Landslides ($581 million);
- Alberta 2013 June Flood ($410 million);
- British Columbia 2020 Flood & Landslides ($410 million);
- Manitoba 2022 Spring Flood ($212 million); and
- Quebec 2019 Spring Flood ($163 million).
Updates to the DFAA liability as a result of changes to the estimates of the existing natural disasters, are completed and approved twice a year with the last update having been conducted in Fall 2023-24 and is reflected in the current Quarterly Financial Report.
Financial impacts of the unprecedented wildfires in several Canadian provinces in 2023 are significant and are presently being estimated. Consequently, they are not reflected in this report.
4.0 Significant Changes in Relation to Operations, Programs and Personnel
There are no significant changes affecting relation to operations, programs and personnel during the third quarter of the 2023-24 fiscal year.
5.0 Approval by Senior Officials
Approved as required by the Policy on Financial Resource Management, Information and Reporting:
Shawn Tupper
Deputy Minister
Public Safety Canada
Ottawa (Canada)
Date: February 22, 2024
Patrick Amyot, CPA
Chief Financial Officer
Public Safety Canada
Ottawa (Canada)
Date: February 19, 2024
6.0 Statement of Authorities (unaudited)
| Total available for use for the year ending March 31, 2024Footnote 1 | Used during the quarter ended December 31, 2023 | Year to date used at quarter-end | |
|---|---|---|---|
| Vote 1 - Net Operating Expenditures | 246,344,309 | 61,094,131 | 165,605,263 |
| Vote 5 - Grants and Contributions | 2,502,775,847 | 195,641,668 | 378,625,619 |
| Employee Benefit Plans (EBP) | 22,384,523 | 5,111,028 | 15,384,514 |
| Minister's Salary and Motor Car Allowance | 94,700 | 22,426 | 69,826 |
| Total Authorities | 2,771,599,379 | 261,869,253 | 559,685,222 |
| Total available for use for the year ended March 31, 2023Footnote 2 | Used during the quarter ended December 31, 2022 | Year to date used at quarter-end | |
|---|---|---|---|
| Vote 1 - Net Operating Expenditures | 254,501,811 | 49,356,549 | 136,368,648 |
| Vote 5 - Grants and Contributions | 3,042,962,697 | 68,972,806 | 1,145,362,637 |
| Employee Benefit Plans (EBP) | 20,338,477 | 4,625,823 | 13,877,469 |
| Minister's Salary and Motor Car Allowance | 92,500 | 23,100 | 69,300 |
| Total Authorities | 3,317,895,485 | 122,978,278 | 1,295,678,054 |
7.0 Departmental budgetary expenditures by Standard Object (unaudited)
| Planned expenditures for the year ending March 31, 2024Footnote 3 | Expended during the quarter ended December 31, 2023 | Year to date used at quarter-end | |
|---|---|---|---|
| Expenditures: | |||
| PersonnelFootnote 4 | 179,835,285 | 56,790,427 | 151,047,885 |
| Transportation and communications | 2,719,832 | 1,016,975 | 2,382,599 |
| Information | 11,195,414 | 1,112,987 | 2,332,510 |
| Professional and special services | 37,007,007 | 5,464,086 | 17,312,391 |
| Rentals | 9,964,825 | 1,331,268 | 3,167,857 |
| Repair and maintenanceFootnote 5 | 2,043,575 | 1,014,847 | 4,492,233 |
| Utilities, material and supplies | 823,535 | 78,129 | 224,749 |
| Acquisition of land, buildings and works | 18,921,668 | - | - |
| Acquisition of machinery and equipment | 5,541,698 | 252,186 | 1,324,473 |
| Transfer payments | 2,502,775,847 | 195,641,668 | 378,625,619 |
| Public debt charges | - | - | - |
| Other subsidies and payments | 3,470,693 | 7,484 | 1,563,958 |
| Total gross budgetary expenditures | 2,774,299,379 | 262,710,057 | 562,474,274 |
| Less Revenues netted against expenditures: | |||
| Interdepartmental Provision of Internal Support Services | 2,700,000 | 840,804 | 2,789,052 |
| Total net budgetary expenditures | 2,771,599,379 | 261,869,253 | 559,685,222 |
| Planned expenditures for the year ending March 31, 2023Footnote 6 | Expended during the quarter ended December 31, 2022 | Year to date used at quarter-end | |
|---|---|---|---|
| Expenditures: | |||
| Personnel | 155,809,600 | 39,590,942 | 118,357,740 |
| Transportation and communications | 3,912,955 | 881,704 | 1,536,935 |
| Information | 12,600,280 | 784,544 | 2,680,810 |
| Professional and special services | 31,872,468 | 4,880,065 | 15,219,176 |
| Rentals | 8,243,206 | 414,402 | 2,747,409 |
| Repair and maintenanceFootnote 7 | 2,652,511 | 6,014,425 | 9,489,372 |
| Utilities, material and supplies | 748,570 | 102,951 | 202,909 |
| Acquisition of land, buildings and works | 37,976,747 | - | - |
| Acquisition of machinery and equipment | 5,847,773 | 1,524,211 | 1,929,764 |
| Transfer payments | 3,042,962,697 | 68,972,806 | 1,145,362,637 |
| Public debt charges | - | - | - |
| Other subsidies and payments | 17,968,678 | 155,632 | 478,768 |
| Total gross budgetary expenditures | 3,320,595,485 | 123,321,682 | 1,298,005,520 |
| Less Revenues netted against expenditures: | |||
| Interdepartmental Provision of Internal Support Services | 2,700,000 | 343,404 | 2,327,466 |
| Total net budgetary expenditures | 3,317,895,485 | 122,978,278 | 1,295,678,054 |
- Date modified: