Public Safety Canada's 2025 to 2026 Departmental Results Report
Note: Public Safety Canada used its generative AI tool (CoPilot) to support the development of content in this report. A human has reviewed and validated all AI-generated content.
At a glance
This Departmental Results Report details Public Safety Canada's actual accomplishments against the plans, priorities and expected results outlined in its 2025 to 2026 Departmental Plan. These results align with the priorities outlined in the May 21, 2025, mandate letter from the Prime Minister, as well as with Public Safety Canada's vision, mission, raison d'être and operating context.
Key priorities
Public Safety Canada identified the following key priorities for 2025 to 2026:
- continue joint efforts with the United States and domestic partners to ensure border security and integrity;
- compensate business and individual firearm owners for the permanent deactivation or destruction of their eligible assault-style firearms;
- improve awareness, understanding, and the ability of the Government of Canada to detect and respond to threats posed by foreign interference; and,
- advance initiatives focused on prevention and mitigation of emergencies in collaboration with federal, provincial, territorial, and municipal partners and other stakeholders.
Highlights
In 2025 to 2026, the total actual spending (including internal services) for Public Safety Canada was $1,365,876,813 and total full-time equivalent staff (including internal services) was 1,835.
For complete information on Public Safety Canada's total spending and human resources, read the Spending and human resources section of the full report.
Summary of results
The following provides a summary of the results the department achieved in 2025 to 2026 under its main areas of activity, called "core responsibilities."
Core responsibility 1: National Security
Actual spending: $39,183,031
Actual full-time equivalent staff: 229
Threats to Canada's sovereignty have increased in recent years, and the national security landscape continues to evolve at a rapid pace, affecting our political system, economy and communities. In 2025 to 2026, the Department advanced a number of commitments to ensure that security threats are understood and reduced while maintaining public trust, such as:
- Advanced efforts to counter foreign interference (FI) by increasing public awareness and engagement through the delivery of workshops, briefings and an improved web presence. Over 140 individuals from vulnerable communities, academia and civil society were engaged in discussions and workshops delivered by the Office of the National Counter Foreign Interference Coordinator (ONCFIC) to help the public build resilience to the threat.
- Strengthened relationships with international partners to enhance cooperation on countering FI. During Canada's G7 presidency, the department led key initiatives on transnational repression (TNR), including hosting a multistakeholder G7 Dialogue on TNR, developing both the G7 TNR Resilience and Response Framework and the publicly accessible G7 Compendium of Tools to Counter TNR, and leading the G7 Tabletop Exercise on TNR to validate the Framework, identify best practices, and shape common responses.
- Achieved key milestones towards the operationalization of the Foreign Influence Transparency and Accountability Act (2024), including securing Parliament's support to appoint Anton Boegman to the Foreign Influence Transparency Commissioner position and publishing proposed regulations in the Canada Gazette, Part I for public consultation.
- Undertook a number of legislative and engagement activities to address the evolving terrorism threat landscape. This included reviewing and updating the entities currently listed under the Secure Air Travel Act, and contributing to the National Security and Intelligence Review Agency's work on the Passenger Protect Program.
- Organized the 4th Transnational Racially or Ethnically Motivated Violent Extremism Intelligence and Strategy Conference (TRISC), which brought together intelligence, law enforcement, programs, and policy officials to improve and sustain cooperation to counter the rise of ideologically motivated violent extremism.
- Advanced efforts to address economic-based threats to national security, including the establishment of a national security triage process and collaboration with provincial and territorial partners to enhance collective responses to these complex threats.
- Implemented key initiatives to enhance Canada's cyber resilience, such as launching the modernized Cyber Security Cooperation Program (CSCP) and continued to work towards the establishment of the Canadian Cyber Defence Collective (CCDC).
More information about National Security can be found in the "Results – what we achieved" section of the full Departmental Results Report.
Core responsibility 2: Community Safety
Actual spending: $820,793,419
Actual full-time equivalent staff: 583
In 2025 to 2026, the Department advanced a number of commitments to ensure that Canadian communities are safe, community safety practices are strengthened, and crime is prevented and addressed in populations and communities most at risk, such as:
- Completed the launch of the pilot and subsequent national deployment of the Assault-Style Firearms Compensation Program (ASFCP) for individuals, with over 68,000 assault-style firearms declared by over 38,000 firearms owners across the country.
- Led the coordination of Canada's $1.3 billion Border Plan, which included investments in equipment and technology for border and law enforcement agencies to tackle the flow of illegal fentanyl, other illicit drugs, and precursor chemicals; to deter organized crime and illegal migration; and increase information sharing and operational coordination with partners.
- Strengthened relations with Mexico through senior-level engagement, such as a meeting in December 2025 between the Minister of Public Safety and Mexico's Secretary of Security and Citizen Protection and launch of a new bilateral security dialogue.
- Deepened international cooperation and engagement with key partners, including the U.S., Mexico, Europe, and G7 and Five Eyes members through multiple fora, including the Five Country Ministerial and the G7 Interior Ministers' Meeting (IMM) hosted by the Minister of Public Safety. The G7 IMM resulted in the publication of a Communique which was underpinned by a Call to Action on Migrant Smuggling and a Joint Statement on Securing Maritime Ports Against Drug and Precursor Chemical Trafficking.
- Engaged with G7 partners on the continued implementation of the G7 Action Plan to Prevent and Counter the Smuggling of Migrants. As part of this initiative, in November 2025, the G7 Interior and Security Ministers, led by Canada, issued a Call To Action For Collaboration To Prevent and Counter the Exploitation of Social Media For Migrant Smuggling. In December 2025, the Department endorsed the Joint Declaration of the European Union's Global Alliance to Counter Migrant Smuggling (PDF). These initiatives advanced Canada's contribution to global efforts against transnational organized crime.
- Hosted the Governments of Mexico and the United States in Ottawa for the Ninth Meeting of the North American Drug Dialogue (NADD) to collaborate on strategies to counter the public safety and health threats posed by illegal drug use and trafficking in North America.
- Engaged with and provided funding to local police of jurisdictions most impacted by vehicle theft, per actions outlined in the National Action Plan on Combatting Auto Theft. Funding was also provided to the International Criminal Police Organization (INTERPOL) project to facilitate cross-border information sharing to recover stolen vehicles.
- Continued engagement with provinces and territories on the future of the Royal Canadian Mounted Police Contract Policing Program in advance of the 2032 Police Service Agreements renegotiations.
- Published the National Commitments to Combat Antisemitism. These commitments, announced at the March 2025 National Forum to address the rising threat of antisemitism across the country, highlight actions undertaken by stakeholders across the country to address the Public Safety Canada threat of antisemitism.
- Continued to advance the National Strategy for the Protection of Children from Sexual Exploitation on the Internet. These efforts included the Online Dangers Roadshow, which took place in English schools across the greater Vancouver Area and in French schools across Ottawa. The roadshow engaged over 3,900 students, helping them understand the warning signs of online child sexual exploitation and the resources available to them.
- Engaged provinces, territories, the Royal Canadian Mounted Police (RCMP) and Indigenous partners on efforts to modernize the First Nations and Inuit Policing Program (FNIPP) and to strengthen policing and community safety in First Nations and Inuit communities.
More information about Community Safety can be found in the "Results – what we achieved" section of the full Departmental Results Report.
Core responsibility 3: Emergency Management
Actual spending: $414,936,999
Actual full-time equivalent staff: 431
Public Safety Canada helps Canadians and their communities protect themselves from emergencies and disasters related to all kinds of hazards – natural, human-induced and technological. In 2025 to 2026, the Department advanced a number of commitments to ensure that Canadians are well-equipped to mitigate, prepare for, respond to and recover from all-hazards events, such as:
- Completed the scoping and creation of the National Flood Risk Awareness Portal (i.e., officially known as the Canada's Flood Risk Finder).
- Prepared for and delivered Exercise Cobalt Magnet and Vital Archer 2025, exercises that focus on a joint Canada-U.S. nuclear emergency and counterterrorism response.
- Developed and implemented, via the Government Operations Centre, a Consequences Management Plan for FIFA World Cup 2026 readiness. This plan articulated how Public Safety Canada's regular emergency management mechanisms would be deployed in the FIFA World Cup context.
- Through the Canadian Centre for Recovery and Resilience, delivered workshops, training, custom tools and tailored support to communities on recovery and resilience planning. The Centre also completed a pilot training program with a cohort of 20 communities working to develop pre-disaster recovery plans.
- Launched the modernized Disaster Financial Assistance Arrangements (DFAA) program on April 1, 2025, meeting one of Public Safety Canada's primary targets under the National Adaptation Strategy. The modernized DFAA shifts the focus of federal funding support to provinces and territories from restoring pre-disaster conditions to incentivizing risk reduction, resilience, and improved outcomes for people and communities.
- Coordinated a national response to Canada's second worst wildfire season on record by enabling full federal coordination throughout the summer months, allowing for deployment of firefighters, logistical assistance, and transportation in partnership with the Canadian Armed Forces and Canadian Coast Guard.
More information about Emergency Management can be found in the "Results – what we achieved" section of the full Departmental Results Report.
From the Ministers
Over the past year, Public Safety Canada has continued to strengthen Canada's safety, security, and resilience in an increasingly complex risk environment. The following Departmental Results Report for the 2025 to 2026 fiscal year demonstrates that work for all Canadians.
We have advanced important national security priorities, by improving Canada's ability to counter foreign interference, violent extremism, terrorism, and cyber threats. In 2025 to 2026, that included securing Parliament's support to appoint Anton Boegman as the Foreign Influence Transparency Commissioner, and the listing of five new terrorist entities. It also included significant engagement with G7 partners, including hosting the G7 Interior and Security Ministers' Meeting in November 2025, the delivery of dozens of workshops on countering transnational repression and research security, and the successful new iteration of the Cyber Security Cooperation Program (CSCP) launched in Summer 2025. We also established the Canadian Cyber Defence Collective (CCDC), which brings together public and private sector partners to collaborate on national cyber security challenges. Furthermore, Public Safety Canada co-chaired the international Counter Ransomware Initiative's (CRI) Public-Private Advisory Panel, which supports policy development and best practices to increase ransomware resilience internationally and domestically. Through enhanced partnerships with international allies, strengthened research security measures, investments in cyber resilience, and new approaches to protecting critical infrastructure, we are helping safeguard Canada's people, institutions, and economy.
We have also made meaningful progress in supporting safer communities across the country. That included significant advancements in the implementation of the Assault-Style Firearms Compensation Program, which is removing dangerous, assault-style firearms from Canadian communities. On the legislative front, Bill C-12, the Strengthening Canada's Immigration System and Borders Act, officially became law following Royal Assent in March 2026, and Bill C-22, the Lawful Access Act, was introduced in March 2026 to modernize legal authorities used by police and CSIS to obtain information and to ensure select electronic service providers have the technical capabilities to respond to lawful requests. This year saw the Department leading the coordination of Canada's $1.3 billion Border Plan and Ministerial participation at the Five Country Ministerial, resulting in a number of shared safety and security commitments, including tackling the global production and flow of illegal drugs and precursor chemicals by transnational crime groups, and strengthening coordinated international efforts to prevent and combat child sexual exploitation and abuse.
In 2025 to 2026, the Department also announced millions in funding for safer communities across the country. Through investments in crime prevention, community safety programming, and firearms-related initiatives, Public Safety Canada supported local organizations in addressing the root causes of crime and violence, strengthening community capacity, and improving support for at-risk populations. We also advanced efforts to combat online child sexual exploitation, gun violence, and organized crime, helping reduce risks to individuals and families. Together, these actions led to a decline of 5% in the crime severity index in 2025. Rates of homicide fell 16%, marking the largest year-over-year decline since 1986 and the lowest homicide rate since 2014. Incidents of child sexual abuse and exploitation material also declined 21%. Following several years of significant growth, both police-reported extortion and hate crimes have begun to decline nationally, decreasing 9% and 3% respectively in 2025. Enhanced collaboration among law enforcement partners, targeted border enforcement activities, and international information-sharing also contributed to an 18 percent decline in 2025.
At the same time, we continued to strengthen Canada's emergency management capacity. Key achievements included advancing the renewal of Canada's Emergency Management Strategy, modernizing disaster assistance programs to better support resilience and risk reduction, renewing public alerting, improving flood risk awareness, and enhancing readiness for major emergencies through planning, training, and exercises. Over the past year, the Government launched the modernized Disaster Financial Assistance Arrangements program, meeting one of Public Safety Canada's primary targets under the National Adaptation Strategy. In 2026, the Government Operations Centre (GOC) developed and implemented a Management Plan for FIFA World Cup 2026 readiness. The Department also welcomed the opening of the new GOC facility in January 2026, while helping to coordinate a whole-of-government response to one of Canada's most challenging wildfire seasons, supporting affected communities and evacuees across the country.
These achievements reflect the strength of collaboration among governments, Indigenous partners, communities, first responders, the private sector, and international allies. We encourage all Canadians to read this report and explore how, together, we are building a safer, more secure, and more resilient Canada for all Canadians.

The Honourable Gary Anandasangaree, P.C., K.C., M.P.
Minister of Public Safety

The Honourable Eleanor Olszewski, P.C., K.C., M.P.
Minister of Emergency Management and Community Resilience and Minister responsible for Prairies Economic Development Canada
Results – what we achieved
Core responsibilities and internal services
- Core responsibility 1: National Security
- Core responsibility 2: Community Safety
- Core responsibility 3: Emergency Management
- Internal services
Core responsibility 1: National Security
In this section
- Description
- Quality of life impacts
- Progress on results
- Details on results
- Key risks
- Resources required to achieve results
- Related government priorities
- Program inventory
Description
Public Safety Canada develops policy, legislation and programs to support Canada's capacity to respond to a range of national security threats directed against Canadians, our critical infrastructure and our cyber systems while advancing national counter terrorism efforts.
Quality of life impacts
This core responsibility contributes to the "Good Governance" domain of the Quality of Life Framework for Canada related to "personal safety", "perceptions of neighbourhood safety", "confidence in institutions," and "misinformation/trust in media" through all of the activities mentioned in the core responsibility description.
Progress on results
This section presents details on how the department performed to achieve results and meet targets for Core responsibility 1: National Security.
Table 1 provides a summary of the target and actual results for each indicator associated with the results under National Security in the last three fiscal years.
| Departmental Result Indicator | Target | Date to achieve target | Actual Result |
|---|---|---|---|
| Canada's ranking on the Global Terrorism Index (GTI) | ≥ 82 | March 31, 2026 | 2023 to 2024: 52Footnote 1 2024 to 2025: 48Footnote 2 2025 to 2026: 53Footnote 3 |
| Percentage of the population who thinks that the Government of Canada respects individual rights and freedoms while ensuring the safety of Canadians | ≥ 70% | March 31, 2026 | 2023 to 2024: 40%Footnote 4 2024 to 2025: 54%Footnote 5 2025 to 2026: N/AFootnote 6 |
| Percentage of the population who thinks that the right mechanisms are in place to identify national security threats in Canada | ≥ 60% | March 31, 2026 | 2023 to 2024: 57%Footnote 7 2024 to 2025: 73%Footnote 8 2025 to 2026: N/AFootnote 9 |
| Percentage of the population who thinks that the right mechanisms are in place to respond to national security threats in Canada | ≥ 60% | March 31, 2026 | 2023 to 2024: 57%Footnote 10 2024 to 2025: 67%Footnote 11 2025 to 2026: N/AFootnote 12 |
| Percentage of partners who indicate that Public Safety Canada provided effective policy leadership and operational coordination on national security issues | ≥ 75% | March 31, 2026 | 2023 to 2024: 55%Footnote 13 2024 to 2025: N/AFootnote 14 2025 to 2026: N/AFootnote 15 |
| Critical Infrastructure Resilience Score | ≥ 34.2 | March 31, 2026 | 2023 to 2024: 34.51 2024 to 2025: N/AFootnote 16 2025 to 2026: N/AFootnote 17 |
| Percentage of partners who indicate that Public Safety Canada provides effective leadership in advancing Canada's cyber security interests | ≥ 80% | March 31, 2026 | 2023 to 2024: 75%Footnote 18 2024 to 2025: 71%Footnote 19 2025 to 2026: 81% |
| Canada's ranking in the National Cyber Security IndexFootnote 20 | ≥ Ranked 30thFootnote 21 | March 31, 2026 | 2023 to 2024: 33 2024 to 2025: 4 2025 to 2026: 2 |
The Results section of the Infographic for Public Safety Canada on GC InfoBase provides additional information on results and performance related to the Program Inventory.
Details on results
The following section describes the results for National Security in 2025 to 2026 compared with the planned results set out in Public Safety Canada's Departmental Plan for the year.
Departmental Result: National security threats are understood and reduced while maintaining public trust
Results achieved
Public Safety Canada advanced the following initiatives in support of its National Security Departmental Result:
Foreign Interference
- Engaged, via the Office of the National Counter Foreign Interference Coordinator (ONCFIC), more than 140 individuals from 22 vulnerable communities across 14 cities through 17 "countering transnational repression" workshops and virtual sessions, equipping individuals with knowledge of FI, how to report it, and how to protect themselves, resulting in increased public awareness and resiliency and reinforcing the communities' ability to detect and respond to FI. Engagements spanned civil society organizations, human rights defenders, post-secondary institutions, local police, and local governments.
- Completed a strategic refresh of the ONCFIC's public website updating content, expanding publicly accessible FI resources, simplifying language, and enhancing usability to ensure information is clear, accessible, and valuable to users.
- Provided strategic input, guidance and reporting to senior-level national security committees and federal partners, enabling effective whole-of-government coordination.
- Delivered 59 Safeguarding Science workshops via the Research Security Centre (RSC), focused on risks associated with sensitive research and practical mitigation measures to protect Canadian research and intellectual property. These workshops reached 2,907 participants, including frontline researchers, federal scientists, and university administrators. Post-session surveys indicated an approximately 80% satisfaction rate for building awareness, with some federal science departments making Safeguarding Science workshops mandatory for their internal research security training, demonstrating effective knowledge translation and value for these departments.
- Organized a series of informal sessions via the RSC, in partnership with other Government of Canada partners such as Global Affairs Canada and the Department of National Defence to share updates with the academic community on key federal programs covering export controls, sanctions, geopolitical relationships and defence initiatives, resulting in universities using the information to inform researchers, strengthen institutional policies, and integrate research security practices into their defence-related initiatives. The impact was demonstrated by some universities developing internal procedures and guidance documents based on these sessions and Safeguarding Science workshops, and seeking expert advice when preparing mitigation plans.
- Coordinated national security reviews via the National Security Guidelines for Research Partnerships process for 36 federal research grant applications, identifying 16 with mitigable risks and 4 applications that involved non-mitigable risks. Recommendations for mitigation measures (e.g., additional training, partnership adjustments, supplier changes), resulted in integration of national security considerations into grant decision-making.
Counter Terrorism and Violent Extremism
- Addressed the evolving terrorist threat landscape via Bill C-22, the Lawful Access Act, introduced in March 2026, updates law enforcement and CSIS authorities to access information and to ensure select electronic service providers have the technical capabilities to respond to lawful requests.
- Conducted a statutory review of and updated the Criminal Code's currently listed entities under the legislated timeline. In total, the Department reviewed 30 entities, of which 28 were maintained on the list. In addition, Public Safety Canada listed five new entities under the Criminal Code, including ideologically motivated violent extremist groups, religiously motivated violent extremist groups, and a transnational organized crime group. Two entities were removed from the list of entities, as they ceased to exist or they ceased to conduct terrorist activities. These decisions ensured the listings were current, ensured efficacy of the List, and ensured the listings align with current terrorism trends.
- Undertook legislative and engagement activities, including drafting a Counter-Terrorism Action Plan (i.e., a consolidated list of policy, legislative, and engagement activities to counter terrorism and violent extremism in Canada over the long term), managing and contributing to the National Security and Intelligence Review Agency's work on the Passenger Protect Program, and organizing the 4th Transnational Racially or Ethnically Motivated Violent Extremism Intelligence and Security Conference (TRISC) with Five Eyes, G7, Belgium, Denmark, Finland, France, Netherlands, Norway, Spain, Sweden, the European Union, and Poland. This resulted in an evergreen TRISC policy compendium, which identified similarities and gaps in policy approaches, as well as opportunities for alignment to counter the ideologically motivated violent extremism (IMVE) threat, and renewed international cooperation and dialogue on IMVE, with Belgium committing to host the next TRISC in early 2027.
- Supported the G7 Roma-Lyon Group by providing strategic policy advice and key messages to the Canadian and Heads of Delegation, enabling cooperation with G7 counterparts on countering transnational organized crime and terrorism.
- Chaired the G7 Counter-Terrorism Practitioners Sub-Group (CTPSG) and led Canada's participation with Public Safety Canada Portfolio partners, resulting in advancing best practices, strategies, and collaboration on countering youth violent extremism and violent extremist threat actors' use of artificial intelligence and 3D printing. These efforts will continue under the new 2026 Chair.
- Reviewed and proposed amendments to the Secure Air Travel Act as part of the Department's 2025 red tape reduction initiative to authorize the use of digital identity verification methods, including biometrics, as acceptable means of identity verification prior to boarding an aircraft.
- Received 15 applications under the Authorization regime and humanitarian exception for activities in terrorist group controlled areas to date, including 12 in 2024 and 3 in 2025, plus one request for an authorization renewal. In the 2025 calendar year, 8 authorizations were granted, in addition to one renewal. Overall, 5 applications were withdrawn and 2 are currently being reviewed. No applications were refused. Authorizations issued to date amount to a value of $246,500,000 in international assistance. The proposed activities fell primarily under health and education services, in the geographic areas of Afghanistan, Gaza, and Syria.
- Tabled the 2025 Annual Report on the Authorization Regime in April 2026, in line with statutory requirements.
- Worked with regime partners to improve efficiency so necessary international assistance can occur more quickly, administrative burden was reduced, and oversight activities continued to ensure that terrorist financing risk was mitigated appropriately. The Department conducted targeted outreach sessions with not-for-profit organizations, financial sector representatives, charities, and other key stakeholders, to raise awareness about the regime, seek input for improvement, and share information on Anti-Money Laundering and Anti-Terrorist Financing (AML/ATF) risk and compliance measures. Also, contributed, alongside other partnering departments and agencies, to the Financial Action Task Force (FATF) Mutual Evaluation of Canada—a peer review of its anti–money laundering and counter-terrorist financing framework.
Countering economic-based threats to national security
- Advanced efforts to address economic-based threats to national security through sustained assessment and policy development with respect to the Government of Canada's economic security toolkit (foreign investment screening, export controls, procurement security, etc.), resulting in advice to senior leadership to inform future policy initiatives.
- Completed 29 preliminary national security triage checks for major projects under the Building Canada Act and maintained leadership in national security risk assessments associated with foreign investments under the Investment Canada Act, resulting in strengthened protections against foreign influence and economic espionage risks. Relatedly, continued to lead the coordination of national security reviews under the Investment Canada Act in support of Innovation, Science and Economic Development's (ISED) mandate. These reviews enable foreign investment that is of net benefit to Canada in a way that manages potential national and economic security concerns.
- Collaborated with provinces and territories on economic-based threats to national security, such as potential predatory investments in the Arctic, resulting in improved stakeholder awareness of national security considerations. Public Safety Canada also coordinated with federal entities and international partners, resulting in enhanced collective responses and international alignment on measures to protect against sensitive technology acquisition by potential hostile state actors.
Cyber Security and Critical Infrastructure
- Launched a new iteration of the Cyber Security Cooperation Program (CSCP) in Summer 2025. A call for proposals resulted in 570 unique project applications, of which 18 proposals were successful in receiving funding within the available program funding package (i.e., $10.3 million in funding over 5 years). These funded projects, once in place, will help address cyber security issues related to critical infrastructure protection, education and workforce development, threat information sharing, and inclusivity and accessibility.
- Implemented the Cyber Diplomacy and Security Initiative under Canada's Indo-Pacific Strategy in conjunction with other government departments. Public Safety Canada conducted engagements with 10 countries and was invited to participate in 6 regional events this year, in addition to regular bilateral meetings with regional partners. Through these engagements, the Department played a critical role in sharing expertise in domestic cyber policy making, including national strategy development, incident response, legislation, regulation and governance, in line with requests and needs of partner countries.
- Engaged regularly with Government of Canada departments and agencies, the private sector, and other countries through presentations, consultations, and the development and participation in exercises, including to socialize the Federal Cyber Incident Response Plan (FCIRP). This included participation in Locked Shields 2025, Allied Power Exercise 2025, and Cyber Coalition 2025, and enhanced participants' understanding and cooperation within these contexts.
- Advanced foundational work to establish the Canadian Cyber Defence Collective under Canada's National Cyber Security Strategy, including developing the Terms of Reference, engaging and inviting members, and organizing the inaugural meeting.
- Strengthened Canada-Ukraine cooperation on critical infrastructure protection through the implementation of a bilateral Memorandum of Understanding (MOU), advancing practical collaboration and knowledge exchange on resilience, risk assessment, and critical infrastructure security.
- Co-led the Counter Ransomware Initiative (CRI) Public-Private Sector Advisory Panel, and onboarded new members to increase global representation among cutting-edge private sector and non-profit partners. In its leadership role on the CRI's Advisory Panel, the Department contributed to key 2025 CRI Summit deliverables, including a tabletop exercise with BlackBerry and the Institute for Security and Technology (IST), a ransomware threat report, and guidance on supply chain resilience. These activities addressed evolving ransomware threats and differing levels of stakeholder maturity in information sharing and incident response. The projects helped to identify gaps in coordination across jurisdictions, enhancing stakeholder awareness and strengthening partners' ability to detect, prevent, and respond to ransomware incidents. Lessons learned informed the department's domestic ransomware initiatives by reinforcing alignment with CRI best practices in information sharing and coordinated response, improving whole-of-government readiness and collaboration with private-sector partners.
- Began work with Australia to create the CRI's new Global Standards Framework (still in development at the end of 2025 to 2026). The Framework aims to set out a shared baseline for countering ransomware across diverse levels of cyber maturity, which will drive collective uplift, strengthen global resilience, and translate international cooperation into collective action.
- Engaged the critical infrastructure lead federal departments' community to develop and adopt a standardized process to identify and rank Canada's most important infrastructure. This groundwork is expected to support more coordinated protection and response efforts in future years.
Key risks
Effective coordination, partner engagement, and the management of evolving security demands are critical to Public Safety Canada's efforts to support Canada's national security priorities. Accordingly, the Department undertook actions to manage operational pressures and support timely, evidence-based decision-making. Specifically, the Department:
- Strengthened engagement with partners and stakeholders by building relationships with civil society and provincial partners, mitigating early challenges in stakeholder identification and access and enabling more effective engagement throughout the year.
- Aligned operational efforts with evolving priorities to manage increasing case complexity and competing resource demands, including developing policy advice validated by senior leadership to maintain progress on key files.
- Reallocated resources and advanced internal restructuring efforts to address human resource constraints and competing demands for specialized expertise, supporting continued operational effectiveness.
- Adjusted consultation and data collection approaches for key analytical products, including the Canadian Survey of Cyber Security and Cybercrime (CSCSC), to better manage high volumes of input and improve future data integration.
- Maintained a coordinated and flexible approach to international engagement, including for the Five Country Ministerial, to respond to shifting geopolitical dynamics and ensure cohesive Canadian positions.
- Continued refining governance and coordination processes to support timely, informed decision-making under legislative frameworks, including the Secure Air Travel Act.
Resources required to achieve results
Table 2 provides a summary of the planned and actual spending and full-time equivalents (FTEs) required to achieve results.
| Resource | Planned | Actual |
|---|---|---|
| Spending | $40,607,853 | $39,183,031 |
| Full-time equivalents | 226 | 229 |
The Finances section of the Infographic for Public Safety Canada on GC InfoBase and the People section of the Infographic for Public Safety Canada on GC InfoBase provide complete financial and human resources information related to its Program Inventory.
Related government priorities
This section highlights government priorities that are being addressed through this core responsibility.
Gender-Based Analysis Plus
- No significant GBA Plus impacts are available for 2025 to 2026 related to processes and strategies for evaluating individuals under the Secure Air Travel Act. Prior to 2025 to 2026, a risk assessment tool which removes personal identifiers, including name, income, age, and gender identity, was introduced to support unbiased assessment of threat information.
- Increased collection and use of disaggregated cyber workforce data using Statistics Canada's Canadian Survey of Cyber Security and Cybercrime (CSCSC). Leveraging available identity- and diversity-related data will support a more robust intersectional analysis, which will enable a deeper understanding of workforce demographics and strengthen the Department's ability to assess diversity and inclusion impacts when survey results are published in fiscal year 2026 to 2027. A diverse group of federal partners were consulted to improve future survey questionnaires.
- Integrated GBA Plus and gender-responsive analysis into violent extremism prevention efforts, including MegaWeek programming, threat monitoring, analytics, and stakeholder capacity-building activities, improving partners' ability to identify threats, tailor interventions, and address impacts on women, girls, and gender-diverse people targeted by violent extremism.
- Conducted analysis and provided guidance on gender- and ideologically motivated violent extremism topics including incel ideology, femininity and youth-led violent extremist and sexual extortion networks, and misinformation related to the gender identity of youth mass attackers. This work informed clinical treatment and policy development, supported intervention practitioners working with individuals at risk of violence, informed training for social workers and correctional officers, enabled the identification of a mass casualty attack plan in a school setting, supported briefings to senior decision-makers such as the Prime Minister, and contributed to terrorism-related investigations, peace bonds, and terrorist entity listings.
- Strengthened gender-responsive risk assessment approaches by developing policy guidance for a National Risk Assessment methodology, including a review of GBA Plus best practices and international approaches, to support the Critical Infrastructure Prioritization and Risk Assessment Pilot Project and future methodology development.
United Nations (UN) 2030 Agenda for Sustainable Development and the UN Sustainable Development Goals
More information on Public Safety Canada's contributions to Canada's Federal Implementation Plan on the 2030 Agenda and the Federal Sustainable Development Strategy can be found in our Departmental Sustainable Development Strategy.
Canada's Third National Action Plan on Women, Peace and Security
More information on Public Safety Canada's commitments to Canada's Third National Action Plan on Women, Peace and Security can be found in our Implementation Plan for Canada's National Action Plan on Women, Peace and Security – 2023 to 2029. Achievements against these commitments can be found in the Annual Progress Reports shared on Global Affairs Canada's website.
Program inventory
National Security is supported by the following programs:
- National Security Leadership
- Critical Infrastructure
- Cyber Security
Additional information related to the program inventory for National Security is available on the Results page on GC InfoBase.
Core responsibility 2: Community Safety
In this section
- Description
- Quality of life impacts
- Progress on results
- Details on results
- Key risks
- Resources required to achieve results
- Related government priorities
- Program inventory
Description
Public Safety Canada provides national coordination to help Canadian communities and stakeholders respond to crime and build community resilience, promote the safety and security of Canadian communities and institutions, enhance the integrity of Canada's borders, and support the provision of policing services to Indigenous communities.
Quality of life impacts
This core responsibility contributes to the "Good Governance" domain of the Quality of Life Framework for Canada. More specifically, through the activities outlined in the core responsibility description and planned to achieve its objectives, this core responsibility contributes to the following indicators: "Confidence in institutions", "Indigenous self-determination", all but "household emergency preparedness" under the "Safety and Security" sub-domain, and all of the indicators under the "Justice and Human Rights" sub-domain.
Progress on results
This section presents details on how the department performed to achieve results and meet targets for Core responsibility 2: Community Safety. Details are presented by departmental result.
Tables 3, 4, and 5 provide a summary of the target and actual results for each indicator associated with the results under Community Safety in the last three fiscal years.
| Departmental Result Indicator | Target | Date to achieve target | Actual Result |
|---|---|---|---|
| Percentage of stakeholders who report consulting Public Safety Canada research or policy documents to inform their decision making | ≥ 70% | March 31, 2026 | 2023 to 2024: 80% 2024 to 2025: 78% 2025 to 2026: 55%Footnote 22 |
| Percentage of stakeholders who report good or very good results of projects funded through Public Safety Canada's Community Resilience Fund, in line with project objectives | ≥ 80% | March 31, 2026 | 2023 to 2024: 76% Footnote 23 2024 to 2025: 80% 2025 to 2026: 63%Footnote 24 |
| Number of new research products available to Canadians on radicalization to violence and efforts to prevent and counter it | ≥ 5Footnote 25 | March 31, 2026 | 2023 to 2024: 74 Footnote 26 2024 to 2025: 110 2025 to 2026: 126 |
| Number of Canadians who are aware of Government of Canada initiatives to reduce gun violence and new laws and regulations related to firearms in Canada | ≥ 2,000,000 | March 31, 2026 | 2023 to 2024: N/A Footnote 27 2024 to 2025: N/A Footnote 28 2025 to 2026: N/AFootnote 29 |
| Departmental Result Indicator | Target | Date to achieve target | Actual Result |
|---|---|---|---|
| Crime Severity IndexFootnote 30 | ≤ 70.1 | March 31, 2026 | 2023 to 2024: 81.27 Footnote 31 2024 to 2025: 78.84 Footnote 32 2025 to 2026: 75.01Footnote 33 |
| Police-reported crime rate per 100,000 populationFootnote 34 | ≤ 5,200 | March 31, 2026 | 2023 to 2024: 5,889 Footnote 35 2024 to 2025: 5,723 Footnote 36 2025 to 2026: 5,585Footnote 37 |
| Percentage of Canadians who think that crime in their neighbourhood has decreasedFootnote 38 | ≥ 4% | March 31, 2026 | 2023 to 2024: N/A 2024 to 2025: N/A 2025 to 2026: N/AFootnote 39 |
| Percentage of Canadians who report driving a vehicle within two hours following cannabis useFootnote 40 | ≤ 20% | March 31, 2026 | 2023 to 2024: 12% 2024 to 2025: 15% Footnote 41 2025 to 2026: N/AFootnote 42 |
| Percentage of firearm-related homicides in CanadaFootnote 43 | ≤ 40% | March 31, 2026 | 2023 to 2024: 38.57% 2024 to 2025: 37.50% 2025 to 2026: 34.48% |
| Departmental Result Indicator | Target | Date to achieve target | Actual Result |
|---|---|---|---|
| Percentage of projects where participants experienced positive changes in risk and protective factors related to offending | ≥ 75% | March 31, 2026 | 2023 to 2024: 82% Footnote 44 2024 to 2025: 76% 2025 to 2026: 79% |
| Percentage of programs targeting at-risk populations that achieve the intended participation rate | ≥ 75% | March 31, 2026 | 2023 to 2024: 70% Footnote 45 2024 to 2025: 67% Footnote 46 2025 to 2026: 86% |
| Difference between police reported crime in First Nation communities and police reported crime in the rest of CanadaFootnote 47 | ≤12,000 | March 31, 2026 | 2023 to 2024: 20,288 Footnote 48 2024 to 2025: 22,050 Footnote 49 2025 to 2026: 23,221Footnote 50 |
The Results section of the Infographic for Public Safety Canada on GC InfoBase provides additional information on results and performance related to the Program Inventory.
Details on results
The following section describes the results for Community Safety in 2025 to 2026 compared with the planned results set out in Public Safety Canada's Departmental Plan for the year.
Departmental Results:
- Canadian Communities are safe
- Community safety practices are strengthened
- Crime is prevented and addressed in populations/communities most at-risk
Results achieved
Border and International Relationships
- Amended the Preclearance in Canada Regulations to strengthen Canada's border security and integrity by establishing a security clearance process for transportation facility personnel requiring unescorted access to United States (U.S.) preclearance areas. The measure enhances oversight of access to sensitive border-related facilities, reduces potential security vulnerabilities, and helps maintain a secure environment for travellers, transportation facility employees, and border officers.
- Facilitated the launch of U.S. preclearance operations at Billy Bishop Toronto City Airport in March 2026, strengthening Canada's border security by enabling U.S. border screening to occur prior to departure in a controlled and secure environment. The initiative enhanced the efficiency and integrity of cross-border travel by streamlining passenger processing and reducing wait times upon arrival in the U.S.
- Coordinated Ministerial participation at the Five Country Ministerial (FCM) in September 2025 to address pressing national security and public safety challenges across Five Eye partners, resulting in a shared Communique outlining strengthened commitments on border security, child sexual exploitation and abuse, counter-terrorism, and countering foreign interference, the global production and flow of illegal synthetic drugs and precursors by transnational crime groups; as well as a Common Principles of Return Statement. Bilateral meetings on the margins of the forum also allowed for the building of stronger ties, collaboration on shared objectives and enhanced efforts on safety and security.
- Hosted the G7 Interior and Security Ministers' Meeting (IMM) in November 2025, bringing partners together to address complex and evolving threats to public safety and security, resulting in a Communique and a series of joint commitments to combat transnational organized crime, drug trafficking, and migrant smuggling. This included a Joint Statement to strengthen port security and enhance cooperation against synthetic drug and precursor chemical trafficking.
- Engaged U.S. counterparts on shared public safety priorities through bilateral meetings and cooperation in multilateral fora, including the FCM, the G7 IMM, and several trips to the U.S., including the Minister of Public Safety's trip to Washington in August 2025 alongside the Minister of Justice and Attorney General of Canada, and Fentanyl Czar to meet with the U.S. Attorney General. Calls and in-person meetings allowed for stronger connections with established or new counterparts in the U.S. administration, and opportunities to advance progress on key issues, such as border security, to counter crime and keep people on both sides of the border safe.
- Hosted the North American Drug Dialogue (NADD) in January 2026, advancing trilateral cooperation with the U.S. and Mexico and resulting in joint commitments to strengthen border and postal security, address firearms trafficking and money laundering, and expand cooperation on wastewater surveillance to support evidence-based responses to illicit drug threats across North America.
- Hosted two meetings of the G7 Roma-Lyon Group, which includes G7 Heads of Delegations from Interior and Foreign Affairs Ministries, and six sub-groups (Law Enforcement Practitioners; Counter-Terrorism Practitioners; High-Tech Crime; Criminal Legal Affairs; Migration Experts; Transportation Security), enabling cooperation on counter-terrorism and transnational organized crime.
- Led coordination and monitoring of Canada's $1.3 billion Border Plan, resulting in enhanced authorities, operational tools, and improved interagency coordination to strengthen enforcement effectiveness and information sharing. Border Plan efforts contributed to reductions in illegal drug trafficking, automobile smuggling, and irregular migration flows, including a marked decline in southbound irregular crossings to the United States, strengthening border integrity and public safety. Examples of these and other successes are captured in Strengthening Canada's Borders: 2025 in review.
- Advanced legislative measures to protect Canadian border security and the immigration and asylum system, including Bill C-12, the Strengthening Canada's Immigration System and Borders Act, officially becoming law following Royal Assent in March 2026.
- Strengthened relations with Mexico through senior-level engagements, including a Ministerial meeting between the Minister of Public Safety and Mexico's Secretary of Security and Citizen Protection in December 2025. These engagements were in support of the Canada-Mexico Action Plan 2025-2028. Strong, sustained engagement and cooperation was further advanced through the January 2026 meeting of the Canada-Mexico Strategic Security Dialogue, on four thematic areas: 1) preventing the trafficking of drugs and firearms, 2) combatting transnational organized crime, 3) improving cyber security and, 4) strengthening disaster resilience. Parties deepened strategic collaboration and operational coordination, agreeing to a series of ongoing commitment under the forum.
- Represented Canada at the European Union's December 2025 International Conference on the Global Alliance to Counter Migrant Smuggling, supporting its formal launch and strengthening international collaboration. This engagement resulted in the establishment of a Public Safety Canada–European Commission DG HOME Strategic Dialogue on shared national security priorities, including transnational organized crime, drug trafficking, migrant smuggling, terrorism and violent extremism, cybersecurity, and information sharing.
- Advanced work with the Australian Department of Home Affairs toward launching a Strategic Security Dialogue, in support of the March 2026 Joint Leaders' Statement, to enable strengthened bilateral cooperation and coordinated responses to evolving threats.
Serious and Organized Crime
- Developed an overdose detection mapping application program (ODMAP) that will enable near real-time overdose monitoring and support timely responses to emerging drug threats and trafficking trends, conducted beta testing, created a domain name and governance documents, and engaged provincial and municipal representatives experiencing high rates of overdose harms to identify pilot jurisdictions under the renewed Canada Drugs and Substances Strategy (CDSS).
- Engaged 3,932 students through an Online Dangers Roadshow in English schools in the greater Vancouver Area and French schools in Ottawa, providing guidance on cyberbullying and online child sexual exploitation (OCSE) warning signs and resources (Cybertip.ca, Kids Help Phone). Our efforts yielded an 80% approval rating and students reported improved ability to make safer online choices.
- Hosted two webinars ("Emerging Threats and New Technologies in OCSE"; "Navigating Potential Risks for Children in Online Gaming") with 670 participants (criminal justice professionals, civil society organizations, parents, caregivers, educators) with content covering hybrid threats (including links to violent extremism), new technologies, and prevention practices. Eighty-nine per cent (89%) of participants, who attend from countries including and beyond the traditional G7 forums indicating meaningful reach, reported deeper understanding, 91% indicated relevance to their work, and 90% indicated they would recommend the series. Building on the strong approval ratings and to respond to increased demand for participation, the Department will add a third webinar to its next series in 2026 to 2027.
- Established a Five Country survivor engagement framework in collaboration with partners and advocates to advance Five Country Ministerial commitments to elevate survivors' voices and inform governmental responses to online child sexual exploitation and abuse (OCSEA); chaired the G7 Child Sexual Exploitation and Abuse Working Group, resulting in increased inclusion of survivor perspectives in policy discussions, such as in the November 2025 G7 Interior Ministers' Meeting and in the inclusion of OCSEA in the G7 IMM communiqué, released in November 23, 2025; and advanced analysis of artificial intelligence-generated child sexual abuse material, safety measures, legal responses, and best practices.
- Supported the Centre for Addiction and Mental Health's Talking for Change program, which provides digital support for bystanders and for individuals concerned about their sexual attraction to children or who are worried about engaging in online or offline offending involving a child. This program helps create safer environments for Canadian children by providing fully resourced, accessible, anonymous and confidential helpline support. Overall, 331 people were anonymously supported during the 2025 to 2026 reporting period, including 226 first-time help-seekers. One hundred and two (102) help-seekers were further referred to the Talking for Change therapy program and 53 were referred to a mental health provider in their jurisdiction.
- Appointed Ms. Jennifer Richardson to the Chief Advisor to Combat Human Trafficking role (January 2025 to April 2026). Throughout her tenure, she provided survivor-informed advice, established a foundation for collaboration across jurisdictions and engaged extensively with a broad range of partners and Survivors in Canada and internationally. For example, she conducted over 100 stakeholder meetings with Indigenous partners, stakeholders, and survivors, informing implementation of the National Inquiry into Missing and Murdered Indigenous Women and Girls Calls for Justice related to human trafficking, underscoring the disproportionate impact of trafficking on Indigenous peoples, especially Indigenous women, girls, and 2SLGBTQQIA+ individuals.
- Continued to support the Canadian Centre to End Human Trafficking operations of the Canadian Human Trafficking Hotline. The Hotline is a vital part of the government's National Strategy to Combat Human Trafficking to help stop human trafficking and support victims and survivors. In December 2025, the Centre released the Human Trafficking Trends in Canada, 2019-2024 report which identified trends across the hotline's first six years of operation. Notably, the data showed a 317% increase in identified labour trafficking cases in 2024, demonstrating continued need to support the Hotline and human trafficking efforts writ large.
- Provided funding of $9.1 million over three years to municipal and provincial police services to improve their capacity to provide timely referrals, information and actionable intelligence to the CBSA, and $3.5 million over three years to support International Criminal Police Organization (INTERPOL) in combatting transnational organized vehicle crime sharing under the National Action Plan on Combatting Auto Theft. Efforts undertaken with the support of this funding contributed to an 18% national decrease in vehicle theft in 2025 (with greater-than-average reductions in Ontario -22% and Quebec -25%), and an increase in recovery rates from 58% (2024) to 59% (2025 as reported in Équité 2025 Auto Theft Trend Report (PDF). The efforts on behalf of all partners involved in tackling auto theft have yielded these reductions, helping Canadians feel safer in their communities.
- Advanced domestic cooperation to tackle financial crimes by delivering the Spin Cycle Conference and the Knowledge Hub to share information and support partner coordination and awareness. In February 2026, the Spin Cycle conference welcomed more than 1,350 participants from across Canada, including approximately 300 in-person attendees. Participants represented federal, provincial, municipal, and international public-sector organizations involved in combatting financial crime, including representatives from the UK Home Office and INTERPOL. The breadth of participation reflected the conference's role as a leading national forum for knowledge exchange, operational collaboration, and capacity building related to fraud, scams, money laundering, and other emerging financial crime threats. Additionally, the Knowledge Hub Portal, which contained more than 219 e-Library resources and more than 80 training resources and tools, supported 1,136 registered users and more than 74,823 total site visits. The portal has achieved broad representation across federal, provincial, and municipal partners involved in combatting financial crime, demonstrating leadership in providing quality and relevant information to combat this challenge.
- Signed contribution agreements, as the G7 President, with eligible recipients of each provincial/territorial/municipal host jurisdiction to ensure they will be reimbursed for policing and security costs incurred in support of RCMP-led security operations for the duration of the Presidency. This funding ensures that host jurisdictions do not bear the financial burden associated with hosting G7-related events, and facilitating positive inter-governmental relationships.
- Supported the Department of Finance Canada in the establishment of the Financial Crimes Agency and the development of a National Anti-Fraud Strategy by providing expertise on law enforcement and policing policy and best practices in tackling financial crime and fraud.
- Advanced efforts to combat transnational organized crime across extortion, money laundering, fraud, and terrorism financing by applying a "follow the money" approach, targeting criminal networks and financial flows through policy leadership and international engagement. By encouraging the tracing, freezing, and confiscation of illicit proceeds, these efforts have contributed to the disruption of criminal networks by targeting the proceeds of crime and the financial facilitators that enable criminal activity, making it more difficult for organized crime groups to sustain and expand their operations.
- Coordinated two extortion-focused summits in Ontario and British Columbia, resulting in targeted federal support for the Peel Regional Police Extortion Investigative Task Force and support to investigations disrupting organized crime networks. These investments have strengthened Canada's operational response to extortion by enhancing investigative resources, financial intelligence capabilities (e.g., the February 2026 Countering Extortion Partnership announced by the Minister of Finance), and multi-jurisdictional coordination, while improving support for victims and affected communities. The summits provided an opportunity to announce the Regional Integrated Drug Enforcement Teams in British Columbia and Ontario, funded through Canada's Border Plan, and highlight their role in supporting collaborative efforts to combat organized drug crime, extortion, and other criminal activity associated with drug trafficking.
- Supported legislative modernization efforts, including the Royal Assent of Bill C-12 in March 2026, and the continued advancement of Bills C-14 (received Royal Assent in 2026 to 2027) which tightens bail restrictions and increases penalties for violent and repeat offenders, and C-22, strengthening information-sharing authorities and providing additional tools to identify, investigate, and disrupt criminal networks.
Law Enforcement and Policing
- Launched the Assault-Style Firearms Compensation Program (ASFCP) for individuals, first by conducting a small-scale pilot in collaboration with the Cape Breton Regional Police to test program delivery and identify opportunities to enhance participant experience while ensuring efficient and effective operations. The ASFCP launched nationally in January 2026 with a declaration period which concluded on March 31, 2026. Over 68,000 assault-style firearms were declared by over 38,000 firearms owners across the country. Collection and compensation processes are expected to run until early fall 2026 in various parts of the country.
- Continued the work aimed at reopening and expanding the ASFCP for businesses to support the collection and compensation of assault-style firearms prohibited in December 2024 and March 2025, in addition to continuing to accept those prohibited in May 2020.
- Engagement with police services, provinces, territories and municipalities took place throughout the year. Discussions with interested jurisdictions resulted in the establishment of contribution agreements with four municipalities and one province to support firearms collection form individuals by local police. Negotiations in other jurisdictions continued.
- Brought into force mandatory firearms licence revocation and ineligibility provisions to reduce risks associated with intimate partner and family violence. The measures prevent individuals convicted of violence against an intimate partner or family member from obtaining a firearms licence and require licence revocation where there are suspected links to domestic violence or stalking. The Department also continued consultations with provinces and territories, six federal-provincial-territorial tables, and seven Indigenous organizations to support implementation planning.
- Invested over $3.7 million to fund 25 organizations under the "Red Flag" Awareness Initiative, to develop resources and share information on the laws with those at risk of firearm-related harm and supporting organizations. This includes developing toolkits, brochures and websites, hosting workshops and training sessions and conducting engagement and outreach; more information will be available as the projects roll out.
- Continued discussions with provinces and territories to advance policy, governance, and program considerations for the Royal Canadian Mounted Police (RCMP) Contract Policing Program ahead of 2032 renegotiations.
- Worked with Nova Scotia and the RCMP on oversight and implementation of Mass Casualty Commission (MCC) Report recommendations, with the Progress Monitoring Committee (PMC) in year two of its three-year mandate, and its ongoing deliberations and annual reporting was published online. The Department provided an update to the PMC in March 2026 on progress made on federal measures responding to MCC recommendations on Access to Firearms-related recommendations and their implementation.
- Led transition management tables for police transitions in Surrey, British Columbia, and Grande Prairie, Alberta to ensure planning, monitoring, and issue resolution. The Department provided policy leadership leading the coordination and development of police transition sub-plans in Grande Prairie. This included identification of key milestones and timelines, and assignment and monitoring of related tasks and activities by partners to ensure accountability and reduce the risk of operational issues during transition.
- Advanced implementation of the Public Complaints and Review Commission Act (former Bill C-20, an Act establishing the Public Complaints and Review Commission (PCRC) and amending certain Acts and statutory instruments (PCRC Act)), in partnership with the Civilian Review and Complaints Commission for the RCMP and Canada Border Services Agency, to support the establishment of the Public Complaints and Review Commission (PCRC). Funding authorities were secured in March 2026 through Supplementary Estimates C and, as announced in the Forward Regulatory Plan 2025-2027, work is underway to advance regulations under the Public Complaints and Review Commission Act, enabling continued progress toward full implementation of the PCRC and the Minister's mandate to establish an independent review body with defined timelines for complaints and recommendations.
Indigenous Policing
- Continued to release funding to existing First Nations and Inuit police services, including from Budget 2024 investments, to strengthen and maintain safety in Indigenous Communities.
- Advanced the modernization of the First Nations and Inuit Policing Program (FNIPP) through renewed Terms and Conditions. This included establishing a new funding stream to support Community Safety Officers starting in 2025 to 2026, expanding the range of tools available to support local safety needs, along with broader improvements to how the program is governed, designed, and delivered. Work also continued on supporting tripartite funding negotiations with First Nations, Inuit, and provincial partners under the FNIPP and the First Nations and Inuit Policing Facilities Program (FNIPFP). FNIPFP investments supported 19 projects, mainly to build new policing detachments to improve safety and operational capacity of Indigenous police services, and responsiveness to local public safety priorities.
- Led engagement with First Nations, Inuit and provincial and territorial partners on the progress of the ongoing modernization of the FNIPP and the FNIPFP, while helping strengthen program design and delivery to better meet community needs.
Crime Prevention
- Provided leadership and oversight of over $56 million supporting 44 new National Crime Prevention Strategy projects, enabling delivery of evidence-based interventions to prevent and reduce crime and enhance community safety by addressing risk and protective factors associated with crime and victimization.
- Continued to operate a continuous intake process for the Canada Community Security Program (CCSP), providing funding to help communities at risk of hate-motivated crime enhance the security of their gathering spaces. In 2025-26, the CCSP provided approximately $16.7 million to support 178 projects across Canada, helping organizations implement protective measures and enhance the safety and security of their community gathering spaces. Additionally, on March 11, 2026, the Government of Canada announced an urgent dedicated investment of up to $10 million via the CCSP, which assisted Jewish communities in enhancing the security of their gathering spaces, including schools, day cares, overnight camps, and places of worship, as well as additional projects supported through these organizations.
- Strengthened a coordinated national approach to combating antisemitism and enhancing the safety of Jewish communities through the publication of the National Commitments to Combat Antisemitism in January 2026 and ongoing engagement with Jewish community organizations, federal security partners, provinces, and territories. These efforts improved information sharing on the threat environment, reinforced collaboration on measures to address antisemitism and support community safety, and informed communities of available Government of Canada supports, including the CCSP. Participants welcomed dialogue and expressed appreciation for the Government's ongoing support, including additional funding for the CCSP.
- Continued to work with all eligible recipients in the administration of funds under the Initiative to Take Action Against Gun and Gang Violence (ITAAGGV), with the Gun and Gang Violence Action Fund (GGVAF) and the Youth Gang Prevention Fund (YGPF) recipients having received $79.5 million for the 13 GGVAF and 9 YGPF projects funded. Recipients have reported that their projects were producing positive impacts relative to their objectives and to the communities, populations or stakeholders served by their project. The positive results of the supported projects contributed to advancing the prevention of crime in populations most at-risk of entering or being affected by gang activity. For instance, some provinces have used GGVAF funds to pursue or launch prosecutions victims/witness assistance programs to deliver coordinated, wrap-around services and supports to meet the needs of victims of gun and gang related crime, increase the capacity to deliver services, and enhance expertise of staff. Support to these witnesses/victims increases the likelihood of successful prosecutions in these types of court cases.
- Extended the Building Safer Communities Fund (BSCF) with $157.5 million in contribution funding for an additional three years, supporting municipalities and Indigenous Communities to bolster gang-prevention programming to counter the social conditions that lead to criminality. The BSCF renewal reflects the Government of Canada's ongoing commitment to supporting community-driven initiatives that help prevent gun and gang violence before it begins.
- Supported Community Resilience Fund (CRF) initiatives by overseeing $2.7 million in targeted funding amendments, including frontline response to the Tumbler Ridge shooting, sustaining priority projects to counter radicalization to violence. Funding provided to Shift BC following the Tumbler Ridge shooting enabled the organization to mobilize specialized clinical and prevention expertise to support affected communities and respond to increased service demands. This enhanced local capacity to identify and support individuals at risk of violence, while providing participants with timely access to specialized interventions, counselling supports, and community-based services that strengthened safety and resilience. The CRF is also one component of Public Safety Canada's efforts under Canada's National Action Plan on Combatting Hate, for which updates were provided in Canadian Heritage's Results Report for Canada's Action Plan on Combatting Hate: A Foundational First Year (forthcoming).
- Continued to advance the development of the National Strategy to Reduce Gun and Gang Violence, in collaboration with provincial and territorial partners by conducting extensive external stakeholder engagements (i.e., municipalities, Indigenous communities, academia, and non-governmental organizations), including via the Federal-Provincial-Territorial (FPT) Tiger Team, to further inform the development process, with the end objective remaining to provide a unified yet flexible approach to address gun and gang violence.
- Advanced all 18 of Canada's commitments under the Christchurch Call to Action by strengthening Public Safety Canada's collaboration with G7 and Five Eyes partners, the Global Internet Forum to Counter Terrorism (GIFCT) and the United Nations (UN) to address terrorist and violent extremist content (TVEC) online and emerging artificial intelligence-enabled threats. These efforts also informed the development of Bill C-34, An Act to enact the Digital Safety Act and the Digital Safety Commission of Canada Act and to make consequential amendments to other Acts.
Corrections and Community Reintegration
- Tabled the Progress Report for the Federal Framework to Reduce Recidivism in Parliament on September 25, 2025 and published it on October 24, 2025, highlighting early implementation and outcomes across five priority areas: housing, employment, education, health, and positive support networks, and demonstrating progress in coordinating federal support for reintegration.
- Advanced cross-government collaboration on recidivism reduction, helping departments and agencies align initiatives with the Framework's objectives and reinforcing a whole-of-government approach to supporting safe and successful community reintegration.
- Identified ongoing challenges affecting implementation and impact measurement, including inconsistent access to reintegration services, limited and short-term community funding, and gaps in recidivism data needed to assess outcomes and inform future policy and program delivery.
- Proposed amendments to the Corrections and Conditional Release Act as part of Bill C-16: An act to An Act to amend certain Acts in relation to criminal and correctional matters (child protection, gender-based violence, delays and other measures) to enhance victims' access to information and right to participation, and establish a clear framework for sharing offender-related information with law enforcement, prosecutorial and oversight bodies.
Key risks
Effective program delivery, stakeholder engagement, and intergovernmental coordination are critical to Public Safety Canada's efforts to enhance community safety. Accordingly, the Department undertook actions to manage operational pressures, support program continuity, and strengthen collaboration with partners. Specifically, to respond to evolving challenges, the Department:
- Strengthened engagement with stakeholders, including community organizations, provincial and territorial partners, and international counterparts, to address capacity limitations and ensure outreach efforts were focused on priority areas. These efforts supported the maintenance of established relationships, development of new partnerships, and the ability to respond to evolving global dynamics.
- Managed resource and capacity constraints by prioritizing initiatives and reallocating personnel and funding where required, ensuring continued delivery of key programming despite competing demands.
- Addressed limitations in analytical tools and data capacity by advancing efforts to improve access to technology and support evidence-based analysis, including steps to mitigate delays in acquiring required systems.
- Managed legal, privacy, and data-sharing considerations in the development of new tools and initiatives, including work to support the rollout of ODMAP Canada through engagement with jurisdictions and the development of appropriate agreements.
- Advanced the implementation of the Border Plan under tight timelines and external pressures, through strong coordination with Portfolio partners and by enhancing operational planning, enabling timely progress on key border security measures.
- Advanced complex, multi-jurisdictional initiatives, including police transitions, by working closely with provincial and municipal partners to address capacity gaps, improve coordination, and support implementation efforts.
Resources required to achieve results
Table 6 provides a summary of the planned and actual spending and full-time equivalents (FTEs) required to achieve results.
| Resource | Planned | Actual |
|---|---|---|
| Spending | $1,288,586,498 | $820,793,419 |
| Full-time equivalents | 589 | 583 |
The Finances section of the Infographic for Public Safety Canada on GC InfoBase and the People section of the Infographic for Public Safety Canada on GC InfoBase provide complete financial and human resources information related to its Program Inventory.
Related government priorities
This section highlights government priorities that are being addressed through this core responsibility.
Gender-based Analysis Plus
- Collected, via the Canada Centre for Community Engagement and Prevention of Violence (Canada Centre)'s Impact Assessment Unit, a first wave of data from seven Canadian violent extremism intervention programs on their clients. This included - both individuals at-risk of violent extremism, and also significant numbers of friends and family of those at-risk, victims/survivors of violent extremism, and other health and social service providers seeking help to manage such cases of risk and need. Data was managed carefully, including to protect against accidental identification of personal information about clients, given the very small numbers involved; includes demographic items (gender, age, location, language); and helps demonstrate certain trends and population characteristics, including the prevalence of youth (under 18) clients across all programs in Canada. As further waves of data are gathered and assessed, the Canada Centre will produce and share more evidence about trends regarding risk of violent extremism, and how prevention programs are working to manage risk. These findings will better inform future programming and evaluations, as well as provide a greater public understanding of what frontline programs face, and how they provide services and support to prevent and counter violent extremism.
- Published, via the Canada Centre's Open Source Unit, 40 knowledge products to date outlining emerging threats within the violent extremism space in Canada. These reports are designed to support frontline practitioners—including social workers, mental health professionals, teachers, and police officers—to better understand trends in violent extremism, terrorism, hate, and online harms. By applying a GBA Plus lens to understands the role of how different facets of individual and social identities can shape pathways to violence, as well as protective factors for individuals and groups at risk of radicalization to violence, these reports aim to help inform more effective and appropriate approached to prevention.
- Invested in fifteen trauma-informed, community-based projects and funded the Canadian Human Trafficking Hotline (24/7, confidential, multilingual) under the National Strategy to Combat Human Trafficking, resulting in prevention efforts and support for victims, survivors, and at-risk individuals through connections to local services and law enforcement. These organizations provide a spectrum of services including, providing housing, mental health services, employment assistant, and financial independence programming, including initiatives that are Indigenous-led or guided by Indigenous knowledge.
- Continued to lead national outreach efforts to increase awareness of human trafficking and encourage reporting using targeted, survivor informed messaging for youth, parents, and those experiencing increased risk. The latest campaign, launched in February 2026, shares the lived experiences of survivors of sex trafficking through educational videos and accompanying advertising highlighting sex trafficking warning signs and risk factors. Additional campaign messaging strengthens understanding of labour trafficking risks, including sector-specific vulnerabilities linked to major events such as FIFA World Cup 2026.
- Coordinated interdepartmental contribution to, and published the 2024 Corrections and Conditional Release Statistical Overview, which provided an analysis of gender-based differences in crime rates, sentencing, and victim populations across the criminal justice system. Public Safety Canada leveraged its disaggregated data on correctional populations and identified trends to support evidence-based correctional policy analysis and advice, including the application of GBA Plus considerations, and engagement with stakeholders. Detailed results can be found in the linked report.
- Advanced the Federal Victim Project with Statistics Canada, completing Year 1 (2025 to 2026) of a three-year agreement and establishing key data linkages to develop a comprehensive victim dataset including gender information, with Years 2–3 pending funding confirmation.
- Initiated a two-year research collaboration with Statistics Canada under Canada's Black Justice Strategy. During 2025 to 2026, the project scope and research plan was developed and finalized to examine the relationship between socioeconomic status and reintegration outcomes following release from custody. The study includes intersectional analyses, such as age (i.e., age at release), gender (men and women), and ethnicity (e.g., Black and White individuals). Data preparation and analysis are currently underway in 2026 to 2027.
- Conducted a research project examining the relationship between reoffending and socioeconomic status among Indigenous and Black Canadians. During 2025 to 2026, data was collected, merged, and prepared through a Statistics Canada Research Data Centre. Analysis is underway in 2026 to 2027.
- Advanced the Indigenous Community Corrections Initiative (ICCI) Re-Contact Project with Statistics Canada under a multi-year agreement, finalizing and approving the research proposal and study materials and completing the Privacy Analysis Checklist in 2025 to 2026, enabling the project to proceed on assessing recidivism impacts.
United Nations (UN) 2030 Agenda for Sustainable Development and the UN Sustainable Development Goals
More information on Public Safety Canada's contributions to Canada's Federal Implementation Plan on the 2030 Agenda and the Federal Sustainable Development Strategy can be found in our Departmental Sustainable Development Strategy.
Canada's Third National Action Plan on Women, Peace and Security
More information on Public Safety Canada's commitments to Canada's Third National Action Plan on Women, Peace and Security can be found in our Implementation Plan for Canada's National Action Plan on Women, Peace and Security – 2023 to 2029. Achievements against these commitments can be found in the Annual Progress Reports shared on Global Affairs Canada's website.
Program Inventory
Community Safety is supported by the following programs:
- Crime Prevention
- Law Enforcement and Policing
- Serious and Organized Crime
- Border Policy
- Indigenous Policing
- Corrections
Additional information related to the program inventory for Community Safety is available on the Results page on GC InfoBase.
Core responsibility 3: Emergency Management
In this section
- Description
- Quality of life impacts
- Progress on results
- Details on results
- Key risks
- Resources required to achieve results
- Related government priorities
- Program inventory
Description
Public Safety Canada works to strengthen national emergency management to help prevent, mitigate, prepare for, respond to and recover from all-hazards events. Public Safety Canada provides resources and expertise to Canadian communities in support of emergency preparedness, disaster mitigation and recovery.
Quality of life impacts
This core responsibility contributes to the "Environment" and "Good governance" domains of the Quality of Life Framework for Canada and, more specifically, "Climate change adaptation", and "Natural disasters and emergencies" (Environment) and "Household emergency preparedness" (Good Governance) through all of the activities mentioned in the core responsibility description.
Progress on results
This section presents details on how the Department performed to achieve results and meet targets under Core responsibility 3: Emergency Management. Details are presented by departmental result.
Table 7 provides a summary of the target and actual results for each indicator associated with the results under Emergency Management in the last three fiscal years.
| Departmental Result Indicator | Target | Date to achieve target | Actual Result |
|---|---|---|---|
| Percentage of stakeholders who participated in a Government Operations Centre-led exercise indicating the exercise program assisted their organization's preparedness | ≥ 80% | March 31, 2026 | 2023 to 2024: 0%Footnote 51 2024 to 2025: 90% 2025 to 2026: 90% |
| Percentage of hazards assessed through the National Risk Profile for which Government of Canada response plans are in place or in development | 90% | March 31, 2026 | 2023 to 2024: 83% Footnote 52 2024 to 2025: 100% Footnote 53 2025 to 2026: 100% |
| Percentage of Disaster Financial Assistance Arrangements events for which provinces and territories have reported mitigation measures to prepare for, respond to, and recover from future natural disastersFootnote 54 | ≥ 65% | March 31, 2026 | 2023 to 2024: 49% Footnote 55 2024 to 2025: 49% Footnote 56 2025 to 2026: 48%Footnote 57 |
| Percentage of Canadians who are aware of risks facing their household | ≥ 60% | March 31, 2026 | 2023 to 2024: 91% 2024 to 2025: 92% Footnote 58 2025 to 2026: 91% |
| Percentage of Canadians who have taken measures to respond to risks facing their household | ≥ 50% | March 31, 2026 | 2023 to 2024: 32% Footnote 59 2024 to 2025: 30% Footnote 60 2025 to 2026: 34%Footnote 61 |
| Percentage of stakeholders who indicate that the Government Operations Centre provided effective leadership and coordination for events affecting the national interest | ≥ 90% | March 31, 2026 | 2023 to 2024: 93% 2024 to 2025: 93% 2025 to 2026: 92% |
| Percentage of stakeholders who indicate that the Government Operations Centre's processes, products and tools were useful in responding to an emergency | ≥ 80% | March 31, 2026 | 2023 to 2024: 94% Footnote 62 2024 to 2025: 89% 2025 to 2026: 93% |
| Percentage of events that required the coordination of a federal response for which after-action activities were completed by the Government Operations Centre | 100% | March 31, 2026 | 2023 to 2024: 100% Footnote 63 2024 to 2025: 100% 2025 to 2026: 100% |
The Results section of the Infographic for Public Safety Canada on GC InfoBase provides additional information on results and performance related to the Program Inventory.
Details on results
The following section describes the results for Emergency Management in 2025 to 2026 compared with the planned results set out in Public Safety Canada's departmental plan for the year.
Departmental Result: Canada can effectively mitigate, prepare for, respond to and recover from all-hazards events
Results achieved
Emergency Preparedness
- Obtained endorsement from Federal, Provincial and Territorial (FPT) Ministers on the approach to renewing Canada's Emergency Management Strategy. Ministers endorsed the approach in November 2025, and directed officials to deliver a refreshed strategy that is practical, partner-driven, and responsive to a worsening risk environment, with emphasis on meaningful engagement with First Nations, Inuit, and Métis partners and better reflecting the vulnerabilities of Indigenous, remote, and northern communities. The Department delivered on this renewal work by working with different FPT and Indigenous working groups to meaningfully advance development through discussions to align on the content of the renewed strategy. In particular, Public Safety Canada advanced the renewal of the Strategy through meaningful engagement with Indigenous partners and National Indigenous Organizations, collecting important insights about the realities of communities and how the Strategy should address them. Partner-driven engagement is important in ensuring that the renewed Strategy remains relevant in the dynamic context of changing disaster risks in Canada, and reflects a common adaptation approach for all jurisdictions.
- Strengthening federal coordination through the Federal Emergency Response Plan by exploring the integration of the Canadian Core Capabilities List and National Risk Profile methodologies into federal strategic emergency management planning. The approach standardized processes, integration, and common understanding across the federal family and increased interoperability. Stakeholder feedback indicated that 78% of federal respondents believe that GOC plans are adequate to support their organizations' preparedness and 89% of respondents believed that the GOC's guidance increased the effectiveness of their organizations' response efforts.
- Worked at the operational-level to re-invigorate, via the Government Operations Centre (GOC), the National Exercise Program (NEP). The GOC consulted over 25 federal, provincial, territorial, and international partners to understand community needs and build consensus on the program's governance, prioritization, methodology, and coordination requirements. The consultations resulted in updated exercise governance, a renewed National Priority Exercise selection process, and a National Exercise Coordination Tool. Combined, these elements provide a formal structure to support predictable, risk-informed, and nationally coordinated exercise planning model for the future.
- Prepared for and delivered a number of emergency management exercises, including Exercise Cobalt Magnet, Olympian Summit II (G7 Summit), and Vital Archer 2025, and completed groundwork for Vital Archer 2026 (April 2026). The GOC also supported the Assault-Style Firearms Compensation Program through exercise development and subject matter expertise to execute a Mobile Collection Unit proof-of-concept, resulting in documented lessons learned for future rollout while exercise support continues. These exercises provided participants with opportunities to validate plans, test decision-making and information-sharing processes, clarify roles and responsibilities, and strengthen interagency coordination, resulting in enhanced preparedness and collective capacity to respond to complex emergencies and major events.
- Developed and implemented a consequence management plan for major events including the G7 Summit and FIFA World Cup 2026.These plans were developed in collaboration with relevant federal, provincial, territorial municipalities and international stakeholders, with final versions distributed in advance of their respective events. The plans outline risk assessments, governance structures, concepts of operations, and response and recovery plans to guide use of existing emergency management mechanisms in the relevant contexts.
- Continued to develop hazard-specific response plans and supported continuity of constitutional government (CCG) institutions, including the development of an all-hazards CCG Plan outlining federal response processes for catastrophic events requiring evacuation of the National Capital Region. The CCG Plan, still in development as of the end of 2025 to 2026, supports the continuity of federal constitutional institutions during catastrophic emergencies. This plan was developed in collaboration with relevant national security partners with work ongoing to address remaining operational requirements and strengthen readiness with provincial and territorial partners.
- Enhanced federal readiness for a nuclear detonation event through the development of a consequences management framework and capability assessments under the Federal Nuclear Detonation Response Plan. Informed by lessons learned from Vital Archer 2025 and applied in Northern Archer 2026 (which took place in early 2026 to 2027), these measures improved preparedness, informed senior decision-making, and strengthened whole-of-government coordination and response planning.
- Completed scoping, creation, testing, and user experience evaluation of the National Flood Risk Awareness Portal (officially known as Canada's Flood Risk Finder). Core components of the portal include: an interactive map that provides flood hazard and risk information by address or coordinates, an artificial intelligence-enabled image-to-text function to improve accessibility and user understanding, and flood risk reduction resources for homeowners and renters. Public user testing informed improvements to the portal's design, functionality, communications approach, navigation, and usability, while accessibility, cybersecurity, and performance testing ensured readiness for public deployment. Engagement with Indigenous communities on flood risk reduction information needs was undertaken, and will inform future Indigenous-focused content, and public opinion research on Canadians' flood risk awareness and protective behaviours will help inform future communications related to the Finder. Provinces and territories can now opt in to make flood risk information available through the platform, and Public Safety Canada continues to engage partners to expand Canadians' access to reliable flood risk information.
- Advanced renewal of the National Public Alerting System (NPAS), following the Budget 2025 announcement. Engaged alerting partners in defining requirements for renewed system, and launched a Request for Information to prepare for a competitive procurement. Accelerated FPT work to establish a renewed governance model, and pan-Canadian NPAS framework to promote consistent and effective use of the system. This work will consider recent lessons learned and the recommendations of the Mass Casualty Commission.
Emergency Prevention/Mitigation
- Completed Federally-Identified Flood Risk Areas (FIFRA) datasets and conducted external expert review of the methodology, with documentation awaiting publication. Data sharing agreements for the FIFRA datasets were signed by six provinces and territories, with more under discussion. The FIFRA datasets were also shared with three other federal departments, including our close partners in the Flood Hazard Identification and Mapping Program (FHIMP) at Natural Resources Canada, to support screening and prioritization exercises. Each dataset was also accompanied by documentation detailing the methodology and limitations of the FIFRA datasets to enable their responsible use. The FIFRAs are actively used by the Disaster Financial Assistance Arrangements (DFAA) Program to screen areas at high-risk of flooding. Other departments are considering how to integrate the FIFRAs into their decision making.
Emergency Response/Recovery
- Funded non-governmental organizations (NGOs) through the Humanitarian Workforce program (HWF) while advancing collaboration with provinces, territories, Indigenous partners, and stakeholders to strengthen national response and recovery capacity. The HWF program funded four NGO deployments to support wildfire responses in Newfoundland and Labrador and Manitoba following Requests for Federal Assistance from the affected provinces.
- Engaged provinces, territories, and representatives of the insurance industry to inform the design of a proposed national flood insurance program. These discussions helped advance program development through a collaborative Federal-Provincial-Territorial approach and ensured key stakeholders were involved in the design process. Work to develop a national flood insurance program remains ongoing.
- Launched the Canadian Centre for Recovery and Resilience in September 2025, establishing a partnership with the Institute for Catastrophic Loss Reduction to advance resilient recovery practices in Canada. The Centre develops guidance for communities, provides direct support to communities, provinces, and territories, and builds a national cross-sectoral network of recovery practitioners that bridges public sector, private sector, non-profit sector, and academia. The Centre successfully delivered workshops and training to 23 communities representing more than 8 million Canadians, and trained 55 public officials on how to work with communities to plan for recovery. For example, the Centre worked with 20 communities in a pilot program to develop pre-disaster recovery plans, and published a library of 20 practical, evidence-based guides, tools, and templates and examples to facilitate community recovery planning. Training participants rate Centre workshops with an average score of 4.7/5 for improving knowledge of recovery and confidence in leading recovery planning.
- Launched the modernized Disaster Financial Assistance Arrangements (DFAA) program on April 1, 2025, successfully meeting one of Public Safety Canada's primary targets under the National Adaptation Strategy. The Department continues to support all provinces and territories (PTs) in updating their own disaster assistance programs to align with the new federal DFAA through ongoing monthly engagement, policy support, and targeted training. As 2025 to 2026 disaster events come to the new DFAA, the Department will continue to work with provinces and territories (PTs) to ensure they can take advantage of the new benefits in the modernized program, regardless of their program update status. This sustained support helps PTs interpret new requirements, take advantage of new eligibility, adjust delivery models, and ensure consistent application of the modernized policy. Four PTs have fully updated and approved provincial programs; the PTs that have not yet fully updated their programs are actively working to incorporate new federal eligibility for building back better, reducing disaster risk, and providing targeted supports for people most impacted by disasters, thus demonstrating strong, early uptake of resilience-oriented recovery. Seven PTs have confirmed Disaster Risk Reduction Incentives in the modernized program and will receive this incentive for any DFAA eligible 2025 to 2026 events.
- Coordinated, via the GOC, 17 Requests for Federal Assistance (i.e., RFAs; 13 with extensions) in response to wildland fires across Canada in 2025.
- Produced and distributed 113 Cyclical Common Operating Pictures (COPs) to provide situational awareness of floods, wildland fires and hurricanes between April and September 2025 and also produced 113 Border COPs over the year. These products were used by senior leadership—including the Prime Minister's Office—and partners for briefing and situational awareness, ensuring a consistent flow of information to governance tables to make informed decisions.
Key risks
Effective emergency management requires coordinated action, resilient systems, and the capacity to respond to complex and concurrent events. Accordingly, the Department undertook actions to manage operational pressures, strengthen coordination, and support the delivery of emergency management functions. Specifically, the Department:
- Advanced the development and implementation of key digital systems and tools, including Canada's Flood Risk Finder and DFAA platform, while managing procurement, accessibility, and technical challenges through interdepartmental collaboration and adaptive project planning.
- Managed interdependencies between systems, including the Flood Hazard Identification and Mapping Program and the Portal, by adjusting timelines and project sequencing to ensure continued progress and support intended policy outcomes.
- Strengthened coordination with federal, provincial, and territorial partners through ongoing engagement to address sensitivities, align approaches, and support the renewal of initiatives such as the National Public Alerting System.
- Addressed human resource and capacity constraints by utilizing existing resources, implementing interim solutions, and advancing internal planning to support recovery, response, and program delivery functions.
- Managed sustained operational pressures during concurrent, high-impact events, including the 2025 wildfire season, by coordinating federal response efforts, supporting partners, and reinforcing processes for lessons learned and improved future readiness.
Resources required to achieve results
Table 8 provides a summary of the planned and actual spending and full-time equivalents (FTEs) required to achieve results.
| Resource | Planned | Actual |
|---|---|---|
| Spending | $744,631,575 | $414,936,999 |
| Full-time equivalents | 364 | 431 |
The Finances section of the Infographic for Public Safety Canada on GC InfoBase and the People section of the Infographic for Public Safety Canada on GC InfoBase provide complete financial and human resources information related to its Program Inventory.
Related government priorities
This section highlights government priorities that are being addressed through this core responsibility.
Gender-based Analysis Plus
- Engaged, under the flood portal development work, a representative sample of Canadians through user research and testing, conducted targeted engagement with Indigenous Peoples, and fielded a 2025 national public opinion survey capturing demographic data (gender, age, visible minority status, rural/urban residents, renters and homeowners), resulting in Portal content and design informed by diverse user perspectives and needs. User research and testing informed the presentation of flood hazard and risk information, including terminology, risk ratings, maps, navigation, and search functions to improve clarity and usability. Indigenous engagement informed the decision not to develop community flood risk ratings for Indigenous communities and supported the development of Indigenous-focused flood risk content reflecting Indigenous perspectives, experiences, and stories related to flood risk reduction. For example, one of the flood risk reduction resources is a dedicated "flood ready renter" resource, which addresses the identified gap in available information for guidance on how renters can prepare for flooding and ways to reduce its impact, keeping in mind renter-specific considerations such as tenant insurance and the limited ability to make changes to the property.
- Conducted engagement (November 2025–March 2026) regarding the future of Emergency Management with provinces and territories, National Indigenous Organizations and other Indigenous governments and organizations, civil society (non-governmental organizations, academia, industry, private sector), and the general public, resulting in an update presented to senior leadership in Spring 2026 to inform future emergency management decisions and actions.
- Integrated GBA Plus considerations into emergency management modernization, including the Government Operation Centre's move to new facilities in early 2026 with gender-neutral, fully accessible bathroom facilities on each floor, ensuring inclusivity is reflected in infrastructure design.
United Nations (UN) 2030 Agenda for Sustainable Development and the UN Sustainable Development Goals
More information on Public Safety Canada's contributions to Canada's Federal Implementation Plan on the 2030 Agenda and the Federal Sustainable Development Strategy can be found in our Departmental Sustainable Development Strategy.
Canada's Third National Action Plan on Women, Peace and Security
More information on Public Safety Canada's commitments to Canada's Third National Action Plan on Women, Peace and Security can be found in our Implementation Plan for Canada's National Action Plan on Women, Peace and Security – 2023 to 2029. Achievements against these commitments can be found in the Annual Progress Reports shared on Global Affairs Canada's website.
Program inventory
Emergency Management is supported by the following programs:
- Emergency Preparedness
- Emergency Prevention/Mitigation
- Emergency Response/Recovery
Additional information related to the program inventory for Emergency Management is available on the Results page on GC InfoBase.
Internal services
In this section
- Description
- Progress on results
- Resources required to achieve results
- Contracts awarded to indigenous businesses
Description
Internal services are the services that are provided within a department so that it can meet its corporate obligations and deliver its programs. There are 10 categories of internal services:
- Management and Oversight Services
- Communications Services
- Legal Services
- Human Resources Management Services
- Financial Management Services
- Information Management Services
- Information Technology Services
- Real Property Management Services
- Materiel Management Services
- Acquisition Management Services
Progress on results
This section presents details on how the Department performed to achieve results and meet targets for internal services, including internal services delivered in support of portfolio partners. In 2025 to 2026, Public Safety Canada focused on the following commitments under its internal services in order to ensure effective delivery of its programs and the ability to meet its corporate obligations. These achievements also served to advance the Department's four key internal services priorities:
Fostering employee well-being and sense of belonging
- Developed and implemented a workplace action plan based on the 2024 risk assessment, and implemented several of the components outlined therein. These efforts included strengthening accountability and policy frameworks, updating and implementing the Hazard Prevention Program and continuing the Harassment and Violence Prevention Program. The Department undertook workplace safety assessments in Winnipeg, Manitoba, and addressed heating issues in Edmonton, Alberta and Dartmouth, Nova Scotia in collaboration with key partners. Key performance indicators were established to evaluate the effectiveness of the preventative measures to continuously improve its workplace assessment and its preventative measures. The next workplace risk assessment is planned for 2027 and will help assess the impact of actions taken since 2024 and identify areas for further improvement.
- Developed a multi-year Values and Ethics Plan, appointed a Departmental Senior Official for Conflict of Interest, communicated findings from the 2024 to 2025 Misconduct and Wrongdoing Report, and launched a bi-monthly values and ethics campaign, resulting in increased awareness, oversight, and employee engagement on conflict of interest and expected behaviours, and the departmental vision and direction in this regard.
- Launched the Employee Suggestion Box in May 2025 and received hundreds of ideas across many themes. As a result of employee feedback, a few initiatives were deployed such as "Take Me With You" (i.e., job shadowing opportunity for managers to take employees to high-level meetings with leadership, to support on-the-job learning for employees) and a Managers' Best Practices document, resulting in improved inclusion in meetings and support for managing change and hybrid teams.
- Analyzed and shared results from the 2024 GBA Plus evaluation on in-office presence with employees, informing ongoing adjustments to the hybrid work environment, tools, and manager-employee dialogue. For example, investments in boardroom videoconferencing capabilities enabled more effective hybrid meetings by allowing virtual participants to contribute equally through video, chat, and other collaboration features, reducing barriers associated with distance work.
- Launched the iBelong campaign and First Person column (two employee engagement activities to invite employees to share their stories and lived experiences related to Inclusion, diversity, equity and accessibility), and expanded the Mentoring Program with 227 participants.
- Delivered 11 sessions within the Onboarding Program with a total of 193 participants. The program includes a formal feedback mechanism that extends beyond the initial onboarding session through structured follow-up surveys at both the 1-month and 6-month milestones. The majority of participants (88%) indicated being highly satisfied with the program 6 months after completion.
The collective impact of these initiatives contributed to strengthening a workplace culture grounded in respect, well-being, integrity, and inclusion. By enhancing prevention and accountability mechanisms, promoting ethical conduct, and increasing opportunities for employee engagement and development, the department continued to foster a healthier, safer, and more inclusive work environment. Employee feedback helped inform workplace improvements and shape actions that addressed evolving needs and priorities. The impact of these efforts will continue to be assessed through future Public Service Employee Survey (PSES) results, with the next survey anticipated in fall 2026.
Building a diverse, inclusive and accessible workplace
- Implemented the Employment Equity Action Plan 2024-27 to enhance the departmental culture of equity via achieving progress in governance and data. This was advanced through modernization of employee networks and Champion structures, consultations to inform the Anti-racism Strategy, and introduction of a Performance Measurement Framework to enhance accountability for equity, diversity, and inclusion initiatives. The Department also updated Integrity and Respect Award criteria (6 nominations, 2 awards) to further enhance recognition to those who enhance a culture of equity and diversity.
- Delivered targeted recruitment and development initiatives to enhance equitable and diverse staffing (14 students with disabilities hired;141 participants in Young Women in Public Safety; 47 participants engaged in three career development programs that supported employment equity-seeking employees and Black public servants, including the Treasury Board Secretariat's Mosaic Leadership Development Program (1 participant), the departmental THRIVE Program delivered through the Public Safety Black Employee Network (28 participants), and the departmental Sponsorship Plus Program (18 participants)).
- Expanded engagement in cultural learning and events (110 communications promoting 44 commemorative periods and 49 events), which promoted employee understanding and immersion in other cultures.
- Advanced the Public Safety Canada - Accessibility Plan 2023-2026, implementing actions across all six pillars: employment, built environment, information and communication technology, communication, procurement, and program design. Specific efforts included: expanded ergonomic accommodations, accessible renovations (washrooms, parking, emergency planning), updated templates, mandatory procurement training, and integration of accessibility and GBA plus and proactive consultation with subject matter experts (SMEs) and those with lived experiences into program design. These efforts collectively resulted in reinforcing a systemic and sustainable approach to removing barriers, enhancing employee participation and empowerment, and improved accessibility across systems and workplaces. For more information on results, please see Accessibility progress report 2025 for Public Safety Canada. In addition, the Department published the Public Safety Canada Accessibility Plan 2026-2028
- Implemented the Official Language (OL) Action Plan 2024-27, an internal framework designed to support the equal status of English and French in the workplace and strengthen the department's official languages capacity. The department delivered three part-time language training series to 340 employees, (26% who self-identified as members of employment equity or equity-deserving groups, with priority access provided to these employees). In response to Treasury Board's revised minimum CBC/CBC language requirements for supervisory positions in bilingual regions, compliance increased from approximately 55% to nearly 79% (as of March 31, 2026). The department also promoted bilingual participation through events such as Rendez-vous de la Francophonie and Official Languages Day, as well as tools and resources that support official language learning and use in the workplace. These measures helped reduce systemic barriers to language learning and career development, promote linguistic duality, and support a workplace where employees can participate and contribute in the official language of their choice.
- Improved employment equity representation in 2025 to 2026 relative to 2024 to 2025, and relative to workforce availability, with increased representation among women (61.6% vs 61.1% and 61.6% vs 61.8%, respectively), visible minorities (25.4% vs 22.3% and 25.4% vs 24.8%, respectively), and persons with disabilities (13.3% vs 12.1% and 13.3% vs 11.8%, respectively), and representation of Indigenous Peoples staying fairly consistent (though with a very slight decrease in 2025-26; 4.1% vs 4.2% and 4.1% vs 4%, respectively).
The collective impact of these initiatives contributed to strengthening a workplace culture where diversity, inclusion, accessibility, and linguistic duality are embedded in policies, programs, and workplace practices. By enhancing representation, reducing systemic barriers, expanding equitable access to opportunities, and increasing accountability, the department fostered a more inclusive and accessible workplace where employees are empowered to contribute fully and achieve their potential. These actions also supported the development of a workforce that better reflects the diversity of Canadian society, strengthening the department's ability to understand, respond to, and serve the needs of the citizens and communities it supports. The impact of these efforts will continue to be assessed through future Public Service Employee Survey (PSES) results, with the next survey anticipated in fall 2026.
Investing in key services and infrastructure
In 2025 to 2026, Public Safety Canada's operating environment continued to be marked by rapid technological change, elevated cyber threats, increasing expectations for digital-first services, and a strong direction to improve productivity and modernize service delivery using artificial intelligence (AI). In this context, the Department enacted the following actions to strengthen its service and digital capabilities to support the delivery of secure, reliable, cost optimized, and user-centered services:
- Continued investing in modern digital capabilities, including data analytics, artificial intelligence, automation, cybersecurity, enterprise architecture, and service design. These investments enhanced the Department's ability to leverage service and digital practices to deliver high-quality services.
- Created the Department's first digital investment framework, strengthening the oversight of the department's digitally enabled projects. The framework enhances governance mechanisms, prioritization, oversight, and delivery of digital initiatives across the Department. Together, these measures strengthened decision-making, improved alignment between digital investments and business priorities, and supported a more coordinated and risk-informed approach to managing departmental resources.
- Accelerated, through this new approach, the implementation of digital solutions to support the Assault-Style Firearms Compensation Program; AI solutions to reduce manual and error-prone tasks and accelerate production of parliamentary committee summaries and reports related to the Fighting Against Forced Labour and Child Labour in Supply Chains Act; and implementation of an enterprise data management and business analytics platform to power more data-driven decisions.
- Advanced foundational initiatives to strengthen digital infrastructure and security, including modernization activities related to secure networks, remote access technologies, and cyber resilience. These efforts improved the reliability and security of the Department's digital environment, increased operational resilience, and reinforced its ability to support employees and program delivery in a rapidly evolving threat landscape.
Promoting integration, coherence and collective management
- Strengthened departmental governance, accountability, and decision-making through a modernized governance framework that further clarified committee mandates, improved reporting mechanisms, reduced duplication, and better aligned oversight and timing of strategic priorities, resource decisions, policy initiatives, and human resources considerations. These changes enhanced integrated planning, transparency, and organizational stewardship across the Department.
- Improved performance measurement, reporting, and evidence-based decision-making across the Department by modernizing performance measurement governance, guidance, tools, and quality assurance processes. Standardized approaches to developing logic models, performance indicators, performance measurement frameworks, and grants and contributions data collection improved the consistency, quality, and reliability of performance information. Also, implementation of a Head of Performance Measurement review and attestation process improved oversight and quality of results and reporting requirements, supporting stronger performance reporting and accountability.
Resources required to achieve results
Table 9 provides a summary of the planned and actual spending and full-time equivalents (FTEs) required to achieve results.
| Resource | Planned | Actual |
|---|---|---|
| Spending | $89,162,768 | $90,963,364 |
| Full-time equivalents | 583 | 592 |
The Finances section of the Infographic for Public Safety Canada on GC InfoBase and the People section of the Infographic for Public Safety Canada on GC InfoBase provide complete financial and human resources information related to its Program Inventory.
Risk and compliance process
The Risk and Compliance Process (RCP) is a self-assessment designed to help deputy heads verify that they have controls and practices in place to meet their accountabilities under legislation and Treasury Board policy, and to effectively manage risks within their departments.
In 2025 to 2026, Public Safety Canada completed the RCP self-assessment, which found strong performance in several core management areas, especially Financial and Expenditure Management, Grants and Contributions (G&C) delivery, Procurement, and Security, reflecting effective management, oversight, and sound governance.
The assessment also identified opportunities to strengthen Data, Service, and Technology by advancing enterprise approaches to information and data management, service design and delivery, and alignment of enabling functions with departmental priorities. These findings reflect ongoing modernization and capacity challenges and highlight areas requiring sustained investment and coordinated action.
In response, the Department strengthened governance, improving integration across enabling functions, reinforcing compliance through clearer accountabilities and updated processes, and pursuing broader modernization efforts through multi-year investments in digital and data capabilities and the transformation of its G&C service delivery platform.
Contracts Awarded to Indigenous Businesses
Government of Canada departments are to meet a target of awarding at least 5% of the total value of contracts to Indigenous businesses each year. This commitment is to be fully implemented by the end of 2025 to 2026.
Public Safety Canada results for 2025 to 2026
As shown in the Table 10, Public Safety Canada awarded 7.51% of the total value of all contracts to Indigenous businesses for the fiscal year.
| Contracting performance indicators | 2025 to 2026 Results |
|---|---|
| Total value of contracts awarded to Indigenous businesses1 (A) | $3,048,159.88 |
| Total value of contracts awarded to Indigenous and non-Indigenous businesses2 (B) | $40,593,782.83 |
| Value of exceptions approved by deputy head (C) | $0 |
| Proportion of contracts awarded to Indigenous businesses [A / (B−C) × 100] | 7.51% |
|
|
The Department exceeded the mandatory 5% target and has consistently surpassed this requirement over the past three fiscal years, demonstrating sustained efforts to advance Indigenous economic participation and support the Government of Canada's reconciliation objectives.
During the reporting period, the Department advanced this commitment through targeted procurement and capacity building measures that supported reconciliation objectives and Indigenous economic participation.
Spending and human resources
In this section
Spending
This section presents an overview of the department's actual and planned expenditures between 2023 to 2024 and 2028 to 2029.
Graph 1 presents how much the department spent in 2025 to 2026 to carry out core responsibilities and internal services.
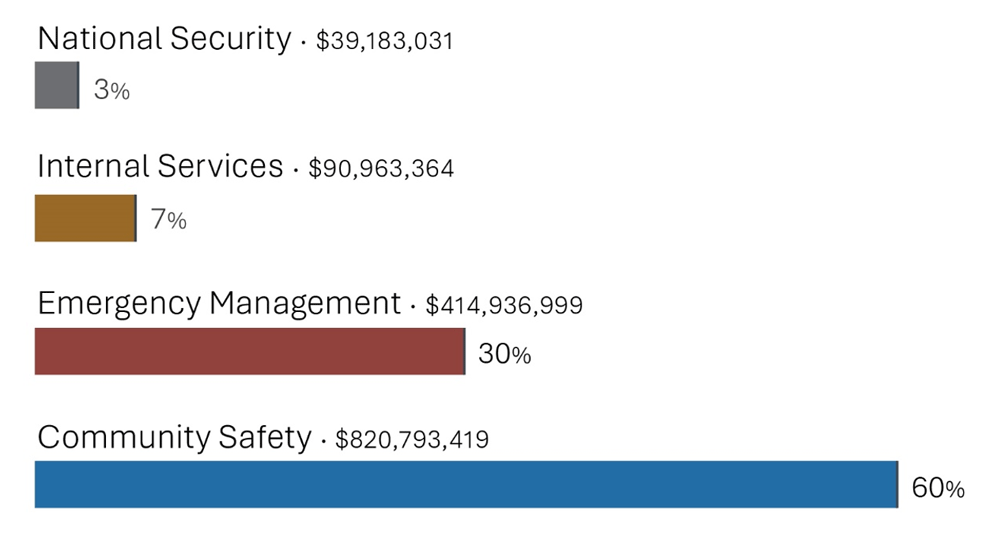
Graph 1: Image description
The graph illustrates the Department's actual spending for the 2025 to 2026 fiscal year by showing actual spending for each core responsibility in dollars and in percentages. Community Safety represents 820,793,419 dollars or 60 per cent of the total 1,365,876,813 dollars of Departmental actual spending. Emergency Management represents 30 per cent with 414,936,999 dollars in actual spending; Internal Services represents 7 per cent of the Department's actual spending with 90,963,364 dollars; and National Security represents 3 per cent of the actual spending with 39,183,031 dollars.
| Core Responsibilities and internal services | 2025 to 2026 Actual Spending |
|---|---|
| Core responsibility 1: National Security | $39,183,031 |
| Core responsibility 2: Community Safety | $820,793,419 |
| Core responsibility 3: Emergency Management | $414,936,999 |
| Internal services | $90,963,364 |
Analysis of actual spending by Core Responsibility
Actual spending for the National Security core responsibility is $39,183,031 (3%) in 2025 to 2026 which is attributable to National Security Leadership ($29.7 million), as well as Critical Infrastructure ($3.8 million) and Cyber Security ($5.7 million).
Actual spending for Community Safety core responsibility is $820,793,419 (60%) in 2025 to 2026 which is primarily attributable to the following programs:
- First Nations and Inuit Policing Program (FNIPP) ($316.8 million);
- Initiative to Take Action Against Gun and Gang Violence (ITAAGGV) ($78.1 million);
- National Crime Prevention Strategy (NCPS) ($59.9 million);
- Building Safer Communities Fund (BSCF) ($56.3 million); and
- Memorial Grant Program for First Responders (MGP) ($46.2 million).
Actual spending for Emergency Management core responsibility is $414,936,999 (30%) in 2025 to 2026 which is primarily attributable to the following programs:
- Disaster Financial Assistance Arrangements (DFAA) ($287.3 million);
- Supporting a Humanitarian Workforce to Respond to Largescale Emergencies ($31.5 million); and
- Canadian Red Cross Donation Matching ($18.1 million).
Actual spending for Internal Services is $90,963,364 (7%) in 2025 to 2026 which is used to support various departmental programs and initiatives in order to ensure effective delivery of the department's programs and the ability to meet its corporate obligations.
Budgetary performance summary
Actual spending for the past three years
Table 12 presents how much money Public Safety Canada spent over the past three years to carry out its core responsibilities and for internal services.
| Core Responsibilities and internal services | 2025 to 2026 Main Estimates | 2025 to 2026 total authorities available for use | Actual spending over three years (authorities used) |
|---|---|---|---|
| National Security | $40,607,853 | $44,677,415 | 2023 to 2024: $34,058,667 2024 to 2025: $34,118,539 2025 to 2026: $39,183,031 |
| Community Safety | $1,288,586,498 | $1,327,826,927 | 2023 to 2024: $839,595,906 2024 to 2025: $741,108,527 2025 to 2026: $820,793,419 |
| Emergency Management | $744,631,575 | $757,391,296 | 2023 to 2024: $523,075,930 2024 to 2025: $476,869,956 2025 to 2026: $414,936,999 |
| Subtotal | $2,073,825,926 | $2,129,895,638 | 2023 to 2024: $1,396,730, 503 2024 to 2025: $1,252,097,022 2025 to 2026: $1,274,913,449 |
| Internal services | $89,162,768 | $94,532,515 | 2023 to 2024: $87,393,872 2024 to 2025: $88,720,571 2025 to 2026: $90,963,364 |
| Total | $2,162,988,694 | $2,224,428,153 | 2023 to 2024: $1,484,124,375 2024 to 2025: $1,340,817,593 2025 to 2026: $1,365,876,813 |
Analysis of the past three years of spending
In 2025 to 2026, main estimates and planned spending increased by $61.4 million (3%) to total authorities available for use of $2.2 billion. This increase is primarily attributable to the 2024 to 2025 Operating Budget Carry Forward (OBCF) ($11.6 million), as well as new funding for:
- First Nations and Inuit Policing Facilities Program (FNIPFP) and First Nations and Inuit Policing Program (FNIPP) ($77.6 million);
- Memorial Grant Program for First Responders (MGP) ($28.5 million);
- Building Safer Communities Fund (BSCF) ($7 million) from a transfer of funding from previous year; and
- Criminal Code Authorization Regime (CCAR) ($3.9 million).
These increases were offset by a transfer to the Royal Canadian Mounted Police for the First Nations Community Policing Service ($76.2 million) under the First Nations and Inuit Policing Program (FNIPP), which takes place annually through the Supplementary Estimates.
Actual spending for 2025 to 2026 is $858.6 million (39%) lower than total authorities available for use. This variance is primarily attributable to the following transfer payment programs:
- Assault Style Firearms Compensation Program (ASFCP) ($335.4 million) which is anticipated to be fully transferred for use in future fiscal years, due to delays impacting the timing of program activities and associated funding requirements;
- Disaster Financial Assistance Arrangements (DFAA) ($328.7 million) which is anticipated to be fully transferred for use in future fiscal years, due to delays in payments and funding caused by audit challenges, evolving program requirements, and the unpredictable timing of provincial and territorial requests;
- First Nations and Inuit Policing Facilities Program (FNIPFP) ($60.4 million) which is anticipated to be fully transferred for use in future fiscal years, mainly due to construction delays with multiple projects; and
- Supporting the Canadian Red Cross's urgent relief efforts related to COVID-19, floods and wildfires ($7.9 million) due to delays in implementing disaster relief and recovery activities. Of this lapse, $3.8 million will be transferred for use in future fiscal years.
Actual spending for 2025 to 2026 is $25.1 million (2%) higher than expenditures in 2024 to 2025. This increase is primarily attributable to increases in payments for the following transfer payment programs:
- First Nations and Inuit Policing Program (FNIPP) ($56.3 million);
- Major International Events Security Cost Framework (MIESCF) ($30.2 million); and
- National Crime Prevention Strategy (NCPS) ($11.4 million).
These increases were offset by decreases in payments for the following transfer payment programs:
- Disaster Financial Assistance Arrangements (DFAA) ($55.9 million); and
- Building Safer Communities Fund (BSCF) ($21.9 million).
Actual spending for 2024 to 2025 is $143.3 million (10%) lower than expenditures in 2023 to 2024. This decrease is primarily attributable to decreases in payments for the following programs:
- Province of Newfoundland and Labrador to contribute to the New Adult Corrections Facility Project ($150 million);
- Disaster Financial Assistance Arrangements (DFAA) ($65.8 million); and
- Major International Event Security Cost Framework (MIESCF) ($48 million).
This was offset by the following increases in payments for:
- First Nations and Inuit Policing Program (FNIPP) ($42.8 million);
- Canadian Red CrossDonation Matching ($18.2 million);
- Assault-Style Firearms Compensation Program (ASFCP) ($15.4 million); and
- Building Safer Communities Fund (BSCF) ($11.8 million).
The Finances section of the Infographic for Public Safety Canada on GC InfoBase offers more financial information from previous years.
Planned spending for the next three years
Table 13 presents how much money Public Safety Canada's plans to spend over the next three years to carry out its core responsibilities and for internal services.
| Core Responsibilities and internal services | 2026 to 2027 planned spending | 2027 to 2028 planned spending | 2028 to 2029 planned spending |
|---|---|---|---|
| National Security | $44,164,669 | $29,202,703 | $27,067,286 |
| Community Safety | $938,754,775 | $748,329,798 | $697,114,333 |
| Emergency Management | $1,182,927,785 | $156,205,541 | $151,138,712 |
| Subtotal | $2,165,847,229 | $933,738,042 | $875,320,331 |
| Internal services | $86,996,799 | $73,557,827 | $68,158,260 |
| Total | $2,252,844,028 | $1,007,295,869 | $943,478,591 |
Analysis of the next three years of spending
The decrease of $1,245.5 million (55%) in planned spending between 2026 to 2027 and 2027 to 2028 is mainly attributed to a decrease in payments under the Disaster Financial Assistance Arrangements (DFAA) program ($1,006.9 million). These payments are based on forecasts from provinces and territories for disbursements under DFAA legislation. Public Safety Canada regularly consults with provinces and territories to ensure funding levels meet disbursement requirements under the DFAA legislation and aligns funding levels accordingly.
The decrease is also attributed to fluctuations in funding for the Assault-Style Firearms Compensation Program (ASFCP) ($145.1 million), as well as the First Nations and Inuit Policing Facilities Program (FNIPFP) ($23.3 million) resulting from the reprofiling of funds across fiscal years. The decrease in funding is also due to the Comprehensive Expenditure Review (CER) reductions ($15.3 million total reduction in 2026 to 2027).
The decrease of $63.8 million (6%) in planned spending between 2027 to 2028 and 2028 to 2029 is mainly attributed to the maturation of funding for the Initiative to Take Action Against Gun and Gang Violence (ITAAGGV) ($80.1 million), the Policy Development Contribution Program (PDCP) ($5 million) and the Assault-Style Firearms Compensation Program (ASFCP) ($3.6 million). The decrease in funding is also due to the Comprehensive Expenditure Review (CER) reductions ($20.4 million total reduction in 2027 to 2028 and $30.6 million in 2028 to 2029).
The Finances section of the Infographic for Public Safety Canada on GC InfoBase offers information on the alignment of Public Safety Canada's spending with Government of Canada's spending and activities.
Funding
This section provides an overview of the Department's voted and statutory funding for its core responsibilities and for internal services.
Graph 2 summarizes the department's approved voted and statutory funding between 2023 to 2024 and 2028 to 2029.
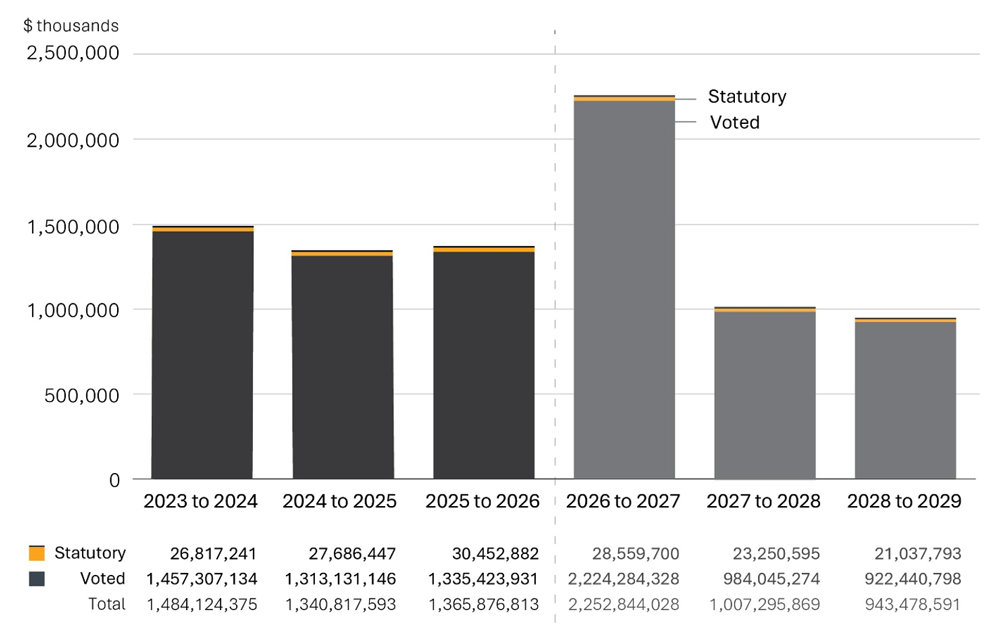
Graph 2: Image description
The graph summarizes the Department's spending trend for statutory, voted, and total spending over a six-year period, starting in 2023 to 2024 and ending in 2028 to 2029. In fiscal year 2023 to 2024, the actual statutory spending was 26,817,241 dollars; in 2024 to 2025, it was 27,686,447 dollars; and in 2025 to 2026, it was 30,452,882 dollars. In 2026 to 2027, planned statutory spending is 28,559,700 dollars; in 2027 to 2028, it is 23,250,595 dollars; and in 2028 to 2029, it is 21,037,793 dollars. In fiscal year 2023 to 2024, the actual voted spending was 1,457,307,134 dollars; in 2024 to 2025, it was 1,313,131,146 dollars; and in 2025 to 2026, it was 1,335,423,931 dollars. In 2026 to 2027, planned voted spending is 2,224,284,328 dollars; in 2027 to 2028, it is 984,045,274 dollars and in 2028 to 2029, it is 922,440,798 dollars. Finally, in 2023 to 2024, the total spending was 1,484,124,375 dollars; in 2024 to 2025 it was 1,340,817,593 dollars; and in 2025 to 2026, it was 1,365,876,813 dollars. In 2026 to 2027, planned total spending is 2,252,844,028 dollars; in 2027 to 2028 it is 1,007,295,869 dollars; and in 2028 to 2029 it is 943,478,591 dollars.
| Fiscal year | Statutory | Voted | Total |
|---|---|---|---|
| 2023 to 2024 | $26,817,241 | $1,457,307,134 | $1,484,124,375 |
| 2024 to 2025 | $27,686,447 | $1,313,131,146 | $1,340,817,593 |
| 2025 to 2026 | $30,452,882 | $1,335,423,931 | 1,365,876,813 |
| 2026 to 2027 | $28,559,700 | $2,224,284,328 | $2,252,844,028 |
| 2027 to 2028 | $23,250,595 | $984,045,274 | $1,007,295,869 |
| 2028 to 2029 | $21,037,793 | $922,440,798 | $943,478,591 |
Analysis of statutory and voted funding over a six-year period
The fluctuation in planned and actual spending over the six-year period is primarily attributed to the Disaster Financial Assistance Arrangements (DFAA) program. The DFAA contribution program represents a significant portion of Public Safety Canada's budget and is subject to unforeseen events, as the program is aimed at natural disaster response and recovery.
The DFAA program has base ongoing funding of $100 million for transfer payments. Public Safety Canada regularly consults with provinces and territories to ensure funding levels meet disbursement requirements under the DFAA legislation and aligns funding levels accordingly.
In this regard, top-up funding is received annually based on forecasted disbursement needs. In 2022 to 2023, the DFAA received an increase in funding levels of $2.3 billion for that year, $1.6 billion for 2023 to 2024 and $450 million for 2024 to 2025. Due to transfers of funding from previous years, the DFAA funding increased to $616 million in 2025 to 2026 and $1,106.9 million in 2026 to 2027 but will return to its base funding of $100 million in 2027 to 2028 and 2028 to 2029 until additional top-up funding is requested.
In addition to the DFAA, the fluctuations in planned spending over the next three fiscal years are primarily attributed to the Assault-Style Firearms Compensation Program (ASFCP) ($148.8 million in 2026 to 2027; $3.7 million in 2027 to 2028; and $0.1 million in 2028 to 2029) and to the Initiative to Take Action Against Gun and Gang Violence (ITAAGGV) ($80.1 million in 2026 to 2027; $80.1 million in 2027 to 2028; and sunsets thereafter).
Consult the Public Accounts of Canada for further information on Public Safety Canada's departmental voted and statutory expenditures.
Financial statement highlights
This section presents Public Safety Canada’s Financial statements (unaudited) for the year ended March 31, 2026.
Condensed statement of operations
Table 15 summarizes the expenses and revenues for 2025 to 2026 which net to the cost of operations before government funding and transfers.
| Financial information | 2025 to 2026 actual results | 2025 to 2026 planned results | Difference (actual results minus planned) |
|---|---|---|---|
| Total expenses | -$49,406,000 | $1,237,135,046 | -$1,286,541,046 |
| Total revenues | $3,102,091 | $2,700,000 | $402,091 |
| Net cost of operations before government funding and transfers | -$52,508,901 | $1,234,435,046 | -$1,286,943,137 |
Analysis of expenses and revenues for 2025 to 2026
The data reveals a significant variance of $1,29 billion between planned and actual expenses for 2025 to 2026. This variance is primarily attributed to the changes in estimates related to liabilities under the Disaster Financial Assistance Arrangements (DFAA) program.
During the fiscal year, DFAA liabilities were revised downward by $1,21 billion. The DFAA program is inherently complex and demand-driven, with expenditures dependent on the occurrence, severity, and timing of natural disasters, as well as the availability of updated information from provinces and territories regarding eligible claims and recovery costs. As a result, revision to cost estimates and liability assessments led to a significant reduction in the department's recorded expenses compared to planned amounts. Given the long-term nature of many disaster recovery efforts and the uncertainty associated with forecasting future claim costs, material variances between planned and actual results may occur.
Though the variance in spending appears significant, it is primarily driven by revisions to accounting estimates associated with DFAA liabilities rather than changes in program delivery. The department continues to work closely with provinces and territories to monitor disaster recovery activities and update financial forecasts as new information becomes available.
The 2025 to 2026 planned results information is provided in Public Safety Canada's Future-Oriented Statement of Operations and Notes 2025 to 2026.
Comparison between expenses and revenues in last two fiscal years
Table 16 summarizes actual expenses and revenues and shows the net cost of operations before government funding and transfers.
| Financial information | 2025 to 2026 actual results | 2024 to 2025 actual results | Difference (2025 to 2026 minus 2024 to 2025) |
|---|---|---|---|
| Total expenses | -$49,406,000 | $1,033,569,054 | -$1,082,975,054 |
| Total revenues | $3,102,091 | $2,753,023 | $349,068 |
| Net cost of operations before government funding and transfers | -$52,508,091 | $1,030,816,031 | -$1,083,324,122 |
Analysis of differences in expenses and revenues between 2024 to 2025 and 2025 to 2026
The table highlights a significant decrease of the total expenses to the tune of $1.08 billion in 2025 to 2026 compared to the previous year. This variance is primarily attributed to changes in accrued expenses under the DFAA program.
In 2025 to 2026, DFAA liabilities decreased from $4.93 billion to $3.51 billion, resulting in a significant reduction in accrued expenses. This decrease is largely attributed to the following key factors:
- Significant downward revisions to estimates of disaster recovery obligations: DFAA liabilities were reduced by approximately $1.21 billion as updated information and revised forecasts resulted in lower estimated costs for existing disaster events.
- Payments issued to provinces and territories (PTs): During 2025 to 2026, payments totaling approximately $287.3 million were made to PTs, reducing the outstanding DFAA liability balance.
- Revision of long-term liability estimates: As disaster recovery activities progressed and additional information became available, previously recorded estimates were reassessed, resulting in lower accrued expenses compared to the previous fiscal year.
These factors collectively contributed to the substantial year-over-year reduction in DFAA-related expenses. The decrease primarily reflects revisions to accounting estimates and settlements of existing obligations rather than changes to the department's delivery of disaster financial assistance programs.
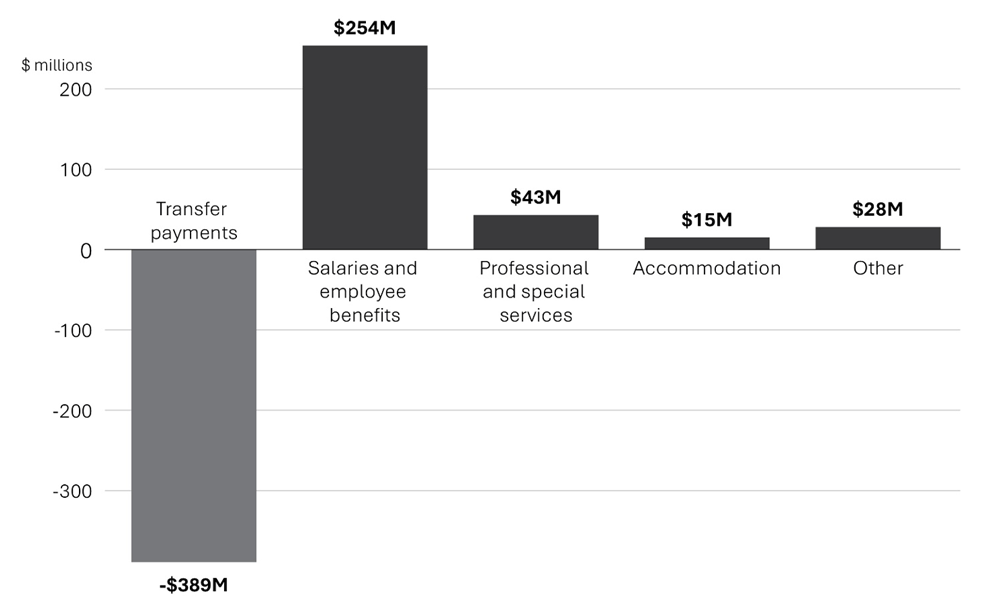
Graph 3: Image description
This chart presents the Statement of Operations and Departmental Net Financial Position by showing expenses by category of departmental accrual accounting expenses. Transfer payment amounts to -$389 million. The other categories include: salaries and employee benefits totaling $254 million; professional and special services $43 million, accommodation $15 million and other expenses which include travel and relocation, equipment, communication, equipment rentals, amortization, repairs, Claims against the Crown, Ex-gratia payments, utilities, materials and supplies totaling $28 million.
Note: The above graph is methodologically different than its equivalents in years' past and should not be used for trend analysis or year-over-year comparisons.
Comparison between liabilities and assets in last two fiscal years
Table 17 provides a brief snapshot of what the Department owes or must spend (liabilities) and its available resources (assets), which helps to indicate its ability to carry out programs and services.
| Financial information | Actual fiscal year (2025 to 2026) | Previous fiscal year (2024 to 2025) | Difference (2025 to 2026 minus 2024 to 2025) |
|---|---|---|---|
| Total net liabilities | $-4,337,607,961 | -$5,916,994,050 | $1,579,386,090 |
| Total net financial assets | $812,016,830 | $968,824,022 | -$156,807,192 |
| Departmental net debt | -$3,525,591,131 | -$4,948,170,029 | $1,422,578,898 |
| Total non-financial assets | $38,896,025 | $38,538,575 | $357,450 |
| Departmental net financial position | -$3,486,695,106 | -$4,909,631,454 | $1,422,936,348 |
Analysis of department's liabilities and assets since last fiscal year
The total liabilities decreased by $1,579 million in 2025 to 2026 compared to the previous year. The decrease is primarily attributed to the decrease in DFAA liabilities as well as the decrease in outstanding balance of Payables at Year-End (PAYE), mostly associated with DFAA. The DFAA liabilities decreased by $1.42 billion in 2025 to 2026 compared to the previous year while the PAYE decreased to the tune of $157 million.
The total net financial assets have decreased by $157 million. This decrease is mostly attributed to the decrease in 'Due From Consolidated Revenue Fund (CRF)' associated with the DFAA PAYE. The due from CRF arises due to the timing difference between the recording the liabilities at the year-end and the payment of the liabilities.
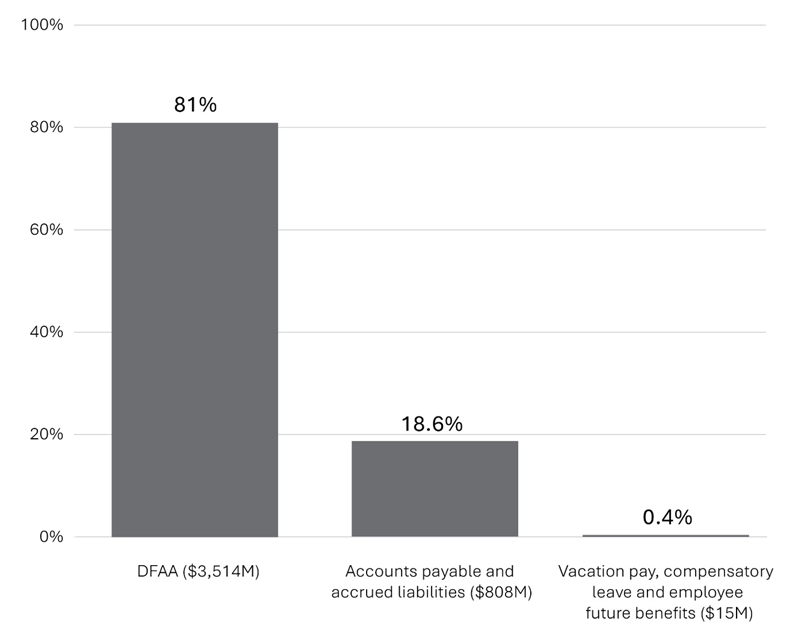
Graph 4: Image description
This chart shows in percentage total net liabilities by type of liability. DFAA liabilities constitute 81% of total net liabilities at $3,514 million; Accounts payable and accrued liabilities make up 18.6% at $808 million; and vacation pay, compensatory leave and employee future benefits make up 0.4% at $15 million.
Human resources
This section presents an overview of the department's actual and planned human resources between 2023 to 2024 and 2028 to 2029.
Human Resources for the Last Three Fiscal Years
Table 18 shows a summary of human resources, in full-time equivalents (FTEs), for Public Safety Canada's core responsibilities and for its internal services for the previous three fiscal years. Human resources for internal services include resources needed to support the delivery of internal services for portfolio partners.
| Core Responsibilities and internal services | 2023 to 2024 actual FTEs | 2024 to 2025 actual FTEs | 2025 to 2026 actual FTEs |
|---|---|---|---|
| National Security | 200 | 208 | 229 |
| Community Safety | 490 | 541 | 583 |
| Emergency Management | 366 | 398 | 431 |
| Subtotal | 1,056 | 1,147 | 1,243 |
| Internal services | 562 | 550 | 592 |
| Total | 1,618 | 1,697 | 1,835 |
Analysis of human resources over the last three years
Public Safety Canada's full-time equivalents (FTEs) increased by 13% (217 FTEs) over the last three years, from 1,618 FTEs in 2023 to 2024 to 1,835 FTEs in 2025 to 2026. This increase is attributed to growth of the following programs and initiatives over the last three years: the Assault-Style Firearms Compensation Program (ASFCP), the Canada Community Security Program (CCSP), and to support the renewed Canada's National Cyber Security Strategy.
Human resources for the next three fiscal years
Table 19 shows the planned full-time equivalents for each of Public Safety Canada's core responsibilities and for its internal services for the next three years. Human resources for the current fiscal year are forecast based on year to date.
| Core Responsibilities and internal services | 2026 to 2027 planned FTEs | 2027 to 2028 planned FTEs | 2028 to 2029 planned FTEs |
|---|---|---|---|
| National Security | 227 | 168 | 162 |
| Community Safety | 517 | 354 | 311 |
| Emergency Management | 310 | 301 | 263 |
| Subtotal | 1,054 | 823 | 736 |
| Internal services | 546 | 489 | 452 |
| Total | 1,600 | 1,312 | 1,188 |
Analysis of human resources for the next three yearsFootnote 64
FTEs in 2027 to 2028 are projected to decrease by 288 (18%) from 1,600 in 2026 to 2027 to 1,312 in 2027 to 2028. This decrease is primarily attributed to the planned completion of the Assault-Style Firearms Compensation Program (ASFCP), and the maturation of funding for the Canada Centre for Community Engagement and Prevention of Violence and the Criminal Code Authorization Regime.
FTEs in 2028 to 2029 are projected to decrease by 124 (9.5%) from 1,312 in 2027 to 2028 to 1,188 in 2028 to 2029. This decrease is primarily attributed to the planned completion of the Assault-Style Firearms Compensation Program (ASFCP), and the maturation of funding for Enhancing Natural Disaster Resilience and the First Nations and Inuit Policing Facilities Program (FNIPFP).
Supplementary information tables
The following supplementary information tables are available on Public Safety Canada's website:
- Details on transfer payment programs
- Gender-based analysis plus
- Response to Parliamentary committees and external audits
- Horizontal initiatives
- Up-front multi-year funding
Federal tax expenditures
The tax system can be used to achieve public policy objectives through the application of special measures such as low tax rates, exemptions, deductions, deferrals and credits. The Department of Finance Canada publishes cost estimates and projections for these measures each year in the Report on Federal Tax Expenditures. This report also provides detailed background information on tax expenditures, including descriptions, objectives, historical information and references to related federal spending programs as well as evaluations and GBA Plus of tax expenditures.
Corporate information
Departmental Profile
Appropriate ministers
- The Honourable Gary Anandasangaree
- The Honourable Eleanor Olszewski
Institutional head
Ms. Tricia Geddes
Ministerial portfolio
Public Safety and Emergency Preparedness
Enabling instrument(s)
Year of incorporation/commencement
2003
Departmental contact information
Mailing address: 269 Laurier Avenue West, Ottawa, Ontario, Canada, K1A 0P8
Telephone: 613-944-4875 or 1-800-830-3118
TTY: 1-866-865-5667
Fax: 613-954-5186
Email: ps.mediarelations-relationsaveclesmedias.sp@ps-sp.gc.ca
Website: Public Safety Canada
Definitions
- appropriation (crédit)
- Any authority of Parliament to pay money out of the Consolidated Revenue Fund.
- budgetary expenditures (dépenses budgétaires)
- Operating and capital expenditures; transfer payments to other levels of government, departments or individuals; and payments to Crown corporations.
- core responsibility (responsabilité essentielle)
- An enduring function or role of a department. The departmental results listed for a core responsibility reflect the outcomes that the department seeks to influence or achieve.
- Departmental Plan (plan ministériel)
- A report that outlines the anticipated activities and expected performance of an appropriated department over a 3-year period. Departmental Plans are usually tabled in Parliament in spring.
- departmental priority (priorité)
- A plan, project or activity that a department focuses and reports on during a specific planning period. Priorities represent the most important things to be done or those to be addressed first to help achieve the desired departmental results.
- departmental result (résultat ministériel)
- A high-level outcome related to the core responsibilities of a department.
- departmental result indicator (indicateur de résultat ministériel)
- A quantitative or qualitative measure that assesses progress toward a departmental result.
- departmental results framework (cadre ministériel des résultats)
- A framework that connects the department's core responsibilities to its departmental results and departmental result indicators.
- Departmental Results Report (rapport sur les résultats ministériels)
- A report outlining a department's accomplishments against the plans, priorities and expected results set out in the corresponding Departmental Plan.
- Full-time equivalent (équivalent temps plein)
- Measures the person years in a departmental budget. An employee's scheduled hours per week divided by the employer's hours for a full-time workweek calculates a full-time equivalent. For example, an employee who works 20 hours in a 40-hour standard workweek represents a 0.5 full-time equivalent.
- gender-based analysis plus (GBA Plus) (analyse comparative entre les sexes plus [ACS Plus])
- An analytical tool that helps to understand the ways diverse individuals experience policies, programs and other initiatives. Applying GBA Plus to policies, programs and other initiatives helps to identify the different needs of the people affected, the ways to be more responsive and inclusive, and the methods to anticipate and mitigate potential barriers to accessing or benefitting from the initiative. GBA Plus goes beyond biological (sex) and socio-cultural (gender) differences to consider other factors, such as age, disability, education, ethnicity, economic status, geography (including rurality), language, race, religion, and sexual orientation.
- government-wide priorities (priorités pangouvernementales)
- For the purpose of the 2024-25 Departmental Results Report, government priorities are the high-level themes outlining the government's agenda as announced in the 2021 Speech from the Throne.
- horizontal initiative (initiative horizontale)
- A program, project or other initiative where two or more federal departments receive funding to work collaboratively on a shared outcome usually linked to a government priority, and where the ministers involved agree to designate it as horizontal. Specific reporting requirements apply, including that the lead department must report on combined expenditures and results.
- non-budgetary expenditures (dépenses non budgétaires)
- Net outlays and receipts related to loans, investments and advances, which change the composition of the financial assets of the Government of Canada.
- performance (rendement)
- What a department did with its resources to achieve its results, how well those results compare to what the department intended to achieve, and how well lessons learned have been identified.
- performance indicator (indicateur de rendement)
- A qualitative or quantitative measure that assesses progress toward a departmental-level or program-level result, or the expected outputs or outcomes of a program, policy or initiative.
- plan (plan)
- The articulation of strategic choices, which provides information on how a department intends to achieve its priorities and associated results. Generally, a plan will explain the logic behind the strategies chosen and tend to focus on actions that lead to the expected result.
- planned spending (dépenses prévues)
- For Departmental Plans and Departmental Results Reports, planned spending refers to the amounts presented in Main Estimates. Departments must determine their planned spending and be able to defend the financial numbers presented in their Departmental Plans and Departmental Results Reports.
- program (programme)
- Individual or groups of services, activities or combinations thereof that are managed together within the department and focus on a specific set of outputs, outcomes or service levels.
- program inventory (répertoire des programmes)
- An Individual, group, or combination of services and activities managed together within a department and focused on a specific set of outputs, outcomes or service levels.
- result (résultat)
- An outcome or output related to the activities of a department, policy, program or initiative.
- Indigenous business (entreprise autochtones)
- For the purpose of the Directive on the Management of Procurement Appendix E: Mandatory Procedures for Contracts Awarded to Indigenous Businesses and the Government of Canada's commitment that a mandatory minimum target of 5% of the total value of contracts is awarded to Indigenous businesses, a department that meets the definition and requirements as defined by the Indigenous Business Directory.
- statutory expenditures (dépenses législatives)
- Spending approved through legislation passed in Parliament, other than appropriation acts. The legislation sets out the purpose and the terms and conditions of the expenditures.
- target (cible)
- A quantitative or qualitative, measurable goal that a department, program or initiative plans to achieve within a specified time period.
- voted expenditures (dépenses votées)
- Spending approved annually through an appropriation act passed in Parliament. The vote also outlines the conditions that govern the spending.
- Date modified: